evidence of Polynesian-introduced crops reinterpretation ...
Upload
phungthienCategory
view
220download
0
Yang et al.: Behavior of Geotextile-Reinforced Clay in Consolidated-Undrained Tests: Reinterpretation of Porewater Pressure Parameters 45
Manuscript received November 29, 2015; revised February 22, 2016; accepted April 26, 2016.
1 Associate Professor (corresponding author), Department of Civil and Construction Engineering, National Taiwan University of Science and Technology, Taipei, Taiwan (e-mail: [email protected]. edu.tw).
2 Lecturer, Department of Soil Mechanics and Foundations, Univer-sity of Technology and Education, Ho Chi Minh City, Vietnam.
3 Lecturer, Faculty of Civil and Water Resources Engineering, Bahir Dar University, P.O. Box 26, Bahir Dar, Ethiopia.
4 Professor, Department of Civil Engineering, National Chi-Nan University, Nantou, Taiwan.
5 Project Engineer, Geosyntec Consultants, 11811N Tatum Blvd., Suite P-186, Phoenix, AZ, 85028, USA.
BEHAVIOR OF GEOTEXTILE-REINFORCED CLAY IN
CONSOLIDATED-UNDRAINED TESTS: REINTERPRETATION OF
POREWATER PRESSURE PARAMETERS
Kuo-Hsin Yang
1, Minh Duc Nguyen
2, Wubete Mengist Yalew
3, Chia-Nan Liu4, and Ranjiv Gupta5
ABSTRACT
This paper presents a series of consolidated-undrained triaxial compression tests for investigating the shear behavior of geotextile-reinforced clay and generation of excess porewater pressure during undrained loadings. Specimens were prepared at their maximum dry unit weight and optimum moisture content, and the effects of the confining pressures and the number of geotextile layers were investigated. The experimental results revealed that during consolidation, nonwoven geotextile as a permeable material reduced the time of consolidation; however, it induced a higher volume change. During undrained loading, the shear strength and excess porewater pressure of the reinforced clay increased with the number of geotextile layers because of the restraint of the lateral deformation resulting from the mobilized tensile force of reinforcement layers. Both effective and total stress failure envelopes of the reinforced clay shifted upward as the number of reinforcement layers increased and appeared to be parallel to those of the unreinforced clay. Modified porewater pressure parameters, A* and B*, for reinforced clay were proposed using the additional confinement approach. The parameters A* and B* can be used to quantitatively evaluate the influence of soil and reinforcement on excess porewater pressure generation, respectively. The A* value is close to Skempton’s porewater pressure parameter A for unreinforced soil. The B* is defined as the ratio of porewater pressure difference to additional confining pressure. The lower B* value indicates that the reinforcement is more effective in enhancing additional confining pressure than increasing excess porewater pressure. This study demonstrated that the effect of geotextile layers on inducing additional confinement was more marked than that on the generation of excess porewater pressure, resulting in an increase in effective confining pressure and subsequently in the shear strength of reinforced clay.
Key words: Geotextile-reinforced clay, porewater pressure parameter, triaxial test.
1. INTRODUCTION Backfill materials are one of the major constituents of geo-
synthetic-reinforced soil (GRS) structures and account for 30~ 40 of their cost (Christopher and Stuglis 2005; Raisinghani and Viswanadham 2011). To achieve effective performance of rein-forced earth structures, current design guidelines (Elias et al. 2001; AASHTO 2002; Berg et al. 2009; NCMA 2010) specify using free-draining granular materials as backfill materials and recommend against the use of fine-grained materials (Fig. 1). Compliant soils (Fig. 1) are backfills that comply with the design guideline criteria, whereas marginal soils are those that do not. In
addition to the gradation limits, the plasticity index of the backfill is specified (PI 6 for walls and 20 for slopes). Because margin-al backfills typically have low permeability, they are referred to as poorly draining, low-permeability, low-quality, cohesive, and fine-grained backfills.
To reduce the construction cost of GRS structures, transpor-tation cost, and environmental impact associated with the dispos-al of the excavated soil, locally available marginal soils have been used as alternative backfills. The main concern regarding the use of marginal soils as backfills is the possibility of a buildup of positive-porewater pressure, which may weaken the soil, resulting in a decrease in the soil shear strength and soil- reinforcement interface strength. However, through the accumu-lated experience and knowledge gained in both the construction and research of GRS structures with marginal backfills (Sri-dharan et al. 1991; Glendinning et al. 2005; Chen and Yu 2011; Taechakumthorn and Rowe 2012; Yang et al. 2015), these con-cerns can be appropriately alleviated by adopting suitable con-struction techniques and drainage systems. Zornberg and Mitch-ell (1994) and Mitchell and Zornberg (1995) conducted a com-prehensive review of experimental studies and case histories for evaluating the marginal soil-reinforcement interaction mecha-nism. They presented strong experimental evidence that demon-strate the effectiveness of permeable reinforcement in enhancing the performance and stability of reinforced soil structures con-structed using marginal backfills.
Journal of GeoEngineering, Vol. 11, No. 2, pp. 45-57, August 2016 http://dx.doi.org/10.6310/jog.2016.11(2).1

46 Journal of GeoEngineering, Vol. 11, No. 2, August 2016
Fig. 1 Grain size distribution of backfill in GRS structures as recommended by design guidelines and tested clay in this study
Triaxial compression tests have been conducted to investi-gate the responses of reinforced marginal soils under drained and undrained conditions (Ingold 1983; Ingold and Miller 1982, 1983; Fabian and Foure 1986; Fourier and Fabian 1987; Al- Omari et al. 1989; Indraratna et al. 1991; Unnikrishnan et al. 2002; Noorzad and Mirmoradi 2010; Jamei et al. 2013; Mir-zababaei et al. 2013; Yang et al. 2015). Ingold and Miller (1982) conducted undrained triaxial tests on kaolin clay reinforced using impermeable aluminum foils and permeable porous plastics and reported that permeable reinforcement exhibited higher perfor-mance than impermeable reinforcement did in improving the shear strength of reinforced clay. For clay reinforced with im-permeable aluminum foils, the undrained shear strength was sub-stantially less than that of an unreinforced sample, because im-permeable reinforcement obstructed the migration of pore pres-sure inside the specimen in which high excess porewater pressure developed and accumulated at the clay-reinforcement interface, resulting in premature failure along the interface, which in turn caused the failure of the reinforced specimen. They observed that although the permeable reinforcement enhanced the shear strength of reinforced clay, it induced higher porewater pressure during undrained loadings. Ingold and Miller (1982) modified Skempton’s porewater pressure parameter A to determine the effect of reinforcement on the generation of porewater pressure and shear strength improvement.
Fabian and Fourie (1986) evaluated the influence of the permeability of the reinforcing material on the undrained shear strength of reinforced clay through unconsolidated-undrained (UU) triaxial tests and found that high-permeable reinforcements increase the undrained shear strength of the reinforced clay by almost 40whereas low-permeable reinforcements can decrease the undrained strength by a similar amount. They ob-
served that the permeability of reinforcement influenced water migration and moisture distribution within specimens, resulting in their differential effects on clay-reinforcement interaction.
Al-Omari et al. (1989) performed consolidated-undrained (CU) and consolidated-drained (CD) triaxial tests to investigate the response of clay reinforced with geomesh. The results re-vealed that the failure of overconsolidated geomesh-reinforced clay was due to progressively developed slippage at the clay- geomesh interface. The excess porewater pressure developed in the reinforced clay was higher than that in the unreinforced clay, and this pressure increased with the number of reinforcement layers. Noorzad and Mirmoradi (2010), Mirzababaei et al. (2013), and Yang et al. (2015) conducted unconfined compression and UU tests on reinforced clay and reported that inclusion of per-meable reinforcement into clay can considerably enhance the peak soil shear strength, reduce postpeak strength loss, and change the failure behavior from brittle to ductile. The shear strength of the reinforced specimen was affected by the soil plas-ticity index, compaction conditions (i.e., moisture content and relative compaction), and number of reinforcement layers.
In the study of reinforced marginal backfill, an important question to answer is what the porewater pressure generation within reinforced structures is during construction and loadings (Fig. 2). The key to this question is to determine the relationship between porewater pressure and the applied loadings. The as-sessment of porewater pressure generation and its relation to the shear strength improvement of reinforced clay is crucial for ana-lyzing the effectiveness and suitability of applying reinforcement to marginal backfill. Therefore, in this study, a series of CU tri-axial tests were performed on reinforced clay with nonwoven geotextile. The objective of these tests were threefold: (1) to in-vestigate the shear response of clay reinforced with different number of reinforcement layers under undrained loadings; (2) to investigate the generation of excess porewater pressure and its relation to the shear strength of reinforced clay; and (3) propose a modified porewater pressure parameter for assessing the effect of reinforcement on porewater pressure generation and soil shear improvement. Based on the concept of reinforcement-induced additional confinement, this paper explains the counterintuitive observation reported in the literature that permeable reinforce-ment enhances the shear strength of reinforced clay but induces higher porewater pressure under undrained conditions. The re-sults and discussion in this paper are useful for more clearly un-derstanding the shear behavior and porewater pressure generation of reinforced clay.
2. EXPERIMENTAL PROGRAM
Twelve CU triaxial compression tests were performed at different effective consolidation pressures (3,con 50, 100, and 200 kPa) and various numbers of geotextile layers (unreinforced and 1 ~ 3 layers). The undrained test conditions were selected to simulate the behavior of cohesive soils subject to undrained loadings (relative to the time required for the dissipation of porewater pressure of cohesive soils) after construction. Several experimental tests performed to determine the index and engi-neering properties of the tested clay and nonwoven geotextile are described in this section.
Fine Medium Coarse
Sand Silt and Clay Gravel
Grain size (mm)
Per
cent
fin
er b
y w
eigh
t (%
)

Yang et al.: Behavior of Geotextile-Reinforced Clay in Consolidated-Undrained Tests: Reinterpretation of Porewater Pressure Parameters 47
Fig. 2 Illustration of porewater pressure generation in
reinforced structures with marginal backfill
2.1 Test Materials
2.1.1 Clay
Clay soil obtained from Maokong area, southeast mountain region of Taipei, Taiwan, was used in this study. Figure 1 shows the grain size distribution of tested soil based on ASTM D422. Table 1 summarizes properties of the clay. This clay is classified as low-plasticity clay (CL) by the Unified Soil Classification System with specific gravity, Gs 2.72, liquid limit, LL 42, plastic limit, PL 21, and plasticity index, PI 21. The optimum moisture content and maximum dry unit weight determined from standard proctor compaction (ASTM D698) are opt 19.2 and d,max 15.1 kN/m3, respectively (Fig. 3). The saturated hydraulic conductivity estimated using Terzaghi’s 1-D consolidation theory is ksat 1.3 1010 m/s. The total and effective shear strength parameters for clay were c 57.6 kPa; 15.3 and c 10.7 kPa; 29.2, respectively. The determination of shear strength parameters obtained from the CU tests is discussed later.
2.1.2 Geotextile
A commercially available needle-punched PET nonwoven geotextile was used. Table 2 summarizes properties of the tested nonwoven geotextile. The load-elongation behavior of the rein-forcement was obtained by wide-width tensile tests (ASTM D4595) in the longitudinal and transverse directions (Fig. 4). The tensile test results indicate that the geotextile is an anisotropic tensile material; the tensile strength and stiffness of the geotextile in the longitudinal direction (i.e., the stronger and stiffer direc-tion) were larger than those in the transverse direction (i.e., the weaker and softer direction). Based on permittivity test results (ASTM D4491), this geotextile has a permittivity 1.96 s1 and the corresponding cross-plane permeability of k 3.5 103 m/s. The permeability of the nonwoven geotextile is several or-ders of magnitude higher than the permeability of the clay used in this study; therefore, the nonwoven geotextile could be con-sidered a permeable material.
2.2 Specimen Preparation
A natural clay sample brought from a local site in the form of wet bulk was placed in an oven for a minimum of 24 h and then crushed and ground into dry powder in a mortar. Accurately measured quantities of dry powder soil and water corresponding to optimum moisture content were mixed together, placed in a plastic bag within a temperature-controlled chamber and sealed for a minimum of 2 days to ensure a uniform distribution of moisture within the soil mass. The moisture content was verified to ensure that the variation of moisture content was less than 1.
Table 1 Properties of the tested clay
Properties Value
Unified soil classification system CL
Fine content () 67.6
Specific gravity, Gs 2.70
Liquid Limit, LL () 42
Plastic Limit, PL () 21
Plasticity Index, PI () 21
Optimum moisture content, opt () 19.2
Maximum dry density, d,max (kN/m3) 15.1
Total cohesion, c (kPa) 59.3
Total friction angle, () 15.6
Effective cohesion, c (kPa) 11
Effective friction angle, () 29.7
Saturated hydraulic conductivity, ksat (m/s) 1.3 1010
Table 2 Properties of the nonwoven geotextile
Properties Value
Mass (g/m2) 200
Thickness, t (mm) 1.78
Apparent opening size, AOS (mm) 0.11
Permittivity, (s1) 1.96
Cross-plane permeability, k (m/s) 3.5 103
Ultimate tensile strength, Tult (kN/m) 9.28 and 7.08
Failure strain () 84.1 and 117.8
Secant stiffness at peak value (kN/m) 11.03 and 6.01
Note: The thickness was measured according to ASTM D5199. The first and second values of tensile properties correspond to the test results in longitu-dinal and transverse directions, respectively.
Fig. 3 Standard compaction curve of the tested clay
u = ?
Moisture content, (%)
Dry
uni
t wei
ght, d
(kN
/m3 )

48 Journal of GeoEngineering, Vol. 11, No. 2, August 2016
Fig. 4 Tensile load-elongation response of nonwoven geotextile
The test specimens with a diameter of 50 mm and a height of 100 mm were prepared. For the unreinforced specimens, the clay was compacted in five layers. Each layer was initially lightly tamped to avoid any honeycombs within the samples. The sam-ples were then statically compressed to the required thickness by a static hydraulic jack.
For the reinforced clay specimens, the split mold was filled with clay in several layers, depending on the arrangement of the geotextile layers (Fig. 5). After each clay layer was compacted and leveled, the clay surface was scarified prior to adding the overlying geotextile layer and the next soil layer for developing favorable interface bonding with the overlying material. The reinforcement was then placed horizontally, and the amount of soil for the next layers was poured and compacted. This proce-dure was repeated until specimen preparation was completed.
2.3 Test Procedure
CU triaxial tests were conducted according to the ASTM D4767. The prepared specimen was placed in a triaxial cell and saturated by allowing de-aired water to flow through the system. A back pressure was applied to facilitate the saturation of the soil specimen in which the difference between the back and chamber pressures was maintained lower than 25 kPa. Skempton’s porewater pressure coefficient B was monitored during saturation until its value exceeded 0.95. Three effective consolidation pres-sures (3,con 50, 100, and 200 kPa) were applied in the test program. The volume change in specimens with time was rec-orded to calculate the time for 50 of the primary consolidation t50. After the consolidation phase was complete, the specimens were loaded axially under an undrained condition at a strain rate , determined as follows:
5010f
t
(1)
where f is the strain at failure. The calculated average strain rates were 0.035 ~ 0.060 /min for specimens with various rein-forcement arrangements (Table 3). These applied strain rates can produce approximate equalization of porewater pressures through
Fig. 5 Reinforcement arrangement and failure pattern of clay
specimens for CU triaxial tests: (a) Unreinforced; (b) 1 layer; (c) 2 layers; (d) 3 layers
Table 3 Time for 50 of volume change under consolidation process
3,con (kPa) t50 (sec)
Unreinforced 1 layer 2 layers 3 layers
50 1802 1498 1254 1012
100 1602 1449 1210 973
200 1452 1348 1156 925
Average strain rate (/min) 0.035 0.040 0.050 0.060
the specimen, thus permitting the accurate measurement of porewater pressure and determination of effective stress envelope. All tests were completed when the axial strain of the reinforced soil reached 20. The repeatability and consistency of the test results were carefully examined by conducting a few tests on the reinforced clay under the same conditions.
3. RESULTS AND DISCUSSION
The experimental results from the consolidation and un-drained loading phases are presented and discussed here.
3.1 Volume Change with Time in the Consolidation Phase
The variations in volume change V with time of the unre-inforced and reinforced specimens in the consolidation phase were recorded (Fig. 6). The volume for all the specimens de-creased (positive value of V in Fig. 6 indicates compression) as the porewater dissipated until equilibrium was reached (i.e., complete consolidation). The consolidation results indicated that the nonwoven geotextile facilitates porewater dissipation by re-ducing the vertical drainage path within the specimen. The time required time to reach t50 decreases as the number of reinforce-ment layers or 3,con increases. The permeable reinforcement is more influential than 3,con is on t50 reduction. As shown in Table 3, when the number of reinforcement layers was doubled, the
Tensile strain, (%)
Tens
ile
forc
e, T
(kN
/m)
Yang et al.: Behavior of Geotextile-Reinforced Clay in Consolidated-Undrained Tests: Reinterpretation of Porewater Pressure Parameters 49
(a) 3,con 50 kPa
(b) 3,con 100 kPa
(c) 3,con 200 kPa
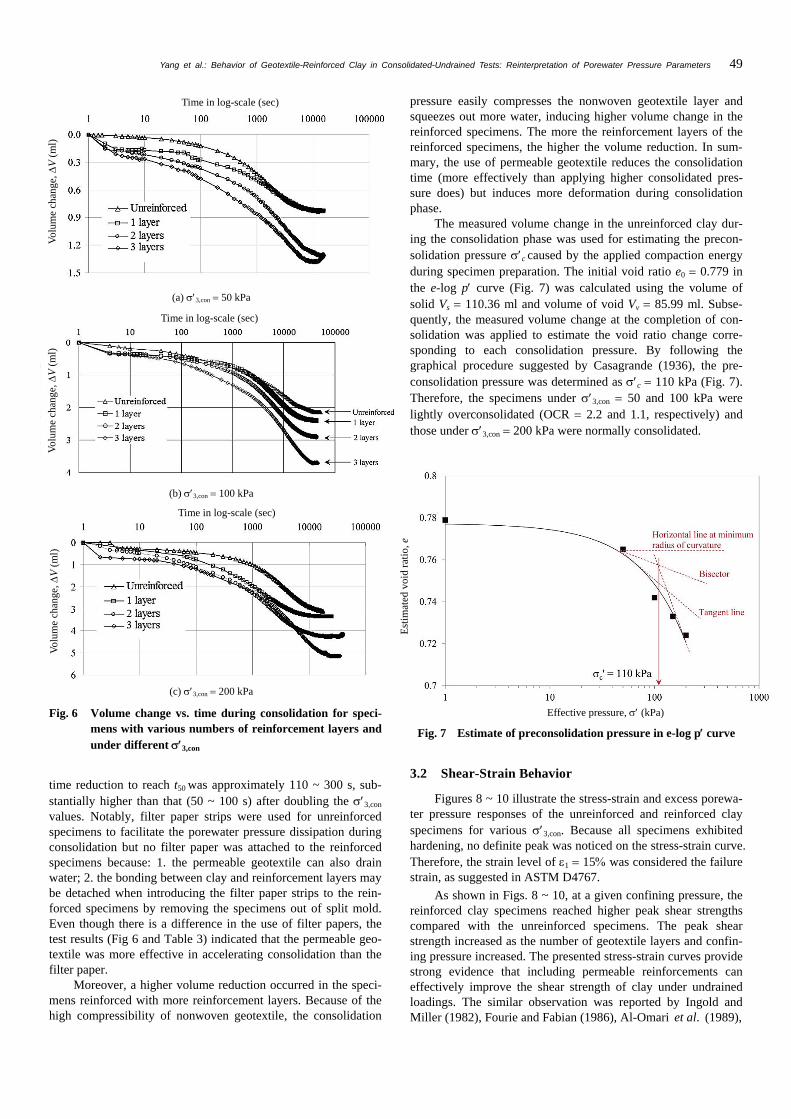
Fig. 6 Volume change vs. time during consolidation for speci-mens with various numbers of reinforcement layers and under different 3,con
time reduction to reach t50 was approximately 110 ~ 300 s, sub-stantially higher than that (50 ~ 100 s) after doubling the 3,con
values. Notably, filter paper strips were used for unreinforced specimens to facilitate the porewater pressure dissipation during consolidation but no filter paper was attached to the reinforced specimens because: 1. the permeable geotextile can also drain water; 2. the bonding between clay and reinforcement layers may be detached when introducing the filter paper strips to the rein-forced specimens by removing the specimens out of split mold. Even though there is a difference in the use of filter papers, the test results (Fig 6 and Table 3) indicated that the permeable geo-textile was more effective in accelerating consolidation than the filter paper.
Moreover, a higher volume reduction occurred in the speci-mens reinforced with more reinforcement layers. Because of the high compressibility of nonwoven geotextile, the consolidation
pressure easily compresses the nonwoven geotextile layer and squeezes out more water, inducing higher volume change in the reinforced specimens. The more the reinforcement layers of the reinforced specimens, the higher the volume reduction. In sum-mary, the use of permeable geotextile reduces the consolidation time (more effectively than applying higher consolidated pres-sure does) but induces more deformation during consolidation phase.
The measured volume change in the unreinforced clay dur-ing the consolidation phase was used for estimating the precon-solidation pressure c caused by the applied compaction energy during specimen preparation. The initial void ratio e0 0.779 in the e-log p curve (Fig. 7) was calculated using the volume of solid Vs 110.36 ml and volume of void Vv 85.99 ml. Subse-quently, the measured volume change at the completion of con-solidation was applied to estimate the void ratio change corre-sponding to each consolidation pressure. By following the graphical procedure suggested by Casagrande (1936), the pre-consolidation pressure was determined as c 110 kPa (Fig. 7). Therefore, the specimens under 3,con 50 and 100 kPa were lightly overconsolidated (OCR 2.2 and 1.1, respectively) and those under 3,con 200 kPa were normally consolidated.
Fig. 7 Estimate of preconsolidation pressure in e-log p curve
3.2 Shear-Strain Behavior
Figures 8 ~ 10 illustrate the stress-strain and excess porewa-ter pressure responses of the unreinforced and reinforced clay specimens for various 3,con. Because all specimens exhibited hardening, no definite peak was noticed on the stress-strain curve. Therefore, the strain level of 1 15 was considered the failure strain, as suggested in ASTM D4767.
As shown in Figs. 8 ~ 10, at a given confining pressure, the reinforced clay specimens reached higher peak shear strengths compared with the unreinforced specimens. The peak shear strength increased as the number of geotextile layers and confin-ing pressure increased. The presented stress-strain curves provide strong evidence that including permeable reinforcements can effectively improve the shear strength of clay under undrained loadings. The similar observation was reported by Ingold and Miller (1982), Fourie and Fabian (1986), Al-Omari et al. (1989),
Est
imat
ed v
oid
rati
o, e
Effective pressure, (kPa)
Time in log-scale (sec)
Vol
ume
chan
ge,
V (
ml)
Time in log-scale (sec)
Vol
ume
chan
ge,
V (
ml)
Time in log-scale (sec)
Vol
ume
chan
ge,
V (
ml)

50 Journal of GeoEngineering, Vol. 11, No. 2, August 2016
(a) Stress-strain response
(b) Excess porewater pressure-strain response
Fig. 8 Stress-strain and excess porewater pressure responses of clay specimens at 3,con 50 kPa
Athanasopoulos (1993), and Unnikrishnan et al. (2002). The reinforcing mechanism is attributed to the mobilized tensile force in geotextile layers through soil-reinforcement interaction. By experimentally inspecting the mobilized tensile strain of rein-forcement, Nguyen et al. (2013) and Yang et al. (2015) demon-strated a direct and linear relationship between the mobilized reinforcement tensile strain/load and shear strength improvement of reinforced soil.
A minor difference was observed between the d values of the unreinforced and reinforced clay specimens at low strain levels (approximately for 1 3), indicating that the geotextile rein-forcement requires sufficient deformation to mobilize its tensile force, which then contributes to the overall shear strength improvement of the reinforced soil. The effects of reinforcement were activated (i.e., the mobilized shear strength of the reinforced soil exceeded that of the unreinforced soil) under an axial strain of approximately up to 3. This finding is consistent with the obser-vations from the test results of reinforced sand (Nguyen et al. 2013) and reinforced clay (Fourie and Fabian 1987; Al-Omari et al. 1989; Unnikrishnan et al. 2002; Noorad and Mirmoradi 2010).
(a) Stress-strain response
(b) Excess porewater pressure-strain response
Fig. 9 Stress-strain and excess porewater pressure responses of clay specimens at 3,con 100 kPa
3.3 Excess Porewater Pressure
Figures 8 ~ 10 illustrate the excess porewater pressure re-sponses of the unreinforced and reinforced clay for various 3,con. For all specimens, the porewater pressure initially increased, peaked at approximately 1 1 ~ 3, and then decreased gradually. At a low axial strain level, the compression of clay specimens sub-ject to loadings increased the porewater pressure. After reaching a certain threshold of axial deformation (1 1 ~ 3%), the specimens began to dilate, inducing the decrease in porewater pressure. For the specimens under 3,con 50 and 100 kPa (lightly overconsoli-dated specimens as discussed in Section 3.1), a negative porewater pressure was generated at a high strain level.
The influence of reinforcement on the porewater pressure depends on the strain level. To justify this statement, the values of porewater pressure u and porewater pressure difference ur between the reinforced and unreinforced specimens at 1 2 (i.e., the average axial strain for the peak porewater pressure) and 15 (i.e., at limit state) were calculated and are listed in Table 4. At 1 2, a clear increasing or decreasing trend of u and ur with an increase in the number of reinforcement layers is not
0
100
200
300
400
0 4 8 12 16 20
3 layers
2layers
1layer
Unreinforced
Dev
iato
ric
Str
ess,
d
(kP
a)
Axial Strain, 1 (%)
-50
-40
-30
-20
-10
0
10
20
30
40
50
0 5 10 15 20
Exc
ess
Por
ewat
er P
ress
ure,
u, (
kPa)
Axial Strain, 1 (%)
(a) Stress-strain response
0
100
200
300
400
500
0 4 8 12 16 20
3 layers
2layers
1layer
Unreinforced
Dev
iato
ric
Str
ess,
d
(kP
a)
Axial Strain, 1 (%)
-40
-20
0
20
40
60
80
100
0 4 8 12 16 20
Exc
ess
Por
ewat
erP
ress
ure,
u, (
kPa)
Axial Strain, 1 (%)
(a) Stress-strain response
Dev
iato
ric
stre
ss,
d (k
Pa)
Axial strain, 1 (%)
Exc
ess
pore
wat
er p
ress
ure,
u (
kPa)
Axial strain, 1 (%)
Dev
iato
ric
stre
ss,
d (k
Pa)
Axial strain, 1 (%)
Exc
ess
pore
wat
er p
ress
ure,
u (
kPa)
Axial strain, 1 (%)

Yang et al.: Behavior of Geotextile-Reinforced Clay in Consolidated-Undrained Tests: Reinterpretation of Porewater Pressure Parameters 51
(a) Stress-strain response
(b) Excess porewater pressure-strain response
Fig. 10 Stress-strain and excess porewater pressure responses of clay specimens at 3,con 200 kPa
observed. By contrast, at 1 15, u and ur exhibit a consistent increasing trend with an increase in the number of reinforcement layers. In other words, the excess porewater pressure developed in the reinforced clay at failure was higher than that in the unre-inforced clay, and it increased with the number of reinforcement layers.
As discussed previously, the effects of reinforcement were activated under an axial strain of approximately 3. Therefore, at 1 2, the required deformation was insufficient to activate the effect of reinforcement; the generation of porewater pressure appears to be independent of the presence of reinforcement layers. At 1 15, the effect of reinforcement has been already acti-vated at such a considerably high strain level. The mobilized tensile force restrained the lateral deformation of clay and thus prevented the clay from dilating. This effect became more marked as the number of reinforcement layers increased. There-fore, a clear increasing trend of u and ur with an increase in the reinforcement layers was observed (Table 4). This observation was supported by the experimental results reported by Ingold (1983), Ingold and Miller (1982), and Al-Omari et al. (1989).
Table 4 Generation of excess porewater pressure of unrein-forced and reinforced clay at 1 2 and 15 under different 3,con values
1 2 1 15
Cases u (kPa) ur (kPa) u (kPa) ur (kPa)
3,con 50 kPa
Unreinforced 17.2 0 24.4 0
1 layer 28.8 11.6 15.8 8.6
2 layers 31.7 14.5 6.7 17.7
3 layers 40.9 23.7 2.5 26.9
3,con 100 kPa
Unreinforced 46.0 6.0 0
1 layer 60.6 14.7 19.6 25.6
2 layers 63.4 17.5 32.1 38.1
3 layers 59.8 13.8 52.8 58.8
3,con 200 kPa
Unreinforced 113.9 0 68.2 0
1 layer 105.4 8.5 81.0 12.8
2 layers 110.1 3.8 102.5 34.3
3 layers 98.5 15.4 118.7 50.5
Both the shear strength and excess porewater pressure of the
reinforced clay increased as the number of reinforcement layers increased. Unexpectedly, the higher shear strength improvement was associated with higher porewater pressure under undrained loadings. These results appear to be the reverse of what would be expected. As a result, the inclusion of reinforcement layers must have caused an increase in the total confining pressure, 3, which is higher than the porewater pressure difference at failure ur by an amount of effective confining pressure 3. Subse-quently, the increase in 3 caused the shear strength improve-ment of the reinforced clay. This observation is explained in Sec-tion 4. A modified porewater pressure parameter, based on the concept of additional confinement induced by geotextile layers, was proposed to evaluate the effect of reinforcement on porewa-ter pressure generation and its relation with soil shear improve-ment.
3.4 Failure Pattern
Figure 5 shows typical images of the unreinforced and rein-forced specimens after the tests. The unreinforced specimen failed after bulging at its middle. The reinforced clay specimens (Fig. 5(b) ~ 5(d)) failed when bulging occurred between two ad-jacent reinforcement layers. The inclusion of reinforcement re-strained the lateral displacement of soil near the reinforced area and consequently, larger soil displacement occurred between two adjacent reinforcement layers. As the number of geotextile layers was increased (i.e., the shorter vertical reinforcement space), the deformation became comparatively uniform (less bulging). The uniform deformation of a specimen suggested that the mobilized
Dev
iato
ric
stre
ss,
d (k
Pa)
Axial strain, 1 (%)
Exc
ess
pore
wat
er p
ress
ure,
u (
kPa)
Axial strain, 1 (%)

52 Journal of GeoEngineering, Vol. 11, No. 2, August 2016
stresses were redistributed evenly within the soil, thus enhanced the shear strength of the reinforced soil. A similar behavior of the reinforced specimens was reported by Nguyen et al. (2013), Hae-ri et al. (2000), and Khedkar and Mandal (2009) for reinforced sand and Fourie and Fabian (1986) for reinforced clay. Posttest examinations by retrieving geotextile from the dismantled spec-imens revealed that geotextile was intact (no rupture) at an axial strain of 20% at test completion.
3.5 Failure Envelope and Stress Path
Figure 11 exhibits the total and effective stress failure enve-lopes of the unreinforced and reinforced clay in the p-q diagram (MIT stress path approach). As the number of reinforcement lay-ers increased, the failure envelopes of the reinforced specimens shifted upward, and both effective and total stress envelopes ap-peared to be parallel to those of the unreinforced clay. The cohe-sion intercept increased, whereas the angle of internal friction was not altered. Figure 11 also presents the effective and total stress shear strength parameters. The results for failure envelopes in this study are consistent with those for triaxial tests by Gray and Al-Refeai (1986) and Haeri et al. (2000) for reinforced sand and Noorzad and Mirmoradi (2010) and Al-Omari et al. (1989) for reinforced clay under undrained conditions.
The contribution of reinforcement on shear strength im-provement can be explained using the concept of apparent cohe-sion as adding an apparent cohesion to the unreinforced soil (Schlosser and Long 1974; Hausmann 1976; Bathurst and Karpurapu 1993) or using the concept of additional confinement as an increase in the effective confining pressure (Ingold and Miller 1983; Chandrasekaran et al. 1989; Wu and Hong 2008). In the apparent cohesion concept, the contribution of nonwoven geotextile to shear strength improvement can be attributed to an increase in the apparent cohesion of the reinforced clay (as the parallel failure envelopes shown in Fig. 11). For the additional confinement concept, reinforced soil at the limit state is assumed to have the same effective principal stress relationship (i.e., the same failure envelope) as unreinforced soil does:
21 3 3( ) tan 45 2 tan 45
2 2add c
(2)
where 1 is the effective axial stress of the reinforced soil at failure, 3 and 3add are the effective confining pressure of the unreinforced soil at failure and effective additional confining pressure induced by reinforcement, and and c are the effective friction angle and cohesion of the unreinforced soil.
Therefore, 3add can be estimated as
23 1 3tan 45 2 tan 45
2 2add c
(3-1)
or
3 1 32add a aK c K (3-2)
where Ka is the active earth pressure coefficient. The 3add in Eq. (3) is the accumulated additional confining pressure at failure. To trace the stress path, the development of effective additional con-fining pressure was assumed to be proportional to the mobiliza-tion of the soil shear strength. In addition, an increase in effective
(a) Total stress envelope
(b) Effective stress envelope
Fig. 11 Failure envelope: (a) total stress envelope; (b) effective stress envelope
additional confining pressure 3add was associated with an en-hanced porewater pressure ur relative to the porewater pressure of the unreinforced soil. ur is the porewater pressure difference between the reinforced and unreinforced soil and can be per-ceived as the porewater pressure induced exclusively by the ef-fect of reinforcement. The total additional confining pressure 3add at the soil limit state can be calculated as follows:
3 3add add ru (4)
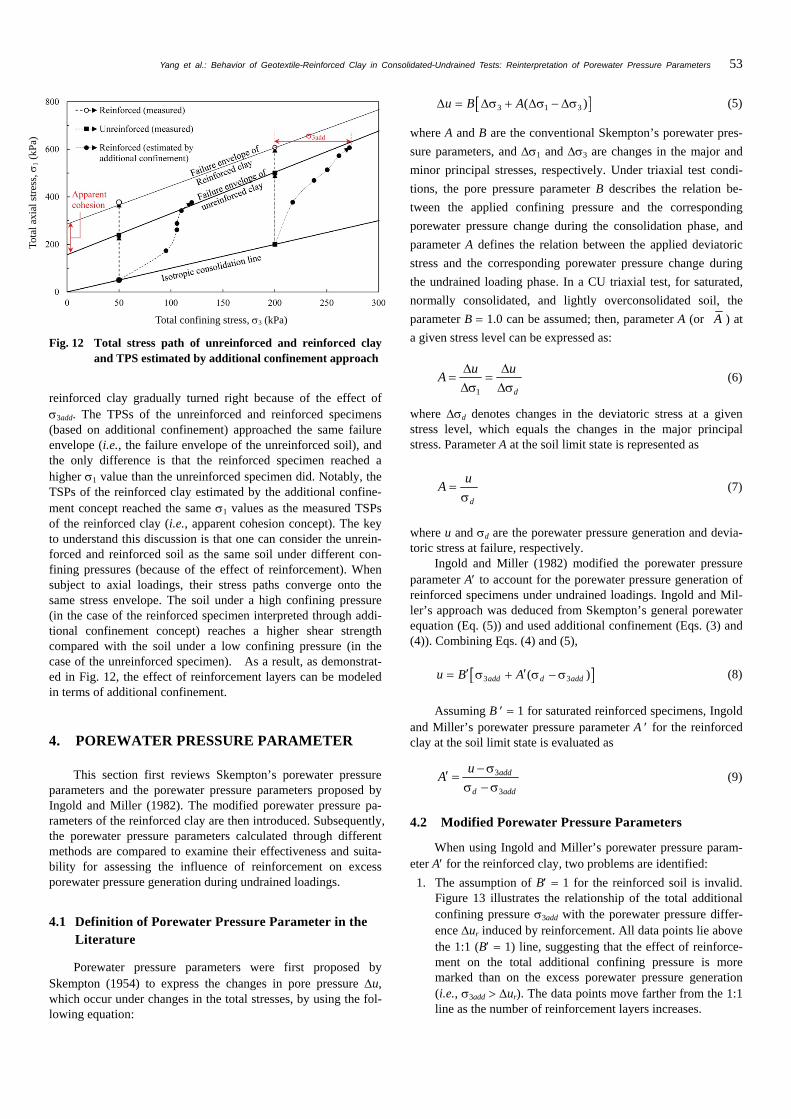
Figure 12 illustrates the total stress paths (TSPs) in the prin-cipal space for the unreinforced and reinforced clay with three nonwoven geotextile layers under 3,con 50 and 200 kPa. As shown in Fig. 12, all the stress paths initiate at the isotropic con-solidation line. The TSPs of the unreinforced clay rose straightly up and reached the unreinforced failure envelope. The TSPs of the reinforced clay also increased and reached the reinforced failure envelope at a 1 higher than that of the unreinforced clay. The difference between the unreinforced and reinforced failure envelopes can be attributed to the apparent cohesion induced by the inclusion of the reinforcement layers.
When applying the additional confinement concept to rein-forced clay, the total confining pressure increases when consid-ering 3add derived from Eq. (4). The estimated TPS of the
Yang et al.: Behavior of Geotextile-Reinforced Clay in Consolidated-Undrained Tests: Reinterpretation of Porewater Pressure Parameters 53
Fig. 12 Total stress path of unreinforced and reinforced clay and TPS estimated by additional confinement approach
reinforced clay gradually turned right because of the effect of 3add. The TPSs of the unreinforced and reinforced specimens (based on additional confinement) approached the same failure envelope (i.e., the failure envelope of the unreinforced soil), and the only difference is that the reinforced specimen reached a higher 1 value than the unreinforced specimen did. Notably, the TSPs of the reinforced clay estimated by the additional confine-ment concept reached the same 1 values as the measured TSPs of the reinforced clay (i.e., apparent cohesion concept). The key to understand this discussion is that one can consider the unrein-forced and reinforced soil as the same soil under different con-fining pressures (because of the effect of reinforcement). When subject to axial loadings, their stress paths converge onto the same stress envelope. The soil under a high confining pressure (in the case of the reinforced specimen interpreted through addi-tional confinement concept) reaches a higher shear strength compared with the soil under a low confining pressure (in the case of the unreinforced specimen). As a result, as demonstrat-ed in Fig. 12, the effect of reinforcement layers can be modeled in terms of additional confinement.
4. POREWATER PRESSURE PARAMETER
This section first reviews Skempton’s porewater pressure parameters and the porewater pressure parameters proposed by Ingold and Miller (1982). The modified porewater pressure pa-rameters of the reinforced clay are then introduced. Subsequently, the porewater pressure parameters calculated through different methods are compared to examine their effectiveness and suita-bility for assessing the influence of reinforcement on excess porewater pressure generation during undrained loadings.
4.1 Definition of Porewater Pressure Parameter in the Literature
Porewater pressure parameters were first proposed by Skempton (1954) to express the changes in pore pressure u, which occur under changes in the total stresses, by using the fol-lowing equation:
3 1 3( )u B A (5)
where A and B are the conventional Skempton’s porewater pres-
sure parameters, and 1 and 3 are changes in the major and
minor principal stresses, respectively. Under triaxial test condi-
tions, the pore pressure parameter B describes the relation be-
tween the applied confining pressure and the corresponding
porewater pressure change during the consolidation phase, and
parameter A defines the relation between the applied deviatoric
stress and the corresponding porewater pressure change during
the undrained loading phase. In a CU triaxial test, for saturated,
normally consolidated, and lightly overconsolidated soil, the
parameter B 1.0 can be assumed; then, parameter A (or A ) at
a given stress level can be expressed as:
1 d
u uA
(6)
where d denotes changes in the deviatoric stress at a given stress level, which equals the changes in the major principal stress. Parameter A at the soil limit state is represented as
d
uA
(7)
where u and d are the porewater pressure generation and devia-toric stress at failure, respectively.
Ingold and Miller (1982) modified the porewater pressure parameter A to account for the porewater pressure generation of reinforced specimens under undrained loadings. Ingold and Mil-ler’s approach was deduced from Skempton’s general porewater equation (Eq. (5)) and used additional confinement (Eqs. (3) and (4)). Combining Eqs. (4) and (5),
3 3( )add d addu B A (8)
Assuming B 1 for saturated reinforced specimens, Ingold and Miller’s porewater pressure parameter A for the reinforced clay at the soil limit state is evaluated as
3
3
add
d add
uA
(9)
4.2 Modified Porewater Pressure Parameters
When using Ingold and Miller’s porewater pressure param-eter A for the reinforced clay, two problems are identified:
1. The assumption of B 1 for the reinforced soil is invalid. Figure 13 illustrates the relationship of the total additional confining pressure 3add with the porewater pressure differ-ence ur induced by reinforcement. All data points lie above the 1:1 (B 1) line, suggesting that the effect of reinforce-ment on the total additional confining pressure is more marked than on the excess porewater pressure generation (i.e., 3add ur). The data points move farther from the 1:1 line as the number of reinforcement layers increases.
Tota
l axi
al s
tres
s,
1 (k
Pa)
Total confining stress, 3 (kPa)

54 Journal of GeoEngineering, Vol. 11, No. 2, August 2016
Fig. 13 Comparison between porewater pressure difference ur and total additional confining pressure 3add for rein-forced clay under undrained loadings
2. The effects of soil, stress history (OCR), and reinforcement on excess porewater pressure generation are combined in Ingold and Miller’s porewater pressure parameter A. Therefore, distinguishing the influence of soil and rein-forcement separately becomes difficult, making it impossi-ble to assess the effect of reinforcement on porewater pres-sure generation. Accordingly, this study proposed two modified porewater
pressure parameters, A* and B*, for the reinforced clay to more efficiently quantify the influence of soil and reinforcement on excess porewater pressure generation during undrained loadings.
The modified porewater pressure parameter B* is defined as
*
3
r
add
uB
(10)
where ur is the porewater pressure difference between the unre-inforced and reinforced specimens. Specifically, the parameter B* reflects the influence of reinforcement on the enhanced additional confining pressure and porewater pressure difference. The B* value is typically less than 1.0 (i.e., 3add ur) for permeable reinforcement and a smaller B* value indicates the higher effec-tive additional confining pressure 3add developed inside the specimens, resulting in higher shear strength improvement of the reinforced clay.
The modified porewater pressure parameter A* is expressed as
*
3
r
d add
u uA
(11)
where u is the excess porewater pressure of the reinforced clay at failure. The modified porewater pressure parameter A* is similar to that defined in Ingold and Miller’s method with B replaced by B* in Eq. (8) to avoid assuming the B value (B 1.0 assumed in Ingold and Miller’s method). The effect of reinforcement was intentionally removed by subtracting ur and 3add in the numer-
ator and denominator of Eq. (11); the modified porewater pres-sure parameter A* can solely reflect the effect of soil on porewa-ter pressure generation. Therefore, the influence of the soil and reinforcement can be separated using the proposed parameters A* and B*.
4.3 Comparison of Porewater Pressure Parameters
Table 5 summarizes the porewater pressure parameter val-ues calculated through different methods. In Skempton’s method, A values for unreinforced specimens vary from 0.13 to 0.23 for 3,con in the range 50 ~ 200 kPa. This variation in A values for the unreinforced soil is associated with the overconsolidation ratio, as discussed in Section 3.1. For the reinforced specimen, the calculated A value at a given 3,con increases as the number of reinforcement layers increases. The observed increasing trend may create a misunderstanding that the influence of reinforce-ment on porewater pressure generation is more marked than that on soil shear strength improvement. This confusion is because the effect of additional confining pressure induced by reinforce-ment is not considered in Skempton’s porewater pressure param-eter A as it was originally developed for unreinforced soil. Therefore, it is inappropriate to interpret the porewater pressure generation of reinforced specimens using Skempton’s method.
In Ingold and Miller’s method, the value of porewater pres-sure A decreases as the number of reinforcement layers increases. These analytical results agree with the A trend reported by In-gold and Miller (1982) for the tests on clay reinforced through porous plastic during CU tests. However, as discussed previously, the effects of soil and reinforcement on excess porewater pres-sure generation are not separated appropriately in Ingold and Miller’s method; therefore, it becomes difficult to assess the sole effect of reinforcement on porewater pressure generation and its relationship with shear strength improvement. As shown in Table 5, the A values vary not only with different reinforcement layers but also with different 3,con, suggesting that both soil and rein-forcement can affect the A value.
Table 5 and Fig. 14 list the results of the modified porewater pressure parameters A* and B* estimated through the proposed method. A* depends on the soil stress history (i.e., 3,con value) and not on the reinforcement layers. As shown in Fig. 14, only a small variation in A* is observed when increasing the number of reinforcement layers (or reducing the reinforcement spacing), demonstrating that the modified parameter A* can exclude the effect of reinforcement and solely reflect the effect of soil on porewater pressure generation.
The values of the modified porewater pressure parameter B* range from 0.4 to 0.9 and decrease consistently with increase in reinforcement layers, regardless of 3,con (Fig. 14(b)). The lower B* value indicates that the reinforcement is more effective in enhancing 3add than increasing ur (i.e., 3add ur); therefore, a higher effective additional confining pressure is developed inside the specimens, resulting in higher shear strength improvement of the reinforced clay. This statement is supported by the result that the soil shear strength increases as the number of reinforcement layers increases. The data in Table 5 and Fig. 14(b) prove that the B* can be used to effectively quantify the effect of reinforcement on porewater pressure generation and its relationship with soil shear strength improvement.
Tota
l add
itio
nal c
onfi
ning
pre
ssur
e,
3add
(kP
a)
Porewater pressure difference, ur (kPa)

Yang et al.: Behavior of Geotextile-Reinforced Clay in Consolidated-Undrained Tests: Reinterpretation of Porewater Pressure Parameters 55
Table 5 Comparison of porewater pressure parameters by different methods
Cases d (kPa)
u (kPa)
ur (kPa)
3add (kPa)
Skempton’s method
Ingold and Miller’s method Proposed method
A A' A* B*
3,con 50 kPa
Unreinforced 188.5 24.4 0 0 0.13 0.13 0.13 N/A
1 layer 207.3 15.8 8.6 12.1 0.08 0.14 0.13 0.71
2 layers 243.8 6.7 17.7 30.6 0.03 0.18 0.11 0.58
3 layers 327.1 2.5 26.9 65.3 0.01 0.24 0.10 0.41
3,con 100 kPa
Unreinforced 220 6 0 0 0.03 0.03 0.03 N/A
1 layer 256.6 19.6 25.6 29.4 0.08 0.04 0.03 0.87
2 layers 283.8 32.1 38.1 46.9 0.11 0.06 0.03 0.81
3 layers 330 52.8 58.8 76.4 0.16 0.09 0.02 0.77
3,con 200 kPa
Unreinforced 295 68.2 0 0 0.23 0.23 0.23 N/A
1 layer 314.7 81.0 12.8 15.2 0.26 0.22 0.23 0.84
2 layers 373.4 102.5 34.3 49.5 0.27 0.16 0.21 0.70
3 layers 410.1 118.7 50.5 72.7 0.29 0.14 0.20 0.69
Note: All the porewater pressure parameters are evaluated at soil limit state (1 15). N/A indicates “Not Applicable”
(a) A* (b) B*
Fig. 14 Modified porewater pressure parameters A* and B* at 1 15 for reinforced clay: (a) A*; (b) B*
5. CONCLUSIONS
A series of CU triaxial compression tests were performed to investigate the shear behavior and porewater pressure generation of the reinforced clay specimens with various nonwoven geotex-tile layers. The main objective of this study was to investigate the generation of excess porewater pressure for reinforced clay and its relation with the shear strength improvement of reinforced clay. A modified porewater pressure parameter was proposed to assess the effect of reinforcement on excess porewater pressure generation during undrained loadings. The conclusions of this study are summarized as follows:
Nonwoven geotextile as a permeable reinforcement reduced the required time for consolidation but its high compressibil-ity induced higher volume reduction compared with unrein-forced clay.
The shear strength of the reinforced clay and porewater pressure at failure increased as the number of reinforcement layers increased because of the lateral restraint of the rein-forced clay from the mobilized tensile force of reinforce-ment layers.
Both effective and total stress failure envelopes of the rein-forced clay shifted upward as the number of reinforcement
Reinforcement spacing (mm) Reinforcement spacing (mm)

56 Journal of GeoEngineering, Vol. 11, No. 2, August 2016
layers increased and appeared to be parallel to those of the unreinforced clay. The difference in the friction angle was minor.
On the basis of the additional confinement approach, modi-fied porewater pressure parameters, A* and B*, for the rein-forced clay were proposed to quantitatively assess the influ-ence of soil and reinforcement on the excess porewater pressure generation, respectively, during undrained loadings. The A* value is close to Skempton’s porewater pressure pa-rameter A for unreinforced soil. The B* is defined as the ratio of porewater pressure difference to additional confining pressure. The lower B* value indicates that the reinforcement is more effective in enhancing additional confining pressure than increasing excess porewater pressure.
This study demonstrated that the effect of geotextile layers on inducing additional confinement was more marked than that on the development of porewater pressure, resulting in an increase in effective confining pressure and subsequently in the shear strength improvement of reinforced clay. Finally, it should be reminded that the data presented in this
study relates to laboratory tests on saturated clay reinforced with flexible nonwoven geotextile under triaxial undrained conditions. The conducted tests were intended to simulate the worst condi-tions of reinforced soil, although these conditions deviate con-siderably from those likely to prevail on site, where the soil is most likely partially saturated. In addition, the reinforcement with higher stiffness and tensile strength is typically used for the GRS structures in the field. Despite these differences, the test data are expected to provide useful and insightful information to understand the behavior and failure mechanism of reinforced earth.
ACKNOWLEDGEMENTS
The financial support for this research was from the Minis-try of Science and Technology of Taiwan under grant no. NSC102-2221-E-011-057-MY3. The financial supports for the second and third authors during their graduate study were pro-vided by the Taiwan Ministry of Education under the grant for “Aim for the Top-Tier University Project”. These financial sup-ports are gratefully acknowledged.
REFERENCES
AASHTO, (2002). Standard Specifications for Highway Bridges. 17th edition, American Association of State Highway and Transportation Officials, Washington, D.C.
ASTM D422, Standard Test Method for Particle-Size Analysis of Soils. ASTM International, West Conshohocken, PA, USA.
ASTM D4491, Standard Test Methods for Water Permeability of Geotextiles by Permittivity. ASTM International, West Con-shohocken, PA, USA.
ASTM D4595, Standard Test Method for Tensile Properties of Geo-textiles by the Wide-Width Strip Method. ASTM International. West Conshohocken, PA, USA.
ASTM D4767, Standard Test Method for Consolidated Undrained Triaxial Compression Test for Cohesive Soils. ASTM Interna-tional, West Conshohocken, PA, USA.
Al-Omari, R.R., Al-Dobaissi, H.H., Nazhat, Y.N., and Al-Wadood, B.A. (1989). “Shear strength of geomesh reinforced clay.” Geo-textiles and Geomembranes, 8(4), 325336.
Athanasopoulos, G.A. (1993). “Effect of particle size on the me-chanical behaviour of sand-geotextile composites.” Geotextile and Geomembranes, 12(3), 255273.
Bathurst, R.J. and Karpurapu, R. (1993). “Large-scale triaxial com-pression testing of geocell reinforced granular soils.” Geotech-nical Testing Journal, ASTM, 16(3), 293303.
Bathurst, R.J., Vlachopoulos, N., Walters, D.L., Burgess, P.G., and Allen, T.M. (2006). “The influence of facing stiffness on the performance of two geosynthetic reinforced soil retaining walls.” Canadian Geotechnical Journal, 43(12), 12251237.
Berg, R., Christopher, B.R., and Samtani, N. (2009). Design of Me-chanically Stabilized Earth Walls and Reinforced Soil Slopes. Vol. I and II, Report No. FHWA-NHI-10-024, National Highway Institute, Federal Highway Administration, Washington, D.C.
Casagrande, A. (1936). “The determination of the preconsolidation load and its practical significance.” Proceedings of the 1st In-ternational Conference, Soil Mechanics and Foundation Engi-neering, 60.
Chandrasekaran, B., Broms, B.B., and Wong, K.S. (1989). “Strength of fabric reinforced sand under axisymmetric loading.” Geotex-tiles and Geomembranes, 8(4), 293310.
Chen, J. and Yu, S. (2011). “Centrifugal and numerical modeling of a reinforced lime-stabilized soil embankment on soft clay with wick drains.” International Journal of Geomechanics, 11(3), 167173.
Christopher, B.R. and Stuglis, R.S. (2005). “Low permeable backfill soils in geosynthetics reinforced soil wall: State of the practice in North America: State of the practice in North America.” Pro-ceedings of North American Geo-synthetics Conference, Las Vegas, Nevada, USA
Elias, V., Christopher, B.R., and Berg, R. (2001). Mechanically Sta-bilized Earth Walls and Reinforced Soil Slopes Design and Construction Guidelines. Report No. FHWA-NHI-00-043, Na-tional Highway Institute, Federal Highway Administration, Washington, D.C.
Fabian, K. and Foure, A. (1986). “Performance of geotextile- reinforced clay samples in undrained triaxial tests.” Geotextiles and Geomembranes, 4(1), 5363.
Fourie, A.B. and Fabian, K.J. (1987). “Laboratory determination of clay geotextile interaction.” Geotextiles and Geomembranes, 6(4), 275294.
Glendinning, S., Jones, C., and Pugh, R. (2005). “Reinforced soil using cohesive fill and electrokinetic geosynthetics.” Interna-tional Journal of Geomechanics, 5(2), 138146.
Gray, D.H. and Al-Refeai, T. (1986). “Behavior of fabric vs. fiber reinforced sand.” Journal of Geotechnical Engineering, ASCE, 112(8), 804820.
Haeri, S.M., Noorzad, R., and Oskoorouchi, A.M. (2000). “Effect of geotextile reinforcement on the mechanical behavior of sand.” Geotextiles and Geomembranes, 18(6), 385402.
Hausmann, M.R. (1976). “Strength of reinforced soil.” Proceedings of the 8th Australasian Road Research Conference, Perth, Australia, 8(13), 18.
Indraratna, B., Satkunaseelan, K.S., and Rasul, M.G. (1991). “La-boratory properties of a soft marine clay reinforced with woven and nonwoven geotextiles.” Geotechnical Testing Journal, ASTM, 14(3), 288295.

Yang et al.: Behavior of Geotextile-Reinforced Clay in Consolidated-Undrained Tests: Reinterpretation of Porewater Pressure Parameters 57
Ingold, T.S. (1983). “Reinforced clay subject to undrained traxial loading.” Journal of Geotechnical Engineering, ASCE, 109(5), 738744.
Ingold, T.S. and Miller, K.S. (1982). “The performance of imper-meable and permeable reinforcement in clay subject to undrained loading.” Quarterly Journal of Engineering Geology and Hy-drogeology, 15(3), 201208.
Ingold, T.S. and Miller, K.S. (1983). “Drained axisymmetric loading of reinforced clay.” Journal of Geotechnical Engineering, ASCE, 109(7), 883898.
Jamei, M., Villard, P., and Guiras, H. (2013). “Shear failure criterion based on experimental and modeling results for fiber-reinforced clay.” International Journal of Geomechanics, 13(6), 882893.
Khedkar, M.S. and Mandal, J.N. (2009). “Behaviour of cellular re-inforced sand under triaxial loading conditions.” Geotechnical and Geological Engineering, 27(5), 645658.
Mirzababaei, M., Miraftab, M., Mohamed, M., and McMahon, P. (2013). “Unconfined compression strength of reinforced clays with carpet waste fibers.” Journal of Geotechnical and Geoen-vironmental Engineering, ASCE, 139(3), 483493.
Mitchell, J.K. and Zomberg, J.G. (1995). “Reinforced soil structures with poorly draining backfills. Part II: Case histories and appli-cations.” Geosynthetics International, 2(1), 265307.
Nguyen, M.D., Yang, K.H., Lee, S.H., Wu, C.S., and Tsai, M.H. (2013). “Behavior of nonwoven geotextile-reinforced soil and mobilization of reinforcement strain under triaxial compression.” Geosynthetics International, 20(3), 207225.
Noorzad, R. and Mirmoradi, S.H. (2010). “Laboratory evaluation of the behavior of a geotextile reinforced clay.” Geotextiles and Geomembranes, 28(4), 386392.
Raisinghani, D.V. and Viswanadham, B.V.S. (2011). “Centrifuge model study on low permeable slope reinforced by hybrid geo-synthetics.” Geotextiles and Geomembranes, 29(1), 567580.
Schlosser, F. and Long, N.T. (1974). “Recent results in French re-search on reinforced earth.” Journal of the Construction Division, ASCE, 100(3), 223237.
Skempton, A.W. (1954). “The pore-pressure coefficient A and B.” Gétechnique, 4(4), 143147.
Sridharan, A., Murthy, S., Bindumadhava, B.R., and Revansiddappa, K. (1991). “Technique for using fine-grained soil in reinforced earth.” Journal of Geotechnical Engineering, ASCE, 117(8), 11741190.
Taechakumthorn, C. and Rowe, R. (2012). “Performance of rein-forced embankments on rate-sensitive soils under working con-ditions considering effect of reinforcement viscosity.” Interna-tional Journal of Geomechanics, 12(4), 381390.
Unnikrishnan, N., Rajagopal, K., and Krishnaswamy, N.R. (2002). “Behaviour of reinforced clay under monotonic and cyclic loading.” Geotextiles and Geomembranes, 20(2), 117133.
Wu, C.S. and Hong, Y.S. (2008). “The behavior of a laminated rein-forced granular column.” Geotextiles and Geomembranes, 26(4), 302316.
Yang, K.H., Yalew, W.M., and Nguyen, M.D. (2015). “Behavior of geotextile-reinforced clay with a coarse material sandwich tech-nique under unconsolidated-undrained triaxial compression.” International Journal of Geomechanics, ASCE, DOI: 10.1061/ (ASCE) GM.1943-5622.0000611.
Zornberg, J.G. and Mitchell, J.K. (1994). “Reinforced soil structures with poorly draining backfills. Part I: Reinforcement interactions and functions.” Geosynthetics International, 1(2), 103148.

58 Journal of GeoEngineering, Vol. 11, No. 2, August 2016