Confined Masonry Buildings: Design and Construction Deficiencies
13th World Conference on Earthquake Engineering Vancouver, B.C., Canada
August 1-6, 2004 Paper No. 3438
BEHAVIOR OF CONFINED MASONRY SHEAR WALLS WITH LARGE OPENINGS
Fernando Yáñez1, Maximiliano Astroza2, Augusto Holmberg3, Oscar Ogaz4
SUMMARY Significant research has been carried out in different countries to study the behavior of confined masonry walls. However all the specimens of the tests reported had not openings, which is a typical feature of walls of actual buildings. In order to study the behavior of lightly reinforced confined masonry shear walls with openings, sixteen full-scale specimens were tested. Eight specimens were of concrete masonry units and eight of hollow clay brick masonry units. The specimens were designed to have shear failure with diagonal cracks in the masonry panel. The test parameters were the masonry unit type (concrete and clay) and the size of openings (four cases). Test results include the evaluation of the deformation capacity, energy dissipation characteristics and stiffness and strength degradation, cracking shear, maximum shear strength and the interstory drift associated to different limit states. Comparisons with the behavior of previously tested confined masonry walls without openings are also made. The results show that masonry unit type and size of the openings control the behavior and that confined masonry walls, even with large openings, have a significant deformation capacity. They also show that it is conservative to consider the shear capacity proportional to the net transverse area of the walls.
INTRODUCTION Structural masonry is one of the most inexpensive construction systems for low to medium rise buildings in Latin America. In these buildings, masonry shear walls are the only structural element of the gravitational and seismic lateral resistance system. In many Latin American countries, confined masonry is one of the most popular construction system, consisting of a masonry panel framed with concrete beams and columns. The masonry panel is made first, and then the concrete of columns and beams is poured against the boundaries of the masonry panels.
1 IDIEM, University of Chile, Chile, [email protected] 2 Dept. Civil Engineering, University of Chile, Chile, [email protected] 3 Instituto del Cemento y del Hormigón de Chile, Chile, [email protected] 4 IDIEM, University of Chile, Chile, [email protected]
Due to the complexity of the problem, the behavior of confined masonry shear walls is still not well known, in spite of masonry experimental research programs conducted in many countries. One of the less known aspect is the effect of the openings (their size) on the seismic behavior of the walls. These openings correspond to windows and doors of the façade of the buildings. To assess the effect of the openings on the seismic behaviors, sixteen specimens of confined masonry walls with central openings of different sizes were tested under lateral controlled deformation cycles. Eight specimens were of hollow concrete masonry units and eight of hollow clay masonry units. The main parameters studied were strength, stiffness, deformation capacity and energy dissipation capacity of the walls [1].
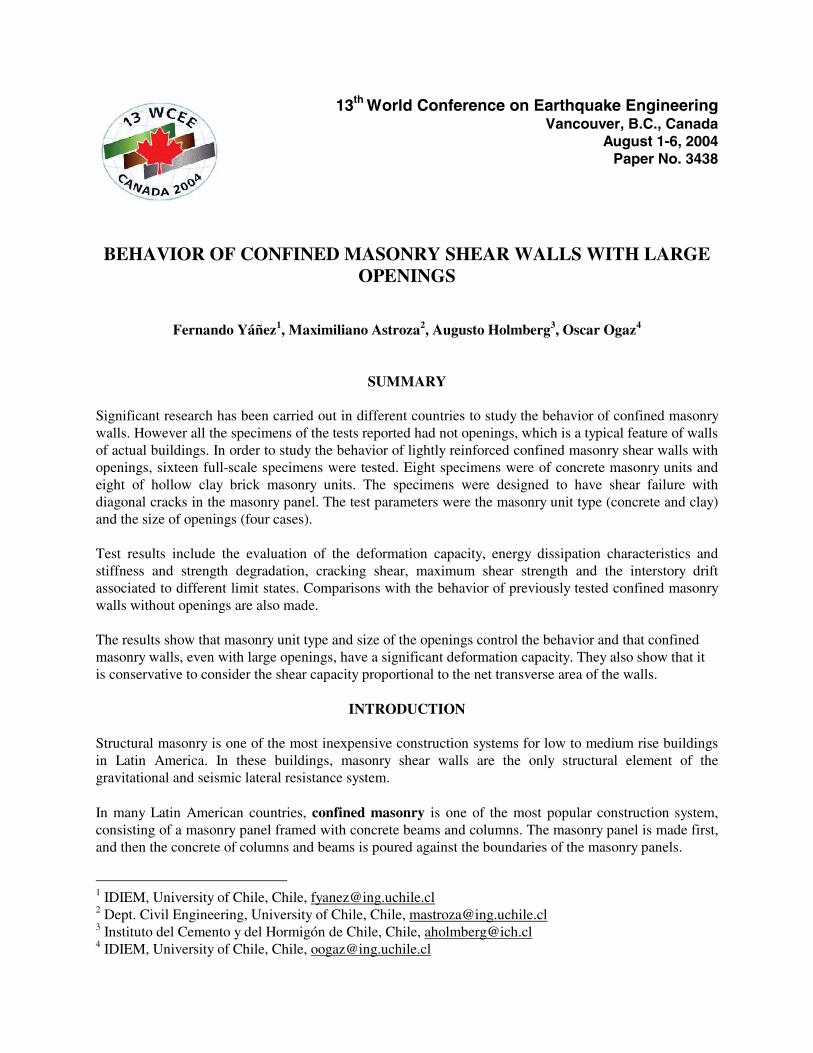
EXPERIMENTAL PROGRAM Characteristic of the specimens To determine the characteristics of the specimen, 164 Chilean dwelling projects were reviewed [2]. All the specimens had a panel with openings of different sizes, two columns and a beam on top. The bond pattern was of the running bond type. The openings had no special concrete confinement elements around its borders. The hollows of the masonry units were not filled with mortar or grout, except in the hollow close to the openings where a vertical reinforcement bar was placed. The walls of concrete masonry units were 3650 mm width and 2250 mm height. The walls of clay units were 3600 mm width, and 2200 mm height. The thickness in both cases was 140 mm (the width of the units). Figure 1 shows the dimensions of the four patterns of the specimens (there were 2 specimens for each pattern). Concrete masonry walls
20643650
Pattern 1
2250
593 1200
Pattern 2
1230
593 1200
Pattern 3
825 1405
1230
1200
Pattern 4
645
2050
Hollow clay brick masonry walls
2000
2005
2200
3600 595 1205595
1125
1205 785 1515
1125
1205480
Pattern 1 Pattern 2 Pattern 3 Pattern 4 Figure 1: Wall dimensions
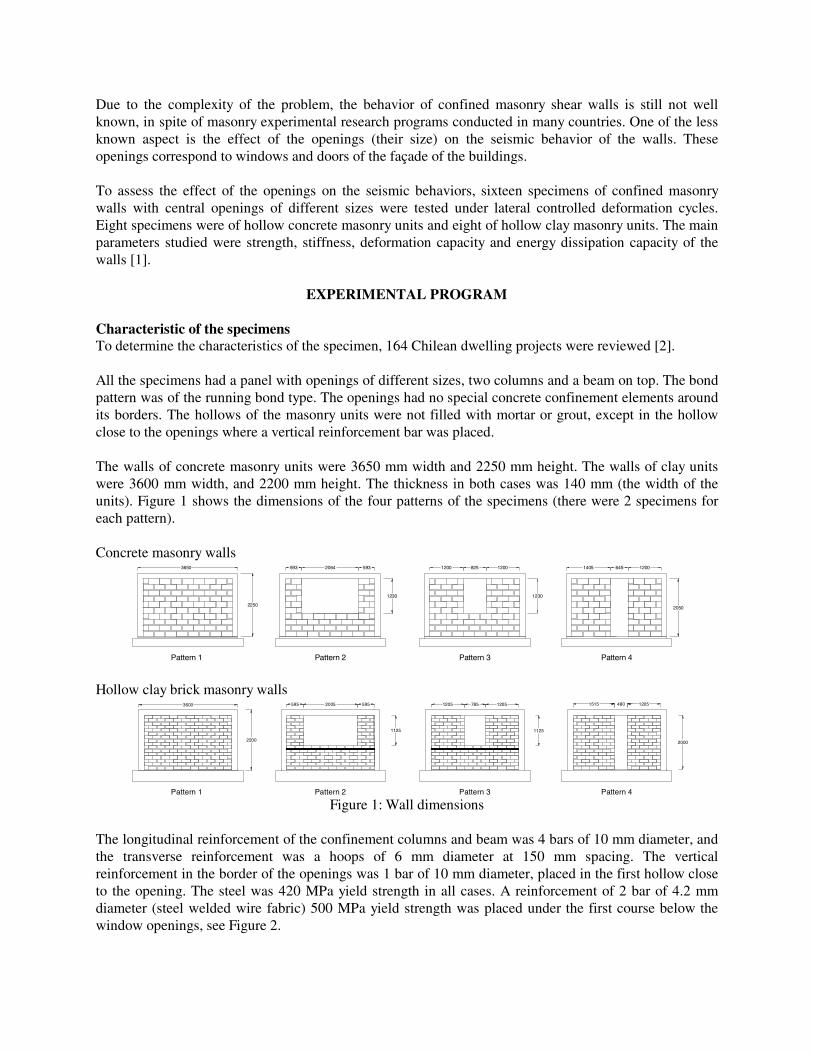
The longitudinal reinforcement of the confinement columns and beam was 4 bars of 10 mm diameter, and the transverse reinforcement was a hoops of 6 mm diameter at 150 mm spacing. The vertical reinforcement in the border of the openings was 1 bar of 10 mm diameter, placed in the first hollow close to the opening. The steel was 420 MPa yield strength in all cases. A reinforcement of 2 bar of 4.2 mm diameter (steel welded wire fabric) 500 MPa yield strength was placed under the first course below the window openings, see Figure 2.
Vertical reinforcement
Reforcement concretefoundation beam
Wall section
4φ10Hoops φ6@15
4φ10Hoops φ6@15 1φ101φ10
Confinement reforcement concrete beam
Confinement reforcement concrete column
4,2 mm diameter steel welded wire fabric
Figure 2: Wall reinforcement
The proportion of the mortar used was 6.5 liters of water per each 45 kg sack of premixed mortar. The proportion of the concrete of the columns and beams was 4.2 liters of water per each 35 kg sack of premixed concrete of 8mm maximum size. The grout poured into the hollows close to the opening (where a reinforcement bar was placed) was 5.5 liter of water per each 45 kg sack of premixed concrete of 8 mm maximum size. Table 1 shows the mean strength of the materials used.
Table 1: Strength of the materials Material Strength Mean value
[MPa] Mortar Compressive Strength 18.87 Fill concrete Compressive Strength 31.72 Concrete Compressive Strength (28 days) 23.9 Steel A 63-42H Yield Strength 553 Steel AT56-50H Yield Strength 587
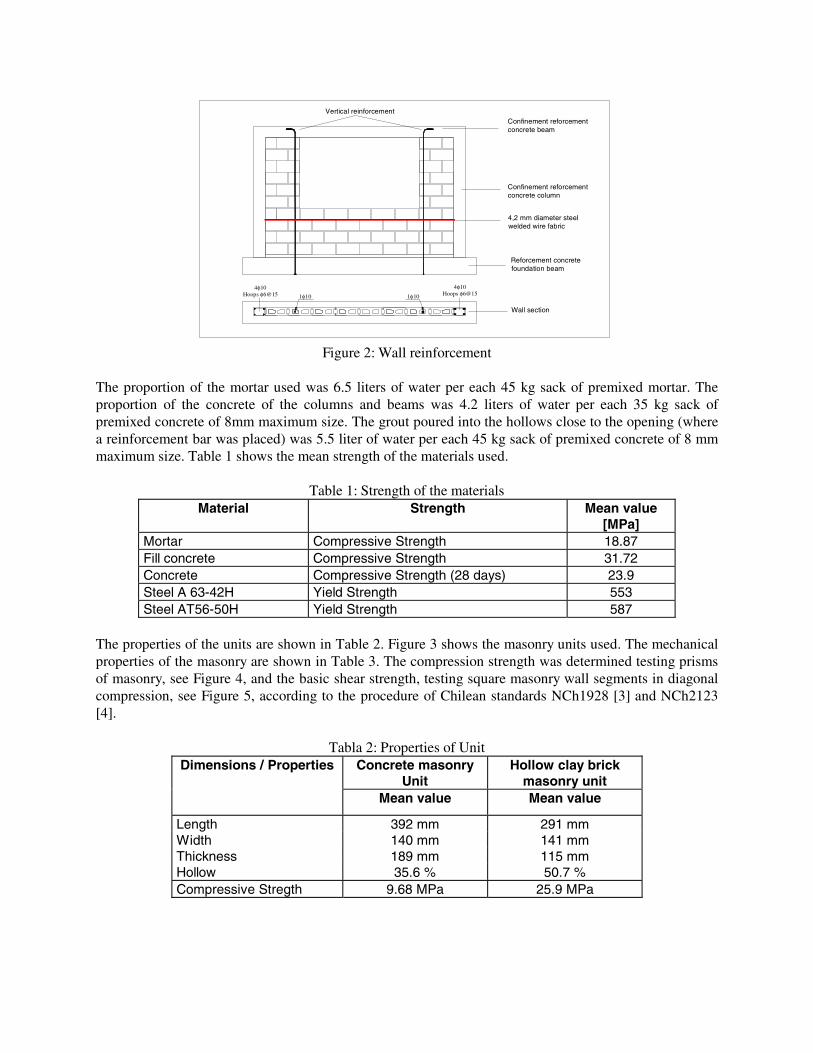
The properties of the units are shown in Table 2. Figure 3 shows the masonry units used. The mechanical properties of the masonry are shown in Table 3. The compression strength was determined testing prisms of masonry, see Figure 4, and the basic shear strength, testing square masonry wall segments in diagonal compression, see Figure 5, according to the procedure of Chilean standards NCh1928 [3] and NCh2123 [4].
Tabla 2: Properties of Unit Dimensions / Properties Concrete masonry
Unit Hollow clay brick
masonry unit Mean value Mean value
Length 392 mm 291 mm Width 140 mm 141 mm Thickness 189 mm 115 mm Hollow 35.6 % 50.7 % Compressive Stregth 9.68 MPa 25.9 MPa
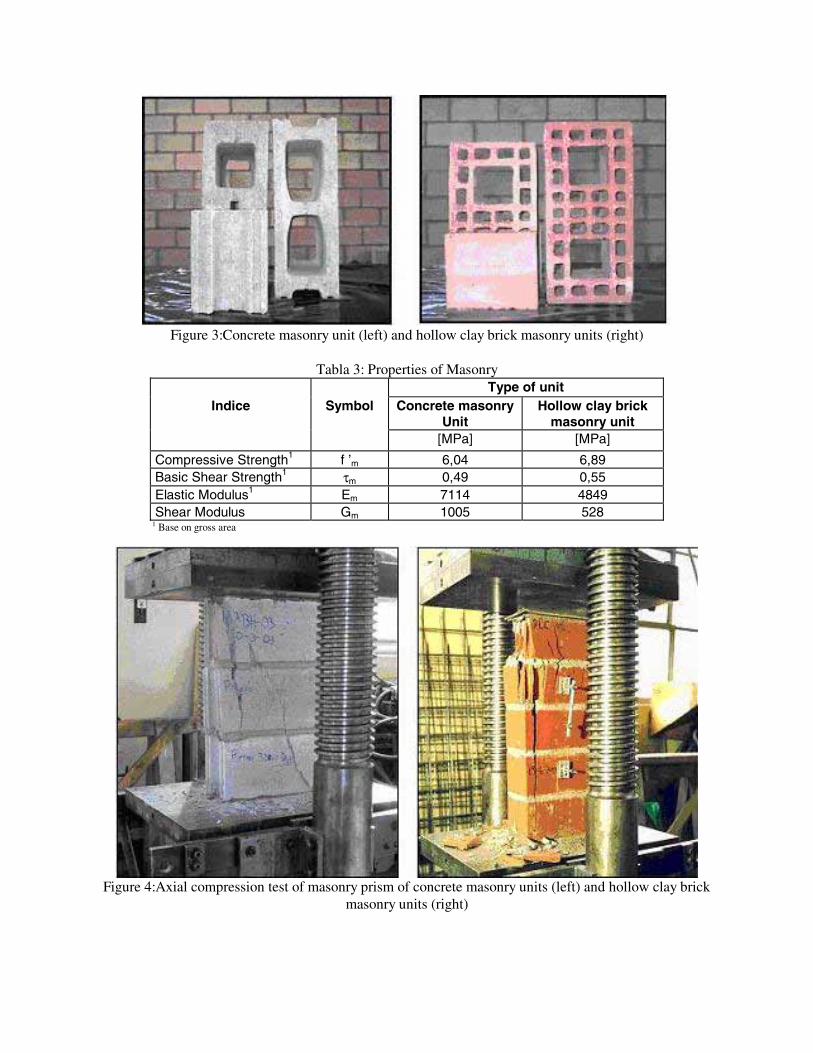
Figure 3:Concrete masonry unit (left) and hollow clay brick masonry units (right)
Tabla 3: Properties of Masonry
Type of unit Indice Symbol Concrete masonry
Unit Hollow clay brick
masonry unit [MPa] [MPa]
Compressive Strength1 f ’m 6,04 6,89 Basic Shear Strength1 τm 0,49 0,55 Elastic Modulus1 Em 7114 4849 Shear Modulus Gm 1005 528
1 Base on gross area
Figure 4:Axial compression test of masonry prism of concrete masonry units (left) and hollow clay brick
masonry units (right)
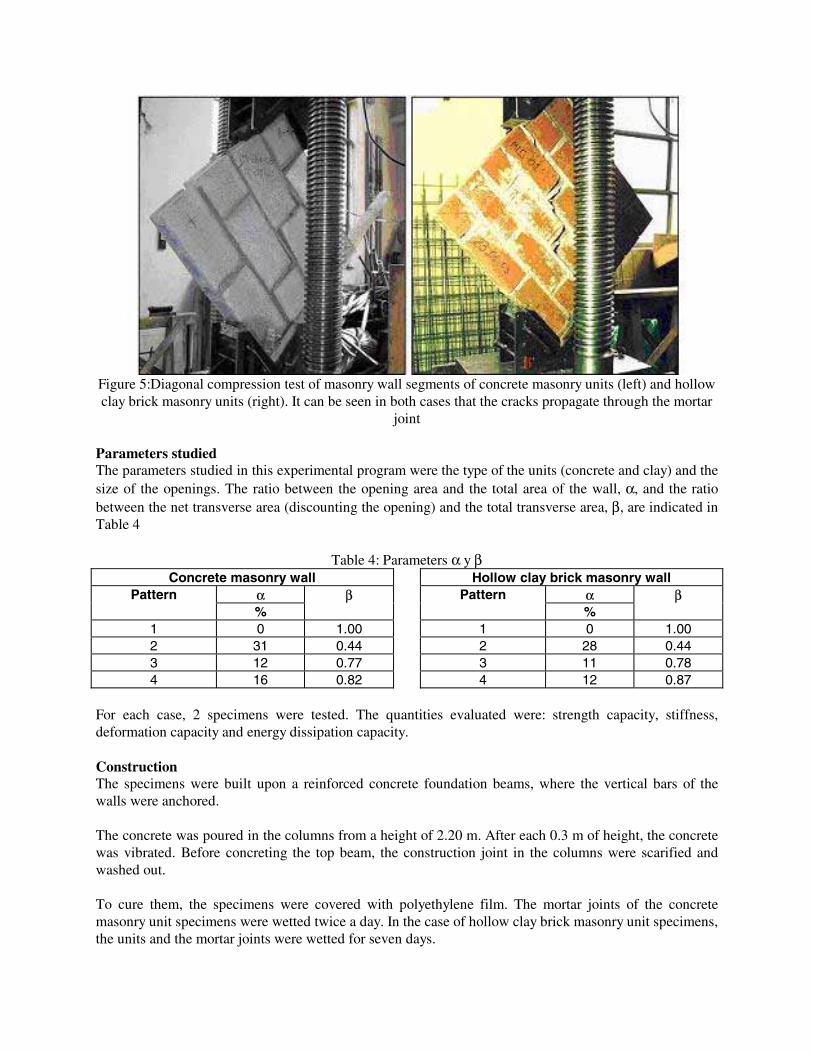
Figure 5:Diagonal compression test of masonry wall segments of concrete masonry units (left) and hollow clay brick masonry units (right). It can be seen in both cases that the cracks propagate through the mortar
joint
Parameters studied The parameters studied in this experimental program were the type of the units (concrete and clay) and the size of the openings. The ratio between the opening area and the total area of the wall, α, and the ratio between the net transverse area (discounting the opening) and the total transverse area, β, are indicated in Table 4
Table 4: Parameters α y β Concrete masonry wall Hollow clay brick masonry wall
Pattern α β Pattern α β % % 1 0 1.00 1 0 1.00 2 31 0.44 2 28 0.44 3 12 0.77 3 11 0.78 4 16 0.82 4 12 0.87
For each case, 2 specimens were tested. The quantities evaluated were: strength capacity, stiffness, deformation capacity and energy dissipation capacity. Construction The specimens were built upon a reinforced concrete foundation beams, where the vertical bars of the walls were anchored. The concrete was poured in the columns from a height of 2.20 m. After each 0.3 m of height, the concrete was vibrated. Before concreting the top beam, the construction joint in the columns were scarified and washed out. To cure them, the specimens were covered with polyethylene film. The mortar joints of the concrete masonry unit specimens were wetted twice a day. In the case of hollow clay brick masonry unit specimens, the units and the mortar joints were wetted for seven days.
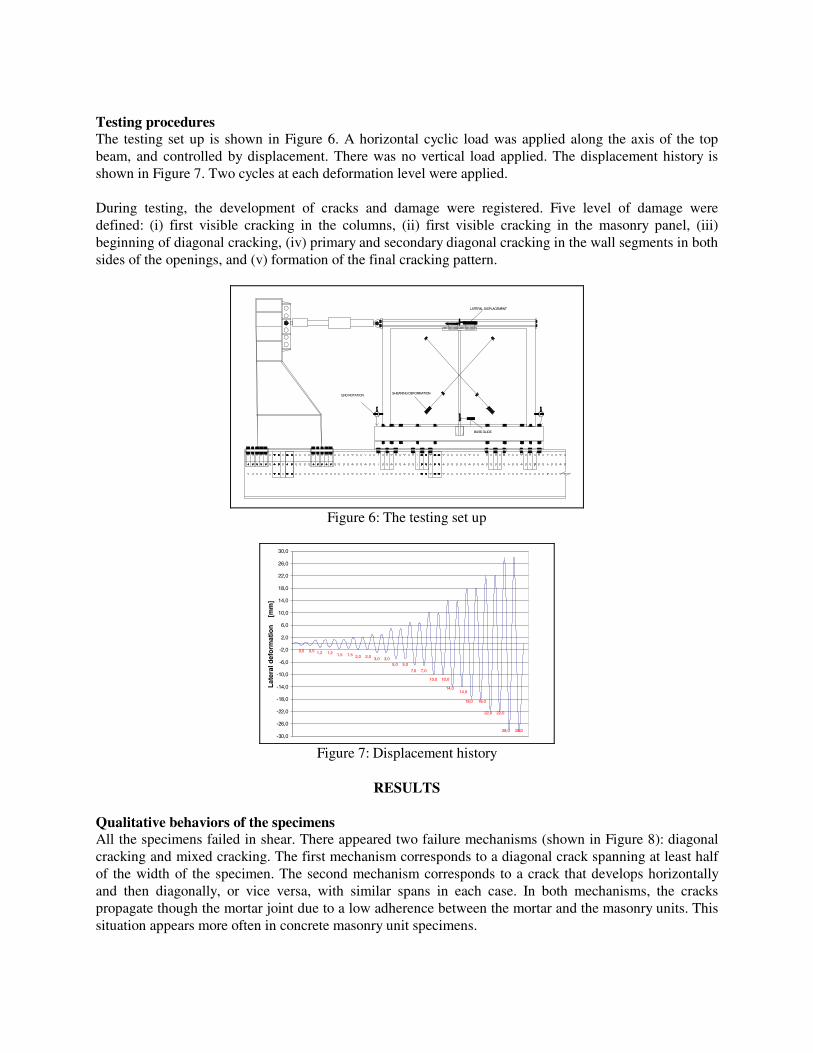
Testing procedures The testing set up is shown in Figure 6. A horizontal cyclic load was applied along the axis of the top beam, and controlled by displacement. There was no vertical load applied. The displacement history is shown in Figure 7. Two cycles at each deformation level were applied. During testing, the development of cracks and damage were registered. Five level of damage were defined: (i) first visible cracking in the columns, (ii) first visible cracking in the masonry panel, (iii) beginning of diagonal cracking, (iv) primary and secondary diagonal cracking in the wall segments in both sides of the openings, and (v) formation of the final cracking pattern.
END ROTATIONSHEARING DEFORMATION
LATERAL DISPLACEMENT
BASE GLIDE
Figure 6: The testing set up
-30,0
-26,0
-22,0
-18,0
-14,0
-10,0
-6,0
-2,0
2,0
6,0
10,0
14,0
18,0
22,0
26,0
30,0
Lat
eral
def
orm
atio
n
[m
m]
0,5 0,5 1,2 1,2 1,5 1,5 2,0 2,0 3,0 3,05,0 5,0
7,0 7,0
10,0 10,0
14,014,0
18,0 18,0
22,0 22,0
28,0 28,0
Figure 7: Displacement history
RESULTS
Qualitative behaviors of the specimens All the specimens failed in shear. There appeared two failure mechanisms (shown in Figure 8): diagonal cracking and mixed cracking. The first mechanism corresponds to a diagonal crack spanning at least half of the width of the specimen. The second mechanism corresponds to a crack that develops horizontally and then diagonally, or vice versa, with similar spans in each case. In both mechanisms, the cracks propagate though the mortar joint due to a low adherence between the mortar and the masonry units. This situation appears more often in concrete masonry unit specimens.
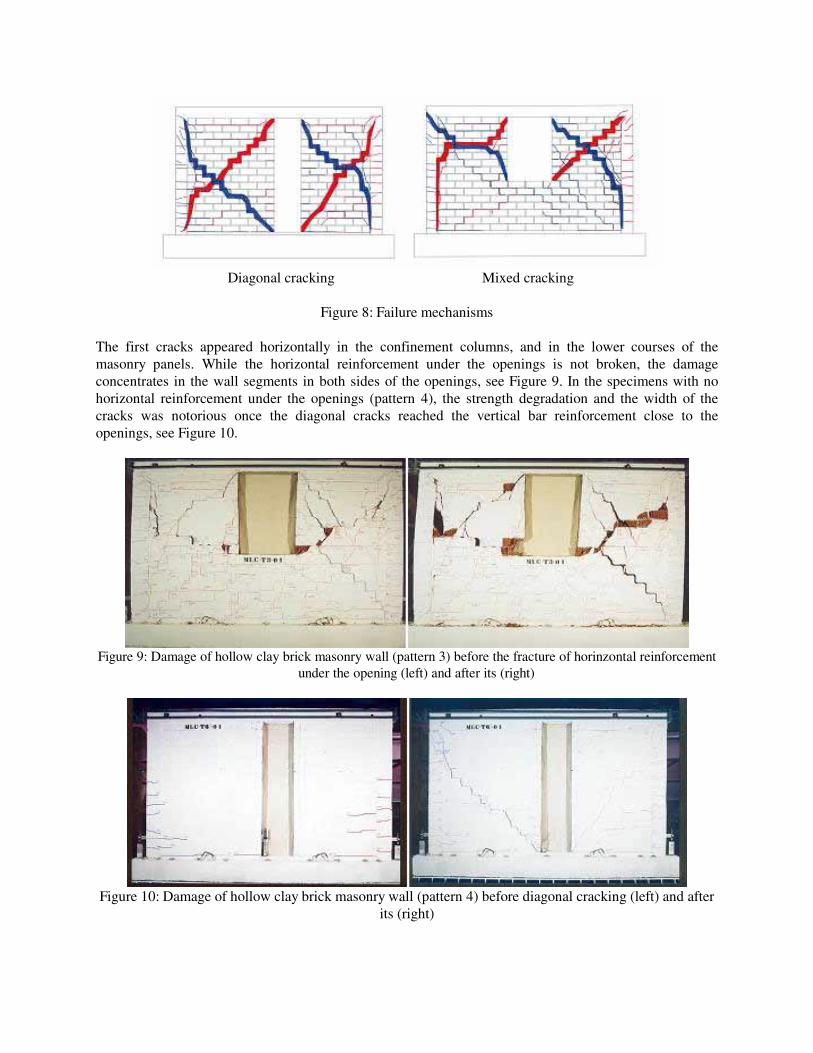
Diagonal cracking Mixed cracking
Figure 8: Failure mechanisms The first cracks appeared horizontally in the confinement columns, and in the lower courses of the masonry panels. While the horizontal reinforcement under the openings is not broken, the damage concentrates in the wall segments in both sides of the openings, see Figure 9. In the specimens with no horizontal reinforcement under the openings (pattern 4), the strength degradation and the width of the cracks was notorious once the diagonal cracks reached the vertical bar reinforcement close to the openings, see Figure 10.
Figure 9: Damage of hollow clay brick masonry wall (pattern 3) before the fracture of horinzontal reinforcement
under the opening (left) and after its (right)
Figure 10: Damage of hollow clay brick masonry wall (pattern 4) before diagonal cracking (left) and after
its (right)
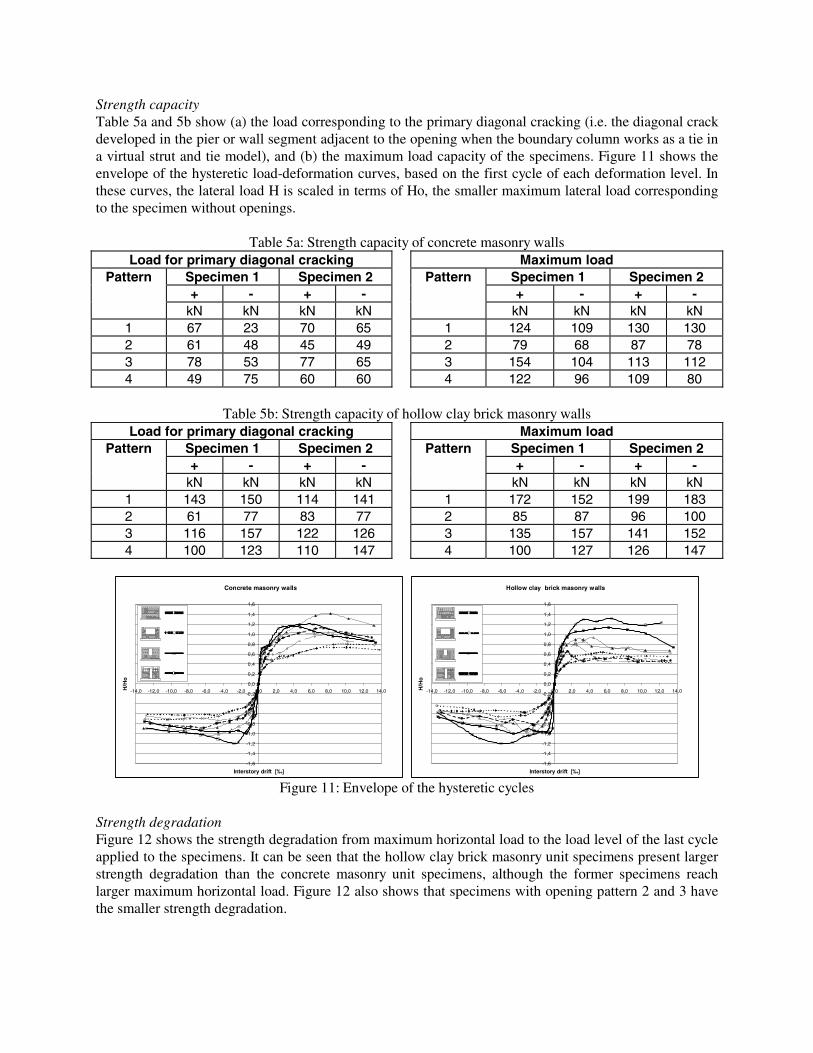
Strength capacity Table 5a and 5b show (a) the load corresponding to the primary diagonal cracking (i.e. the diagonal crack developed in the pier or wall segment adjacent to the opening when the boundary column works as a tie in a virtual strut and tie model), and (b) the maximum load capacity of the specimens. Figure 11 shows the envelope of the hysteretic load-deformation curves, based on the first cycle of each deformation level. In these curves, the lateral load H is scaled in terms of Ho, the smaller maximum lateral load corresponding to the specimen without openings.
Table 5a: Strength capacity of concrete masonry walls Load for primary diagonal cracking Maximum load
Pattern Specimen 1 Specimen 2 Pattern Specimen 1 Specimen 2 + - + - + - + - kN kN kN kN kN kN kN kN
1 67 23 70 65 1 124 109 130 130 2 61 48 45 49 2 79 68 87 78 3 78 53 77 65 3 154 104 113 112 4 49 75 60 60 4 122 96 109 80
Table 5b: Strength capacity of hollow clay brick masonry walls
Load for primary diagonal cracking Maximum load Pattern Specimen 1 Specimen 2 Pattern Specimen 1 Specimen 2
+ - + - + - + - kN kN kN kN kN kN kN kN
1 143 150 114 141 1 172 152 199 183 2 61 77 83 77 2 85 87 96 100 3 116 157 122 126 3 135 157 141 152 4 100 123 110 147 4 100 127 126 147
Concrete masonry walls
-1,6
-1,4
-1,2
-1,0
-0,8
-0,6
-0,4
-0,2
0,0
0,2
0,4
0,6
0,8
1,0
1,2
1,4
1,6
-14,0 -12,0 -10,0 -8,0 -6,0 -4,0 -2,0 0,0 2,0 4,0 6,0 8,0 10,0 12,0 14,0
Interstory drift [‰]
H/H
o
Hollow clay brick masonry walls
-1,6
-1,4
-1,2
-1,0
-0,8
-0,6
-0,4
-0,2
0,0
0,2
0,4
0,6
0,8
1,0
1,2
1,4
1,6
-14,0 -12,0 -10,0 -8,0 -6,0 -4,0 -2,0 0,0 2,0 4,0 6,0 8,0 10,0 12,0 14,0
Interstory drift [‰]
H/H
o
Figure 11: Envelope of the hysteretic cycles
Strength degradation Figure 12 shows the strength degradation from maximum horizontal load to the load level of the last cycle applied to the specimens. It can be seen that the hollow clay brick masonry unit specimens present larger strength degradation than the concrete masonry unit specimens, although the former specimens reach larger maximum horizontal load. Figure 12 also shows that specimens with opening pattern 2 and 3 have the smaller strength degradation.

Concrete masonry walls
0
10
20
30
40
50
60S
tren
gth
de
gra
dat
ion
‰
11 12
12
56
1910
7
2346
24
10
11
14
12
10
22
PROBETA 1 PROBETA 2Specimen 1 Specimen 2
Hollow clay brick masonry walls
0
10
20
30
40
50
60
Str
eng
th d
egra
dat
ion
‰
30
30
15
40
20
15
13
45
4828
18
12
8
2415
40
PROBETA 1 PROBETA 2Specimen 1 Specimen 2
Figure 12: Strength degradation
Stiffness Table 6 shows the lateral stiffness for the first cycle of the second level of deformations applied to the specimens (initial stiffness). Figure 13 shows the stiffness degradation as a function of the interstory drift. The curves are shown up to an interstory drift of 8.0‰. The stiffness was defined taken the slope of the line joining the maximum positive and negative deformation of the cycle. In these curves the stiffness was scaled in terms of Ko, the smaller stiffness of the first cycle of the second level of deformations applied to the specimens without openings. Figure 13 also shows that the stiffness degradation is striking for interstory drift lesser that 2.0‰, due to the cracking in the confinement columns and in the masonry panel, and the concrete masonry walls present a small rate of the stiffness degradation for any interstory drift value.
Table 6: Initial stiffness Concrete masonry wall Hollow clay brick masonry wall
Pattern Specimen 1 Specimen 2 Pattern Specimen 1 Specimen 2 kN/mm kN/mm kN/mm kN/mm
1 44 49 1 60 82 2 23 25 2 28 29 3 36 42 3 57 66 4 30 35 4 50 48
Concrete masonry walls
0,0
0,2
0,4
0,6
0,8
1,0
1,2
1,4
0,0 2,0 4,0 6,0 8,0
Interstory drift [‰]
K/K
o
Hollow clay brick masonry walls
0,0
0,2
0,4
0,6
0,8
1,0
1,2
1,4
0,0 2,0 4,0 6,0 8,0
Interstory drift [‰]
K/K
o
Figure 13: Stiffness degradation
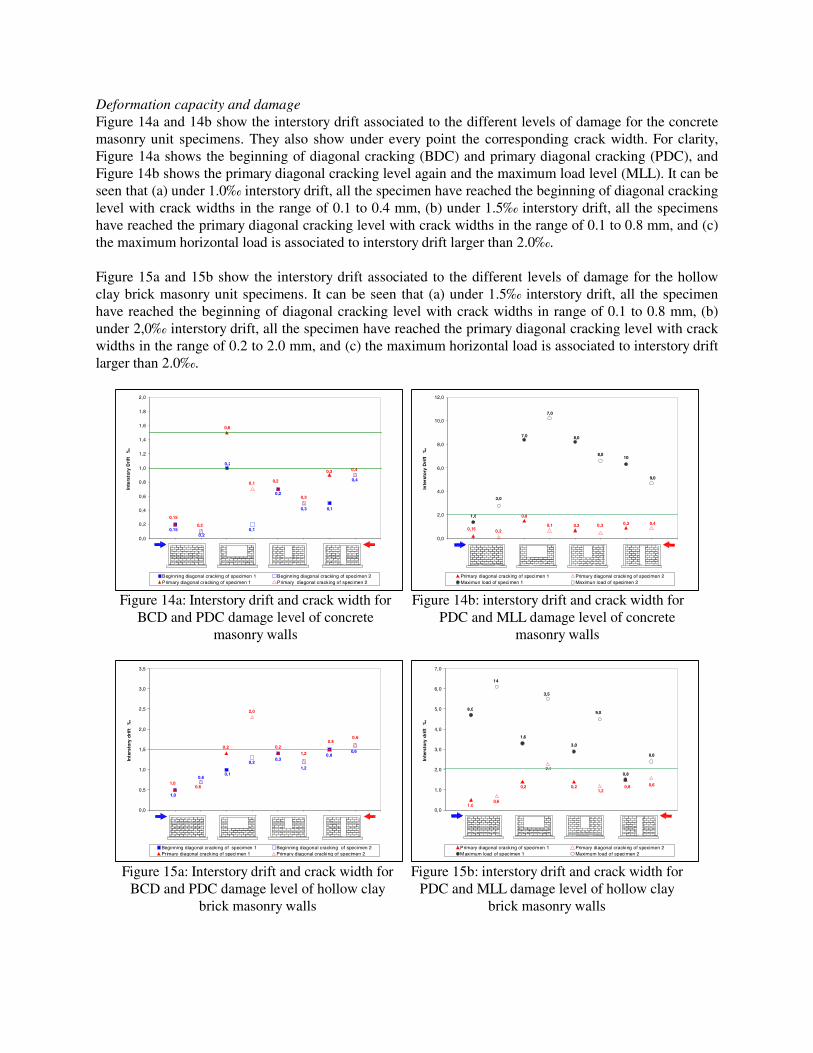
Deformation capacity and damage Figure 14a and 14b show the interstory drift associated to the different levels of damage for the concrete masonry unit specimens. They also show under every point the corresponding crack width. For clarity, Figure 14a shows the beginning of diagonal cracking (BDC) and primary diagonal cracking (PDC), and Figure 14b shows the primary diagonal cracking level again and the maximum load level (MLL). It can be seen that (a) under 1.0‰ interstory drift, all the specimen have reached the beginning of diagonal cracking level with crack widths in the range of 0.1 to 0.4 mm, (b) under 1.5‰ interstory drift, all the specimens have reached the primary diagonal cracking level with crack widths in the range of 0.1 to 0.8 mm, and (c) the maximum horizontal load is associated to interstory drift larger than 2.0‰. Figure 15a and 15b show the interstory drift associated to the different levels of damage for the hollow clay brick masonry unit specimens. It can be seen that (a) under 1.5‰ interstory drift, all the specimen have reached the beginning of diagonal cracking level with crack widths in range of 0.1 to 0.8 mm, (b) under 2,0‰ interstory drift, all the specimen have reached the primary diagonal cracking level with crack widths in the range of 0.2 to 2.0 mm, and (c) the maximum horizontal load is associated to interstory drift larger than 2.0‰.
0,0
0,2
0,4
0,6
0,8
1,0
1,2
1,4
1,6
1,8
2,0
Inte
rsto
ry D
rift
‰
Beginning diagonal cracking of specimen 1 Beginning diagonal cracking of specimen 2Primary diagonal cracking of specimen 1 Primary diagonal cracking of specimen 2
0,15
0,3
0,2
0,1
0,2
0,2
0,4
0,1
0,15
0,3
0,3
0,20,1
0,8
0,2
0,4
0,0
2,0
4,0
6,0
8,0
10,0
12,0
Inte
rsto
ry D
rift
‰
Primary diagonal cracking of specimen 1 Primary diagonal cracking of specimen 2Maximun load of specimen 1 Maximun load of specimen 2
1,6
8,0
8,0
7,0
7,0
3,0
9,0
10
0,150,30,30,20,1
0,8
0,2
0,4
Figure 14a: Interstory drift and crack width for
BCD and PDC damage level of concrete masonry walls
Figure 14b: interstory drift and crack width for PDC and MLL damage level of concrete
masonry walls
0,0
0,5
1,0
1,5
2,0
2,5
3,0
3,5
Inte
rsto
ry d
rift
‰
Beginning diagonal cracking of specimen 1 Beginning diagonal cracking of specimen 2Primary diagonal cracking of specimen 1 Primary diagonal cracking of specimen 2
1,0
1,2
0,30,2
0,10,6
0,60,8
1,0
0,8
1,20,2
2,0
0,2
0,6
0,6
0,0
1,0
2,0
3,0
4,0
5,0
6,0
7,0
Inte
rsto
ry d
rift
‰
Primary diagonal cracking of specimen 1 Primary diagonal cracking of specimen 2Maximum load of specimen 1 Maximum load of specimen 2
8,09,0
3,0
3,5
1,6
14
0,6
0,8
1,0
0,81,2
0,2
2,0
0,2
0,6
0,6
Figure 15a: Interstory drift and crack width for
BCD and PDC damage level of hollow clay brick masonry walls
Figure 15b: interstory drift and crack width for PDC and MLL damage level of hollow clay
brick masonry walls

Figure 16 a,b and Figure 17 a,b show the interstory drift associated to crack widths of 1.5 mm and 3.0 mm, for concrete masonry units and hollow clay masonry units, respectively. The tests indicate that for these specimens with small horizontal reinforcement in the masonry panel, the crack widths are quite large for small interstory drift. In order to keep the crack widths under 1.5 mm, the interstory drift ratio should be no larger than 1.0‰, whereas to keep the crack widths under 3.0 mm, the interstory drift should be no larger than 2.0‰.
Interstory drift for 1.5 mm of crack width Concrete masonry walls
0,0
1,0
2,0
3,0
4,0
5,0
Inte
rsto
ry D
rift
[‰
]
PROBETA 1 PROBETA 2Specimen 1 Specimen 2
Interstory drift for 3.0 mm of crack width Concrete masonry walls
0,0
1,0
2,0
3,0
4,0
5,0
6,0
7,0
Inte
rsto
ry D
rift
[‰
]
PROBETA 1 PROBETA 2Specimen 1 Specimen 2
Figure 16a: Interstory drift for 1.5 mm of crack width for concrete masonry walls
Figure 16b: Interstory drift for 3.0 mm of crack width for concrete masonry walls
Interstory drift for 1.5 mm of crack width
Hollow clay brick masonry walls
0,0
1,0
2,0
3,0
4,0
5,0
Inte
rsto
ry D
rift
[‰
]
PROBETA 1 PROBETA 2Specimen 1 Specimen 2
Interstory drift for 3.0 mm of crack width Hollow clay brick masonry walls
0,0
1,0
2,0
3,0
4,0
5,0
6,0
7,0
Inte
rsto
ry D
rift
[‰
]
PROBETA 1 PROBETA 2Specimen 1 Specimen 2
Figure 17a: Interstory drift for 1.5 mm of crack width for hollow clay brick masonry walls
Figure 17b: Interstory drift for 3.0 mm of crack width for for hollow clay brick masonry walls
Energy dissipation capacity Figure 18 shows the accumulated energy dissipation for each level of deformation (including both cycles) as a function of interstory drift. This energy has been scaled in terms of the smaller total accumulated energy dissipation (Eo) of the specimens without openings. Table 7 shows the total accumulated energy dissipation for all the specimens. From this table it can be seen that energy dissipation capacity of concrete masonry walls is smaller than brick masonry walls, between a 25% to 40%, when the interstory drift is 10.5 ‰. The Figure 18 shows that in concrete masonry walls this capacity is less sensitive to the opening of small size.
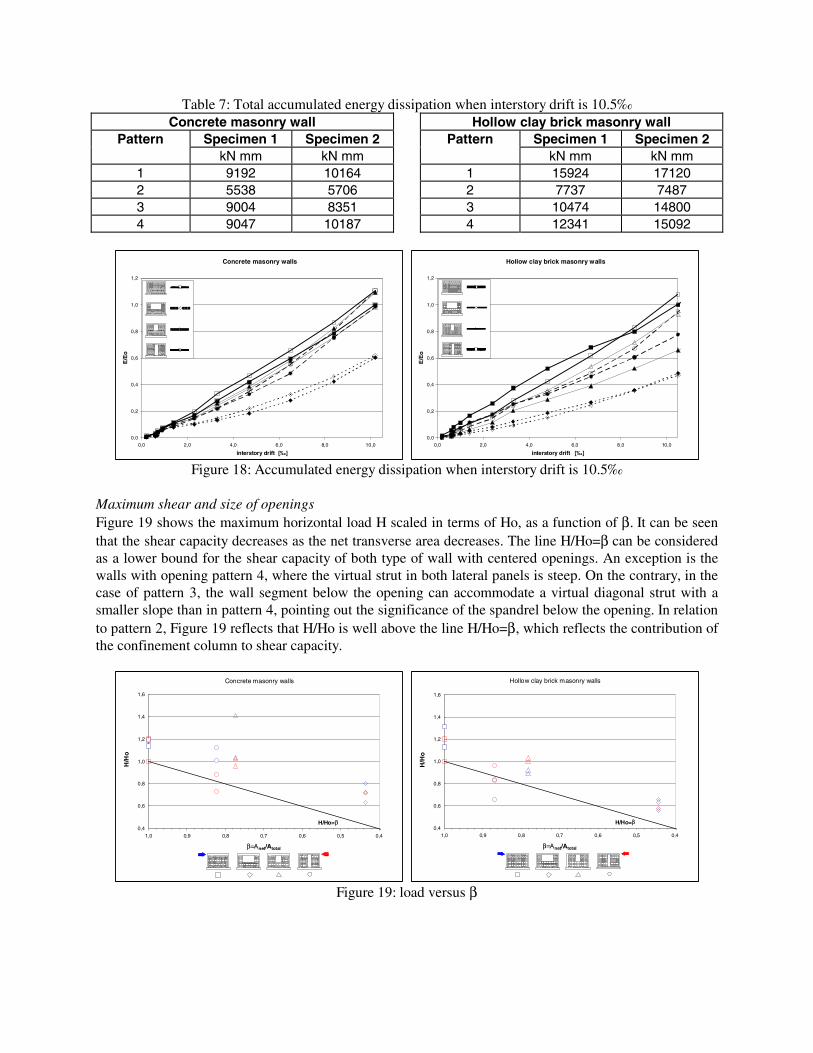
Table 7: Total accumulated energy dissipation when interstory drift is 10.5‰ Concrete masonry wall Hollow clay brick masonry wall
Pattern Specimen 1 Specimen 2 Pattern Specimen 1 Specimen 2 kN mm kN mm kN mm kN mm
1 9192 10164 1 15924 17120 2 5538 5706 2 7737 7487 3 9004 8351 3 10474 14800 4 9047 10187 4 12341 15092
Concrete masonry walls
0,0
0,2
0,4
0,6
0,8
1,0
1,2
0,0 2,0 4,0 6,0 8,0 10,0
interstory drift [‰]
E/E
o
Hollow clay brick masonry walls
0,0
0,2
0,4
0,6
0,8
1,0
1,2
0,0 2,0 4,0 6,0 8,0 10,0
interstory drift [‰]
E/E
o
Figure 18: Accumulated energy dissipation when interstory drift is 10.5‰
Maximum shear and size of openings Figure 19 shows the maximum horizontal load H scaled in terms of Ho, as a function of β. It can be seen that the shear capacity decreases as the net transverse area decreases. The line H/Ho=β can be considered as a lower bound for the shear capacity of both type of wall with centered openings. An exception is the walls with opening pattern 4, where the virtual strut in both lateral panels is steep. On the contrary, in the case of pattern 3, the wall segment below the opening can accommodate a virtual diagonal strut with a smaller slope than in pattern 4, pointing out the significance of the spandrel below the opening. In relation to pattern 2, Figure 19 reflects that H/Ho is well above the line H/Ho=β, which reflects the contribution of the confinement column to shear capacity.
Concrete masonry walls
0,4
0,6
0,8
1,0
1,2
1,4
1,6
0,40,50,60,70,80,91,0
β=Anet/Atotal
H/H
o
H/Ho=β
Hollow clay brick masonry walls
0,4
0,6
0,8
1,0
1,2
1,4
1,6
0,40,50,60,70,80,91,0
β=Anet/Atotal
H/H
o
H/Ho=β
Figure 19: load versus β
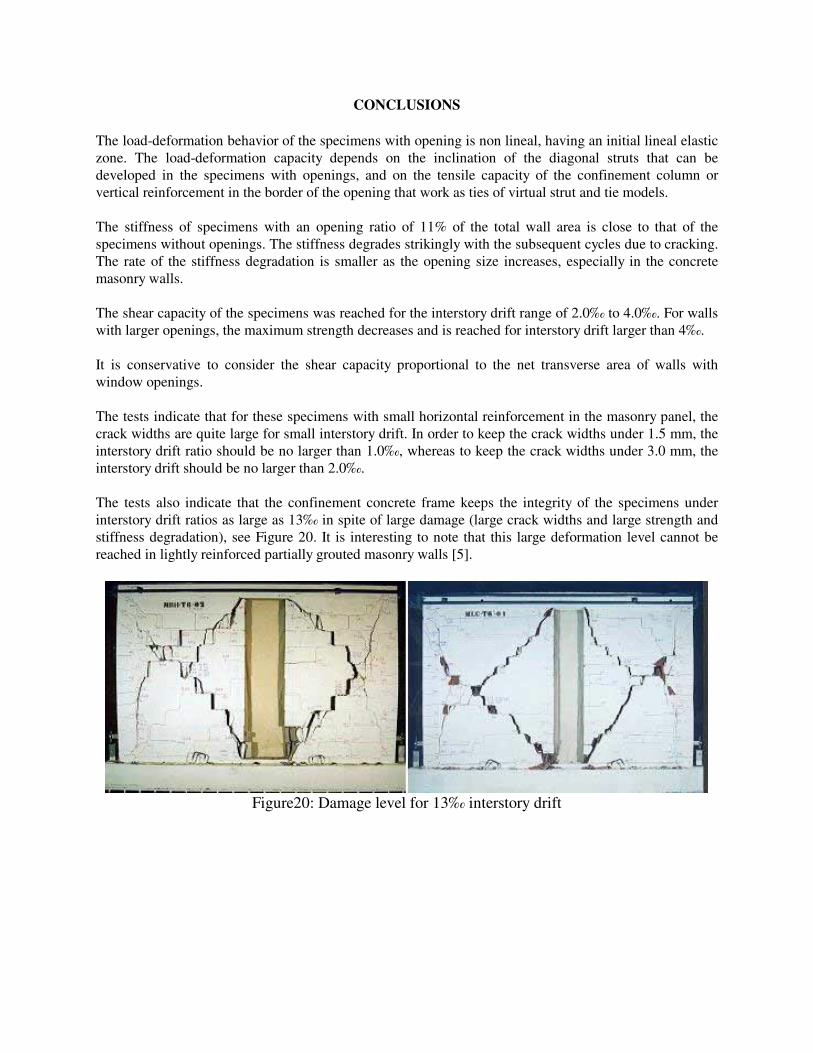
CONCLUSIONS The load-deformation behavior of the specimens with opening is non lineal, having an initial lineal elastic zone. The load-deformation capacity depends on the inclination of the diagonal struts that can be developed in the specimens with openings, and on the tensile capacity of the confinement column or vertical reinforcement in the border of the opening that work as ties of virtual strut and tie models. The stiffness of specimens with an opening ratio of 11% of the total wall area is close to that of the specimens without openings. The stiffness degrades strikingly with the subsequent cycles due to cracking. The rate of the stiffness degradation is smaller as the opening size increases, especially in the concrete masonry walls. The shear capacity of the specimens was reached for the interstory drift range of 2.0‰ to 4.0‰. For walls with larger openings, the maximum strength decreases and is reached for interstory drift larger than 4‰. It is conservative to consider the shear capacity proportional to the net transverse area of walls with window openings. The tests indicate that for these specimens with small horizontal reinforcement in the masonry panel, the crack widths are quite large for small interstory drift. In order to keep the crack widths under 1.5 mm, the interstory drift ratio should be no larger than 1.0‰, whereas to keep the crack widths under 3.0 mm, the interstory drift should be no larger than 2.0‰. The tests also indicate that the confinement concrete frame keeps the integrity of the specimens under interstory drift ratios as large as 13‰ in spite of large damage (large crack widths and large strength and stiffness degradation), see Figure 20. It is interesting to note that this large deformation level cannot be reached in lightly reinforced partially grouted masonry walls [5].
Figure20: Damage level for 13‰ interstory drift
ACKNOWLEDGEMENTS The authors would like to acknowledge the assistance of Victor Águila and Guillermo Sierra, engineers of IDIEM, especially in the design of the tests, and the work of the technicians of IDIEM who participated in this project. They also want to thank CORFO, a governmental agency, for founding this research project through the Innovation and Development Fund (FDI).
REFERENCES [1] Ogaz, O., Experimental study about confined masonry walls with openings and small amount of reinforcement around the opening under cyclic lateral load, Civil Engineering Thesis, Department of Civil Engineering, University of Chile, Santiago, Chile, 2004. Adviser: M. Astroza I. (In Spanish) [2] Guzmán, F., Study of seismic behavior of one and two story masonry low-income housing with mixed type of reinforcement, Civil Engineering Thesis, Department of Civil Engineering, University of Chile, Santiago, Chile, 2002. Adviser: F. Yáñez U. (In Spanish) [3] INN, Norma Chilena Oficial NCh2123.Of1997 : Confined masonry - Requirements for structural design, Instituto Nacional de Normalización, Santiago, Chile, 1997. (In Spanish) [4] INN, Norma Chilena Oficial NCh1928.Of1993 : Reinforced masonry –Requirements for structural design, Instituto Nacional de Normalización, Santiago, Chile, 1993. (In Spanish) [5] Astroza, M., A. Holmberg, C Luders and F. Yáñez, Experimental study of lightly reinforced partially grouted masonry walls under cyclic lateral load, XI Iberoamerican Seminar on Earthquake Engineering, Mendoza, Argentina, 2003. (In Spanish)