Behavior of Composite Steel Bridge Beams Subjected to...
10
TRANSPORTATION RESEARCH RECORD 1223 63 Behavior of Composite Steel Bridge Beams Subjected to Various Posttensioning Schemes WILLIAM E. WILEY, F. WAYNE KLAIBER, AND KENNETH F. DUNKER An initial investigation phase of research on strengthening contin- uous composite bridges by posttensioning has been completed; results are summarized. The effects of various posttensioning schemes were investigated on a one-third-scale continuous three- span composite bridge model. Although various tests performed on the bridge model verified that positive and negative moment regions of continuous composite bridges could be strengthened by posttensioning, the model size prevented the testing of different tendon profile shapes and the necessary hardware. Thus, the pri- mary objective of this research was to investigate the effectiveness of various posttensioning schemes applicable to the negative moment regions of continuous composite bridges through the testing of a full-scale laboratory model. The model was subjected to four dif- ferent posttensioning tendon configurations with and without the use of strengthening angles. Data from the various tests were com- pared to the unstrengthened model to determine the more effective posttensioning arrangement. Data from the various tests were also used to determine the extent of composite action remaining after the concrete deck cracked. Many bridges across the United States have deteriorated so that they are inadequate for original design loads or have been rendered inadequate because of changes in standards of design and maintenance. Approximately half of the bridges in the United States were built before 1940. Many of these bridges were designed for lower traffic volumes, smaller vehi- cles, slower speeds, and lighter loads than they now experi- ence. Frequently, maintenance of these aging bridges has also been inadequate. The FHW A classifies nearly 40 percent of the bridges in the nation as deficient and in need of repair or replacement. Many of these bridges are deficient because their load-carrying capacity is inadequate for today's traffic. Strengthening of deficient bridges is in most instances more economical than posting them for reduced loads or completely replacing them. Improving the live-load capacity of different bridge types has been accomplished by several methods. Research at Iowa State University (ISU) began with strengthening simple-span composite steel-beam and concrete-deck bridges. Postten- sioning was shown to be a viable means of improving the live- load capacity of these bridges (1). Research progressed from laboratory study through field testing (2 ,3) and concluded with a design manual ( 4). Because strengthening of simple- span composite bridges by posttensioning had been successful, extension of the method to continuous composite bridges Department of Civil and Construction Engineering, Bridge Engi- neering Center, Iowa State University, Ames, Iowa 50011. Current affiliation, W. E. Wiley: Burns and McDonnell, P.O. Box 419173, Kansas City, Mo. 64141. appeared promising. Further research at ISU investigated this possibility (5 ,6). To determine how posttensioning could be used to strengthen a continuous composite bridge, Daoud (7) investigated the effects of various posttensioning schemes on a one-third-scale continuous three-span composite bridge model. Provisions were made to posttension both positive and negative moment regions of the bridge model. Because the bridge model was one-third scale, it was not possible to apply posttensioning to the model in the same manner that it would be applied to a real bridge. In the positive moment regions of the model bridge, the posttensioning tendons were located below the bottom flanges of the beams. On an actual bridge, in the positive moment regions tendons would be located a few inches above the bottom flange. In the negative moment regions of the bridge model, the posttensioning tendons were located above the concrete deck, whereas on an actual bridge, neg- ative tendons would be located a few inches below the bottom of the deck in the negative moment regions. Placement of the tendons on the bridge model was acceptable for determination of posttensioning distribution effects even though the tendons would be placed differently on an actual bridge. OBJECTIVES Although various tests performed on the bridge model veri- fied that negative moment region posttensioning could be used to strengthen a continuous composite bridge, it was impossible to test the effects of different tendon profile shapes or positions and the necessary hardware. Thus, the primary objective of this research was to investigate posttensioning schemes applicable to the negative moment regions of con- tinuous composite bridges through testing of a full-scale lab- oratory model. The secondary objectives were to investigate • The extent of composite action in the negative moment region; • The seating losses when the tendons are tensioned; • Changes in tendon force with applied load; and • The effects of adding strengthening angles near the bot- tom flange. LITERATURE REVIEW Klaiber et al. (8) cited over 375 articles on various techniques for strengthening and repairing various types of bridges. Their
-
Upload
trinhhuong -
Category
Documents
-
view
221 -
download
1
Transcript of Behavior of Composite Steel Bridge Beams Subjected to...
TRANSPORTATION RESEARCH RECORD 1223 63
Behavior of Composite Steel Bridge Beams Subjected to Various Posttensioning Schemes
WILLIAM E. WILEY, F. WAYNE KLAIBER, AND KENNETH F. DUNKER
An initial investigation phase of research on strengthening continuous composite bridges by posttensioning has been completed; results are summarized. The effects of various posttensioning schemes were investigated on a one-third-scale continuous threespan composite bridge model. Although various tests performed on the bridge model verified that positive and negative moment regions of continuous composite bridges could be strengthened by posttensioning, the model size prevented the testing of different tendon profile shapes and the necessary hardware. Thus, the primary objective of this research was to investigate the effectiveness of various posttensioning schemes applicable to the negative moment regions of continuous composite bridges through the testing of a full-scale laboratory model. The model was subjected to four different posttensioning tendon configurations with and without the use of strengthening angles. Data from the various tests were compared to the unstrengthened model to determine the more effective posttensioning arrangement. Data from the various tests were also used to determine the extent of composite action remaining after the concrete deck cracked.
Many bridges across the United States have deteriorated so that they are inadequate for original design loads or have been rendered inadequate because of changes in standards of design and maintenance. Approximately half of the bridges in the United States were built before 1940. Many of these bridges were designed for lower traffic volumes, smaller vehicles, slower speeds, and lighter loads than they now experience. Frequently, maintenance of these aging bridges has also been inadequate. The FHW A classifies nearly 40 percent of the bridges in the nation as deficient and in need of repair or replacement. Many of these bridges are deficient because their load-carrying capacity is inadequate for today's traffic. Strengthening of deficient bridges is in most instances more economical than posting them for reduced loads or completely replacing them.
Improving the live-load capacity of different bridge types has been accomplished by several methods. Research at Iowa State University (ISU) began with strengthening simple-span composite steel-beam and concrete-deck bridges. Posttensioning was shown to be a viable means of improving the liveload capacity of these bridges (1). Research progressed from laboratory study through field testing (2 ,3) and concluded with a design manual ( 4). Because strengthening of simplespan composite bridges by posttensioning had been successful, extension of the method to continuous composite bridges
Department of Civil and Construction Engineering, Bridge Engineering Center, Iowa State University, Ames, Iowa 50011. Current affiliation, W. E. Wiley: Burns and McDonnell, P.O. Box 419173, Kansas City, Mo. 64141.
appeared promising. Further research at ISU investigated this possibility (5 ,6).
To determine how posttensioning could be used to strengthen a continuous composite bridge, Daoud (7) investigated the effects of various posttensioning schemes on a one-third-scale continuous three-span composite bridge model. Provisions were made to posttension both positive and negative moment regions of the bridge model. Because the bridge model was one-third scale, it was not possible to apply posttensioning to the model in the same manner that it would be applied to a real bridge. In the positive moment regions of the model bridge, the posttensioning tendons were located below the bottom flanges of the beams. On an actual bridge, in the positive moment regions tendons would be located a few inches above the bottom flange. In the negative moment regions of the bridge model, the posttensioning tendons were located above the concrete deck, whereas on an actual bridge, negative tendons would be located a few inches below the bottom of the deck in the negative moment regions. Placement of the tendons on the bridge model was acceptable for determination of posttensioning distribution effects even though the tendons would be placed differently on an actual bridge.
OBJECTIVES
Although various tests performed on the bridge model verified that negative moment region posttensioning could be used to strengthen a continuous composite bridge, it was impossible to test the effects of different tendon profile shapes or positions and the necessary hardware. Thus, the primary objective of this research was to investigate posttensioning schemes applicable to the negative moment regions of continuous composite bridges through testing of a full-scale laboratory model. The secondary objectives were to investigate
• The extent of composite action in the negative moment region;
• The seating losses when the tendons are tensioned; • Changes in tendon force with applied load; and • The effects of adding strengthening angles near the bot
tom flange.
LITERATURE REVIEW
Klaiber et al. (8) cited over 375 articles on various techniques for strengthening and repairing various types of bridges. Their
64
report included 33 examples of how posttensioning could be applied to single- and multiple-span bridges of steel, concrete , and composite construction. The report discussed several effects that should be considered before a bridge is strengthened by posttensioning as well as the resulting advantages. A careful analysis should be made to ensure that posttensioning forces and moments do not introduce unwanted effects. These unwanted effects include concrete cracking, additional or new overs tresses at critical locations, localized buckling of the flanges or web, longitudinal and transverse distribution effects, or a significant reduction in the overall factor of safety for the bridge. Only a brief literature review has been included in this paper. Readers who are interested in a more detailed review of the literature are referred to papers by Wiley (6) and Klaiber et al. (8) .
In 1964, Tachibana et al. (9) conducted an experimental investigation by strengthening two-span composite beam models representative of a double girder bridge. One of the beams was prestressed before the concrete deck was cast, and the second beam was prestressed after the deck had been cast and cured. The magnitude of load producing a plastic hinge at the support was slightly higher for the first beam than for the second.
Strengthening and rehabilitation completed in 1979 on the Pit River Bridge and Overhead on I-5 in Shasta County, California (10,11), made use of prestressing tendons and compression bars. The 24-in .-deep wide-flange stringers were strengthened in negative moment regions by placing straight prestressing tendons near the top flanges of the beams and compression bars on top of the bottom flanges.
In 1981, Grace (12) investigated the transverse and longitudinal distribution of deflection and moment in two scalemodel bridges. One of the model bridges was allowed to crack over the center support, while a portion of the second model's concrete deck at the center support was prestressed . Results of this investigation indicated that prestressing could be used to control cracking of the concrete deck at the center support.
Alternative designs for new bridge structures have made efficient use of prestressed steel and prestressed composite concrete and steel members . In 1982, this type of construction was used on the Bonners Ferry Bridge in Idaho (13). The 10-span, continuous, cable-stressed composite concrete and steel structure was presented as an alternative to prestressed concrete design. As a result, considerable savings were realized in construction costs by reducing the weight of materials in the entire structure. In the Bonners Ferry Bridge, prestressing was used in both positive and negative moment regions on the plate girder beams. In addition to longitudinal prestressing, the bridge's concrete deck was prestressed transversely along the bridge's entire length.
In 1985, Preston (14) gave three examples of prestressing techniques that have been used in New Zealand to strengthen reinforced concrete bridge superstructures. These examples included prestressing a simple span with cables deflected at midspan, prestressing a continuous bridge with straight cables located as close as practical to the neutral axis of the section, and prestressing a continuous bridge with deflected cables.
In 1986, Troitsky et al. (15) compared the effects of six different cable configurations by testing a 1/20-scale plexiglas model of a two-span plate girder bridge with an orthotropic steel deck. Experimental results were compared to an ana-
TRANSPORTATION RESEARCH RECORD 1223
lytical study. Of the cable configurations used, the authors indicated that where negative dead-load moment governs the design, the harped cable configuration exhibited relatively optimal results.
In 1988, at the University of Maryland, Ayyub (16) discussed the results of tests on full-scale, prestressed composite T-beams subjected to negative moment. The authors indicated that posttensioning beams in this manner significantly increased both the yield and ultimate load capacity of the beam. The posttensioning also placed the concrete slab in compression, which delayed cracking, reduced tensile stresses in the concrete under service loads, and reduced deflections .
LABORATORY MODEL AND INSTRUMENTATION
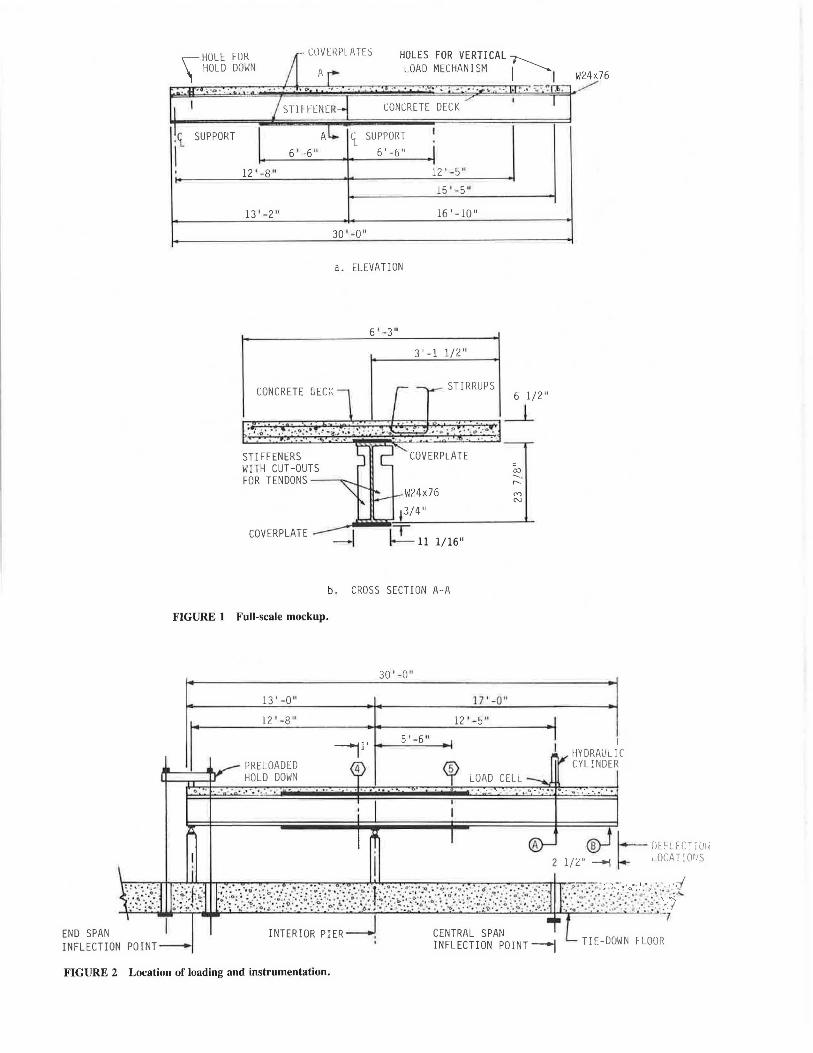
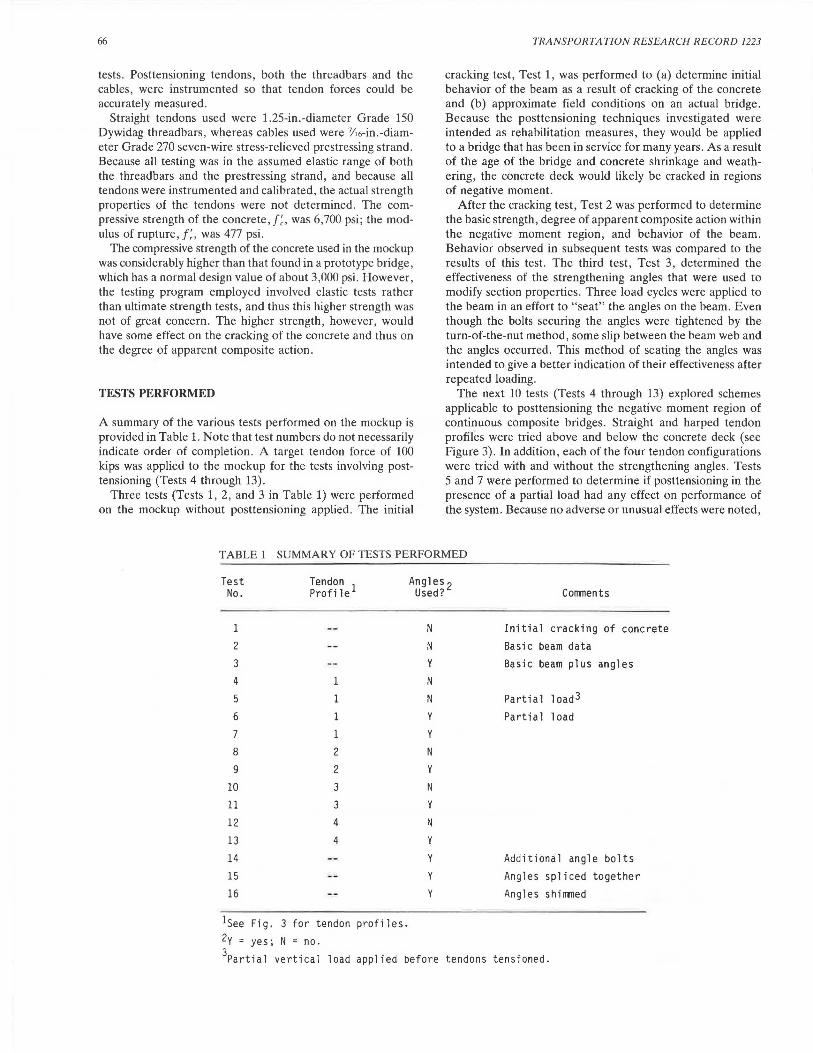
Proper modeling of posttensioned negative moment regions (i.e., the portion of a bridge between inflection points adjacent to an interior pier when the bridge is under uniform load) of a continuous composite bridge required construction of a full-scale model of that portion of a bridge, hereafter referred to as the mockup. The mockup simulated the negative moment region of an interior stringer of a 150-ft, three-span Iowa Department of Transportation (DOT) VIZ-series bridge. General dimensions of the mockup and the loading mechanism are shown in Figures 1 and 2. Overall length of the mockup was limited by laboratory space; the concrete deck width, 6 ft 3 in., was determined by using the AASHTO effective flange width requirements for an interior stringer of a prototype bridge (17).
The rolled steel beam in the mockup was a W 24 x 76, identical to that used for interior stringers in the 150-ft Iowa DOT V12-series bridges . Although coverplates on a 150-ft Vl2 bridge extend 9.5 ft on each side of a pier support centerline, the coverplates on the mockup were restricted to a shorter length because of posttensioning jack clearances. Coverplate thickness and width were chosen to match the depth and moment of inertia of an interior beam in the prototype bridge. Angle-plus-bar shear connectors similar to those on the prototype bridge were used for shear connection.
The deck thickness, 6.5 in., shown in Figure lb, duplicated that of Vl2 bridge decks. Holes (3 in. in diameter) shown in Figure la were provided in the deck of the mockup to allow passage of the hold-down and loading mechanisms. Two blackouts were provided in the concrete deck for passage of the above-deck harped cables through the deck and for simplified attachment of the above-deck straight tendon anchorages. Reinforcing provided in the concrete deck, both in size and spacing, was duplicated from the Vl2 bridge series.
The load mechanism produced a negative moment in the mockup similar to that at an interior support within a real bridge. Strain gauges were mounted on the top and bottom flanges and coverplates at several sections along the steel beam. Two of the instrumented sections, Sections 4 and 5, are shown in Figure 2. Vertical deflections were measured at the load point and at the cantilevered end of the beam at Points A and B respectively . Strengthening angles similar to those used by the Iowa DOT to modify section properties and reduce live-load stresses were instrumented and bolted to the beam web just above the bottom flange in eight of the
.. I
~HOLi: FOR HOLD DOWN I /\. i
HOLES FOR VERTICAL ~ LOAD ME CHANISM I I
_; ~ ·O~ ·o •, '
I I
~~ SUPPORT
I '
.. . · ' .. . .. .. ..... . .. . ... _ .. . . _'to
I 51 IH-tNER-j CONCRETE DECK ./
Al. 1. SUPPORT I
6' ·6'' 6'-6" I 1
12' -8" 12'-5"
15'-5 "
13' -2" 16 '-10"
30 '-0"
a. ELEVATION
CONCRETE ucc:;
STIFFENERS WITH CUT-OUTS FOR TENDONS --....._ 1
COVERPLATE
6 ' - 3"
3'-1 1/2"
STIRRUPS
1/ 16"
b. CROSS SECTION A-A
.. •' " .. · ·•· ~n;:-i
•
("')
N
I
FIGURE 1 Full-scale mockup.
13' -0"
12 ' -8"
PRELOADED HOLD DOWN .... · .. . ·
--v
30' -0"
17' -0"
i2 '-5 ''
5 '-6"
LOAD CELL
W24x 76
I HYDRAULIC CYLINDER
A
2 l/Z"~ ~ fiE~LE(T)(!li
' OCAT '. QllS
;:~:.\):~ ~~ :}//.\~.~-~<L\~:·?t)?~:~;~{;}}~:.<"d.~~{///i. U~?\/ END SPAN INFLECTION POINT____..
INTERIOR PIER__.! TIE-DOWN ~LOOR
FIGURE 2 Location of loading and instrumentation.
66
tests. Posttensioning tendons, both the threadbars and the cables, were instrumented so that tendon forces could be accurately measured.
Straight tendons used were 1.25-in.-diameter Grade 150 Dywidag threadbars, whereas cables used were 7/16-in.-diameter Grade 270 seven-wire stress-relieved prestressing strand. Because all testing was in the assumed elastic range of both the threadbars and the pres tressing strand, and because all tendons were instrumented and calibrated, the actual strength properties of the tendons were not determined. The compressive strength of the concrete, f~, was 6,700 psi; the modulus of rupture, f;, was 477 psi .
The compressive strength of the concrete used in the mockup was considerably higher than that found in a prototype bridge, which has a normal design value of about 3,000 psi. However, the testing program employed involved elastic tests rather than ultimate strength tests, and thus this higher strength was not of great concern. The higher strength, however, would have some effect on the cracking of the concrete and thus on the degree of apparent composite action.
TESTS PERFORMED
A summary of the various tests performed on the mockup is provided in Table 1. Note that test numbers do not necessarily indicate order of completion. A target tendon force of 100 kips was applied to the mockup for the tests involving posttensioning (Tests 4 through 13).
Three tests (Tests 1, 2, and 3 in Table 1) were performed on the mockup without posttensioning applied. The initial
TRANSPORTATION RESEARCH RECORD 1223
cracking test, Test 1, was performed to (a) determine initial behavior of the beam as a result of cracking of the concrete and (b) approximate field conditions on an actual bridge. Because the posttensioning techniques investigated were intended as rehabilitation measures, they would be applied to a bridge that has been in service for many years. As a result of the age of the bridge and concrete shrinkage and weathering, the concrete deck would likely be cracked in regions of negative moment.
After the cracking test, Test 2 was performed to determine the basic strength, degree of apparent composite action within the negative moment region, and behavior of the beam. Behavior observed in subsequent tests was compared to the results of this test. The third test, Test 3, determined the effectiveness of the strengthening angles that were used to modify section properties. Three load cycles were applied to the beam in an effort to "seat" the angles on the beam. Even though the bolts securing the angles were tightened by the turn-of-the-nut method, some slip between the beam web and the angles occurred. This method of seating the angles was intended to give a better indication of their effectiveness after repeated loading.
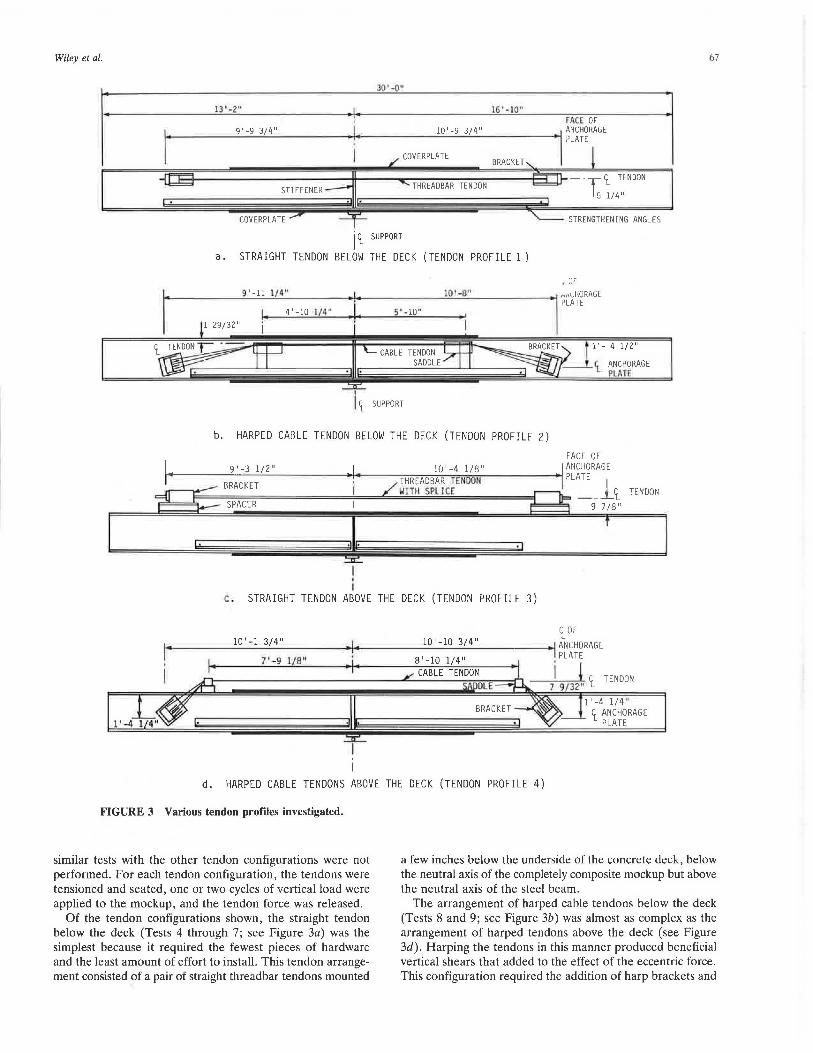
The next 10 tests (Tests 4 through 13) explored schemes applicable to posttensioning the negative moment region of continuous composite bridges. Straight and harped tendon profiles were tried above and below the concrete deck (see Figure 3). In addition, each of the four tendon configurations were tried with and without the strengthening angles. Tests 5 and 7 were performed to determine if posttensioning in the presence of a partial load had any effect on performance of the system. Because no adverse or unusual effects were noted,
TABLE 1 SUMMARY OF TESTS PERFORMED
Test No.
2
3
4
5
6
7
8
9
10
11
12
13
14
15
16
Tendon Profile 1
2
2
3
3
4
4
lsee Fig. 3 for tendon profiles. 2y =yes; N =no.
Angles 2 Used?
N
N y
N
N
y
y
N y
N
y
N y
y
y
y
Corrrnents
Initial cracking of concrete Basic beam data Basic beam plus angles
Partial load3 Partial load
Additional angle bolts Angles spliced together Angles shirrrned
3Partial vertical load applied before tendons tensioned.
Wiley el al.
JO' -o•
13. ·2" 16' -10"
9'-9 3/4" .1. 10'-9 3/4"
BRACKET
THREADBAR TENDON
i '!_ SUPPORT
a. STRAIGHT TENDON BELOW THE DECK (TENDON PROFILE 1)
-·T'i_ HNDON
I 5 1/4"
STRENGTHENING ANGLES
, OF
--------'9'-'-·l_l_.-'-1/_4_" ____________ l""O_' --'8_" ______ P~A~~RAGE
lo 4'-10 J/4" I! 1 29/32" i
5' -10"
CABLE TENDON SADDLE
b. HARPED CARLE TENDON BELOW THE DECK (TENDON PROFILE 2)
l'-41/2"
t ANCHORAGE PLATE
FACE OF 9'-3 1/2" 10'-4 1/8" ANCHORAGE
14-------'--"-"------~---,/~T~HR~E~A~DB~A~R~T=E=N;;.,r..,N------+IPLATE l BRACKET WITH SPLICE =IJ ..r--i,_ - - 'i_ SPACER ~ 9 7/8"
TENDON
-~ I ' I
c. STRAIGHT TENDON ABOVE THE DECK (TENDON PROFILE 3)
d. HARPED CABLE TENDONS ABOVE THE DECK (TENDON PROFILE 4)
r
l'-4 1/4 " 'i_ ANCHORAGE
PLATE
FIGURE 3 Various tendon profiles investigated.
67
similar tests with the other tendon configurations were not performed. For each tendon configuration, the tendons were tensioned and seated, one or two cycles of vertical load were applied to the mockup, and the tendon force was released.
a few inches below the underside of the concrete deck, below the neutral axis of the completely composite mockup but above the neutral axis of the steel beam.
Of the tendon configurations shown, the straight tendon below the deck (Tests 4 through 7; see Figure 3a) was the simplest because it required the fewest pieces of hardware and the least amount of effort to install. This tendon arrangement consisted of a pair of straight threadbar tendons mounted
The arrangement of harped cable tendons below the deck (Tests 8 and 9; see Figure 3b) was almost as complex as the arrangement of harped tendons above the deck (see Figure 3d). Harping the tendons in this manner produced beneficial vertical shears that added to the effect of the eccentric force. This configuration required the addition of harp brackets and

68
the use of three cables on each side of the beam web. The anchorage and the harp brackets were bolted in pairs to the web of the steel beam (one on each side). Tensioning the cables was a three-stage process because the cables were tensioned in pairs to simulate probable field procedures.
A single threadbar tendon was used above the concrete deck (Tests 10 and 11; see Figure 3c). Because the threadbar and anchorage brackets protruded above the level of the concrete, this posttensioning configuration was deemed impractical for a field application. However, placing the tendon above the concrete deck put it well above the neutral axis of the completely composite beam and yielded a useful comparison to the work by Daoud (7). If the brackets and tendons could be embedded in the concrete deck, this configuration could be used in the field.
Placing the harped cable tendons above the deck (Tests 12 and 13; see Figure 3d), was the most complex tendon configuration attempted. A pair of anchorage brackets was bolted to the beam web below the deck and the harp brackets were bolted to the top flange inside the deck blockouts. Although the cables were above the deck for this configuration, in an actual bridge, embedding the harps and cables in the deck would be easier than embedding a threadbar and anchorages. Harping the cables above the deck produced larger vertical shear and placed the axial force above the neutral axis of the composite beam. Again, because three cables were used on each side of the web, tensioning was a three-stage process .
Several schemes to reduce the observed shear lag problems in the strengthening angles, as a result of the angles' discontinuity around the bearing stiffener at the center support, were investigated. For Test 14, extra bolts were installed near the bearing stiffener. For Test 15, a splice was added around the bearing stiffener. For Test 16, shims were wedged into the space between the ends of the strengthening angles and the bearing stiffener .
ANALYTICAL MODELS AND CALCULATIONS
The Iowa DOT V12-series bridges and the mockup were constructed by using shear connectors to provide composite action between the steel beam and the concrete deck. However, the bridges and thus the mockup were designed on the assumption that only the steel beam would carry load in the negative moment regions. This assumption implies that although the bridges and the mockup were built compositely , composite action was neglected in the negative moment region.
To determine the extent of composite action remaining after the deck had cracked, experimental data were compared to analytical results from two theoretical models. The noncomposite model assumed that only the W 24 x 76 beam and coverplates resisted the applied posttensioning forces and vertical load. In the completely composite model, the reinforced concrete and the steel beam were assumed to act together. Section properties of the completely composite model were based on uncracked concrete transformed into an equivalent area of steel.
In the manual calculations, it was assumed that a linear distribution of strain existed at each cross section, that superposition was valid, and that secondary posttensioning effects were negligible. Finite element modeling was also used. The simple beam, finite element model was a line of beam ele-
TRANSPORTATION RESEARCH RECORD 1223
ments. The composite finite element model used beam elements for the steel beam , plate elements for the concrete deck, and rigid links for the shear connectors .
DATA INTERPRETATION
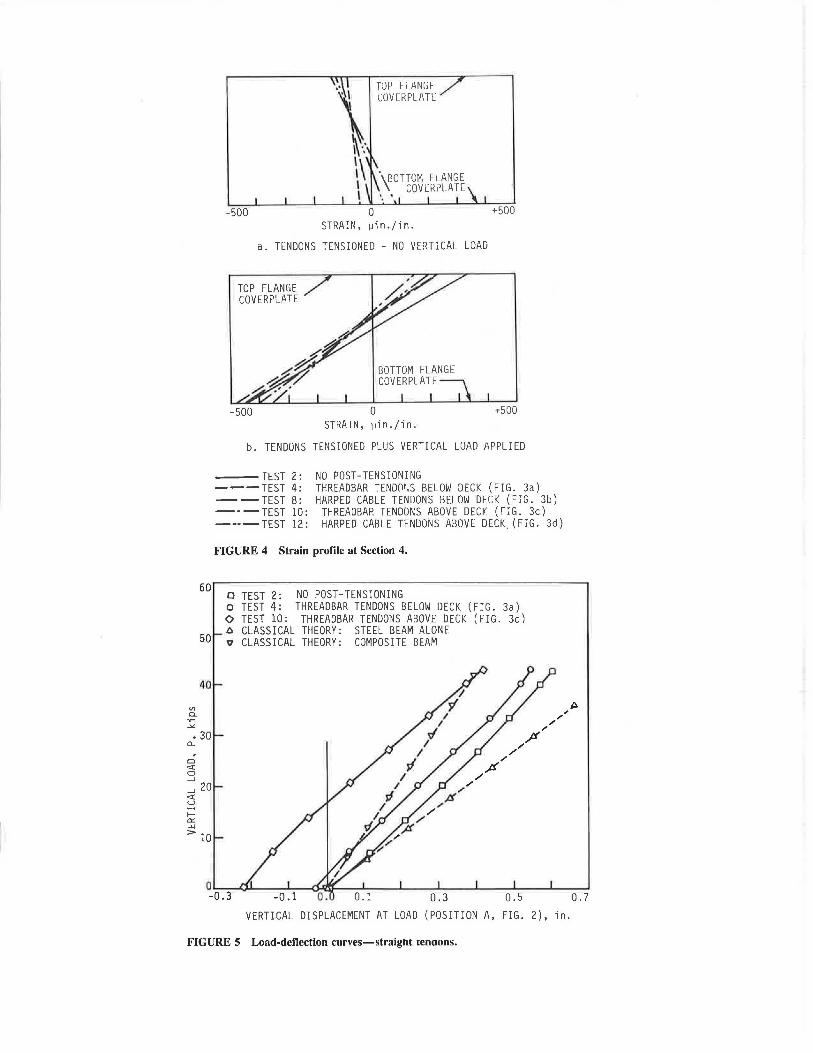
As previously noted, vertical load during the first test cracked the concrete deck of the mockup to simulate field conditions in a real bridge. Three cycles of vertical load, each with a larger peak load, produced several transverse cracks in the deck of the mockup and a permanent 0.28 in. deflection at the load point. Test 2 established the strain and deflection characteristics of the unstrengthened mockup after the deck had cracked. The effects of adding the strengthening angles were determined in Test 3.
Figure 4 presents the strain profiles at Section 4. Top and bottom coverplate experimental strains are plotted and connected by a straight line for those tests conducted without the presence of the strengthening angles. The straight line connecting the top and bottom flange strains was intended only to help differentiate between the results from each test , and was not intended to indicate the strain distribution. Strains measured in all the tests were bracketed by the strains predicted by the analytical models, which indicated that partial composite action still existed within the mockup after the deck cracked.
Strain profiles at Section 4 resulting from posttensioning are shown in Figure 4a. All four of the tendon profiles produced beneficial compressive strain in the top flange; however, only the above-deck schemes (Tendon Profiles 3 and 4) produced beneficial tension in the bottom flange.
Figure 4b shows strain profiles at Section 4 after vertical load was applied to the mockup . Test 2, the unstrengthened mockup, was the basic condition to which results of the other tests were compared. All of the posttensioning tendon configurations reduced the top flange tensile strains. Posttensioning below the deck slightly increased bottom flange compressive strains, whereas posttensioning above the deck reduced them.
Shown in Figures 5 and 6 are load-deflection curves for the tests without the strengthening angles. Theoretical loaddeflection curves for both of the unstrengthened analytical models are also shown on each plot . The results from Test 2, shown in Figure 5, lie approximately midway between the two theoretical curves, again indicating partial composite action within the mockup after the deck had cracked . Each of the posttensioning tendon schemes produced an uplift of the cantilevered end of the mockup while it was being tensioned and before vertical load was applied. The above-deck tendon schemes produced larger uplifts than the below- deck schemes because of the larger tendon-to-mockup centroid eccentricities. Because the curves for the posttensioned tests are essentially parallel to the Test 2 curve, it can be concluded the posttensioning did not significantly change the stiffness of the mockup. Load-deflection curves for the tests with the strengthening angles in use (although not included in this paper) had steeper slopes than the corresponding tests without the angles. Thus, as one would expect, addition of the strengthening angles did stiffen the mockup.
After the beam was posttensioned, any change in deflection of the beam caused a change in the tendon force. Figure 7
"' 0.. ·~
""""
60
50
40
• 30 c.
Cl ex: 0 _J
_J 20 ex: u .... lo::: LLI
> 10
- 500 0 STRAIN, pin.Jin.
a. TENDONS ~ENSIONED - NO VERTICAL LOAD
TOP FLANGE COVERPLATE
-500
BOTTOM FLANGE COVERPLATE
0 STRAIN, pin . Jin.
+500
+500
b. TENDONS TENSIONED PLUS VERTICAL LOAD APPLIED
---TEST 2: NO POST - TENS ION I NG ---TEST 4: THREADBAR TENDm;S BELOW DECK (FIG. 3a) --TEST 8: HARPED CABLE TENDONS BELOW DECK (FIG . 3b) ---TEST 10: THREADBAP. TENDONS ABOVE DECI<'. (FIG. 3c) ----TEST 12: HARPED CABLE TENDONS ABOVE DECK. (FIG. 3d)
FIGURE 4 Strain profile at Section 4.
o TEST 2: NO POST-TENSIONING o TEST 4: THREADBAR TENDONS BELOW DECK (FIG. 3a) 0 TEST 10: THREADBAR TENDONS ABOVE DECK (FIG. 3c) c. CLASSICAL THEORY: STEEL BEAM ALONE v CLASSICAL THEORY: COMPOSITE BEAM
0 L----CJ.L---'----cl-'l"l"l'-----'--..L..---1---'-----L--..L...---' -0. 3 0. 1 0 . 3 0. 5 0 . 7
VERTICAL DISPLACEMENT AT LOAD (POSITION A, FIG. 2), in.
FIGURE 5 Load-deflection curves-straight cenaons.

50
40
c: 30
Cl c:( 0 _J
ex! 20 lJ ~
f--0:: w >
10
D TEST 8: HARPED CABLE TENDONS BELOW DECK (FIG: 3b) o TEST 12 : HARPED CABLE TENDONS ABOVE DECK (FIG. 3d t::. CLASSICAL THEORY : STEEL BEAM ALONE /' Q CLASSICAL THEORY : COMPOSITE BEAM /
Jt/ ,,
-0.1 VERTICAL DISPLACEMENT 2 1/2 in. FROM CANTILEVER END (POSITION B, FIG. 2), in.
FIGURE 6 Load-deflection curves-harped tendons.
V> Cl.
~
f--
~ lJ 0:: 0 u...
z: 0 Cl z: w f--
100
90
80
o TEST 4: THREADBAR TENDONS BELOW DECK (FIG. 3a) o TEST 8: HARPED CABLE TENDONS BELOW DE CK (FIG. 3b) 0 TEST 10: THREADBAR TENDONS ABOVE DECK (FIG. Jc) o TEST 12: HARPED CABLE TENDONS ABOVE DECK (FIG. 3d)
20 40 VERTICAL LOAD, P, kips
FIGURE 7 Change in tendon force due to vertical loading.

Wiley et al.
illustrates the variation in posttensioning tendon force with applied vertical load for the tests without the strengthening angles in use. Because of difficulties encountered with the cable anchoring chucks, the total force in the cable tendons was about 90 percent of the force in the thread bars below the deck. As shown in Figure 7, for all tendon configurations, tendon force increased as vertical load was applied. Tendon force increased more rapidly for the straight threadbars (Tendon Profiles 1 and 3) than for the harped cables (Tendon Profiles 2 and 4) and the tendon force increased more rapidly when the tendons were above the deck (Tendon Profiles 3 and 4) than when below (Tendon Profiles 1 and 2) . The presence of the strengthening angles also caused the tendon force to increase more rapidly. Seating losses, the difference between maximum tendon force and tendon force after the tensioning jacks had been released, was less than 5 percent for the threadbars but ranged from 10 percent to 18 percent for the cable tendons. The high seating losses were primarily due to the short length of the cable tendons.
Addition of the strengthening angles shifted the neutral axis of the mockup downward and increased the moment of inertia. This resulted in a decrease in the bottom flange strains and essentially no change in the top flange strains. Because of the increase in the moment of inertia, total deflections were also slightly reduced. For those tests with posttensioning, the strengthening angles enhanced the effects of the posttensioning. Because the angles were not continuous over the center support and the flanges of the angles did not bear against the bearing stiffener, shear lag effects were evident at Section 4 near the center support. Tests 14, 15, and 16 indicated that restoring continuity around the bearing stiffener increased the
71
effectiveness of the angles near the center support, where they were most needed.
As previously noted in an actual bridge, the concrete deck in the negative moment region over an interior support cracks because of traffic, weathering, and other time effects. When the deck cracks, the concrete becomes discontinuous, and the steel beam and deck no longer act in a completely composite sense. However, tension stress in the concrete transfers to the reinforcing bars, and some composite action theoretically still exists . Testing the mockup provided an opportunity to determine the degree of apparent composite action that remains when the concrete deck cracks. The apparent composite action was determined by comparing experimental strains and deflections to data from the simple steel and completely composite analytical models.
Table 2 summarizes the low, high, and average values of apparent composite action calculated from both strain and deflections for different groups of tests. Each group includes data common to one measurement-strain at a particular section or deflection at a particular point-and one analysis method-manual calculations or finite element analysis. Although a large amount of experimental scatter was evident from the range of high and low values for each group, the average values for all the groups fell within the range of 50 to 70 percent.
Both the manual and finite element analytical methods gave comparable predictions of strains and deflections. The finite element method has the advantage of more quickly modeling and analyzing different geometries and load cases. Neither the simple steel beam nor the completely composite analytical model was accurate at predicting strains or deflections, but
TABLE 2 RANGE AND AVERAGE PERCENT OF APPARENT COMPOSITE ACTION
% Apparent Composite Action
Data Analysis Low Hi gh Average Tes t 2 Group Utilized Method Value Value Value Value Tests Included
Strains at Sec . 4a CTMb 39 81 58 62 2, 3, 4, 5' 6, 7. 8, 9, 10, 11, 12
2 Strai ns at Sec. 4 CTM 61 81 68 62 2, 4, 8, 10, 12
3 Stra i ns at Sec. 4 FEMC 63 81 69 63 2, 4, 8 , 10, 12
4 Strains at Sec. 5 CTM 40 90 65 54 2, 3, 4, 5, 6, 7, 8, 9, 12. 13
5 Strains at Sec. 5 CTM 40 58 51 54 2, 4, 8, 12
6 Strains at Sec. 5 FEM 49 53 51 53 2, 4, 8, 12
7 Deflecti ons at Pt. A CTM 35 48 42 48 2, 3
8 Defl ec tion s at Pt . A FEM 35 79 60 68 2, 4, 10
9 Deflections at Pt . B FEM 58 88 69 8, 10. 12
aSee Figure 2 fo r location of sections and deflection points . bClassical theory method. cFinite element method.

72
they did provide definite boundaries for both strain and deflection.
SUMMARY AND CONCLUSIONS
This paper discusses the results of an experimental investigation to determine the feasibility and effectiveness of posttensioning the negative moment region of continuous composite bridges. A full-scale model of an interior stringer within a bridge was constructed. The model was load tested and four different posttensioning tendon configurations were investigated with and without the use of strengthening angles. Data from the tests with posttensioning were compared to results from a test on the unstrengthened model. Experimental data were compared to analytical calculations to determine the extent of composite action that remained after the concrete deck had cracked .
The following conclusions were drawn:
• Posttensioning, with either harped cable or straight threadbar tendon arrangements, can be used to strengthen negative moment regions.
• Even though force in the harped cable tendons was about 90 percent of that in the threadbars, the cables produced about the same changes in strains and deflections in the composite beam. Thus, the vertical shears created when the cables were harped compensated for the lower cable force.
• The threadbar tendons were simpler and easier to install than the harped cable tendons.
• Tendon force increased when vertical load (simulated live load) was applied for all the posttensioning tendon configurations. Rate of increase was dependent on tendon level, tendon profile, and the presence of the strengthening angles.
• Strengthening angles can be used along with posttensioning to reduce strain in the compression flange. The angles are subject to shear Jag and should be well developed at critical stress locations. When fully developed and used with posttensioning, they enhance the posttensioning effects.
• The mockup displayed from 50 to 70 percent apparentcomposite action in negative moment bending.
ACKNOWLEDGMENTS
Research for this paper was sponsored by the Iowa Highway Research Board and the Highway Division, Iowa DOT. The support, cooperation, and counseling of Iowa DOT engineers William A. Lundquist and John P. Harkin were much appreciated. Special thanks are accorded to the numerous students who assisted with various phases of the project.
REFERENCES
1. F. W. Klaiber, K. F. Dunker, and W.W. Sanders, Jr. Feasibility Study of Strengthening Existing Single Span Steel Beam Concrete
TRANSPORTATION RESEARCH RECORD 1223
Deck Bridges. ERI Project 1460, ISU-ERI-Ames-81251, Final Report. Engineering Research Institute, Iowa State University, Ames, 1981.
2. F. W. Klaiber, D. J. Dedic, K. F. Dunker, and W.W. Sanders, Jr. Strengthening of Existing Single-Span Steel Beam and Concrete Deck Bridges, Part I. ERI Project 1536, ISU-ERI-Ames-83185, Final Report. Engineering Research Institute , Iowa State University, Ames, 1983.
3. K. F. Dunker, F. W. Klaiber, B. L. Beck, and W. W. Sanders, Jr. Strengthening of Existing Single-Span Steel Beam and Concrete Deck Bridges, Part II. ERI Project 1536, ISU-ERI-Ames-85231, Final Report. Engineering Research Institute, Iowa State University, Ames , 1985.
4. K. F. Dunker, F. W. Klaiber , and W. W. Sanders, Jr. Design Manual for Strengthening Single-Span Composite Bridges by Pas/Tensioning, Part Ill. ERi Project 1536, ISU-ERI-Ames-85229, Final Report. Engineering Research Institute, Iowa State University, Ames, 1985.
5. K. F. Dunker, F. W. Klaiber, F. K. Daoud, W. E. Wiley, and W. W. Sanders, Jr. Strengthening of Existing Cominuous Composite Bridges, ERI Project 1846, ISU-ERI-Ames-88007, Final Report. Engineering Research Institute, Iowa State University, Ames, 1987.
6. W. E. Wiley . Post-Tensioning of Composite T-Beams Subjected to Negative Moment. M.S. thesis, Iowa State University, Ames, 1988.
7. F. K. Daoud. Experimental Strengthening of a Three-Span Composite Model Bridge by Post-Tensioning. M.S. thesis. Iowa State University, Ames, 1987.
8. F. W. Klaiber, K. F. Dunker, T. J. Wipf, and W.W. Sanders, Jr. Methods of Strengthening Existing Highway Bridges. NCHRP Report 293: TRB, National Research Council, Washington , D.C., 1987, 114 pp.
9. Y. Tachibana, K. Kondo, and K. Ito. Experimemal Study on Composite Beams Prestressed with Wire Cables. Final Report. International Association for Bridge and Structural Engineering, 7th Congress , Rio de Janeiro, Brazil, Aug. 10-16, 1964.
10. G.D. Mancarti. Resurfacing, Restoring and Rehabilitating Bridges in California. Proc., International Conference on Short and Medium Span Bridges, Toronto, Ontario, Canada, Aug. 8-12, 1982.
11. G.D. Mancarti. Strengthening California's Steel Bridges by Prestressing. In Transportation Research Record 950, TRB , National Research Council, Washington, D.C., 1984, pp. 183-187.
12. N. F. F. Grace. Effect of Prestressing the Deck in Continuous Bridge of Composite Construction. M.A. Sci . thesis. University of Windsor, Windsor, Ontario, Canada, 1981.
13. C. Seim. Steel Beats Concrete for Idaho Bridge. Civil Engineering, Vol. 53, No. 8, Aug. 1983, pp. 28-32.
14. R. L. Preston. Strengthening Methods for Bridge Superstructures. National Roads Board, Wellington , New Zealand, 1985.
15. M. S. Troitsky , Z. A. Zielinski, and M. S. Pimprikar. Experimental Evaluation of Prestressed Steel and Plate Girder Bridges. Proc., Experimental Assessment of Performances of Bridges, ASCE, Boston, Mass., Oct. 27 , 1986, pp. 1-6.
16. B. M. Ayyub , Y. G. Sohn, and H . Saadatmanesh. Static Strength of Prestressed Composite Steel Girders. Final Report to National Science Foundation. Department of Civil Engineering, University of Maryland, College Park, May 1988.
17. Standard Specifications for Highway Bridges, 13th ed. AASHTO, Washington, D.C., 1983.
Publication of this paper sponsored by Committee on Steel Bridges.