Behavior of Adhesive Materials in Screening Devices for ...
76
Behavior of Adhesive Materials in Screening Devices for Paper Recycling Bradley E. Lucas Co-chairs: R. A. Venditti and H. Jameel Committee: S. A. Khan and M. A. Hubbe December 10, 2003
Transcript of Behavior of Adhesive Materials in Screening Devices for ...

Behavior of Adhesive Materials
in Screening Devices for Paper
Recycling
Bradley E. Lucas
Co-chairs: R. A. Venditti and H. Jameel
Committee: S. A. Khan and M. A. Hubbe
December 10, 2003

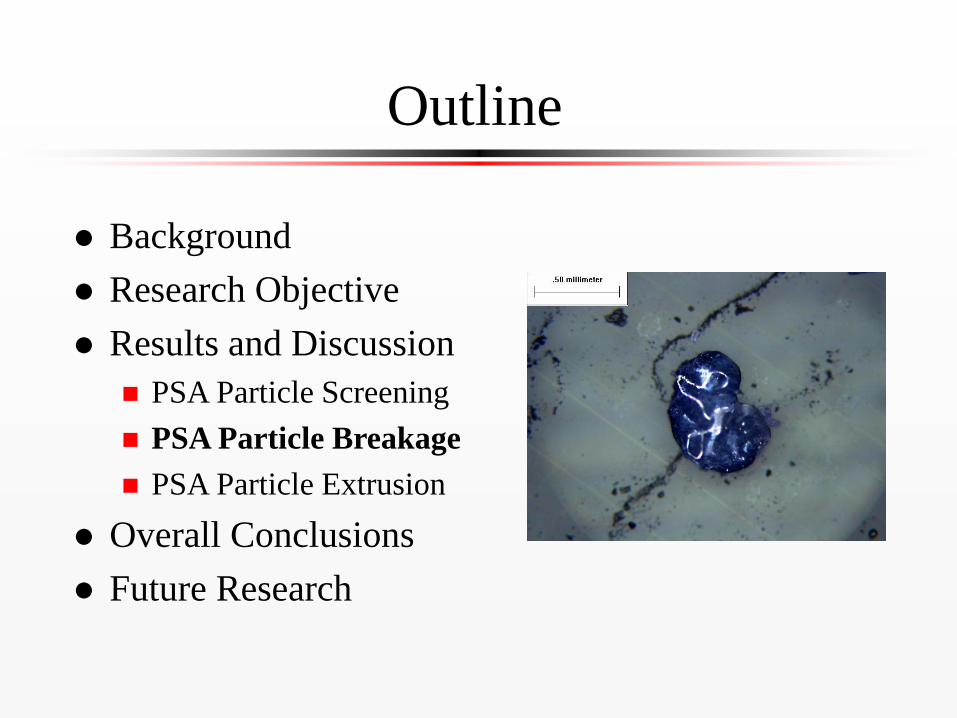
Outline
Background
Research Objective
Results and Discussion
PSA Particle Screening
PSA Particle Breakage
PSA Particle Extrusion
Overall Conclusions
Future Research
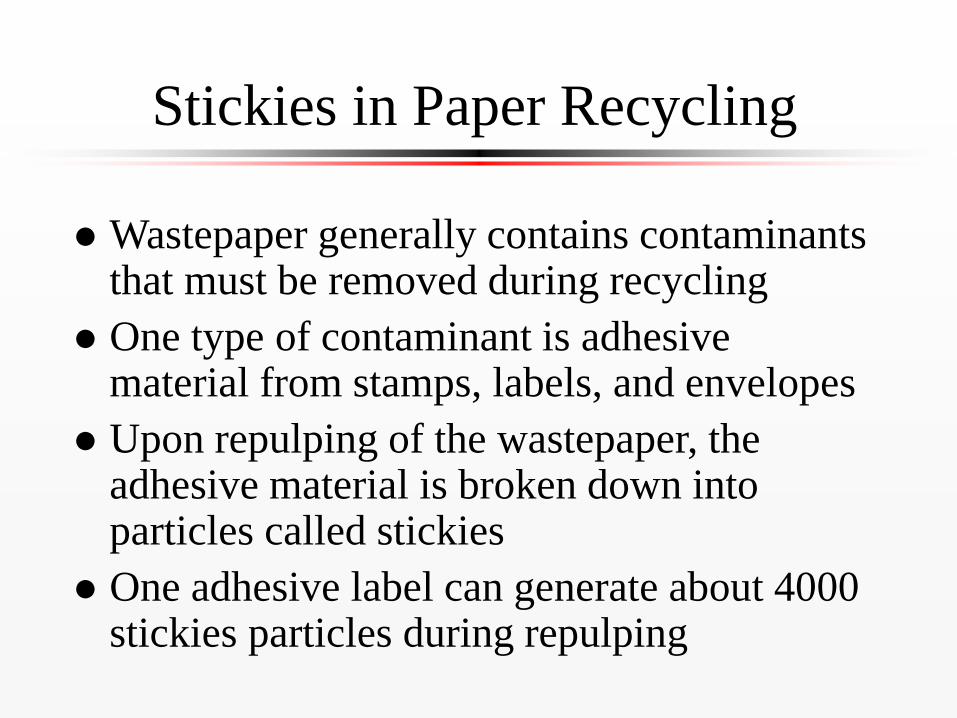
Stickies in Paper Recycling
Wastepaper generally contains contaminants that must be removed during recycling
One type of contaminant is adhesive material from stamps, labels, and envelopes
Upon repulping of the wastepaper, the adhesive material is broken down into particles called stickies
One adhesive label can generate about 4000 stickies particles during repulping

Stickies Impact on
Paper Recycling
Stickies deposit on the paper machine
equipment and appear as dirt in the final
product
Stickies cost the paper industry almost $700
million per year due to downgrading of the
product, mill downtime, and waste disposal*
*Friberg, T., Progress in Paper Recycling, 6(1):70-72, 1996.
Pressure Sensitive Adhesives
Pressure sensitive adhesive base polymers consist of acrylic or rubber-based polymers
Glass transition temperature is below room temperature and depends on the adhesive formulation
Young’s modulus and shear strength are low and depend on the adhesive formulation and the system temperature
Pressure Screening
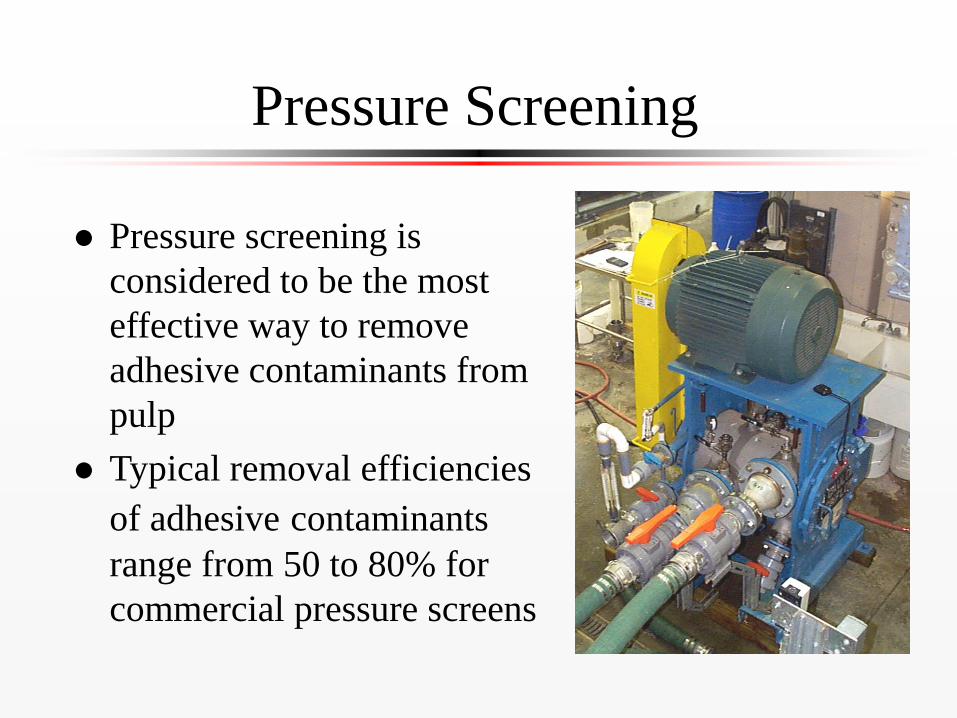
Pressure screening is
considered to be the most
effective way to remove
adhesive contaminants from
pulp
Typical removal efficiencies
of adhesive contaminants
range from 50 to 80% for
commercial pressure screens

Percentage of Adhesive Material
Removed by Each Operation
Sutherland, N.R., and Donermeyer, D., 2000 Tappi Recycling Symposium, pp. 433-470, 2000.
0
20
40
60
80
100
Primary Screen Secondary
Screen
Forward
Cleaners (2)
Through-flow
Cleaners (2)
Flotation Washing
Recycling Operations
Rem
ov
al
Per
cen
tag
e, %
33202
33204
33210
33216

Screening Equipment Parameters
Rotor shape
Rotor speed
Shape of openings
Holes
Slots
Size of openings
Degree of surface contour

Screen Operating Parameters
Feed consistency
Reject rate
Pressure difference
Slot velocity
Temperature

Particle Behavior in Screens
Mechanisms for particle removal
Positive size separation
Particle alignment with the rotor
Proposed mechanisms for particle passage
Particle alignment with the slot
Particle bending
Particle extrusion
Bliss, T., and Ostoja-Starzewski, M., 1997 Tappi Korea Recycling Symposium, pp. 1-17, 1997.

Shear Stress in a Pressure Screen
Pressure screens are second only to the fan pump in shear stress for the wet end of the paper machine
High shear forces can occur due to movement of the foil over the pulp mat formed on the face of the screen plate
Shear and tensile forces occur as material passes through the screen openings
Particle Breakage
Breakage of PSA particles depends on the:
Shear/tensile strength of the PSA
Shear/tensile forces in the device
If the forces in the device are greater than
the strength of the PSA material, then the
PSA material will break
Research on Screening of Stickies
Studies of the effects of operating parameters and
equipment on removal efficiency by: Consistency, slot velocity, and slot width [Vitori, Pulp and Paper
Canada, 1993]
Reject rate, rotor speed, and slot velocity [Heise, Tappi Journal,
1992]
Consistency, reject rate, rotor speed, slot velocity, and slot width
[Seifert, et. al., 5th Research Forum on Recycling, 1999]
Consistency, rotor speed, slot velocity, and slot width [Saint Amand
and Perrin, Tappi 1998 Pulping Conference, 1998]
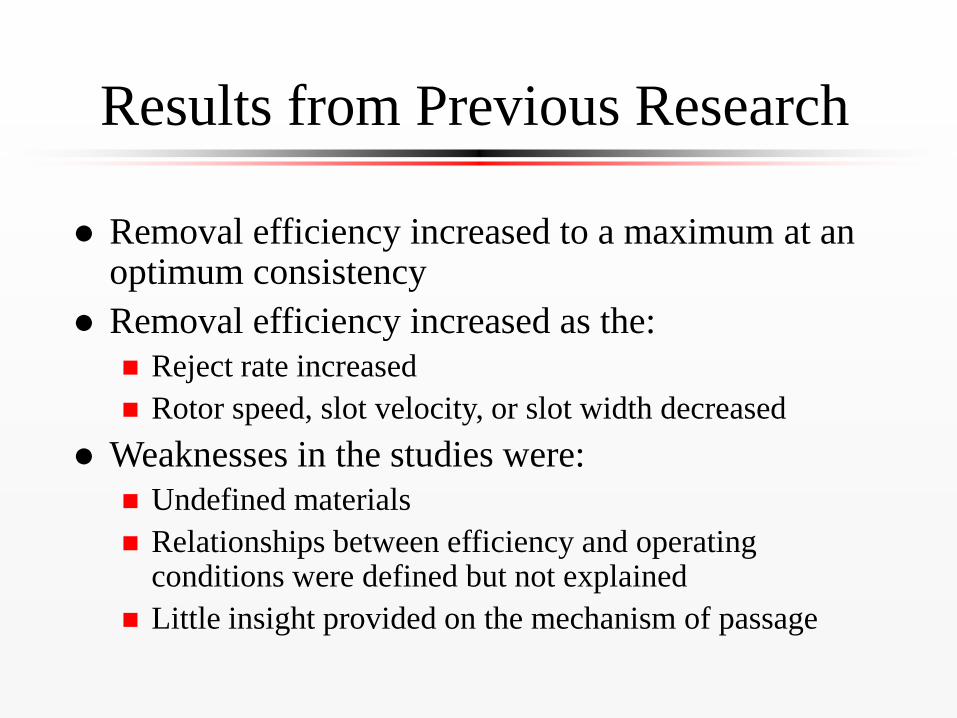
Results from Previous Research
Removal efficiency increased to a maximum at an optimum consistency
Removal efficiency increased as the:
Reject rate increased
Rotor speed, slot velocity, or slot width decreased
Weaknesses in the studies were:
Undefined materials
Relationships between efficiency and operating conditions were defined but not explained
Little insight provided on the mechanism of passage
Research Objective
To understand how the operating
conditions and adhesive formulation
affect the passage of pressure sensitive
adhesive particles in industrial and
laboratory screens

Outline
Background
Research Objective
Results and Discussion
PSA Particle Screening
PSA Particle Breakage
PSA Particle Extrusion
Overall Conclusions
Future Research

PSA Particle Screening
Do pressure sensitive adhesive particles
behave differently in industrial pressure
screens than in laboratory screens?
Approach: Study the removal of pressure
sensitive adhesive particles by an industrial
pressure screen and laboratory screens

Pilot Plant Layout
Rejects
Flow
Meter
Pump
Industrial
Screen
Feed
Stock
Tank
Second
Stock
Tank
Accepts
Shower
Screening Parameters:
1% Consistency, 50oC,
0.006 in. wide slots,
Mass Reject Ratios of
4.5%, 12%, 15%, and 25%
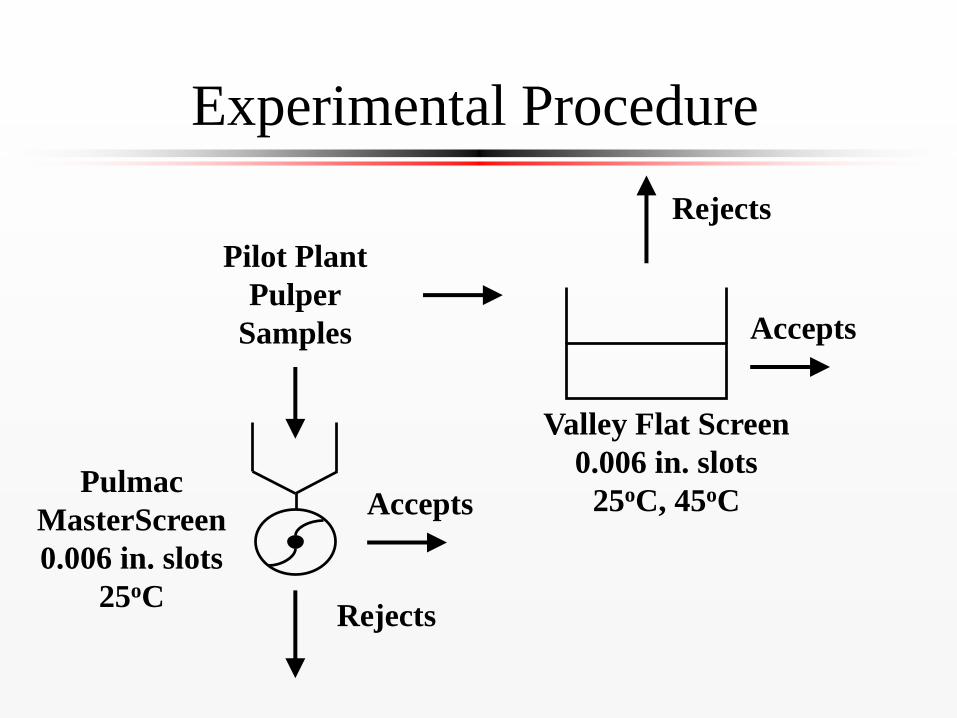
Experimental Procedure
Valley Flat Screen
0.006 in. slots
25oC, 45oCPulmac
MasterScreen
0.006 in. slots
25oC
Accepts
Accepts
Rejects
Rejects
Pilot Plant
Pulper
Samples
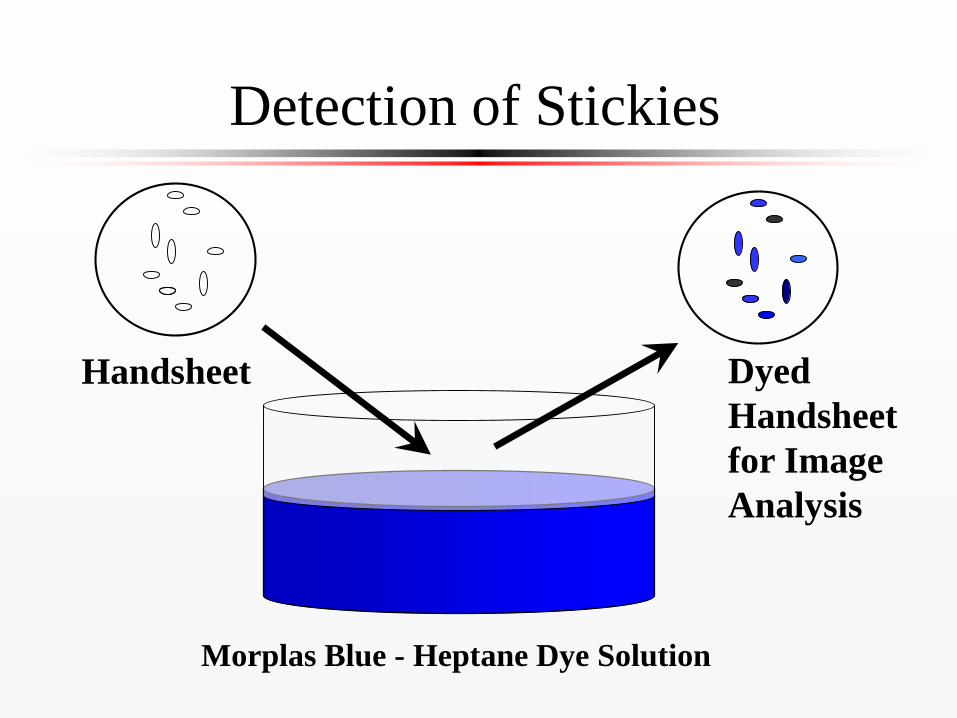
Detection of Stickies
Handsheet
Morplas Blue - Heptane Dye Solution
Dyed
Handsheet
for Image
Analysis
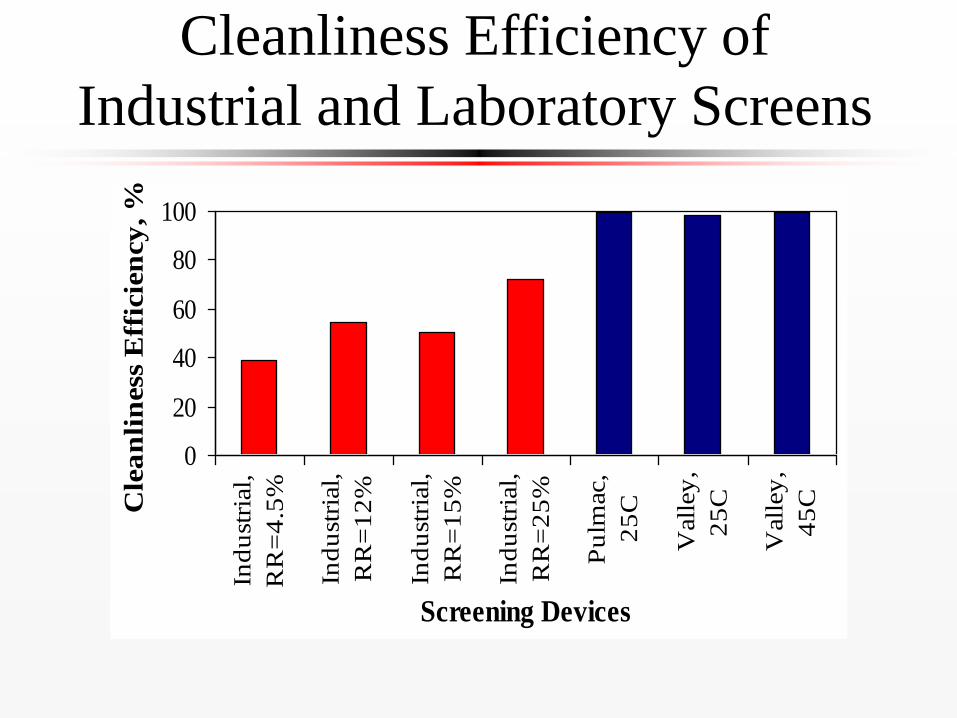
Cleanliness Efficiency of
Industrial and Laboratory Screens
0
20
40
60
80
100In
du
stri
al,
RR
=4
.5%
Ind
ust
rial,
RR
=1
2%
Ind
ust
rial,
RR
=1
5%
Ind
ust
rial,
RR
=2
5%
Pu
lmac,
25
C
Vall
ey
,
25
C
Vall
ey
,
45
C
Screening Devices
Cle
an
lin
ess
Eff
icie
ncy
, %

PSA Particle Screening
Do pressure sensitive adhesive particles behave differently in industrial pressure screens than in laboratory screens?
Yes, pressure sensitive adhesive particles behave differently in industrial pressure screens (40-70% efficiency) than in laboratory screens (99% efficiency).
Outline
Background
Research Objective
Results and Discussion
PSA Particle Screening
PSA Particle Breakage
PSA Particle Extrusion
Overall Conclusions
Future Research

PSA Particle Breakage
Do PSA particles breakdown in the industrial pressure screen?
Approach: Analyze the PSA particles before and after the industrial pressure screen

Pressure Sensitive Adhesive
Particle Size Distribution
10
100
1,000
10,000
<0.50 0.50-
1.00
1.00-
1.50
1.50-
2.00
2.00-
2.50
2.50-
3.00
>3.00
Particle Size Ranges, mm2
Nu
mb
er o
f P
arti
cle
s in
1 m
2
Feed
Comb. Accepts + Rejects
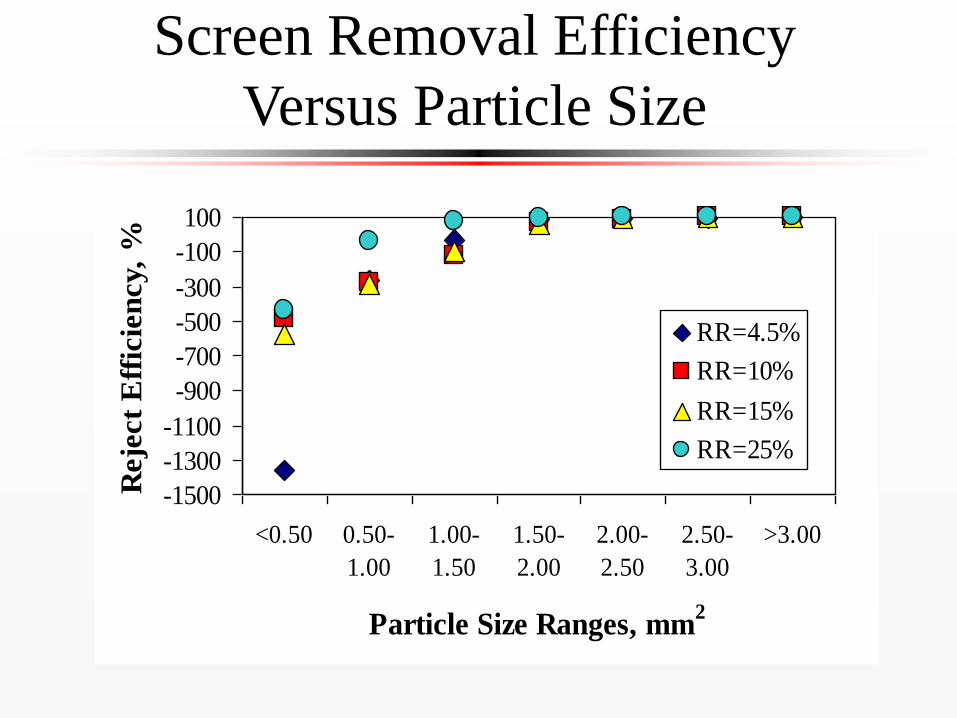
Screen Removal Efficiency
Versus Particle Size
-1500
-1300
-1100
-900
-700
-500
-300
-100
100
<0.50 0.50-
1.00
1.00-
1.50
1.50-
2.00
2.00-
2.50
2.50-
3.00
>3.00
Particle Size Ranges, mm2
Reje
ct
Eff
icie
ncy,
%
RR=4.5%
RR=10%
RR=15%
RR=25%
PSA Particle Breakage
Do PSA particles breakdown in the
industrial pressure screen?
Yes, it has been confirmed that PSA
particles do breakdown in the industrial
pressure screen.

PSA Particle Breakage
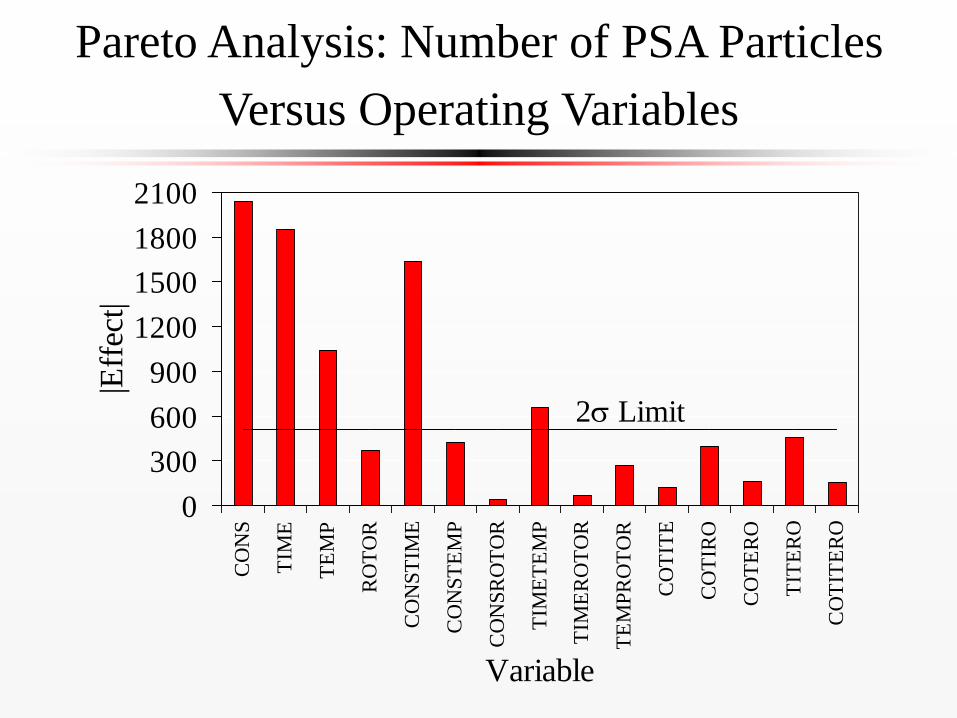
Which operating parameters in an industrial pressure screen have the most significant effect on the breakage of PSA particles?
Approach: Conduct a statistical analysis experiment using a high intensity laboratory mixer to treat pulp containing PSA particles

Experimental Procedure
Pilot Plant Pulper
10% K, 45oC, 20 min
80 OD lbs.
Copy Paper with
Adhesive Labels
(1% by wt.)
Samples
Quantum
High Shear Mixer
3 Liters
(vary parameters)
Handsheets
Dyeing
Image Analysis

Operating Parameters
Full Factorial Design Experiment with a
Center Point
Variable Low Value Center Point High Value
Pulp Consistency,% 3 7.5 12
Mixing Time, seconds 30 165 300
Initial Temperature, oC 20 35 50
Rotor Speed, rpm 600 1500 2400
0
300
600
900
1200
1500
1800
2100
CO
NS
TIM
E
TE
MP
RO
TO
R
CO
NS
TIM
E
CO
NS
TE
MP
CO
NS
RO
TO
R
TIM
ET
EM
P
TIM
ER
OT
OR
TE
MP
RO
TO
R
CO
TIT
E
CO
TIR
O
CO
TE
RO
TIT
ER
O
CO
TIT
ER
O
Variable
|Eff
ect|
2 Limit
Pareto Analysis: Number of PSA Particles
Versus Operating Variables
PSA Particle Breakage
Which operating parameters in an industrial pressure screen have the most significant effect on the breakage of PSA particles?
The operating parameters of consistency, time, and temperature have the most significant effect on the breakage of PSA particles.

PSA Particle Breakage
Do the mechanical properties of PSA formulations affect the breakage of PSA particles?
Approach: Analyze the average particle size
in the laboratory pulper for PSA films with
different formulations

Preparation of PSA Materials
Two base polymers from Union Carbide
9165 LT: 92% butyl acrylate (BA)
9175: 50% butyl acrylate and 50% 2-ethylhexyl acrylate (BA-EA)
Two rosin-based tackifier resins from Akzo Nobel
775A (Tack A)
Snowtack 780G (Tack G)
Prepare adhesive films for each base polymer with 0 or 40% of tackifier resin for each combination
Compare with acrylic (AC) and SIS commercial PSA films

Physical Properties of PSA Films
0.696.00.86-28AC
0.31206.4-16BA-EA:G
1.4443.1-27SIS
0.221.50.67-23BA-EA:A
0.305619-49BA-EA
0.51183.5-12BA:G
0.383.00.78-20BA:A
0.84252.9-37BA
Modulus,
MPa
Yield
Stress, kPa
Yield
Strain, %
Tg, oC
Polyethylene: 8-35 MPa Yield Stress and 100-600 MPa Modulus

Experimental Procedure
450H Pulper
12% K, 45oC,
415 rpm, 30 min
450 OD g of paper
6 adhesive labels
Handsheets
Dyeing
Image Analysis
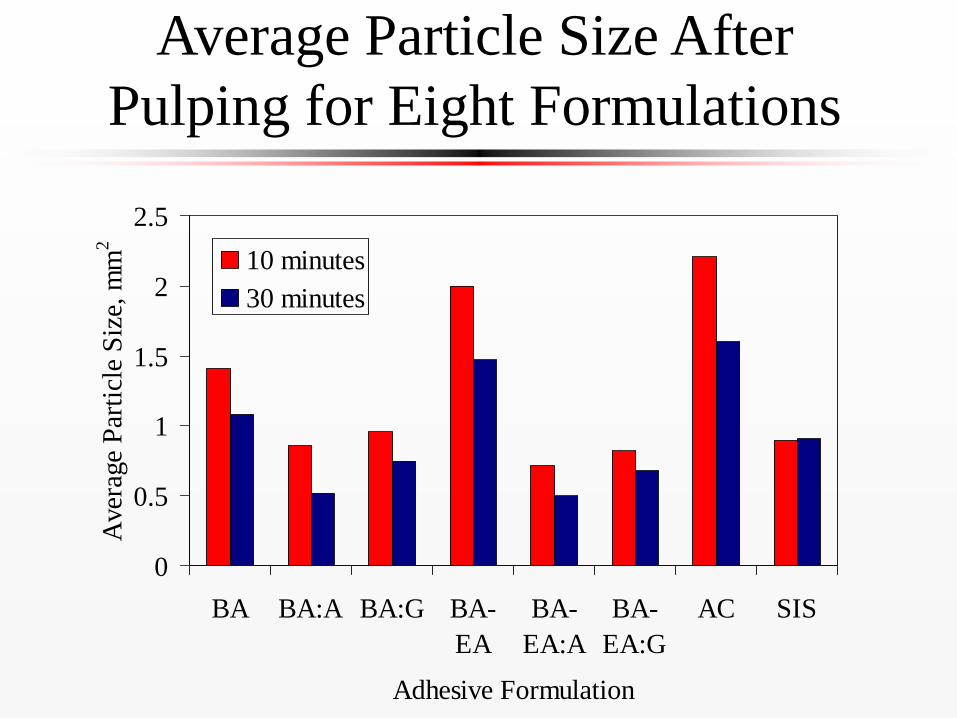
Average Particle Size After
Pulping for Eight Formulations
0
0.5
1
1.5
2
2.5
BA BA:A BA:G BA-
EA
BA-
EA:A
BA-
EA:G
AC SIS
Adhesive Formulation
Aver
age
Par
ticl
e S
ize,
mm
2
10 minutes
30 minutes

Cumulative Particle Size
Distributions After Pulping
0
20
40
60
80
100
<0.5 0.5-1.0 1.0-1.5 1.5-2.0 2.0-2.5 2.5-3.0 >3.0
Particle Size, mm2
Cu
mu
lati
ve
Par
ticl
e D
istr
ibu
tio
n,
%
BA BA:A
BA:G BA-EA
BA-EA:A BA-EA:G
AC SIS

Equation for Particle Size
Compared average particle size after pulping to the physical properties of the PSA formulations
Particle Size = -0.43 + 0.34*Yield Strain -0.10*Yield Stress + 3.22*Modulus R2 = 0.86
F = 8.15
Glass transition temperature and contact angle did not correlate with particle size after pulping
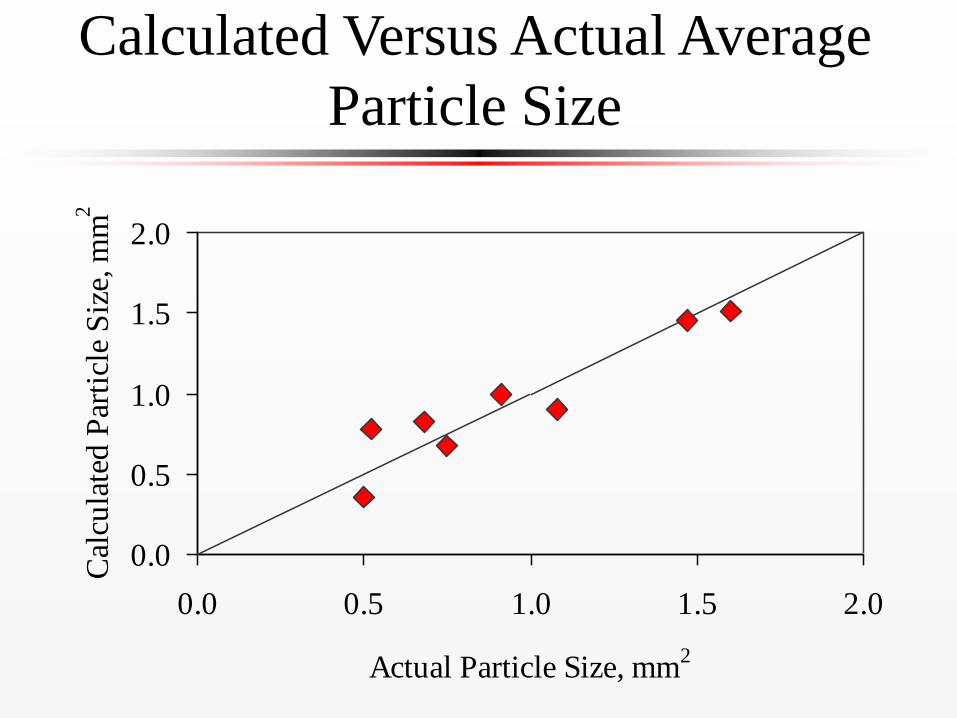
Calculated Versus Actual Average
Particle Size
0.0
0.5
1.0
1.5
2.0
0.0 0.5 1.0 1.5 2.0
Actual Particle Size, mm2
Cal
cula
ted
Par
ticl
e S
ize,
mm
2
PSA Particle Breakage
Do the mechanical properties of PSA formulations affect the breakage of PSA particles?
Yes, changes in the mechanical properties due to PSA formulation differences correlate with the breakage of PSA particles.

Outline
Background
Research Objective
Results and Discussion
PSA Particle Screening
PSA Particle Breakage
PSA Particle Extrusion
Overall Conclusions
Future Research
PSA Particle Extrusion
How do the pressure difference across the
slot and operating temperature affect
particle passage through a slot?
Approach: Measure the pressure difference
at which PSA particles pass through the slot
of a pressurized single slot device at
different temperatures

Experimental Procedure
450H Pulper
12% K, 45oC,
415 rpm, 60 min
450 OD g of paper
10 adhesive labels
Single Slot Device
0.18 mm wide slot

Single Slot Device Procedure
Remove a PSA particle from pulp
Measure the dimensions of the PSA particle under a microscope
Place the PSA particle on the slot
Add 1000 mL of deionized water
Slowly open the vacuum line valve to increase the pressure difference across the slot
If the particle passes through the slot, record the vacuum pressure at which the particle passes through the slot
Top View
Side View
PIV
a
c
u
u
m

Commonly Observed
Particle Passage Process
Increasing Pressure Difference
indicates

Cumulative Particle Passage
Versus Pressure Difference
0
20
40
60
80
100
0 20 40 60 80
Pressure Difference, kPa
Cu
mu
lati
ve
Par
ticl
e P
assa
ge,
%
5C
20C
50C
Typical Pressure Differences in an
Industrial Pressure Screen*
*Bliss, T., and Ostoja-Starzewski, M., 1997 Tappi Korea Recycling Symposium, pp. 1-17, 1997.
PSA Particle Extrusion
How do the pressure difference across the
slot and operating temperature affect particle
passage through a slot?
Increasing the pressure difference across
the slot or the operating temperature
increases particle passage through a slot.

PSA Particle Extrusion
How do the dimensions of PSA particles
affect their passage through a slot?
Approach: Measure the length, width, and
thickness of the particles before analyzing
their passage through the single slot device

Dimensions of the Particles
WidthLength
Thickness
Length >> Width > Thickness
Area = Length x Width

Top Views of Typical Shapes of
Analyzed Particles
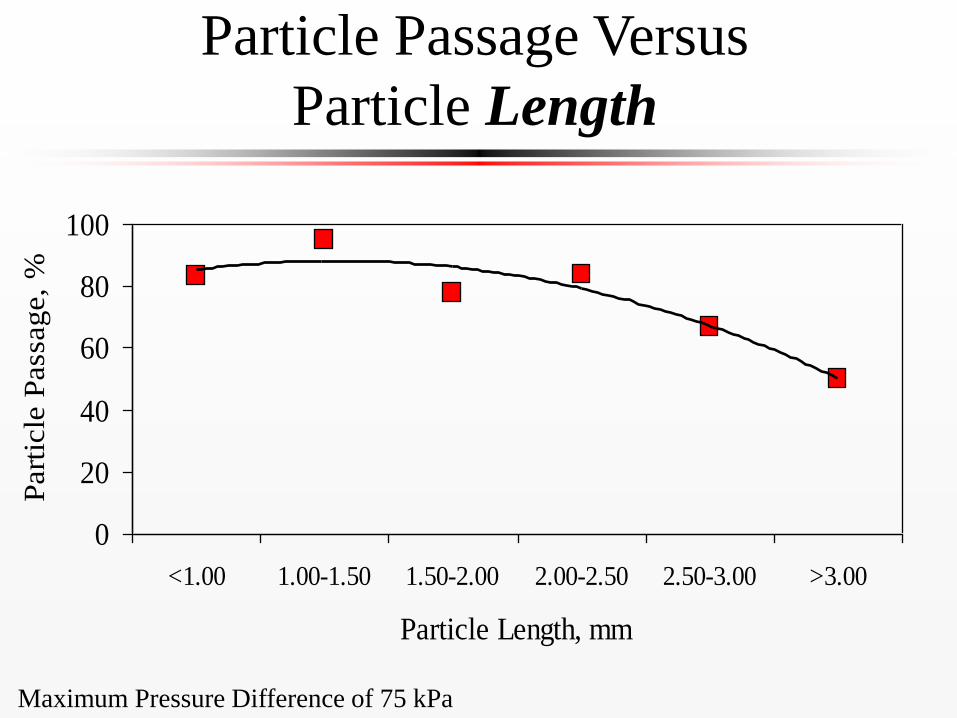
Particle Passage Versus
Particle Length
Maximum Pressure Difference of 75 kPa
0
20
40
60
80
100
<1.00 1.00-1.50 1.50-2.00 2.00-2.50 2.50-3.00 >3.00
Particle Length, mm
Part
icle
Pass
age,
%
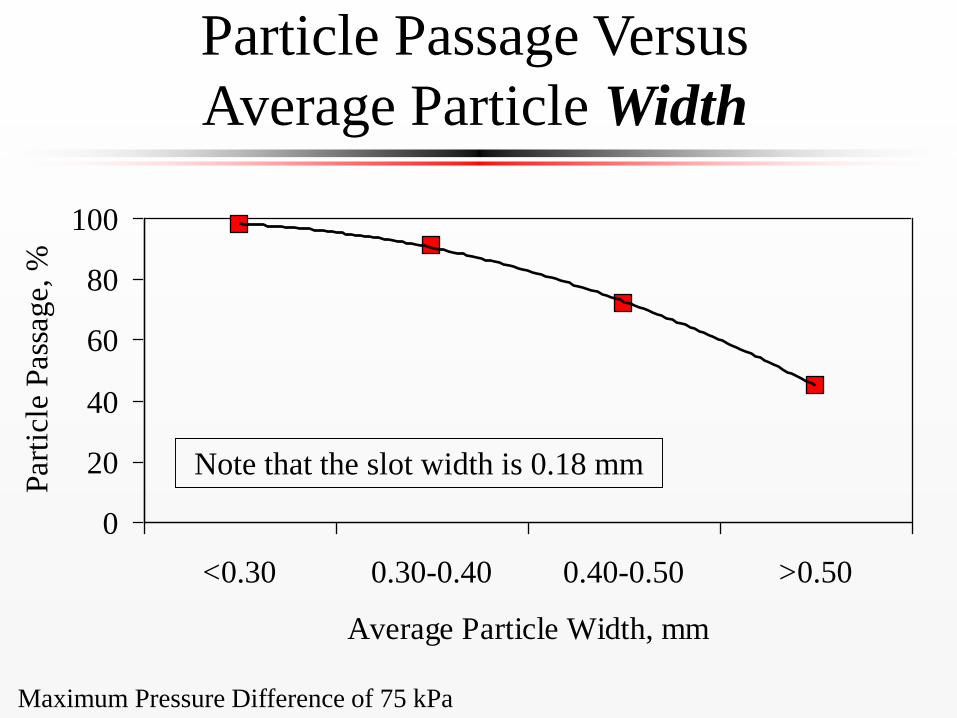
Particle Passage Versus
Average Particle Width
Maximum Pressure Difference of 75 kPa
0
20
40
60
80
100
<0.30 0.30-0.40 0.40-0.50 >0.50
Average Particle Width, mm
Part
icle
Pass
ag
e, %
Note that the slot width is 0.18 mm

Particle Passage Versus
Average Particle Thickness
Maximum Pressure Difference of 75 kPa
0
20
40
60
80
100
<0.20 0.20-0.30 0.30-0.40 0.40-0.50 >0.50
Average Particle Thickness, mm
Part
icle
s P
ass
age, %
Note that the slot width is 0.18 mm

Particle Passage Versus
Calculated Particle Area
Maximum Pressure Difference of 75 kPa
0
20
40
60
80
100
<0.50 0.50-1.00 1.00-1.50 >1.50
Average Particle Area, mm2
Part
icle
Pass
ag
e, %
PSA Particle Extrusion
How do the dimensions of PSA particles
affect their passage through a slot?
Increasing the dimensions of width,
thickness, or area decreases the passage of
PSA particles through a slot.

PSA Particle Extrusion
Do the mechanical properties of the PSA formulations affect the passage of PSA particles through a slot?
Approach: Analyze particle passage in the
single slot device for PSA films with
different formulations
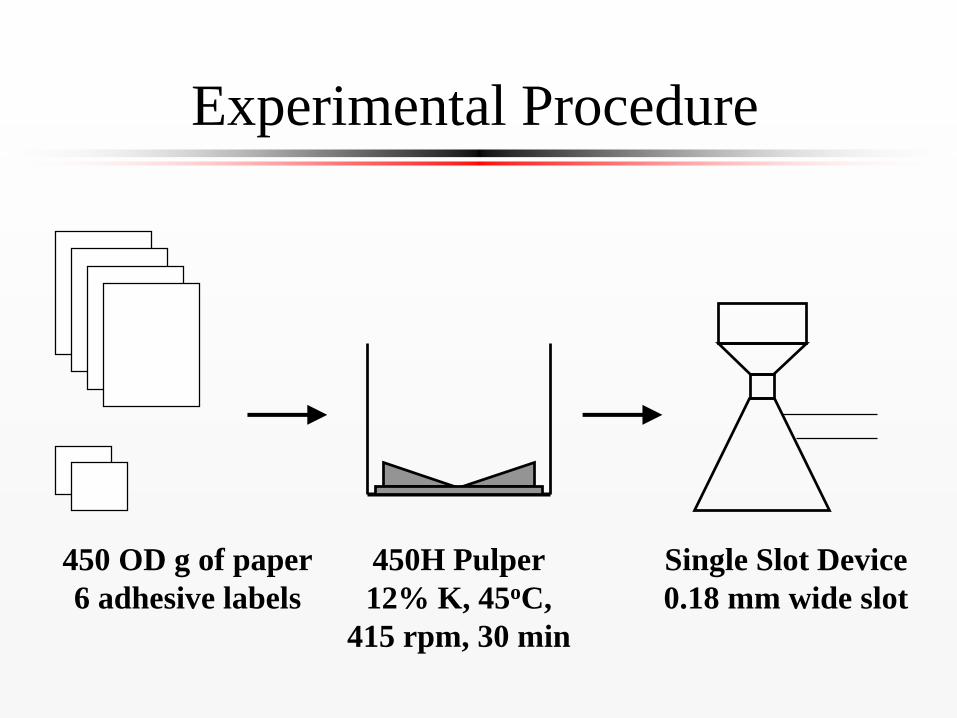
Experimental Procedure
450H Pulper
12% K, 45oC,
415 rpm, 30 min
450 OD g of paper
6 adhesive labels
Single Slot Device
0.18 mm wide slot
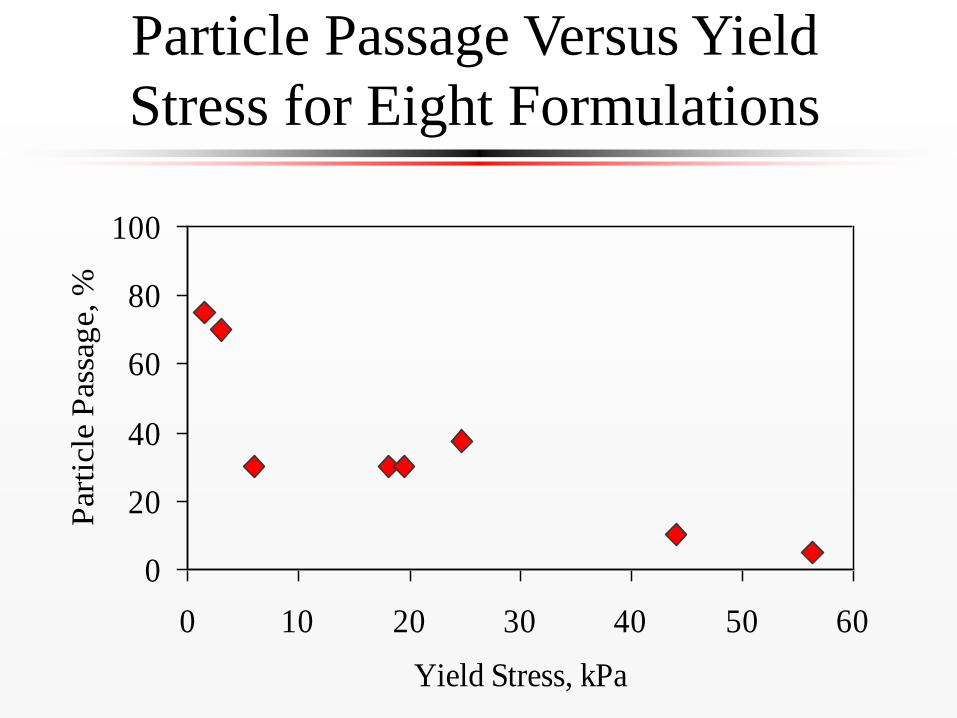
Particle Passage Versus Yield
Stress for Eight Formulations
0
20
40
60
80
100
0 10 20 30 40 50 60
Yield Stress, kPa
Par
ticl
e P
assa
ge,
%

Equation for Particle Passage
Compared the particle passage to the physical properties and particle dimensions of the eight different PSA formulations
Particle Passage = 99.52 - 2.54*Yield Stress + 1.74*Yield Stress*Average Particle Area -50.18*Average Particle Area
R2 = 0.90
F = 21.41
Yield strain, modulus, glass transition temperature, contact angle, particle length, particle width, particle thickness, and particle volume did not correlate with particle passage

Calculated (Yield Stress and Area)
Versus Actual Particle Passage
0
20
40
60
80
100
0 20 40 60 80 100
Actual Particle Passage, %
Cal
cula
ted
Par
ticl
e P
assa
ge,
%

Particle Passage Versus Particle Area for
Eight Different Formulations
0
20
40
60
80
100
0.0 1.0 2.0 3.0 4.0
Calculated Particle Area, mm2
Cum
ulat
ive
Par
ticl
e P
assa
ge, % BA BA:A
BA:G BA-EA
BA-EA:A BA-EA:G
AC SIS

PSA Particle Extrusion
Do the mechanical properties of the PSA
formulations affect the passage of PSA
particles through a slot?
The mechanical property of yield stress in
combination with the average particle
area affects particle passage.
PSA Particle Extrusion
Can a simple model for extrusion predict
particle passage?
Approach: Develop a model for passage
using energy balance, mass balance, and
deformation equations and compare the
model to data
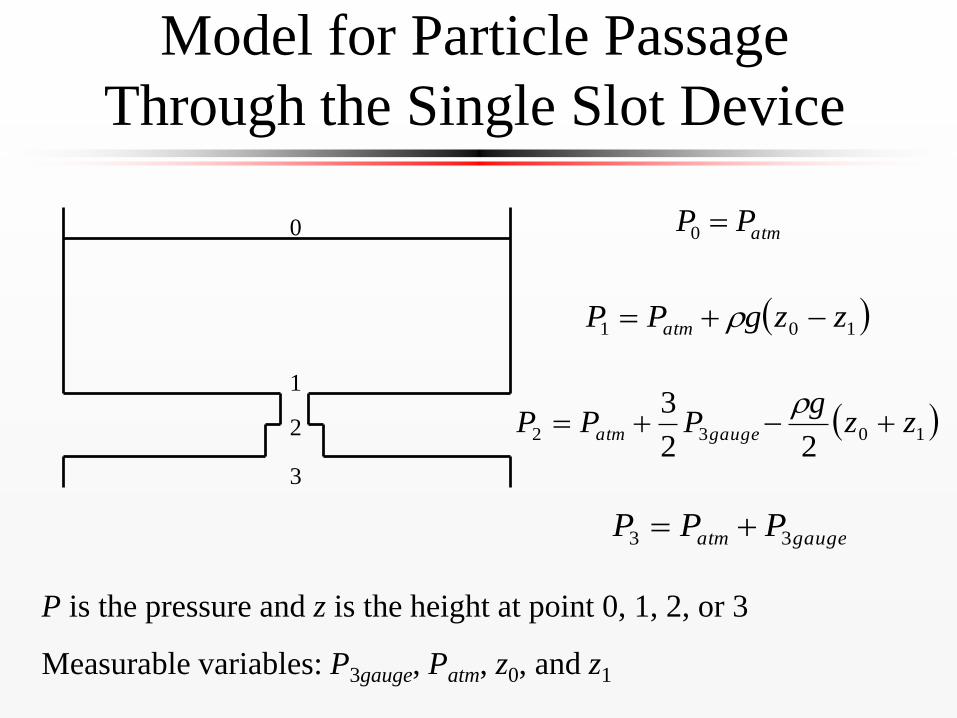
Model for Particle Passage
Through the Single Slot Device
0
1
3
2
101 zzgPP atm
103222
3zz
gPPP gaugeatm
gaugeatm PPP 33
atmPP 0
P is the pressure and z is the height at point 0, 1, 2, or 3
Measurable variables: P3gauge, Patm, z0, and z1

Particle Deformation
AFF Y221
PartYSlotPart WWPWP 221
F2
F1
A is the cross-sectional area of the particle perpendicular to the forces
Y is the yield stress of the material
A, Y F = PA and A = LW

Model for Particle Passage
Through the Single Slot Device
Slot
Part
atmYatmgaugeW
WzzgPzz
gPP 10103 2
23
2
0
1
3
2
P3gauge is the gauge pressure required in the vacuum line for passage
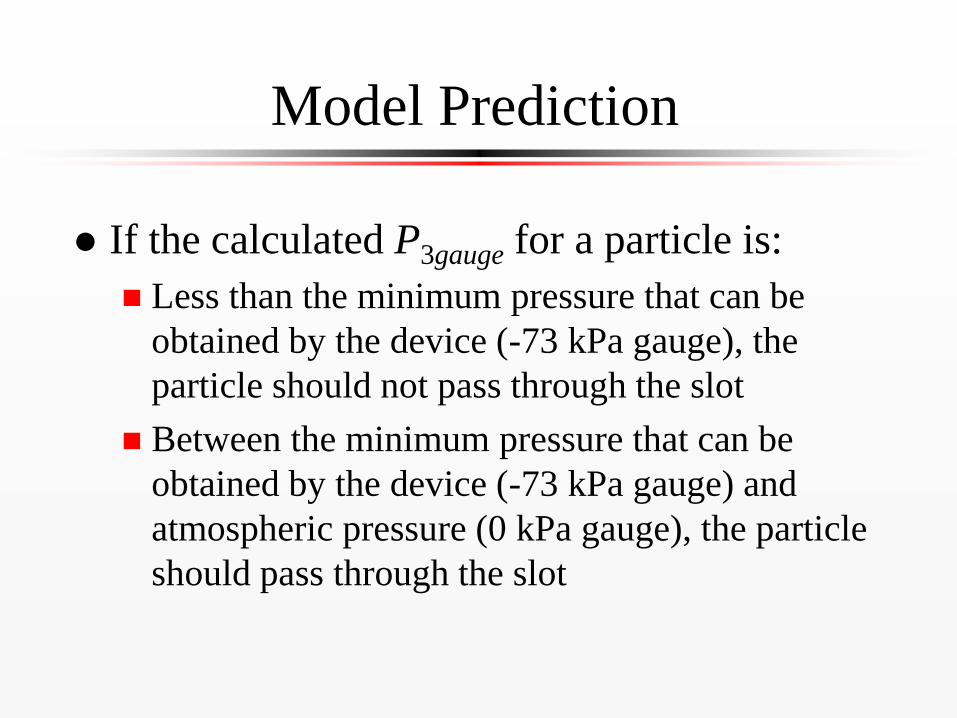
Model Prediction
If the calculated P3gauge for a particle is:
Less than the minimum pressure that can be
obtained by the device (-73 kPa gauge), the
particle should not pass through the slot
Between the minimum pressure that can be
obtained by the device (-73 kPa gauge) and
atmospheric pressure (0 kPa gauge), the particle
should pass through the slot

Model Predictions Versus
Observed Behavior
Of the 60 particles predicted to be blocked,
58 were actually blocked (97% predicted
correctly)
Of the 164 particles predicted to pass, 77
actually passed (47% predicted correctly)

Observation
Less than 50% predictability for particle passage may be due to adhesion between the particle and the slot surface
Adhesion may have prevented particle passage and was not taken into account in the model
Adhesion needs to be incorporated into the model for particle passage

PSA Particle Extrusion
Can a simple model for extrusion predict
particle passage?
There is some agreement between the
data and the model. Inclusion of adhesive
forces may improve the utility of this
model.

Overall Conclusions
PSA particles broke down in industrial
pressure screens and not in laboratory
screens, resulting in lower removal
efficiencies for industrial pressure screens
than in laboratory screens

Overall Conclusions (cont.)
Consistency, time, and operating
temperature significantly affected the
breakage of PSA particles in a high shear
device
Yield strain, yield stress, and modulus,
which depended on the adhesive
formulation, were significant for particle
size after pulping

Overall Conclusions (cont.)
Particle passage through a single slot device increased by increasing the pressure difference across the slot or the operating temperature
Yield stress and average particle area, which
depended on the adhesive formulation, were
significant for particle passage through the
slot of a pressurized single slot device
Suggestions for Future Research
Develop a dynamic system for the analysis of particle passage through a slot
Further investigate the effects of adhesive formulation on adhesive properties and particle passage by considering other PSA materials
Develop new screening techniques that reduce the breakage and extrusion of PSA particles
Improve the theoretical model for particle passage by investigating the effects of adhesive forces on passage

Acknowledgements
Agglomeration Consortium
Ecosynthetix