Beggar-thy-Neighbor Effects of Exchange Rates? A … Effects of Exchange Rates? A Study of the...
34
Beggar-thy-Neighbor Effects of Exchange Rates? A Study of the Renminbi Aaditya Mattoo, World Bank Prachi Mishra, IMF and Government of India Arvind Subramanian, Peterson Institute Second Annual IMF/WB/WTO Trade Workshop June 5-6, 2013 The views expressed in this paper are those of the authors and do not necessarily represent those of any of the institutions to which the authors belong.
-
Upload
trannguyet -
Category
Documents
-
view
215 -
download
0
Transcript of Beggar-thy-Neighbor Effects of Exchange Rates? A … Effects of Exchange Rates? A Study of the...

Beggar-thy-Neighbor Effects of Exchange Rates? A Study of the
Renminbi
Aaditya Mattoo, World Bank
Prachi Mishra, IMF and Government of India
Arvind Subramanian, Peterson Institute
Second Annual IMF/WB/WTO Trade Workshop
June 5-6, 2013
The views expressed in this paper are those of the authors and do not necessarily represent those of any of the institutions to which the authors belong.
Motivation
• The real effects of exchange rate movements is one of the oldest questions in the international economics literature.
• A vast theoretical and empirical literature (using both macro and micro data) focuses on effects of exchange rate movements on the country themselves (Goldstein and Khan, 1985; Berman, Martin and Mayer (2011))
Motivation (contd.)
• Scarce evidence on spillover effects of
exchange rate movements
• Beggar-thy-neighbor effects
– Robinson (1947) observations about
macroeconomic mercantilism
Why China?
• China’s exchange rate policy has been in discussion – Bernanke (2005) “global savings glut” hypothesis
– High unemployment and low capacity utilization in industrial countries
• Discussions focused on industrial countries – Little attention on emerging and developing/emerging countries
who compete closely with China in international markets
• China’s size – Potential spillover effects for many countries.
• Largest exporter of goods in 2009.
• Broadly diversified in the product space

0
0.1
0.2
0.3
0.4
0.5
0.6
Average Index of Competition with Top Ten Exporters, 2008
Anecdotal evidence: falling competitiveness
of China affecting developing countries
• “Bangladesh, With Low Pay, Moves In on
China” (New York Times, July, 2010)
– …… As costs have risen in China, long the
world’s shop floor, it is slowly losing work to
countries like Bangladesh, Vietnam and
Cambodia…”

Question
• Do movements in China’s exchange have
spillover effects for developing countries?
• Can we estimate the magnitude of
“competitor-country” effect?
– China’s exchange rate depreciates vis-à-vis say the
US, how does it affect a developing country, which
exports to the US market?
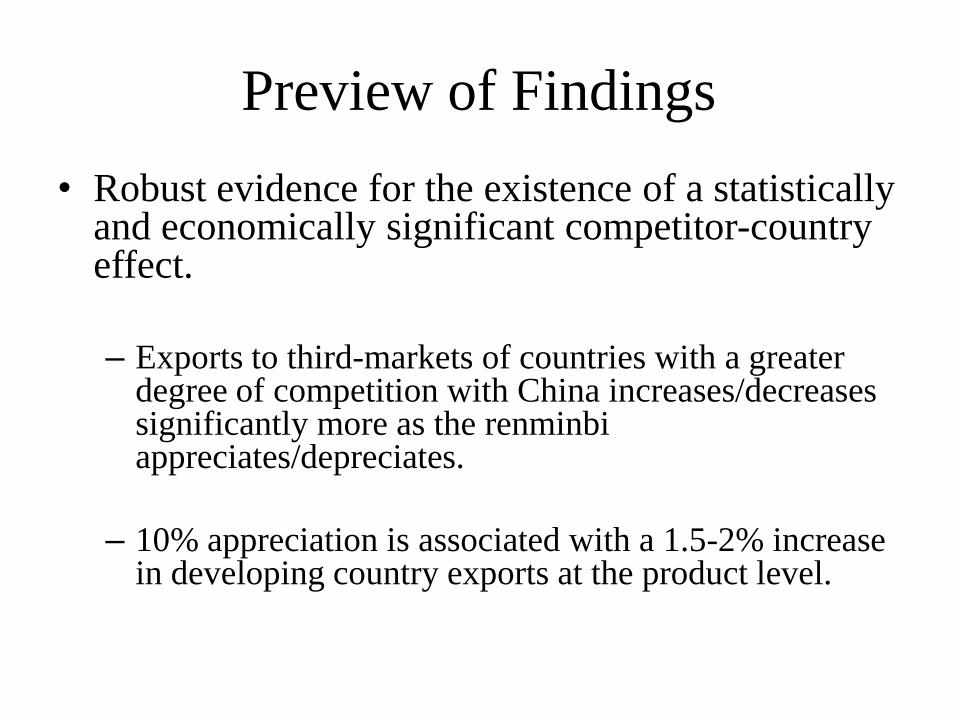
Preview of Findings
• Robust evidence for the existence of a statistically and economically significant competitor-country effect.
– Exports to third-markets of countries with a greater
degree of competition with China increases/decreases significantly more as the renminbi appreciates/depreciates.
– 10% appreciation is associated with a 1.5-2% increase in developing country exports at the product level.
Roadmap
• Literature / contribution
• Theoretical framework
• Identification strategy
• Empirical specification
• Data
• Results
• Conclusions

Literature
• Macro literature on exchange rates and export volumes
– Deardorff (1984); Hooper, Johnson and Marquez (2000); Thursby and Thursby (1987)
• Rising micro evidence – Dekle and Royoo (2002); Das, Roberts and Tybout (2001); Forbes
(2002); Berman, Martin and Mayer (2011)
• Rising literature specific to China
– Eichengreen and Tong (2004), Ahearne et. al., 2003 • Add China’s exports in a gravity/total trade model
– Eichengreen and Tong (2011) • Effect of renminbi revaluation on stock markets
Our contribution
• Focus on quantifying a very specific channel
– Effect of China’s exchange rate movements on
exports of countries competing with China in
international markets
• To our knowledge, first paper to provide
systematic empirical evidence on the channel

Theoretical framework – based on
Feenstra, Obstfeld and Russ (2011)
• J countries, G different goods; – each country produces a range of distinct varieties of each good
• Constant elasticity of substitution consumption index for representative consumer in country j (η)
• Armington assumption: goods differentiated by their country of origin; – constant elasticity of substitution between domestically produced
and foreign varieties of good g (ωg)
– constant elasticity of substitution between different varieties of good g originating in different exporters (σg)
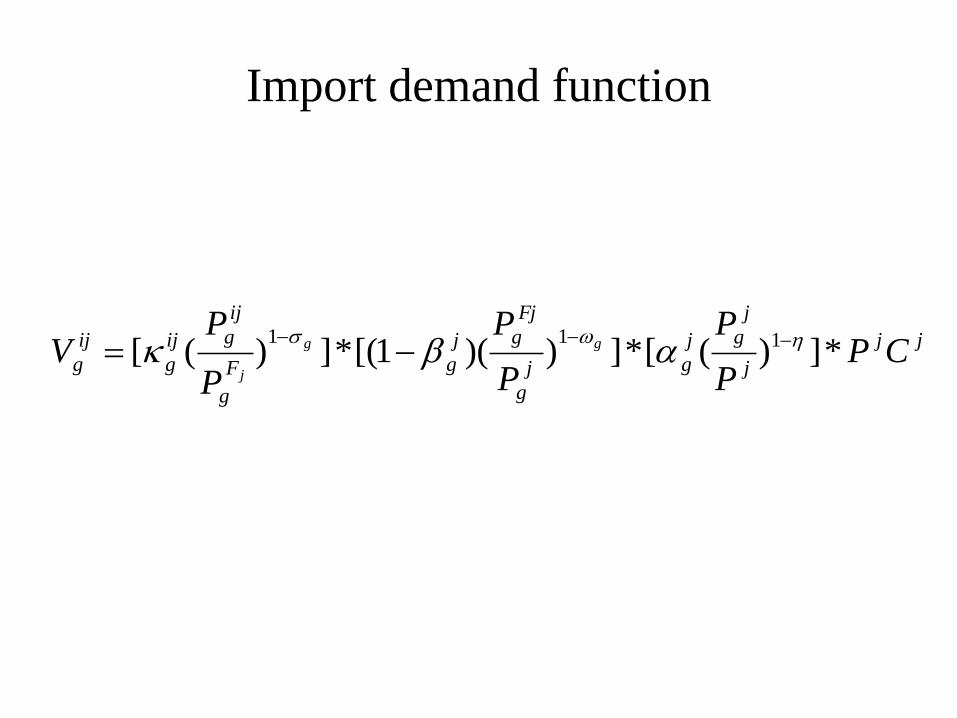
Import demand function
jj
j
j
gj
gj
g
Fj
gj
gF
g
ij
gij
g
ij
g CPP
P
P
P
P
PV gg
j
*])([*]))(1[(*])([ 111

Cj
g
Cj
ggg
Cj
Cj
g
Cj
g
Fj
g
Fj
g
ij
g
Cj
ij
g
s
E
P
P
P
P
V
E
V
**)(
ln
ln*
ln
ln*
ln
ln
ln
ln
j
gsjs
E
EP
jP
Cj
g
Cj
g
Cj
CjC
g
Cj
g
Cjg
country in goods Chinese of
pricesimport torate exchange Chinese ofthrough -Pass
good of imports total'in China of Share
currencymporter Renminbi/i
)/1(*
in goods Chinese of Price
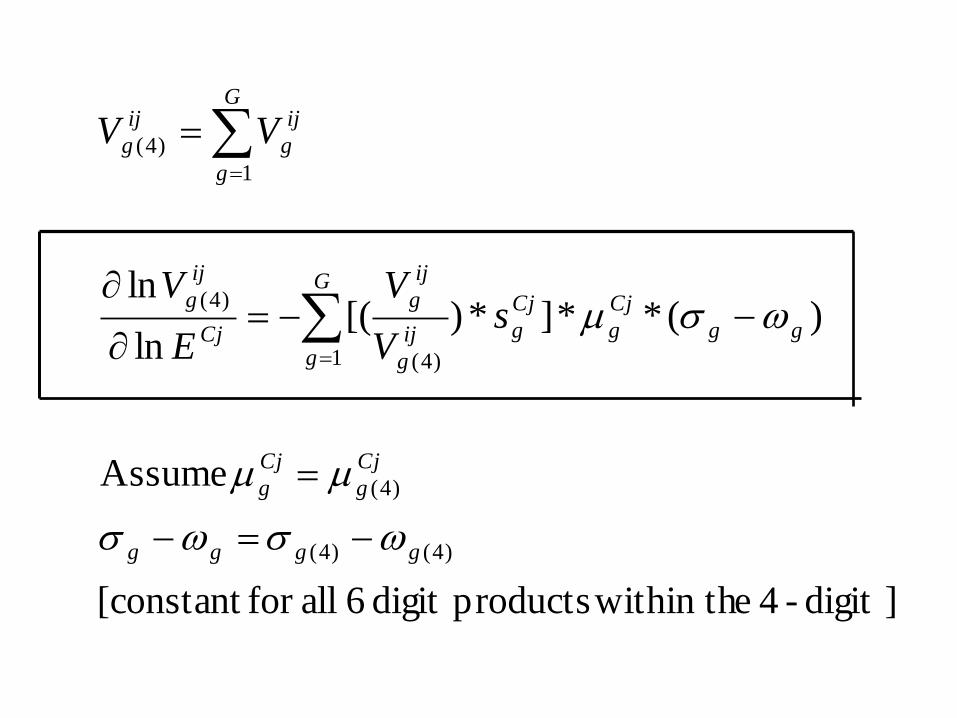
]digit -4 e within thproductsdigit 6 allfor [constant
Assume
)(**]*)[(ln
ln
)4()4(
)4(
1 )4(
)4(
1
)4(
gggg
Cj
g
Cj
g
gg
Cj
g
Cj
g
G
gij
g
ij
g
Cj
ij
g
G
g
ij
g
ij
g
sV
V
E
V
VV

jig
sV
VI
IE
V
Cj
g
G
gij
g
ij
gijC
g
gg
Cj
g
ijC
gCj
ij
g
country importingin exporter for China with
goodfor n competitio ofIndex based-Value
]*)[(
(I) ------ )](*[*ln
ln
1 )4(
)4(
)4()4()4()4(
)4(

category digit -4within
from imports which linesdigit -6 ofnumber Total
, export to China and both which linesdigit -6 ofNumber
Chinan with competitio ofindex based-Count
(II) --- )](**[*ln
ln
assumptionsymmetry Under
)4(
)4(
)4()4()4()4()4(
)4(
)4(
)4(
ij
ji
N
NCI
sCIE
V
ss
KV
ij
g
ij
gijC
g
gg
Cj
g
Cj
g
ijC
gCj
ij
g
Cj
g
Cj
g
ij
g
ij
g
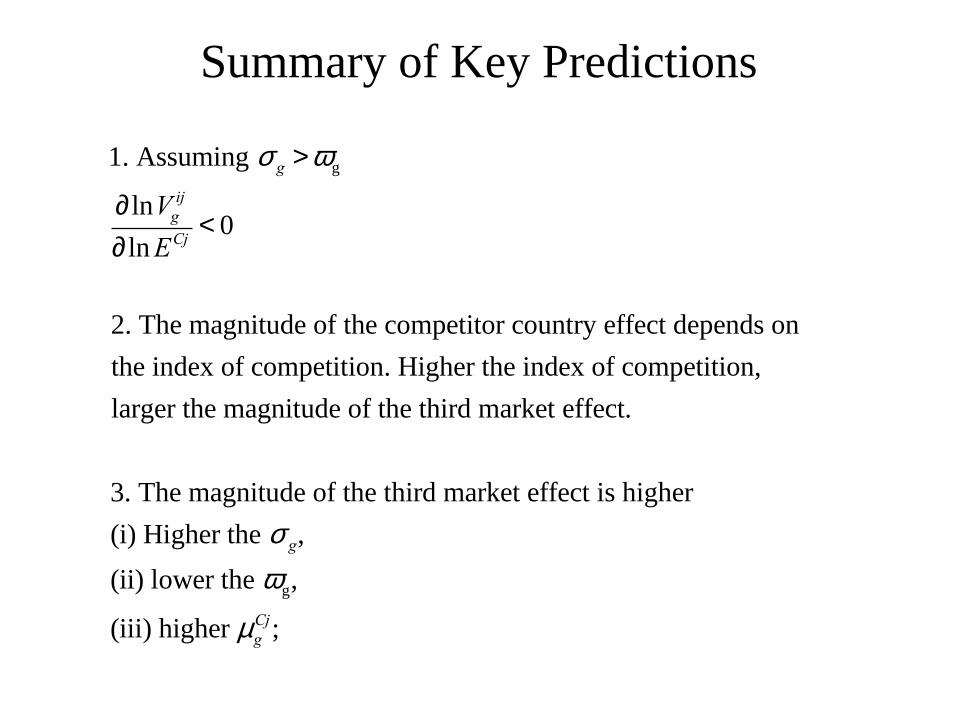
1. Assuming s g >wg
¶ lnVgij
¶ lnECj< 0
2. The magnitude of the competitor country effect depends on
the index of competition. Higher the index of competition,
larger the magnitude of the third market effect.
3. The magnitude of the third market effect is higher
(i) Higher the s g,
(ii) lower the wg,
(iii) higher mgCj;
Summary of Key Predictions

X (Malawi)
Y (Brazil)
China Z (US)
Renminbi/$
Exports
Exports
Exports
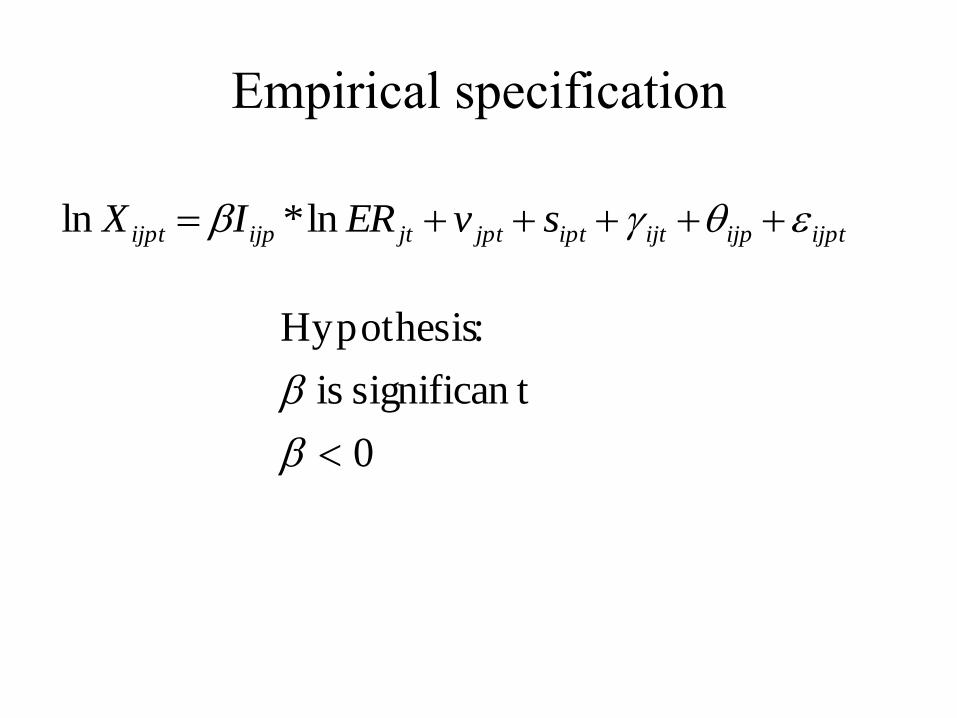
Empirical specification
0
tsignifican is
: Hypothesis
ijptijpijtiptjptjtijpijpt svERIX ln*ln
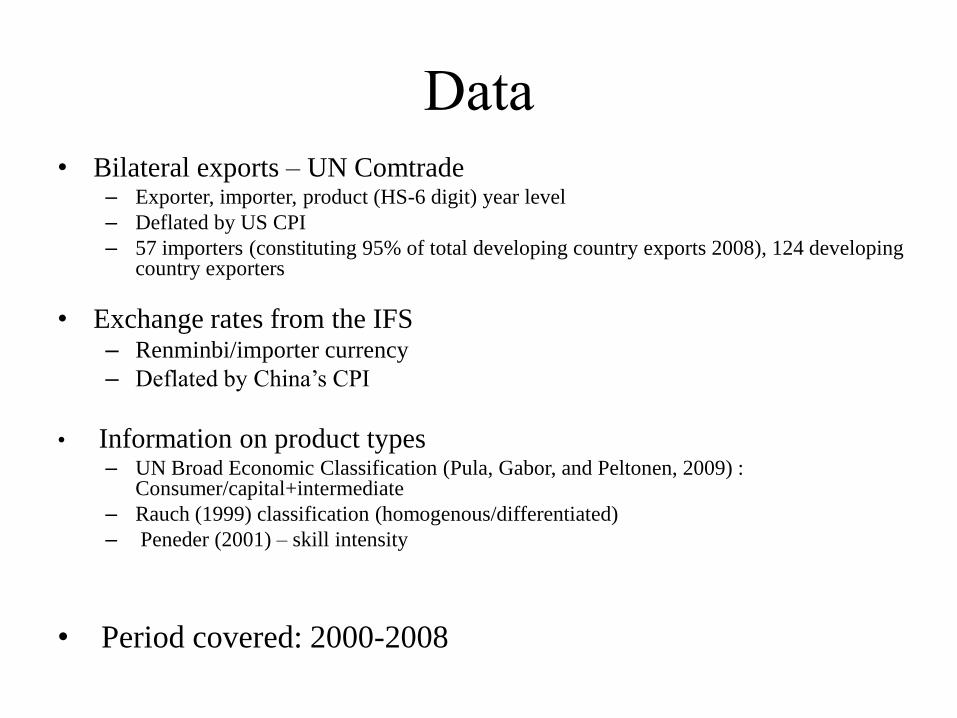
Data
• Bilateral exports – UN Comtrade – Exporter, importer, product (HS-6 digit) year level
– Deflated by US CPI
– 57 importers (constituting 95% of total developing country exports 2008), 124 developing country exporters
• Exchange rates from the IFS – Renminbi/importer currency
– Deflated by China’s CPI
• Information on product types – UN Broad Economic Classification (Pula, Gabor, and Peltonen, 2009) :
Consumer/capital+intermediate
– Rauch (1999) classification (homogenous/differentiated)
– Peneder (2001) – skill intensity
• Period covered: 2000-2008
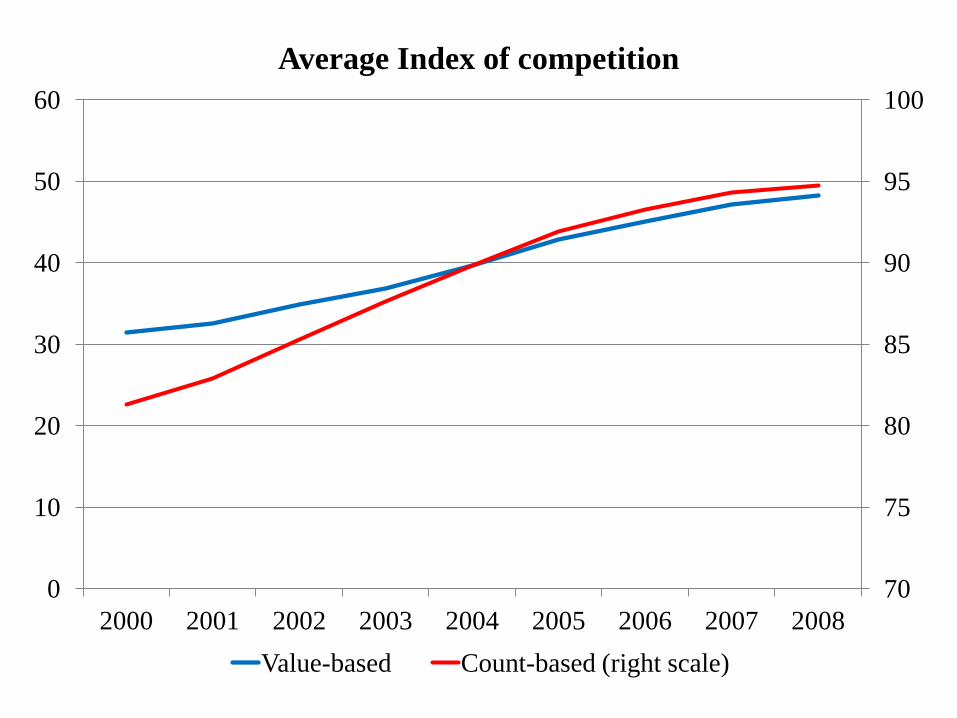
70
75
80
85
90
95
100
0
10
20
30
40
50
60
2000 2001 2002 2003 2004 2005 2006 2007 2008
Average Index of competition
Value-based Count-based (right scale)
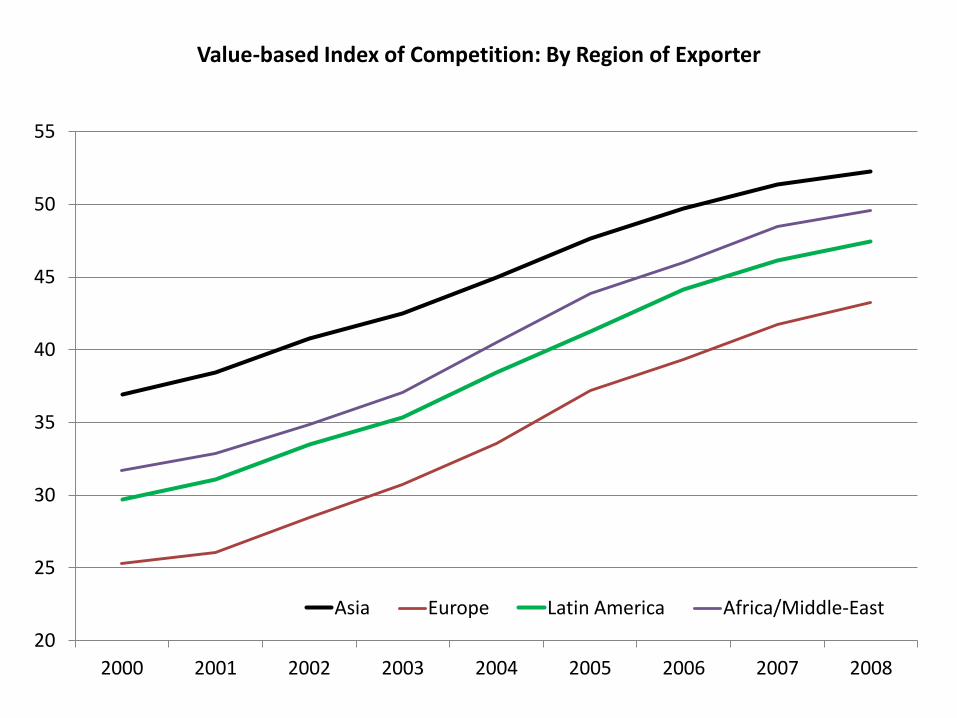
20
25
30
35
40
45
50
55
2000 2001 2002 2003 2004 2005 2006 2007 2008
Value-based Index of Competition: By Region of Exporter
Asia Europe Latin America Africa/Middle-East

80
90
100
110
120
130
140
2000 2001 2002 2003 2004 2005 2006 2007 2008
Figure 2: China's nominal bilateral exchange rate, 2000-08 (index, 2000=100; increase denotes depreciation)
United States Germany Japan United Kingdom

Table 1. Exports from Developing Countries and Chinese Exchange Rates: Product-Level
Evidence
Dependent variable = log(exports) at (exporter,importer,4-digit product, year) level
Value-based index of competition
[1] [2] [3] [4]
Index of competition with China*log(exchange rate
of importer with respect to China) -0.18*** -0.23*** -0.13*** -0.35***
[0.002] [0.001] [0.001] [0.004]
N 3,586,936 3,586,936 3,586,936 3,586,936
Fixed effects
exporter*importer*product N N N Y
exporter*importer*time N N Y Y
exporter*product*time N Y Y Y
importer*product*time N Y Y Y
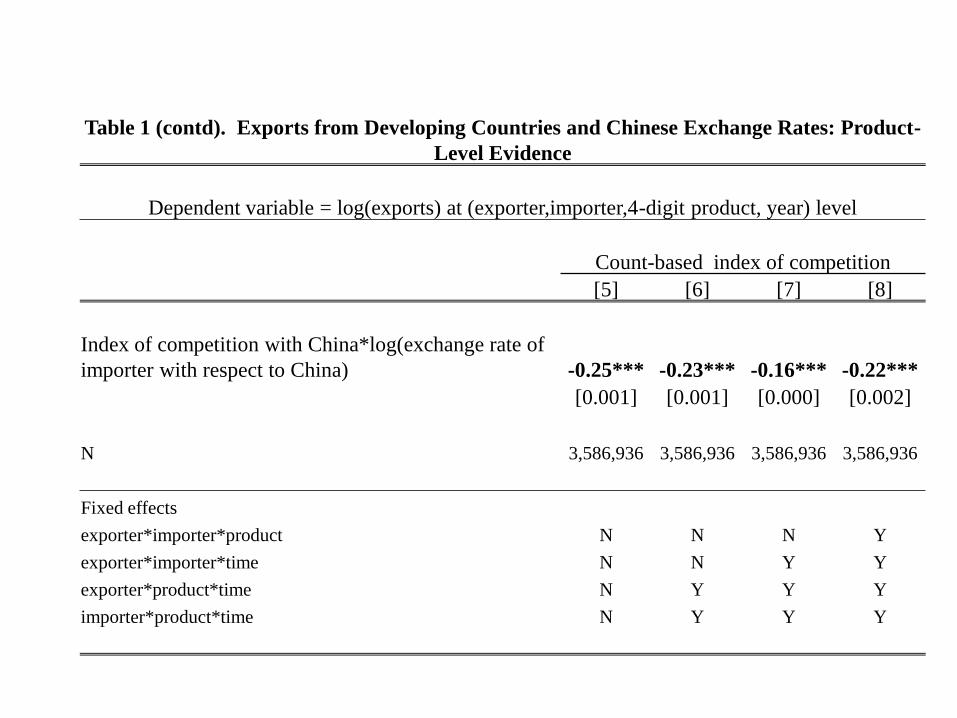
Table 1 (contd). Exports from Developing Countries and Chinese Exchange Rates: Product-
Level Evidence
Dependent variable = log(exports) at (exporter,importer,4-digit product, year) level
Count-based index of competition
[5] [6] [7] [8]
Index of competition with China*log(exchange rate of
importer with respect to China) -0.25*** -0.23*** -0.16*** -0.22***
[0.001] [0.001] [0.000] [0.002]
N 3,586,936 3,586,936 3,586,936 3,586,936
Fixed effects
exporter*importer*product N N N Y
exporter*importer*time N N Y Y
exporter*product*time N Y Y Y
importer*product*time N Y Y Y

Robustness tests
• Drop outliers
• Alternative clustering
• Different years for initial index of competition
• Finger-Krenin index of export similarity
• Alternative measures of the exchange rate variable
• Control for other countries’ exchange rate
• Across regions of exporters
• Degree of product disaggregation
• Long differencing (2000 and 2008)
• Lags of exchange rate
• Long-run effects

Discussion of magnitudes
• “Competitor-country effect” of 1.5-2 percent
due to a 10% depreciation of Chinese
exchange rate, evaluated at the average index
of competition

Range of Estimated Spillover Effect of a 10 percent Depreciation of Chinese Exchange Rate
Value-based index Count-based index Beta coefficients Baseline Min Max Baseline Min Max Percentile of the index of competition
10 -0.01 0.00 -0.01 0.00 0.00 0.00
50 -1.30 -0.47 -2.52 -1.99 -1.39 -3.74
90 -3.12 -1.13 -6.03 -2.22 -1.55 -4.17
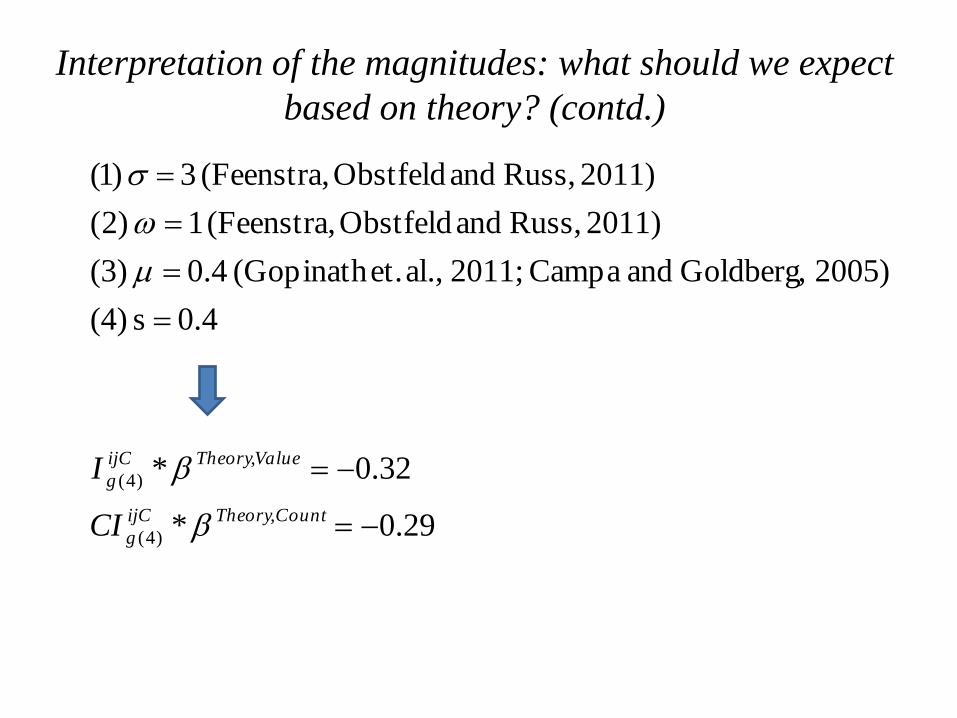
Interpretation of the magnitudes: what should we expect
based on theory? (contd.)
29.0*
0.32*
4.0 s (4)
2005) Goldberg, and Campa 2011; al., et.(Gopinath 0.4 (3)
2011) Russ, and Obstfeld (Feenstra, 1 )2(
2011) Russ, and Obstfeld (Feenstra, 3 )1(
,
)4(
,
)4(
CountTheoryijC
g
ValueTheoryijC
g
CI
I

Table 8. Products Distinguished by Degree of Differentiation
Dependent variable = log(exports) at (exporter,importer, 4-digit product, year) level
Value-based index
Homogenou
s Differentiated Interactio
n
[1] [2] [3]
Index of competition with China*log(exchange rate of importer with respect to China) -0.339*** -0.312*** -0.101***
[0.010] [0.004] [0.002]
Index of competition with China*log(exchange rate of importer with respect to China)*Dummy for homogenous -0.040***
[0.003]
N 981,310 2,679,680 1,326,035

Table 9. Products Distinguished by Domestic Value Added
Dependent variable = log(exports) at (exporter,importer, 4-digit product, year) level
Value-based index
High domestic
value added
Low domestic
value added Interaction
[1] [2] [3]
Index of competition with China*log(exchange rate of importer with respect to China) -0.329*** -0.285*** -0.283***
[0.005] [0.005] [0.007]
Index of competition with China*log(exchange rate of importer with respect to China)*Dummy for high domestic value added -0.125***
[0.013]
N 1,511,450 1,830,310 3,341,760
Conclusions
• Use detailed product-level data to develop an index of competition
with China, based on the extent of a country’s overlap with China
in its exports to third markets.
– Two indices based on value and count
• Adaptation of the Feenstra, Obstfeld and Russ (2011) framework to
derive the indices of competition and develop a novel identification
strategy
• Robust evidence that an appreciation of China’s exchange rate
benefits developing country exports.
• To our knowledge, first paper to provide systematic empirical
evidence on “competitor country” effect.

Thank you!