BEFORE THE STATE OF NEW YORK PUBLIC …FILE/ATTS2VXL/Exhibit_(LAR-1).pdfBEFORE THE STATE OF NEW YORK...
74
BEFORE THE STATE OF NEW YORK PUBLIC SERVICE COMMISSION In the Matter of Consolidated Edison Company Of New York, Inc. Case 09-E-0428 August 2009 Prepared Exhibits of: Liliya A. Randt Utility Engineer 2 Office of Electric, Gas and Water State of New York Department of Public Service Three Empire State Plaza Albany, New York, 12223-1350
Transcript of BEFORE THE STATE OF NEW YORK PUBLIC …FILE/ATTS2VXL/Exhibit_(LAR-1).pdfBEFORE THE STATE OF NEW YORK...
BEFORE THE STATE OF NEW YORK PUBLIC SERVICE COMMISSION
In the Matter of
Consolidated Edison Company Of New York, Inc.
Case 09-E-0428
August 2009
Prepared Exhibits of:
Liliya A. Randt Utility Engineer 2 Office of Electric, Gas and Water
State of New York Department of Public Service Three Empire State Plaza Albany, New York, 12223-1350
Liliya A. Randt
Exhibit (LAR-1)
List of Staff Information Requests
Staff Requests Exhibit Pages
DPS-1 1-2 DPS-3 3 DPS-141 4 DPS-361 5-49 DPS-397 50 DPS-449 51-61 DPS-450 62-72
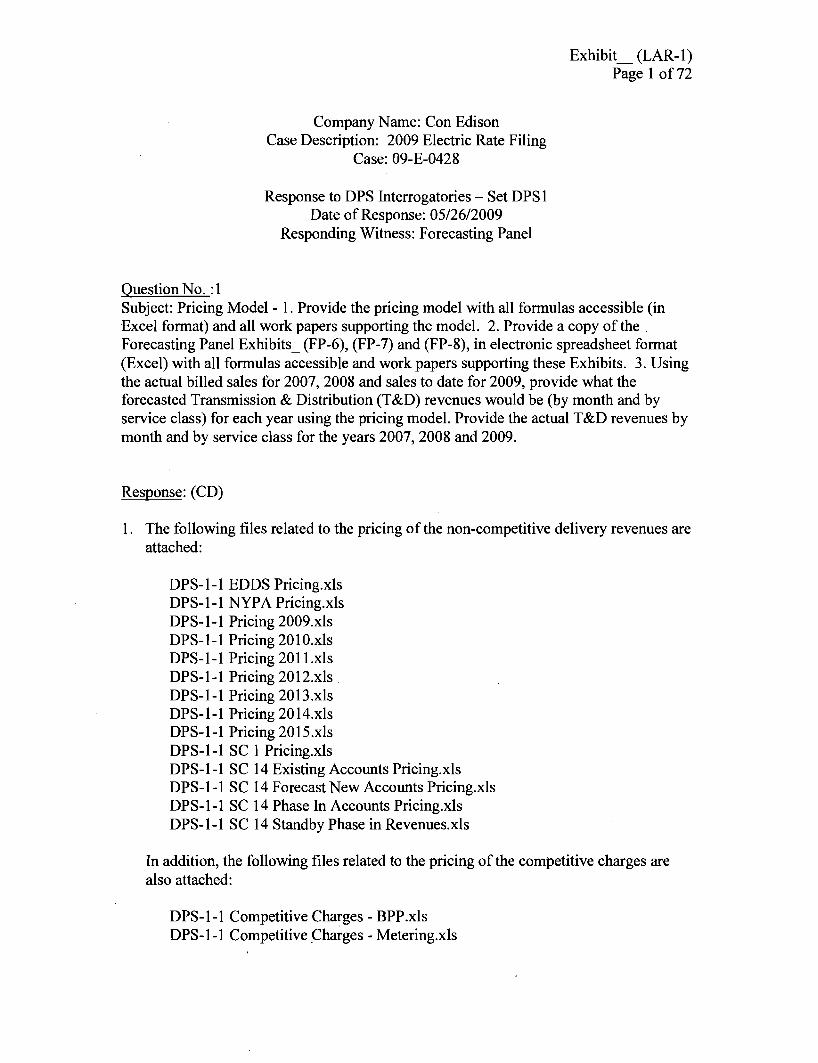
Exhibit_ (LAR-l) Page 1 of72
Company Name: Con Edison Case Description: 2009 Electric Rate Filing
Case: 09-E-0428
Response to DPS Interrogatories - Set DPSI Date of Response: OS/26/2009
Responding Witness: Forecasting Panel
OuestionNo. :1 Subject: Pricing Model - 1. Provide the pricing model with all formulas accessible (in Excel format) and all work papers supporting the model. 2. Provide a copy ofthe . Forecasting Panel Exhibits_ (FP-6), (FP-7) and (FP-8), in electronic spreadsheet format (Excel) with all formulas accessible and work papers supporting these Exhibits. 3. Using the actual billed sales for 2007, 2008 and sales to date for 2009, provide what the forecasted Transmission & Distribution (T&D) revenues would be (by month and by service class) for each year using the pricing model. Provide the actual T&D revenues by month and by service class for the years 2007,2008 and 2009.
Response: (CD)
1. The following files related to the pricing of the non-competitive delivery revenues are attached:
DPS-l-l EDDS Pricing.xls DPS-l-l NYPA Pricing.xls DPS-l-l Pricing 2009.xls DPS-l-l Pricing 201O.xls DPS-l-l Pricing 20ll.xls DPS-l-l Pricing 20l2.xls . DPS-l-l Pricing 20l3.xls DPS-l-l Pricing 20l4.xls DPS-l-l Pricing 20l5.xls DPS-l-l SC I Pricing.xls DPS-l-l SC 14 Existing Accounts Pricing.xls DPS-l-l SC 14 Forecast New Accounts Pricing.xls DPS-l-l SC 14 Phase In Accounts Pricing.xls DPS-l-l SC 14 Standby Phase in Revenues.xls
In addition, the following files related to the pricing of the competitive charges are also attached:
DPS-l-l Competitive Charges - BPP.xls DPS-l-l Competitive Charges - Metering.xls

Exhibit_ (LAR-I) Page 2 of72
DPS-I-I Competitive Charges - MFC (Credit and Collection).xls DPS-I-I Competitive Charges - MFC (Supply).xls DPS-I-I Competitive Charges - MFC (Working Capital).xls
Data that support these pricing files are provided in the following attached files:
DPS-I-I BIR Forecast.xls DPS-I-I Number of Bills Forecast.xls DPS-I-I NYPA Sales and Demand.xls DPS-I-I Sales.xls DPS-I-I SalesAllocation.xls
2. Copies of Forecasting Panel Exhibit _ (FP-6), Exhibit _ (FP-7) and Exhibit_ (FP-8) in electronic spreadsheet format are attached as DPS-I-2 Exhibit FP-6, DPS-I2 Exhibit FP-7 and DPS-I-2 Exhibit FP-8, respectively.
Please note that the hardcopies of the Forecasting Panel Exhibit _ (FP-7), Exhibit _ (FP-8) and Exhibit _ (FP-9) that were submitted in the filing contained incorrect figures for the forecasted sales volumes for NYPA (the sales were 20 GWh higher in the exhibit). The attached copies ofDPS-I-2 Exhibit FP-7 and DPS·I-2 Exhibit FP-.8 provide the corrected figures. The corrected version of Forecasting Panel Exhibit _ (FP-9) is also attached as DPS-I-2 Exhibit FP-9. The Company did not use the sales amounts in the pricing files.
In addition to the files provided in Question I above, the following additional files that support these two exhibits are attached:
DPS-I-2 Competitive Charges BPP (rate increase).xls DPS-I-2 Competitive Charges Metering (rate increase).xls DPS-I-2 Competitive Charges MFC - Credit and Collection (rate increase).xls DPS-I-2 Competitive Charges MFC - Supply (rate increase).xls DPS-I-2 Competitive Charges MFC - Working Capital (rate increase).xls DPS-I-2 DSM.xls DPS-I-2 EDDS Forecast.xls DPS-I-2 Master Actual DSM Impacts.xls DPS-I-2 MSC and MAC Revenue.xls DPS-I-2 NYPA Pricing Proposed Rate.xls DPS-I-2 RYI Revenues with Proposed Rate Inc.xls DPS-I-2 Sendout.xls
3. See the attached file, DPS-I-3.xls, for the projected and actual T&D revenues for 2007, 2008 and first four months of 2009.
Exhibit_ (LAR-1) Page 3 of72
Company Name: Con Edison Case Description: 2009 Electric Rate Filing
Case: 09-E-0428
Response to DPS Interrogatories - Set DPSI Date of Response: OS/26/2009
Responding Witness: Accounting Panel
Question No. :3 Subject: Plant in Service Model - Provide an electronic version of the Company's Plant in Service Model (in Excel format), with all formulas unlocked.
Response:
See attached CD.

Exhibit_ (LAR-1) Page 4 of72
Company Name: Con Edison Case Description: 2009 Electric Rate Filing
Case: 09-E-0428
Response to DPS Interrogatories - Set DPS 16 Date of Response: 06/29/2009
Responding Witness: Rate Panel
Question No. :141 . Subject: BPP Charge - As a follow-up to an informal phone conversation between the Company and Staff on June 17, 2009, confirm the accuracy of the $ 468,139 for Postage (Account 00368) in the Company's Exhibit_(ERP-l) Schedule 4, page 1. Does the Company plan to correct this value in its update filing, if not, explain why not.
Response: The Company plans to correct this at the completion of the case. The impact on the Billing and Payment Processing Charge and T&D class rates is insignificant.

Exhibit_ (LAR-I) Page 5 of72
Company Name: Con Edison Case Description: 2009 Electric Rate Filing
Case: 09-E-0428
Response to DPS Interrogatories - Set DPS39 Date of Response: 08/10/2009
Responding Witness: Rate Panel
Question No. :361 Subject: Declining Block Rates - 1. Provide an analysis of the estimated electric T&D revenues currently being collected through the Company's declining block rates, for each class. 2. Provide the resulting proposed new rates and charges for the SC1, SC2, SC7, SC8 SC12 and the proposed re-designed SC9 rate classes, similar to that provided in Exhibit_(ERP-3) Schedule 4, assuming a flat rate block structure instead of the existing declining block rate structure. 3. Provide the resulting comparison of bills for the SCI, SC2, SC7, SC8 SC12 and the proposed re-designed SC9 rate classes, similar to that provided in Exhibit_(ERP-3) Schedule 7, assuming a flat rate block structure instead of the existing declining block rate structure.
Response: 1. Provide an analysis of the estimated electric T&D revenues currently being collected
through the Company's declining block rates, for each class.
See attached marked DPS-361-1. As shown on the attached, only about 11% of annual T&D revenues for Con Edison classes at current May 2009 rates are collected through declining block rates.
2. Provide the resulting proposed new rates and charges for the SC1, SC2, SC7, SC8 SC12 and the proposed re-designed SC9 rate classes, similar to that provided in Exhibit_CERP-3) Schedule 4, assuming a flat rate block structure instead of the existing declining block rate structure.
See attached DPS-361-2 which compares the non-competitive T&D rates for SCI, SC2, SC 7, SC8, and SC12 and the re-designed SC9 rate class at the current May 2009 rate level with redesigned May 2009 T&D rates under a flat block rate structure. For SC 1; 2,8,9 and 12, the redesigned May 2009 T&D rates reflect flat rates for all kWh and/or kW blocks. Monthly customer charges and minimum demand or energy charges were maintained in each class, as applicable. Consistent with current rate design methodology, the summer per kWhr rates in SC 7 Rate I for all usage blocks and the SC 7 Rate I winter rates for usage up to 360 kWh were set identical to the
. redesigned SC 1 Rate I flat per kWhr rate. The SC 7 Rate I customer charge was set equal to the SC 1 customer. The remaining revenue requirement for SC 7 Rate I was allocated to the over 360 kWh winter block rate. The competitive service rates applicable to all service classes are already flat charges.
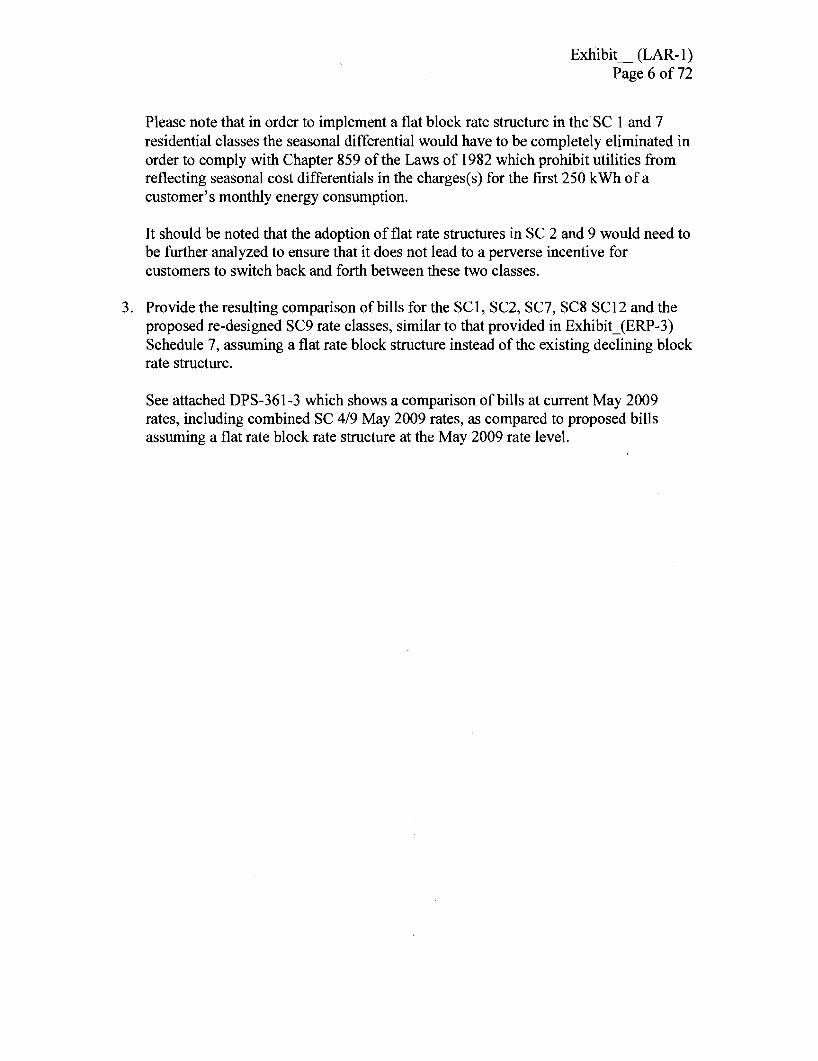
Exhibit_ (LAR-I) Page 6 of 72
Please note that in order to implement a flat block rate structure in the SC I and 7 residential classes the seasonal differential would have to be completely eliminated in order to comply with Chapter 859 of the Laws of 1982 which prohibit utilities from reflecting seasonal cost differentials in the charges(s) for the first 250 kWh of a customer's monthly energy consumption.
It should be noted that the adoption of flat rate structures in SC 2 and 9 would need to be further analyzed to ensure that it does not lead to a perverse incentive for customers to switch back and forth between these two classes.
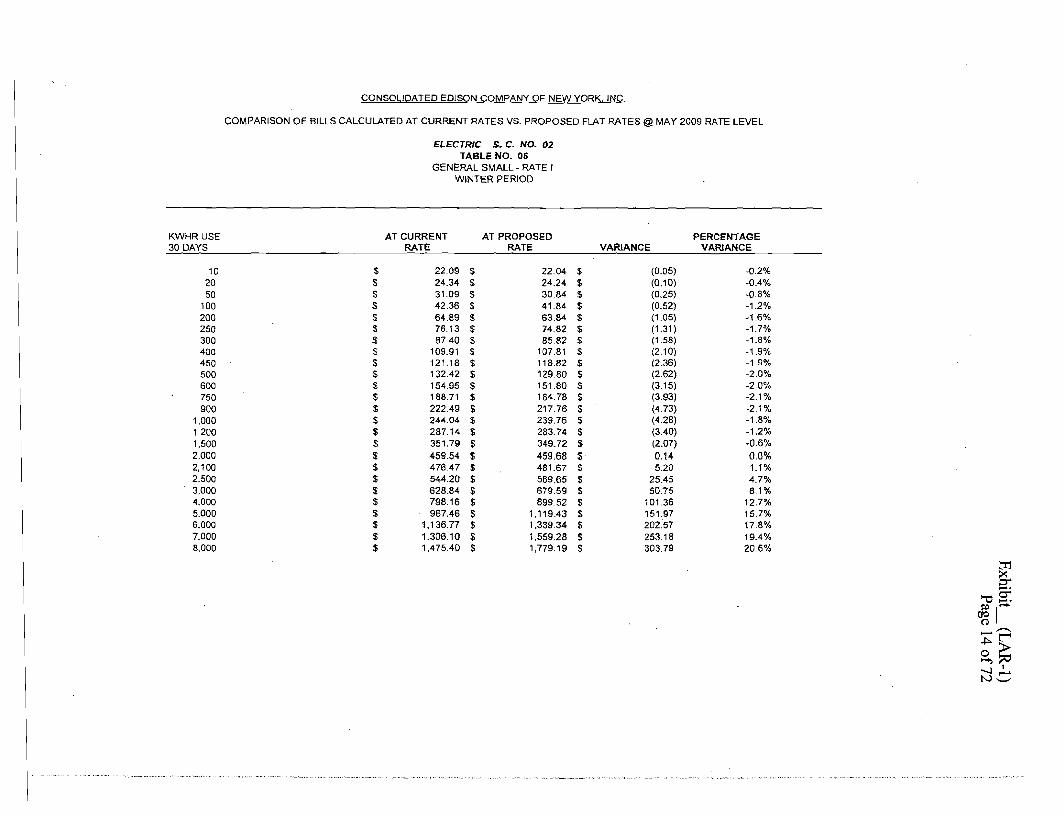
3. Provide the resulting comparison of bills for the SCI, SC2, SC7, SC8 SCI2 and the proposed re-designed SC9 rate classes, similar to that provided in Exhibit_(ERP-3) Schedule 7, assuming a flat rate block structure instead of the existing declining block rate structure.
See attached DPS-361-3 which shows a comparison of bills at current May 2009 rates, including combined SC 4/9 May 2009 rates, as compared to proposed bills assuming a flat rate block rate structure at the May 2009 rate level.
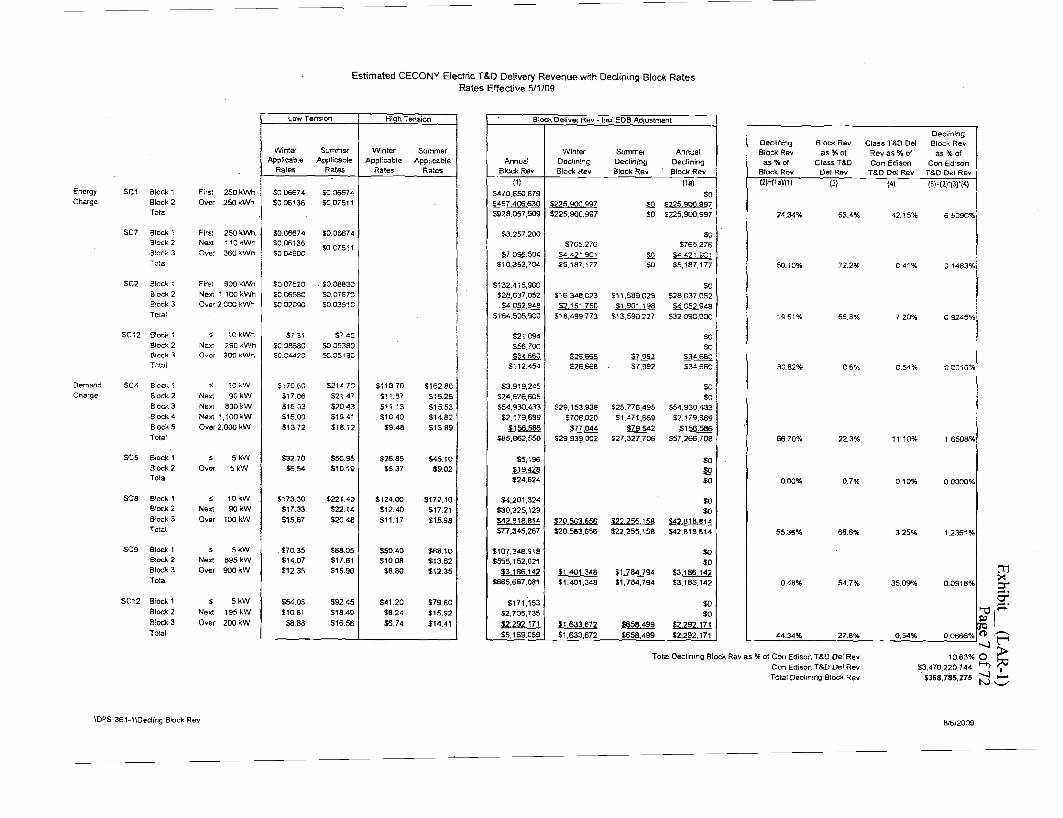
Estimated CECONY Electric T&0 Delivery Revenue with Declining Block Rates Rates Effective 5/1/09
low Teoslon Hi~h Tension
Winter Summer Winter Summer Applicable Applicable Applicable Applicable
Rates Rates Rates Rates
5006674 50.06674
5006136 50.07511
50.06674 50.06674 $0.06136
SO07511 SOQ.<:60C
SO07520 . $0.08830
SC.C6580 SC.07870
$00209C SO.03510
$7.3i 57.40
50.08680 $009380 SO.0"42C SC.05 13C
S',7060 S21~ 7G $118.70 5162.80 $17.06 52147 $'1.87 516.2B 51603 520.43 511 13 51553 515.00 519.41 510.40 $14.82
51372 $18.12 S9.48 $13B9
$32.70 $50.95 $26.85 $45.10 $6.54 $10.19 $5.37 S902
S173.30 $221.40 $124.00 ·$172,10 S17,33 $22.14 $12.40 $17.21 $15.67 S20.48 $11.17 $15,9B
$70.35 $BB.05 $50.40 $68.10 $14.07 $17.61 $10.08 513,62 512.35 $15.90 5BSC 512.35
554.05 59245 54120 $79.60 $10.B1 $1849 $8.24 $15.92
$B88 $16.56 $6.74 $14,41
Block Denver Rev ~ Ina EOB Adjustment
Winter Summer Annual Annual Declininq Declining Declininq
Block Rev Block Rev Block Rev Block Rev
{1} (1a) Energy SC1 Block 1 First 250 kWh $470,65O,B79 $0 Charge Blocl< 2 Over 250 kWh $457406 630 $225.900.997 §Q 5225 900.997
Total $928,057,509 5225,900,997 SO 5225,900,997
SC7 Block 1 First 250 kWh $3,257,200 so Bleck 2 Next 11Gi<Wh S765.276 $765,276 B!oCi< 3 Over 360 '{VI/n $7096,504 54 ";2~ 90, iQ 54 "'21 9C-: Total 510,353,704 SS.'i87.ln SO 55, 1B7,177
Se2 Bleck t Firs: 9OO<Wh $132.415,900 SO Block 2 Next ~ , OC ~VVh 528,037,052 $16.348,023 511,689029 52B,037.052 Block 3 Over 2.00c kV\'rl $4 052 948 $2151750 $1.901,i98 $4 052.94<1 To:ai S'i&:.505,900 518,499.773 513,590.227 532.090.000
Se12 Bloc\<. \ s ickWh 521,Og" SO Bloc!.<2 Next 290,Wh 556.700 SO Bloc\.l 3 O v er ~O{) kW!'; ~34660 S2€SSa 57992 .$3.G.66C Totai 5112.45' 526,668 57,992 $:Y~,66'J
Demand SC4 BiClC'~ ~ s iCkW $3,919,245 SO Cnarge 810ck 2 Ne~ 90 k\.'V 524,676,605 $0
Blcck3 Nelli 800~W 554.930,433 529,153,938 525,776,495 554,930.433 BlOck 4 Ne'" 1,100kW $2,179,689 5708,020 $1,471,669 $2, '79,689 Block 5 Over 2,000 kW 577044 $79542 $156.586 Total
!J.!l§.~
$85,662,558 529. 939,002 $27,327,706 557,266,706
SC5 Block 1 s 5kW 55,196 SO Siock 2 Over 5kW mm IQTotal $(]'S24,624
SeB Block 1 10kW $4,201,324 SO• Block 2 Next 90kW $30,325,129 so Block 3 Over 100 kW $42818.814 $20563656 $22255.15B 142 B18 814 Total $77 ,345,267 $20,563,656 S22,255,158 $42,81B,814
SC9 Block 1 s 5kW $ 107,348.918 so Block 2 Next B95kW $555,152,021 SO Block 3 Over 900kW $3186142 $1401348 $1 784794 53186142 Total 5665,6B7,081 $1,401,348 $1,784,794 $3,186,142
Se12 Block 1 s 5kW $171,153 $0 Block 2 Next 195kW $2,705,735 SO Block 3 Over 200kW &m.lli .u.M1lli ~ i2.m.lli Total $5,169.059 $1,633,672 $668,499 $2,292,171
Declining OeclinMg Block Rev Class 1'&0 Del Brock Rev BlOck Rev as %01 Rev as % of as %of
as OAr of Class T&D Con Edison Con Edison Block Rev De! Rev T&D Del Rev T&O Del Rev
(2)-(I'V{1) (3) (4) (5)-(2)"{3)'(4)
24.34'.. 63.4% 42.15% 6.5090%
50.10% 72.2% 0,41% G 1483%
195~% 65.8% 720% G92.c::.5%
30.82% 06% 0.54% C OC'O%
66.70% 22.3% 11.10% 16508%
0.00% 0.7% 0.10% 0.0000%
55.36% 68.6% 3.25% 1.2351%
OAB% 54.7o/Q 35.09".. 0.091B%
44.34% 27.B% 0,54%
Total Declining Bloc!< Rev as % of Con Edison T&D Del Rev
Con Edison T&D Del Rev
Total Decl,ning Siock Rev
IDPS-361-1IOedin9 Block Rev 81012009
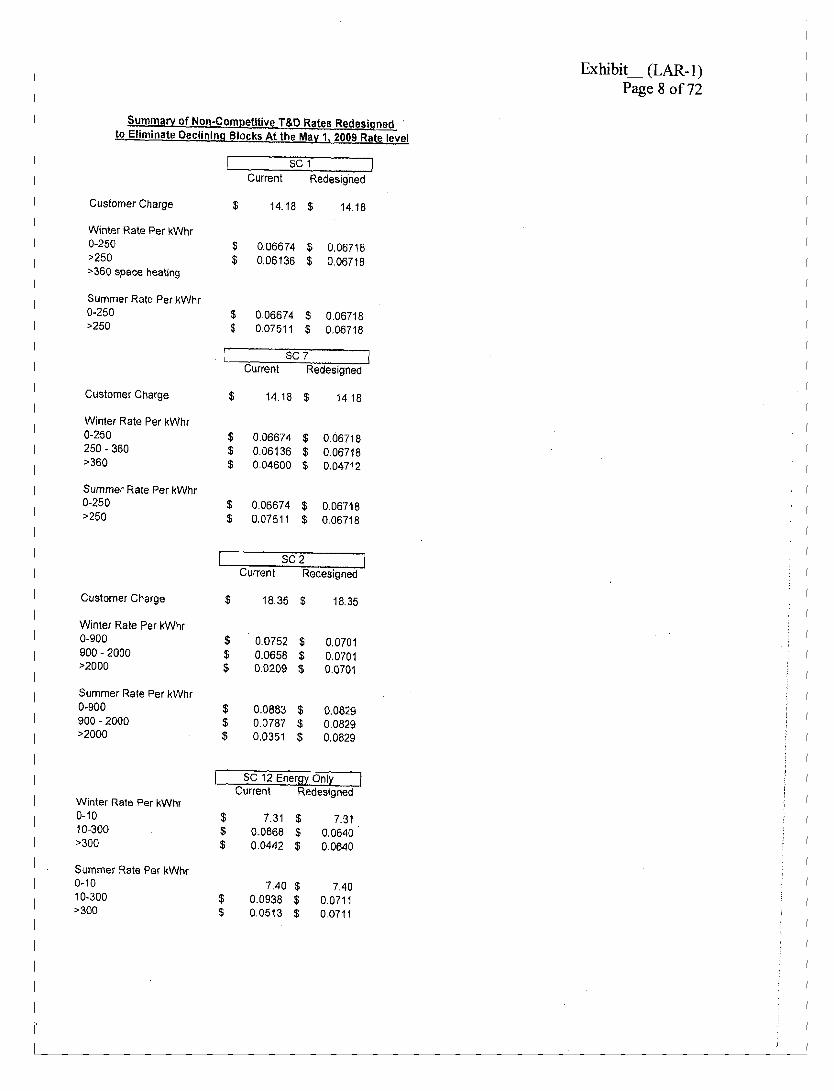
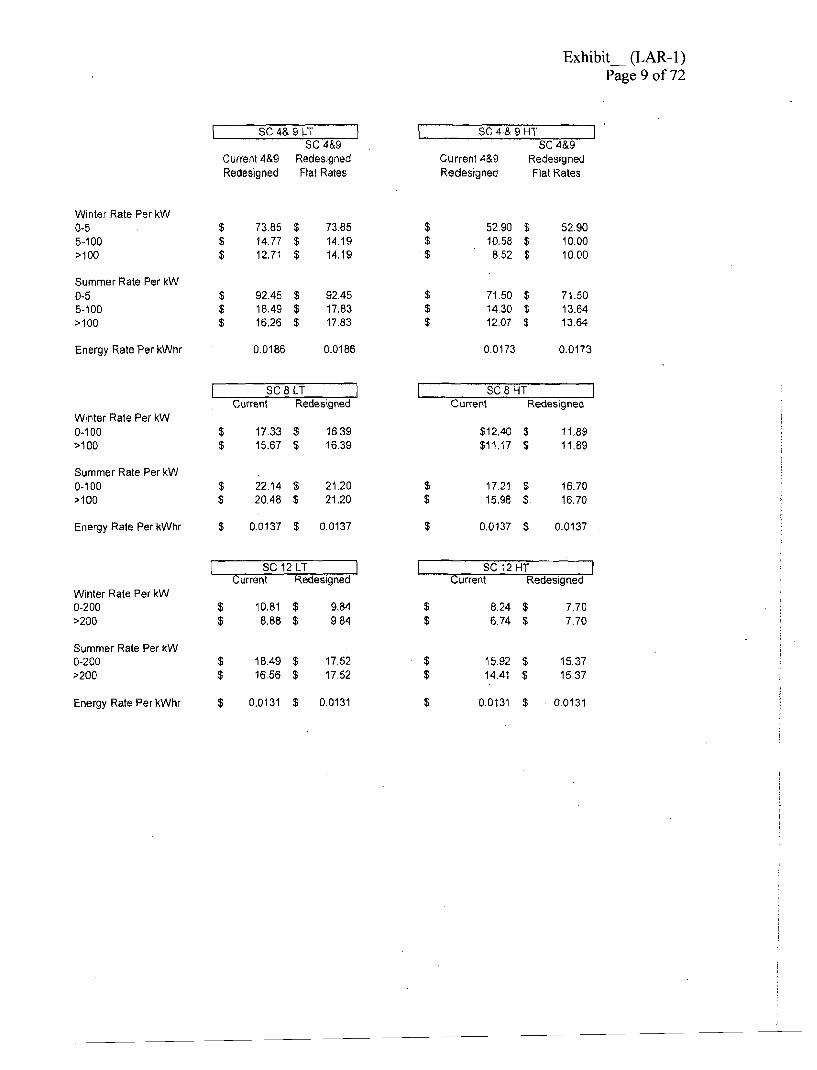
Exhibit_ (LAR-l) Page 90f72
SC 4& 9 ~T
SC 4&9 Current 4&9 Redesigned Redesigned Flat Rates
SC 4& 9 HT SC4&9
Current 4&9 Redesigned Redesigned Flat Rates
Winter Rate Per kW 0-5 5-100 >100
$ 73.85 $ 1477 $ 12.71
$ 73.85 $ 14.19 $ 14.19
$ $ $
5290 10.58 8.52
s 52.90 $ 10.00 $ 10.00
Summer Rate Per kW 0-5 5-100 >100
$ 92.45 $ 18.49 $ 16.26
$ 92.45 $ 17.83 $ 17.83
$ $ $
7150 14.30 12.07
$ 71.50 $ 13.64 s 13.64
Energy Rate Per kWhr 0.0186 0.0186 0.0173 0.0173
Winter Rate Per kW 0-100 >100
ISC 8 LT Current Redesigned
$ 17.33 $ 1639 $ 15.67 $ 16.39
SC 8 HT Current Redesigned
$12.40 $ 11.89 $11.17 $ 11.89
Summer Rate Per kW 0-100 >100
$ 22.14 $ 20.48
$ 21.20 $ 21.20
$ $
17.21 15.98
$ 16.70 $ 16.70
Energy Rate Per kWhr $ 0.0137 $ 00137 $ 0.0137 $ 0.0137
Winter Rate Per kW 0-200 >200
SC 12 LT I Current Redesigned
$ 10.81 $ 9.84 $ 8.88 $ 984
$ $
SC 12 HT Current Redesigned
8.24 $ 7.70 6.74 $ 7.70
Summer Rate Per kW 0-200 >200
$ 18.49 $ 1656
$ 17.52 $ 17.52
$ $
15.92 14.41
$ 1537 $ 15.37
Energy Rate Per kWhr $ 0.0131 $ 0.0131 $ 0.0131 $ 00131

CONSOLIDATED EDISON COMPANY OF NEW YORK, INC.
COMPARISON OF BILLS CALCULATED AT CURRENT RATES VS. PROPOSED FLAT RATES @ MAY 2009 RATE LEVEL
ELECTRIC S. C. NO. 01 TABLE NO. 01
RESIDENTiAl AND RELIGIOUS - RATE 1 - Flat Annual Rate WINTER PERIOD
KWHR USE AT CURRENT AT PROPOSED PERCENTAGE 30 DAYS RATE RATE VARIANCE VARIANCE
0 s 15.56 s 15.56 s 0.0% 10 S 17.72 s 17.72 S 0.0% 20 s 19.88 s 19.89 S 0.01 0.1% 30 s 22.04 $ 22.06 S 0.02 0.1% 50 S 26.36 S 26.38 S 0.02 0.1% 60 S 28.54 s 28.57 $ 0.03 0.1% 80 S 32.87 $ 32.90 $ 0.03 0.1%
100 S 37.18 s 37.23 S 0.05 0.1% 120 S 4150 s 41.55 s 0.05 0.1% 150 s 47.99 S 48.06 $ 0.07 0.1% 200 S 58.82 s 58.92 S 0.10 0.2% 210 $ 60.99 :5 61.08 :5 0.09 0.1% 240 :5 6746 s 67.57 s 0.11 0.2% 250 s 69.63 s 69.74 S 0.11 0.2% 300 s 80.16 $ 80.57 $ 0.41 0.5% 360 :5 92.80 $ 93.57 s 0.77 0.8% 400 $ 101.24 $ 102.25 $ 1.01 1.0% 450 s 111.77 s 113.07 $ 1.30 1.2% 500 $ 122.32 $ 123.92 s 1.60 1.3% 750 $ 175.00 S 178.11 s 3.11 1.8% 780 $ 181.32 s 184.60 $ 3.28 1.8%
1,000 $ 227.68 s 232.27 $ 4.59 2,0% 1,500 s 333.06 $ 340.65 $ 7.59 2.3% 3.000 $ 649.16 $ 665.73 $ 16.57 2.6% 5,000 $ 1.070.65 S 1,099.19 $ 28.54 2.7%
10,000 20,000 30,000
s $ $
2,124.35 4,231.76 6,339.17
s $ $
2,182.83 4,350.09 6,517.37
$ s $
58.48 .118.33 178.20
2.8% 2.8% 2.8%
t'r:l ~ ::r_.
40.000 $ 8.446.57 $ 8,684.63 $ 238.06 2.8% ""Cst ~ I..... ~ -,-...Or o >....,iO -1'N--=

CONSOLIDATED EDISON COMPANY OF NEW YORK, INC.
COMPARISON OF BILLS CALCULATED AT CURRENT RATES VS. PROPOSED flAT RATES @ MAY 2009 RATE LEVEL
ELECTRIC S. C. NO. 01 TABLE NO. 02
RESIDENTIAL AND RELIGIOUS - RATE I - Flat Annual Rate SUMMER PERIOD
KWHRUSE AT CURRENT AT PROPOSED PERCENTAGE 30 DAYS RATE RATE VARIANCE VARIANCE
0 $ 15.56 $ 15.56 $ 0.0% 10 s 17.72 $ 17.72 s 0.0% 20 $ 19.88 $ 19.89 S 0.01 0.1% 30 S 22.04 s 22.06 $ 0.02 0.1% 50 S 26.36 s 26.38 $ 0.02 0.1% 60 $ 28.54 $ 28.57 $ 0.03 0.1% 80 S 32.87 s 32.90 $ 0.03 0.1%
100 S 37.18 S 37.23 $ 0.05 0.1% 120 s 41.50 s 41.55 s 0.05 0.1% 150 s 47.99 S 48.06 s 0.07 0.1% 200 $ 58.82 $ 58.92 S 0.10 0.2% 210 S 60.99 $ 61.08 s 0.09 0.1% 240 $ 67.46 S 67.57 s 0.11 0.2% 250 s 69.63 $ 69.74 s 0.11 0.2% 300 s 80.87 S 80.57 s (0.30) ·0.4% 360 $ 94.37 $ 93.57 $ (0.80) -0.8% 400 s 103.36 s 102.25 $ (1.11) -11% 450 $ 114.60 $ 113.07 $ (1.53) -1.3% 500 s 125.84 s 123.92 s (1.92) -15% 750 s 182.07 s 178.11 S (3.96) -2.2% 780 $ 188.81 $ 184.60 S (4.21) -2,2%
1,000 S 238.28 $ 232.27 $ (6.01) -2.5% 1,500 s 350,73 $ 340.65 S (10.08) -2.9% 3,000 s 688.05 $ 665.73 s (22.32) -3.2% 5,000 $ 1,137.83 s 1,099.19 $ (38.64) -3.4%
10,000 s 2,262.25 $ 2,182.83 s (79,42) -3.5% 20.000 s 4,511.08 $ 4,350.09 $ (160.99) -3.6% ~ 30,000 s 6,759.92 s 6,517.37 $ (242.55) -3.6% :::::r..... 40,000 s 9,008.75 $ 8,684.63 s (324.12) -3.6% ""Cst
~( ...... ,-... ...... t""'"
o >~flj
'........N';::

CONSOLIDATED EDISON COMPANY OF NEW YORK, INC,
COMPARISON OF BILLS CALCULATED AT CURRENT RATES VS. PROPOSED FLAT RATES@ MAY 2009 RATE LEVEL
ELECTR!C S. C. NO. 07 TABLE NO. 35
RESIDENTIAL AND RELIGIOUS - SPACE or SPACE and WATER HEATING - RATE I • All Blocks Except Sp Ht Set At Flat SC 1 Rate WINTER PERIOD
KWHR USE AT CURRENT AT PROPOSED PERCENTAGE 30 DAYS RATE RATE VARIANCE VARIANCE
0 s 15.56 $ 15.56 $ 0.0% 10 S 17.71 S 17.71 S 0.0%
100 S 37.13 S 37.18 s 0.05 0.1% 120 S 41.44 S 41.49 $ 0.05 0.1% 150 $ 47.91 s 47.98 s 0.07 0.1% 200 S 58.70 S 58.80 s 0.10 0.2% 210 S 60.87 s 60.96 $ 0.09 0.1% 240 s 67.32 S 67.43 s 0.11 0.2% 250 S 69.48 S 6959 $ 0.11 0.2% 300 s 80.00 s 80.41 $ 0.41 0.5% 360 S 92.60 s 93.37 S 0.77 0.8% 400 $ 100.37 $ 101.19 S 0.82 0.8% 450 s 110.10 $ 110.98 S 0.88 0.8% 500 $ 119.81 $ 120.75 $ 0.94 0.8% 750 S 168.40 s 169,62 s 1,22 0.7% 780 $ 174.24 $ 176.50 S 1,26 0.7%
1,000 $ 216.99 s 218.50 s 1.51 0.7% 1,500 $ 314.19 s 316.28 s 2.09 0.7% 2,500 $ 508.57 s 511.81 $ 3.24 0.6% 3,000 s 605.74 $ 609.56 $ 3.82 0.6% 5,000 S 994.50 S 1,000.62 $ 6.12 0.6%
10,000 $ 1,966.38 s 1,978.26 $ 11.88 0.6% 20,000 $ 3,910.14 $ 3,933.54 $ 23.40 0.6% 30,000 s 5,853.89 s 5,888.81 $ 34.92 0.6% 40,000 S 7,797.65 $ 7,844.09 $ 46.M 0.6% 50,000 60,000
s s
9,741.40 11,685.16
S s
9,799.36 11,754.64
$ $
57.96 69.48
0.6% 0.6% m
~ 70,000
100,000 $ s
13,628.92 19,460.19
$ $
13,709.92 19,575.75
$
$ 81.00
115',56 0.6% 0.6%
::r'.... ~g:
120,000 s 23.347.70 s 23,486.30 $ 138.60 0.6%
~( ...... ,--... Nt"'"' o >>-!')~ -...l' N~

CONSOLIDATED EDISON COMPANY OF NEW YORK, INC.
COMPARISON OF BILLS CALCULATED AT CURRENT RATES VS. PROPOSED FLAT RATES @ MAY 2009 RATE LEVEL
ELECTRIC S. C. NO. 07 TABLE NO, 36
RESIDENTIAL AND RELIGIOUS - SPACE or SPACE and WATER HEATING - RATE 1- All Blocks Set At Flat SC 1 Rate SUMMER PERIOD
KWHR USE AT CURRENT AT PROPOSED PERCENTAGE 30 DAYS RATE RATE VARIANCE VARIANCE
a s 15.56 S 15.56 s 0.0% 10 S 17.71 S 17.71 S 0.0%
100 s 37.13 s 37.18 s 0.05 0.1% 120 S 41.44 $ 41.49 S 0.05 0.1% 150 $ 47.91 S 47.98 S 0.07 0.1% 200 S 58.70 $ 58.80 s 0.10 0.2% 210 s 60.87 s 60.96 s 0.09 0.1% 240 S 67.32 s 67.43 S 0.11 0.2% 250 s 69.48 S 69.59 S 0.11 0.2% 300 s 80.71 s 80.41 s (0.30) -0.4% 360 s 94.17 s 93.37 $ (0.80) -0.8% 400 s 103.13 $ 102.02 S (1.11) -1.1% 450 s 114.36 S 112.83 s (1.53) -1.3% 500 $ 125.56 $ 123.64 $ (1.92) -1.5% 750 s 181.64 $ 177.68 $ (3.96) -2.2% 780 s 188.37 s 184.16 $ (4.21) -2.2%
1.000 S 237.71 S 231.70 $ (6.01) -25% 1,500 $ 349.88 s 339.80 s (10.08) -2.9% 2,500 s 574.21 s 555.97 s (18.24) -3.2% 3,000 $ 686,35 s 664.03 $ (22.32) -3.3% 5,000 S 1.135.00 S 1.096.36 $ (38.64) -3.4%
10,000 s 2,256.59 s 2.177.17 $ (79.42) -3.5% 20,000 s 4.499.77 $ 4.338.78 s (160.99) -3.6% 30,000 S 6.742.94 $ 6,500.39 $ (242.55) -3.6% 40,000 s 8,986.12 $ 8,662.00 $ (324.12) -3.6% 50.000 60.000 70,000
s s S
11.229.31 13.472.49 15.715.67
s $ $
10.823.62 12,985.23 15.146.85
$ s S
(405.69) (487.26) (568.82)
-3.6% -3.6% -3.6%
tn IX::r......
100,000 120,000
$ $
22.445.21 26,931.57
$ $
21.631.68 25,954.91
$
s (813.53) (976.66)
-3.6% -3.6%
'i:lg:c§( ...... ,.-..,wl' o ;I;>'""'lid
'........N~
CONSOLIDATED EDISON COMPANY OF NEW YORK. INC.
COMPARISON OF BILLS CALCULATED AT CURRENT RATES VS. PROPOSED FLAT RATES @ MAY 2009 RATE LEVEL
ELECTRIC S. C. NO. 02 TABLE NO. 05
GENERAL SMALL - RATE I WINTER PERIOD

CONSOLIDATED EDISON COMPANY OF NEW YORK, INC.
COMPARISON OF BILLS CALCULATED AT CURRENT RATES VS. PROPOSED FLAT RATES @ MAY 2009 RATE LEVEL
ELECTRIC S. C. NO. 02 TABLE NO. 06
GENERAL SMALL - RATE I SUMMER PERIOD

CONSOLIDATED EDISON COMPANY OF NEW YORK, INC,
COMPARISON OF BILLS CALCULATED AT CURRENT RATES VS, PROPOSED FLAT RATES @ MAY 2009 RATE LEVEL
ELECTRIC S, C, NO, 08 TABLE NO. 39
MULIPLE DWELINGS - REDISTRIBUTION - LOW TENSION WI NTER PERIOD
300 HOURS USE OF DEMAND PER MONTH
KWHRUSE 30 DAYS
kW DEMAND
AT CURRENT RATE
AT PROPOSED RATE VARIANCE
PERCENTAGE VARIANCE
3,000 4,000 5,000
10,000 15,000 20,000 30,000 40,000 50.000 60,000 80,000 90,000
100,000 120,000 150,000 200,000 300,000 450,000
10.00 13.33 16.66 33.33 50.00 66.66
100.00 133.33 166.66 200.00 266.66 300.00 333.33 400.00 500.00 666.66
1,000.00 1,500.00
S 669.25 $ 886.01 $ 1,102.77 $ 2,18688 S 3,271.01 S 4,354.96 S 6,523.20 $ 8.634.36 S 10.745.52 s 12.856.85 S 17,079.17 S 19,190.49 S 21,301.66 s 25,524.14 $ 31,857.78 $ 42,413.75 S 63,526.01 S 95,194.24
$ 659.58 $ 873.12 .$ 1.086.66 S 2,154.65 s 3.222.67 S 4,290.51 s 6,426.51 S 8.562.36 $ 10,698.21 .$ 12,834.22 $ 17,105.91 s 19,241.92 S 21,377.77 s 25.649.62 s 32.057.33 $ 42,736.73 $ 64,095.86 S 96,134.37
$ (9.67) $ (12.89) .$ (16.11) s (32.23) s (48.34) S (64.45) s (96.69) .$ (72.00) s (47.31) s (22.63) s 26.74 s 51.43 s 76.11 S 125.48 $ 199.55 $ 322.98 $ 569.85 $ 940.13
-1.4% -1.5% -1.5% -1.5% -1.5% -1.5% -15% -0.8% -0.4% -0.2% 0.2% 0.3% 0.4% 0.5% 0.6% 0.8% 0.9% 1.0%
~ ::r'
'"C8: ~I'" ..... ,-.O\r'
~~ -...J' N~

CONSOLIDATED EDISON COMPANY OF NEW YORK, INC.
COMPARISON OF BILLS CALCULATED AT CURRENT RATES VS. PROPOSED FLAT RATES @ MAY 2009 RATE LEVEL
ELECTRIC S. C. NO. 08 TABLE NO. 40
MULJPLE DWELINGS • REDISTRIBUTiON - LOW TENSION WINTER PERIOD
400 HOURS USE OF DEMAND PER MONTH
KWHR USE 30 DAYS
kW DEMAND
AT CURRENT RATE
AT PROPOSED RATE VARIANCE
PERCENTAGE VARIANCE
3.000 4,000 5,000
10,000 15.000 20,000 30,000 40,000 50,000 60,000 80,000 90,000
100,000 120,000 150,000 200,000 300,000 450,000 500,000
7.50 10.00 12.50 25.00 37.50 50.00 75.00
100.00 125.00 150.00 200.00 225.00 250.00 300.00 375.00 500.00 750.00
1.125.00 1,250.00
$ 669.25 $ 826.65 s 1,028.62 $ 2,038.39 S 3,048.20 S 4,057.98 s 6,077.56 s 8,09714 S 10,074.05 s 12,050.94 $ 16,004.74 $ 17,981.63 $ 19.958.54 s 23,912.33 $ 29,843.02 $ 39,727.51 S 59,496.49 $ 89,149.96 $ 99,034.45
$ 659.58 S 816.98 s 1,016.53 $ 2,014.22 s 3.011.94 s 4,009.64 S 6,005.05 $ 8,000.46 S 9,995.87 $ 11,991.28 $ 15,982.11 $ 17,977.52 s 19,972.94 $ 23,963.76 S 29,949.99 $ 39,927.06 $ 59,881.19 $ 89,812.37 $ 99,789.44
$ (9.67) s (9.67) $ (12.09) S (24.17) $ (36.26) $ (48.34) S (72.51) $ (96.68) s (7B.18) S (59.66) $ (22.63) s (4.11) s 14.40 $ 51.43 $ 106.97 $ 199.55 $ 384.70 s 662.41 $ 754.99
-1.4% -1.2% .1.2% -1.2% -1.2% -1.2% -1.2% -1.2% -0.8% -0.5% -0.1% 0.0% 0.1% 0.2% 0.4% 0.5% 0.6% 0.7% 0.3%
~ >-oS: ~I-....... ~
.....:It""'
;;~ .....:I'tv .....
"-'

CONSOLIDATED EDISON COMPANY OF NEW YORK, INC.
COMPARISON OF BILLS CALCULATED AT CURRENT RATES VS. PROPOSED FLAT RATES@ MAY 2009 RATE LEVEL
ELECTRIC S. C. NO. 08 TABLE NO. 41
MULIPLE DWELINGS - REDISTRIBUTION - LOW TENSION WINTER PERIOD
500 HOURS USE OF DEMAND PER MONTH
KWHRUSE kW AT CURRENT AT PROPOSED PERCENTAGE 30 DAYS DEMAND RATE RATE VARIANCE VARIANCE
. 3.000 6.00 S 669.25 S 659.58 $ (9.57) -1.4% 4,000 8.00 S 826.65 S 816.98 S (9.67) -1.2% 5.000 10.00 s 98405 s 974.38 s (9.67) ·1.0%
10.000 20.00 S 1,949.26 $ 1.929.93 S (19.33) -1.0% 15,000 30.00 S 2,914.50 S 2,885.49 $ (29.01 ) -1.0% 20.000 40.00 S 3.879.73 $ 3.84105 s (38.68) -1.0% 30.000 60.00 S 5.810.18 S 5,752.17 s (58.01) -1.0% 40000 80.00 s 7,740.63 S 7,66;>.28 S (77.35) -1.0% 50,000 100.00 S 9,671.10 S 9,57441 S (96.69) ·1.0% 60.000 120.00 S 11,56740 S 11,485.52 S {81.88) -0.7% 80,000 160.00 $ 15.36002 s 15.307.76 s (52.26) -0.3% 90,000 180.00 $ 17,256.32 s 17.218.88 $ (3744) -0.2%
100,000 200.00 S 19,152.63 S 19,130.01 S (22.62) -0.1% 120,000 240.00 s 22,945.24 s 22.95224 s 7.00 0.0% 150,000 300.00 s 28,634.16 s 28,685.59 S 51.43 0.2% 200,000 400.00 S 38,115.70 $ 38,241.19 S 125.49 0.3% 300,000 600.00 $ 57,078.78 $ 57,352.39 $ 273.61 0.5% 450,000 900.00 s 85,523.39 s 85,019.17 $ 495.78 0.5% 500,000 1,000.00 s 95,004.93 S 95,574.77 $ 569.84 0.6% 750,000 1,500.00 S 142,412.61 s 143,352.75 s 940.14 0.7%
~ e: ~g:
~I-....... r--.
OO~ s..:;o -....]'tv .......
'--"

CONSOLIDATED EDISON COMPANY OF NEW YORK, INC.
COMPARISON OF BILLS CALCULATED AT CURRENT RATES VS. PROPOSED FLAT RATES@ MAY 2009 RATE LEVEL
ELECTRIC S. C. NO. 08 TABLE NO, 42
MULIPLE DWElINGS - REDISTRIBUTION - LOW TENSION SUMMER PERIOD
300 HOURS USE OF DEMAND PER MONTH
KWHR USE 30 DAYS
kW DEMAND
AT CURRENT RATE
AT PROPOSED . RATE VARIANCE
PERCENTAGE VARIANCE
3.000 4.000 5,000
10,000 15,000 20,000 30,000 40.000 50,000 60,000 80,000 90,000
100,000 120,000 150,000 200,000 300,000 450,000
10.00 13.33 16.66 3333 50.00 66.66
100.00 133.33 166.66 200.00 266.66 300.00 333.33 400.00 500.00 666.66
1,000.00 1,500.00
S 718.72 $ 951.96 s 1,185.19 s 2,351.78 s 3,518.39 $ 4,684.76 S 7,017.96 s 9,294.02 s 11,570.09 S 13,846.35 s 18,39849 S 20,674.75 $ 22,950.82 S 27,503.15 S 34,331.55 $ 45,712.08 $ 68,473.56 $ 102,615.55
$ 709.05 S 93907 S 1,169.08 S 2,319.56 s 3,470.04 S 4,620.30 S 6,921.27 $ 9,222.02 $ 11,522.76 $ 13,823.73 s 18,425.22 s 20,726.18 s 23,026.94 s 27.628.64 S 34,531.10 $ 46,035.05
s 69,043.40 s 103,555.69
$ (9.67) $ (12.89) S (16.11) S (32.22) $ (48.35) s (64.46) S (96.69) s (72.00) s (47.33) s (22.62) s 26.73 S 51.43 S 76.12 S 125.49 s 199.55 $ 322.97 $ 569.84 $ 940.14
-1.3% -1.4% -1.4% -1.4% ·1.4% -1.4% -1.4% -0.8% -0.4% -0.2% 0.1% 0.2% 0.3% 0.5% 0.6% 0.7% 0.8% 0.9%
~ ::r
"tig: ~I-..... ~
\Ot'""'"
~~ ........ ' N~

CONSOLIDATED EDISON COMPANY OF NEW YORK, INC.
COMPARISON OF BILLS CALCULATED AT CURRENT RATES VS. PROPOSED FLAT RATES@MAY2009 RATE LEVEL
ELECTRIC S. C. NO. 08 TABLE NO. 43
MULIPLE DWElINGS . REDISTRIBUTION - LOW TENSION SUMMER PERIOD
400 HOURS USE OF DEMAND PER MONTH
KWHRUSE kW AT CURRENT AT PROPOSED PERCENTAGE 30 DAYS DEMAND RATE RATE VARIANCE VARIANCE
3.000 7.50 S 718.72 S 709.05 s (9.67) -1.3% 4.000 10.00 S 876.12 s 866,45 $ (9-67) ·1.1% 5,000 12.50 $ 1,090.45 s 1.078.37 $ (12.08) -1.1%
10,000 25.00 $ 2,162.08 $ 2.137.91 s (24.17) -1.1% 15.000 37.50 $ 3,233.72 s 3,197.47 s (36.25) -1.1% 20,000 50.00 $ 4,305.36 $ 4.257.01 :I) (48.35) -1.1% 30,000 75.00 S 6,448.63 s 6.316.11 S (72.52) -1.1% 40,000 100.00 s 8.591.90 $ 8,495.21 S (96.69) -1.1 % 50.000 125.00 $ 10,692.49 $ 10,614.32 s (78.17) -0.7% 60.000 150.00 S 12,793.07 s 12,733.41 $ (59.66) -0.5% 80,000 200.00 s 16.994.25 $ 16,971.62 $ (22.63) -0.1% 90,000 225.00 s 19,094.83 s 19,090.72 $ (4.11) 0.0%
100,000 250.00 $ 21.195.42 $. 21,209.82 $ 14.40 0.1% 120,000 300.00 S 25,396.59 s 25,448.02 $ 51.43 02% 150,000 375.00 s 31,698.35 $ 31,805.32 s 106.97 0.3% 200,000 500.00 s 42,20128 s 42,400.83 $ 199.55 0.5% 300.000 750.00 S 63,207.15 $ 63,591.84 s 384.69 0.6% 450,000 1,12500 s 94,715.94 $ 95,378,36 S 662,42 0,7% 500,000 1.250.00 S 105,218.87 s 105,973.86 S 754.99 0.7%
~ =r "'d8: III \.... ~ N'-""OL'
a,~ -....]'N ......
'--'

CONSOLIDATED EDISON COMPANY OF NEW YORK. INC.
COMPARISON OF BillS CALCULATED AT CURRENT RATES VS. PROPOSED FLAT RATES @ MAY 2009 FVITE LEVEL
ELECTRIC S. C. NO. 08 TABL.E NO. 44
MULIPLE DWElINGS - REDISTRIBUTION - LOW TENSION SUMMER PERIOD
500 HOURS USE OF DEMAND PER MONTH
KWHR USE 30 DAYS
kW DEMAND
AT CURRENT RATE
AT PROPOSED RATE VARIANCE
PERCENTAGE VARIANCE
3,000 4,000 5,000
10,000 15,000 20,000 30,000 40000 50,000 60,000 80,000 90,000
100,000 120,000 150,000 200,000 300,000 450,000 500,000 750.000
6.00 8.00
10.00 20.00 3000 40.00 60.00 80.00
100.00 120,00 160.00 180.00 200.00 240.00 30000 400.00 600.00 900.00
1,000.00 1,500.00
s 718.72 $ 876.12 s 1,033.52 s 2,048.21 $ 3,062.93 $ 4.077.63 $ 6,107.03 $ 8,136.44 s 10,165.85 s 12,161.10 s 16,151.62 s 18,146.88 s 20,142.14 $ 24,132.65 $ 30,118.43 $ 40,094.72 s 60,047.31 s 89,976.18 s 99,952.47 $ 149,833.92
s 709.05 s 866.45 S 1,023.85 S 2,028.88 s 3033.92 s 4,038.95 S 6,049.02 s 8,059.09 S 10.069.16 S 12,079.23 $ 16,099.37 $ 18,109.44 $ 20,119.51 $ 24,139.65 S 30,169.86 s 40,220.21
s 60,320.91 s 90,4 71.96 s 100,522.31 $ 150,774.06
$ (9.67) s (9.67) $ (9.67) $ (19.33) $ (29.01) S (38.68) s (58.01) $ (77.35) 5 (96.69) s (81.87) $ (52.25) s (37.44) $ (22.63) $ 7.00 s 51.43 s 125.49
s 273.60 S 495.78 $ 569.84 $ 940.14
-1.3% -1.1% -0.9% -0.9% -0.9% -0.9% -0.9% -1.0% -1.0% -0.7% -0.3% -0.2% -0.1% 0.0% 0.2% 0.3% 0.5% 0.6% 0.6% 0.6%
~ ::r ~§:
~( N'---'_t"'"
~~ --...)'N0

CONSOLIDATED EDISON COMPANY OF NEW YORK. INC.
COMPARISON OF BILLS CALCULATED AT REDESIGNED MAY 2009 SC 4/9 RATES VS. PROPOSED FLAT RATES @ MAY 2009 RATE LEVEL
ELECTRIC S. C. NO. 09 TABLE NO. 45
GENERAL· LARGE - LOW TENSION WINTER PERIOD
100 HOURS USE OF DEMAND PER MONTH
KWHRUSE kW AT CURRENT AT PROPOSED PERCENTAGE 30 DAYS DEMAND RATE . RATE VARIANCE VARIANCE
500 5.00 $ 167.98 S 167.98 s 0.0% 1,000 10.00 S 325.16 s 322.18 s (2.98) ·0.9% 2.000 20.00 $ 639.56 $ 63061 S (8.95) -1.4% 3.000 30.00 s 953.94 $ 939.03 S (14.91) ·1.6% 4.000 40.00 s 1,268.34 S 1.247.45 s (20.89) -1-6% 5.000 50.00 S 1.582.73 S 1.555.88 s (26.85) -1.7%
10,000 100.00 s 3,154.67 $ 3.097.99 s (56.68) -1.8% 15.000 150.00 S 4,620.67 S 4.640 11 s 19.44 0.4% 20,000 200.00 S 6.086.67 S 6.182.22 S 95.55 1.6% 30,000 300.00 $ 9,018.67 s 9.266.46 s 247.79 2.7% 40,000 400.00 s 11.950.67 S 12.350.69 S 400.02 3.3% 50.000 500.00 s 14.882.67 $ 15,434.92 S 552.25 3.7% 60.000 600.00 S 17.814.67 s 18,519.15 s 704.48 4.0% 80,000 800.00 s 23.678.67 $ 24,68762 S 1,008.95 4.3% 90,000 900.00 S 26:610.67 s 27.771.85 s 1,161.18 4.4%
100,000 1.000.00 s 29,542.67 $ 30,856.08 s 1,313.41 4.4% 120,000 1.200.00 S 35,406.67 S 37,024.55 s 1,617.88 4.6% 150,000 1,500.00 s 44,202.66 s 46.277.24 s 2,074.58 4.7%
~ ::r
'"d§: ~I-N-Nt""'
g,~ .....:I'N ......
'-"'

CONSOLIDATED EDISON COMPANY OF NEW YORK, INC.
COMPARISON OF BILLS CALCULATED AT REDESIGNED MAY 2009 SC 419 RATES VS. PROPOSED FLAT RATES @ MAY 2009 RATE LEVEL
ELECTRIC S. C. NO. 09 TABLE NO. 46
GENERAL - LARGE - LOW TENSION WINTER PERIOD
200 HOURS USE OF DEMAND PER MONTH
KWHR USE kW AT CURRENT AT PROPOSED PERCENTAGE 30 DAYS DEMAND RATE RATE VARIANCE VARIANCE
500 2.50 s 167.98 $ 167.98 $ 0.0% 1,000 5.00 s 249.20. s 249.20 s 0.0% 2,000 10.00 S 487.63 s 484.65 $ (2.98) -0.6% 3.000 15.00 s 726.06 s 72009 s (5.97) -0.8% 4,000 20.00 s 964.49 S 955.54 $ (8.95) -o.sss 5,000 25.00 $ 1,202.92 s 1,190.99 S (11.93) -1.0%
10.000 50.00 s 2,395.05 S 2.368.20 s (2685) -1.1% 15.000 75.00 s 3.587 .. 19 S 3.54543 s (41.76) -1.2% 20,000 100.00 S 4,779.32 S 4,722.65 s (56.67) -1.2% 30.000 150.00 s 7,057.66 $ 7,07710 s 19.44 0.3% 40,000 200.00 s 9,335.98 S 9,431,54 s 95.56 1.0% 50,000 250.00 s 11,614.31 S 11,785.98 s 171.67 1.5% 60,000 300.00 S 13,892.63 S 14,140.42 $ 247.79 1.8% 80.000 400.00 s 18,449.29 $ 18,849.31 s 400.02 2.2% 90,000 450.00 s 20,727.62 s 21,203.76 :5 476.14 2.3%
100,000 500.00 S 23,005.94 S 23,558.20 s 552.26 2.4% 120,000 600.00 S 27,562.61 s 28,267.09 s 704.48 2.6% 150,000 750.00 s 34,397.58 S 35,330.41 s 932.83 2.7% 200,000 1,000.00 s 45,789.22 S 47,102.63 s 1,313.41 2.9% 300,000 1.500.00 $ 68,572.50 S 70,647.08 s 2,074.58 3.0%
~ "'Cg: ~[-N'-'"V,lrs,g; -..JI N~

CONSOLIDATED EDISON COMPANY OF NEW YORK. INC.
COMPARISON OF BILLS CALCULATED AT REDESIGNED MAY 2009 SC 4/9 RATES VS. PROPOSED FLAT RATES @MAY 2009 RATE LEVEL
ELECTRIC S. C. NO. 09 TABLE NO. 47
GENERAL - LARGE - LOW TENSiON WINTER PERIOD
300 HOURS USE OF DEMAND PER MONTH
KWHRUSE kW AT CURRENT AT PROPOSED PERCENTAGE 30 DAYS DEMAND RATE RATE VARIANCE VARIANCE
500 1.66 s 16798 S 167.98 s 0.0% 1.000 3.33 S 249.20 s 249.20 $ 0.0% 2.000 6.66 s 436.89 $ 435.91 $ (0.98) -0.2% 3,000 10.00 s 650.09 $ 647.11 s (2.98) -0.5% 4.000 13.33 s 863.15 $ 858.18 S (4.97) -0.6% 5.000 16.66 $ 1.07622 s 1.06926 s (6.96) -0.6%
10.000 33.33 S 2,141.79 s 2.124.89 s (16.90) -0.8% 15000 50.00 S 320738 s 3,180.54 S (26.84) -0.8% 20,000 66.66 S 4,272.81 S 4,23603 S (36.78) -0.9% 30,000 100.00 S 6,403.98 s 6,347.31 s (56.67) -0.9% 40.000 133.33 S 8,464.37 $ 8,458.44 s (5.93) -0.1% 50,000 166~66 s 10,524.77 S 10,569.57 s 44.80 0.4% 60,000 200,00 S 12,585.29 s 12,680.85 S 95.56 0.8% 80,000 266.66 S 16,706.08 $ 16,903.12 s 197.04 1.2% 90,000 300.00 s 18,766.60 s 19,014.39 s 247.79 13%
100,000 333.33 s 20,826.99 s 21,125.52 S 298.53 1.4% 120,000 400.00 $ 24,947.92 s 25,347.94 $ 400.02 1'.6% 150,000 500.00 s 31,129.22 s 31,681,47 s 552.25 1.8% 200,000 666.66 s 41,431.32 s 42,237.28$ 805.96 1.9% 300,000 1,000.00 $ 62,035.78 S 63,349.19 $ 1,313.41 2.1% 450,000 1,500.00 $ 92,942.33 $ 95,016.91 s 2,074.58 2.2%
~ ",g: ~I-N--~~ s,~ -....I' N~

CONSOLIDATED EDISON COMPANY OF NEW YORK, INC.
COMPARISON OF BILLS CALCULATED AT REDESIGNED MAY 2009 SC 4/9 RATES vs PROPOSED FLAT RATES@ MAY 2009 RATE LEVEL
ELECTRIC S. C. NO. 09 TABLE NO. 48
GENERAL - LARGE - LOW TENSION WINTER PERIOD
400 HOURS USE OF DEMAND PER MONTH
KWHRUSE I<W AT CURRENT AT PROPOSED PERCENTAGE 30 DAYS DEMAND RATE RATE VARIANCE VARIANCE
500 1.25 $ 167.98 $ 167.98 s 0.0% 1,000 2.50 s 249.20 s 249.20 s 0.0% 2.000 5.00 s 411.67 s 411.67 s 0.0% 3,000 7.50 s 612.12 s 610.63 S (1.49) -0.2% 4.000 10.00 s 812.57 $ 809.58 $ (2.99) -0.4% 5,000 12.50 s 1,013.02 $ 1,00855 S (4.47) -0.4%
10.000 25.00 s 2,015.24 s 2,003.31 s (11.93) -0.6% 15.000 37.50 s 3,017.48 s 2,998.09 S (19.39) -0.6% 20,000 50.00 S 4,019.70 $ 3,992.86 s (26.84) -0.7% 30,000 75.00 S 6,024.18 s 5,982.41 s (41.77) -0.7% 40.000 100.00 S 8,028.64 s 7.97196 s (56.68) -0.7% 50,000 125.00 S 9,980.13 S 9,961.51 s (18.62) -0.2% 60,000 150.00 S 11,931.62 S 11.951.06 S 19.44 0.2% 80,000 200.00 s 15,834.61 s 15,930.16 s 95.55 0.6% 90.000 225.00 S 17,786.09 $ 17,919.71 s 133.62 0.8%
100,000 250.00 s 19,737.58 $ 19,909.26 s 171.68 0.9% 120,000 300.00 S 23,640.57 S 23,888.36 $ 247.79 1.0% 150,000 375.00 S 29,495.04 s 29.857.00 $ 361.96 1.2% 200,000 500.00 $ 39,252.50 S 39,804.75 s 552.25 1.4% 300,000 750.00 s 58,767.42 s 59,700.25 s 932.83 1.6% 450,000 1,125.00 S 88,039.79 $ 89,543.49 s 1,503.70 1.7% 500.000 1.250.00 $ 97,797.25 $ 99,491.24 $ 1,693.99 1.7%
~ ::r
"'C8: ~I-N'-"VIr o > ....,~ -...:II N<;»
. -- _._.- -"'-,.,._", -.'-" .._.

CONSOLIDATED EDISON COMPANY OF NEW YORK, INC,
COMPARISON OF BILLS CALCULATED AT REDESIGNED MAY 2009 SC 4/9 RATES VS. PROPOSED FLAT RATES @ MAY 2009 RATE LEVEL
ELECTRIC S. C. NO. 09 TABLE NO. 49 - Revised
GENERAL - LARGE - LOW TENSION SUMMER PERIOD
100 HOURS USE OF DEMAND PER MONTH
KWHRUSE kW AT CURRENT AT PROPOSED PERCENTAGE 30 DAYS DEMAND RATE RATE VARIANCE VARIANCE
500 5.00 $ 187,11 $ 187.11 s 0.0% 1,000 10,00 $ 363.43 $ 360.03 s (3.40) -0,9% 2,000 20,00 $ 71609 s 705,90 s (10.19) -1.4% 3,000 30.00 S ·1,068.73 S 1,051.76 $ (1697) -1.6% 4,000 40,00 s 1,421.39 s ,1,397.63 s (23.76) -1.7% 5,000 50,00 $ 1,774.05 s 1,74350 $ (30.55) -1,7%
10,000 100,00 S 3,537,31 $ 3,472.81 S (64,50) -1.8% 15,000 150.00 s 5,185.88 S 5,20214 S 16,26 0,3%
20,000 200.00 $ 6,834.45 $ 6,931.45 S 97.00 1.4% 30,000 300,00 S 10,131.61 $ 10,390.10 s 258.49 2,6%
40,000 400.00 $ 13,428,76 $ 13,848,74 S 419,98 3,1%
50,000 500,00 $ 16,725,91 $ 17,307.38 S 581.47 3,5%
60,000 600,00 $ 20,023,06 s 20,766.01 s 742.95 3.7%
80,000 800,00 s 26,617.37 $ 27,683,30 s 1,065.93 4,0%
90,000 900,00 s 29.914,52 s 31,141,94 $ 1,227.42 4,1%
100,000 1,000.00 $ 33,211,66 s 34,600.58 $ 1,388.92 4.2%
120,000 1.200.00 $ 39,805.97 $ 41,517.86 $ 1,711.89 4.3% 150,000 1,500.00 s 49,697.42 $ 51,893.78 s 2,196.36 4.4%
~ "'dg: ~( tv"-"" ""r" g,~ -.",]'tv ......<;»

CONSOLIDATED EDISON COMPANY OF NEW YORK INC.
COMPARISON OF BILLS CALCULATED AT REDESIGNED MAY 2009 SC 419RATES VS. PROPOSED FLAT RATES @ MAY 2009 RATE LEVEL
ELECTRIC S. C. NO. 09 TABLE NO. 50. RevIsed
GENERAL· LARGE - LOW TENSION SUMMER PERIOD
200 HOURS USE OF DEMAND PER MONTH
KWHR USE kW AT CURRENT AT PROPOSED PERCENTAGE 30 DAYS DEMAND RATE RATE VARIANCE VARIANCE
500 2.50 S 187.11 s 187.11 s 0.0% 1,000 5.00 s 26833 $ 268.33 $ 0.0% 2,000 10.00 s 525.90 s 522.50 s (3.40) -0.6% 3,000 15.00 S '783.45 s 776.66 s (6.79) -09% 4,000 20.00 $ 1,041.02 S 1,030.83 $ (10.19) -1.0% 5,000 25.00 S 1,298.58 $ 1,285.00 $ (13.58) -1.0%
10,000 5000 S 2,586.37 s 2.555.82 s (3055) ·1.2% 15,000 75.00 S 3,87417 S 3,826.65 s (47.52) -12% 20,000 100.00 S 5,16196 s 5,097.47 $ (6449) -1.2% 30,000 150.00 S 7,622.87 $ 7,639.12 s 16.25 0.2% 40,000 200.00 s 10,083.77 s 10,180.77 $ 97.00 1.0% 50,000 250.00 $ 12.54467 S 12,722.41 $ 177.74 1.4% 60,000 300.00 $ 15,005.57 s 15,264.06 s 258.49 1.7% 80.000 400.00 $ 19,927.38 $ 20.347.36 s 419.98 2.1% 90,000 450.00 S 22,388.29 s 22,889.01 s 50072 2.2%
100,000 500.00 s 24,849.19 s 25,430.65 $ 581.46 2.3% 120,000 600.00 $ 29,771.00 s 30,513.95 s 742.95 2.5% 150,000 750.00 s 37,153.70 $ 38.138.89 S 985.19 2.7% 200,000 1,000.00 $ 49,458.22 $ 50.847.13 S 1,388.91 2.8% 300,000 1,500.00 $ 74,067.26 s 76,263.62 s 2,196.36 3.0%
~ '"t;j8: ~I-N---....Jr o >....,:::0 -....J'N-:;

CONSOLIDATED EDISON COMPANY OF NEW YORK, INC.
COMPARISON OF BILLS CALCULATED AT REDESIGNED MAY 2009 SC 419RATES VS. PROPOSED FLAT RATES @ MAY 2009 RATE LEVEL
ELECTRIC S. C. NO. 09 TABLE NO. 51 - Revised
GENERAL - LARGE - LOW TENSION SUMMER PERIOD
300 HOURS USE OF DEMAND PER MONTH
KWHRUSE kW AT CURRENT AT PROPOSED PERCENTAGE 30 DAYS DEMAND RATE RATE VARIANCE VARIANCE
500 1.66 s 187.11 S 187.11 s 0.0% 1,000 3.33 s 268.33 S 268.33 S 0.0% 2,000 6.66 S 46237 $ 461.25 S (1.12) -02% 3,000 1000 s 68836 S 684.96 S (3.40) -05% 4,000 13.33 S 914.16 S 908.50 $ (5.66) -0.6% 5.000 16.66 S 1,139.96 s 1,132.05 S (7.91) -0.7%
10,000 33.33 S 2,269.33 S 2,250.09 s (19.24) -0.8% 15,000 50.00 S 3,398.70 $ 3.368.15 S (30.55) -0.9% 20.000 66.66 s 4,527.87 s 4,486.02 s (41.85) -09% 30.000 100.00 S 6,786.62 $ 6,722.13 $ (64.49) -1.0% 40,000 133.33 S 8,968.72 $ 8,958.05 s (10.67) -0.1% 50.000 166.66 s 11.150.81 $ 11.193.97 s 43.16 0.4% 60.000 200.00 s 13,333.08 $ 13,430.07 $ 9699 0.7% 80,000 266.66 $ 17,697.28 s 17,901.93 s 204.65 1.2% 90.000 300.00 $ 19.879.54 $ 20.138.03 $ 258.49 1.3%
100.000 333.33 s 22,061.64 $ 22.373.94' $ 312.30 1.4% 120,000 400.00 s 26,426.01 S 26,845.98 S 419.97 1.6% 150,000 500.00 S 32,972.46 $ 33.553.93 s 581.47 1.8% 200,000 666.66 s 43,883.12 $ 44.733.73 s 850.61 1.9% 300,000 1,000.00 S 65,704.78 $ 67.093.69 $ 1.388.91 2.1% 450.000 1,500.00 s 98,437.09 s 100.633.45 s 2.196.36 2.2%
~ --e8: ~I-N~ocr g,~ ......:I'N0

CONSOLIDATED EDISON COMPANY OF NEW YORK, INC.
COMPARISON OF BILLS CALCULATED AT REDES!GNED MAY 2009 SC 419 RA1ES VS. PROPOSED FLAT RATES @ MAY 2009 RATE LEVEL
ELECTRIC S. C. NO. 09 TABLE NO. 52· Revised
GENERAL - LARGE - LOW TENSION SUMMER PERIOD
400 HOURS USE OF DEMAND PER MONTH
KWHRUSE kW AT CURRENT AT PROPOSED PERCENTAGE 30 DAYS DEMAND RATE RATE VARIANCE VARIANCE
500 1.25 S 187.11 s 187.11 S 0.0% 1,000 2.50 S 268.33 :> 268.33 s 0.0% 2,000 5.00 s 43080 S 430.80 S 0.0% 3,000 7.50 :5 640.82 s 639.12 s (1.70) -0.3% 4.000 10.00 S 85083 s 847.43 S (340) -0.4% 5,000 12.50 S 1,060.85 S 1,055.76 S (5.09) -0.5%
10,000 25.00 S 2,110.90 S 2.097.32 s (13.58) -0.6% 15,000 37.50 S 3,160.97 S 3,138.91 S (22.06) -0.7% 20.000 50.00 s 4,211.02 S 4,180.47 S (30.55) ·0.7% 30,000 75.00 S 6.31 U5 $ 6,263.63 $ (47.52) -08% 40,000 100.00 S 8,411.28 s 8,346.78 s (6450) -0.8% 50,000 125.00 S 10,454.05 s 10,429.93 $ (24.12) -02% 60,000 150.00 s 12,496.83 S 12,513.08 s 16.25 0.1% 80,000 200.00 S 16,582.39 s 16.679.39 S 97.00 0.6% 90,000 225.00 S 18,625.17 s 18.762.54 S 137.37 0.7%
100,000 250.00 s 20,667.95 $ 20,845.69 s 177.74 0.9% 120.000 300.00 s 24,75351 s 25,012.00 $ 258.49 1.0% 150,000 375.00 $ 30,881.84 $ 31,261.45 s 379.61 1.2% 200,000 500.00 S 41,095.74 s 41,677.20 S 581.46 1.4% 300,000 750.00 $ 61,523.54 $ 62,508}3 s 985.19 1.6% 450,000 1,125.00 s 92,165.23 s 93,756.00 S 1,590.77 1.7% 500,000 1.250.00 s 102)79.12 s 104,171.76 S 1.792.64 1.8%
~ "'Cg: ~I-N'-'" IO~a,:;:o .......:l'N-::::

CONSOLIDATED EDISON COMPANY OF NEW YORK, INC.
COMPARISON OF BILLS CALCULATED AT REDESIGNED MAY 2009 SC 4/9 RA1ES VS. PROPOSED FLAT RATES @ MAY 2009 RATE LEVEL
ELECTRIC S. C. NO. 09 TABLE NO. 53 - Revised
GENERAL - LARGE - HIGH TENSION WINTER PERIOD
100 HOURS USE OF DEMAND PER MONTH
KWHRUSE kW AT CURRENT AT PROPOSED PERCENTAGE 30 DAYS DEMAND RATE RATE VARIANCE VARIANCE
500 5.00 s 145.76 $ 145.76 s 0.0% 1.000 10.00 s 280.73 s 277.75 s (2.98) -1.1% 2,000 20.00 s 550.69 s 541.74 $ (8.95) -1.6% 3.000 30.00 S 820.64 s 805.72 s (14.92) -1.8% 4.000 40.00 s 1,090.59 s 1.069.71 s (20.88) -1.9% 5.000 50.00 s 1.360.55 S 1,333.71 s (26.84) -20%
10.000 100.00 S 2,710.32 $ 2.653.64 s (56.68) -2.1% 15.000 150.00 s 3.954.14 s 3,973.58 $ 19.44 0.5% 20.000 200.00 S 5.197.96 s 5.293.52 s 95.56 1.8% 30.000 300.00 s 7.685.61 $ 7.933.40 s 247.79 3.2% 40.000 400.00 s 10.173.26 S 10,573.28 s 400.02 3.9% 50.000 500.00 s 12.660.90 s 13,213.16 s 552.26 4.4% 60.000 600.00 $ 15.148.55 :5 15,853.03 s 704.48 4.7% 80,000 800.00 s 20.12385 S 21,132.80 $ 1.008.95 5.0% 90.000 900.00 S 22,611.49 $ 23,772,67 s 1,161,18 5.1%
100.000 1,000.00 s 25,099.14 S 26,412,55 s 1,313.41 5.2% 120.000 1.200,00 S 30,074.43 s 31,692.31 $ 1,617.88 5.4% 150,000 1,500.00 s 37,537.37 $ 39,611.94 s 2,074.57 5,5%
~ ::r'
~§:
~( VJ~Or o >H)~ -...J' N~

CONSOLIDATED EDISON COMPANY OF NEW YORK. INC.
COMPARISON OF BILLS CALCULATED AT REDESIGNED MAY 2009 SC 4/9 RATES VS.PROPOSED FLAT RATES @ MAY 2009 RATE LEVEL
ELECTRIC S. C. NO. 09 TABLE NO. S4· Revised
GENERAL - LARGE - HIGH TENSION WINTER PERIOD
200 HOURS USE OF DEMAND PER MONTH
KWHRUSE 30 DAYS
kW DEMAND
AT CURRENT RATE
AT PROPOSED RATE VARIANCE
PERCENTAGE VARIANCE
500 1,000 2.000 3,000 4,000 5,000
10,000 15,000 20.000 30,000 40,000 50,000 60.000 80,000 90.000
100.000 120,000 150,000 200,000 300,000
2.50 5.00
10.00 15.00 20.00 25.00 5000 7500
100.00 150.00 200.00 250.00 300.00 400.00 450.00 500.00 600.00 750.00
1,000.00 1,500.00
S $ S $ s S $ s S $ $ s $ s S
.$
$ s $ s
145.76 226.32 441.86 657.40 872.94
1.088.49 2,166.19 3,243.90 4.321.60 6.371.07 8.420.53
10,470.00 12,519.46 16.61B.39 18,667.86 20,717.32 24.816.26 30.964.65 41,211.97 61,706.63
$ 145.76 $ 226.32 s 438.88 S 651-43 $ 863.99 S 1,076.56 s 2,139.34 s 3.202.14 S 4.264.92 s 6,390.51 s 8,516.09 s 10,641.67 s 12,767.25 s 17,018.42 $ 19.143.99 s 21,269.57 $ 25,520.74 S 31.897.48 s 42,525.38 s 63,781.20
s $ s s $
s $ s s $ $ s S $ $ $ s $ $ s
(2.98) (5.97) (8.95)
(11.93) (26.85) (41.76) (56.68) 19.44 95.56
171.67 247.79 400.03 476.13 552.25 704.48 932.83
1,313.41 2,074.57
0.0% 0.0%
-0.7% -0.9% -1.0% -11% -1.2% -1.3% -1.3% 0.3% 1.1% 1.6% 2.0% 2.4% 2.6% 2.7% 2.8% 3.0% 3.2% 3.4%
tTl ~
~~ ~ l~' w""'"'_t""' o >.....,:;0 .....,J' l'-J~
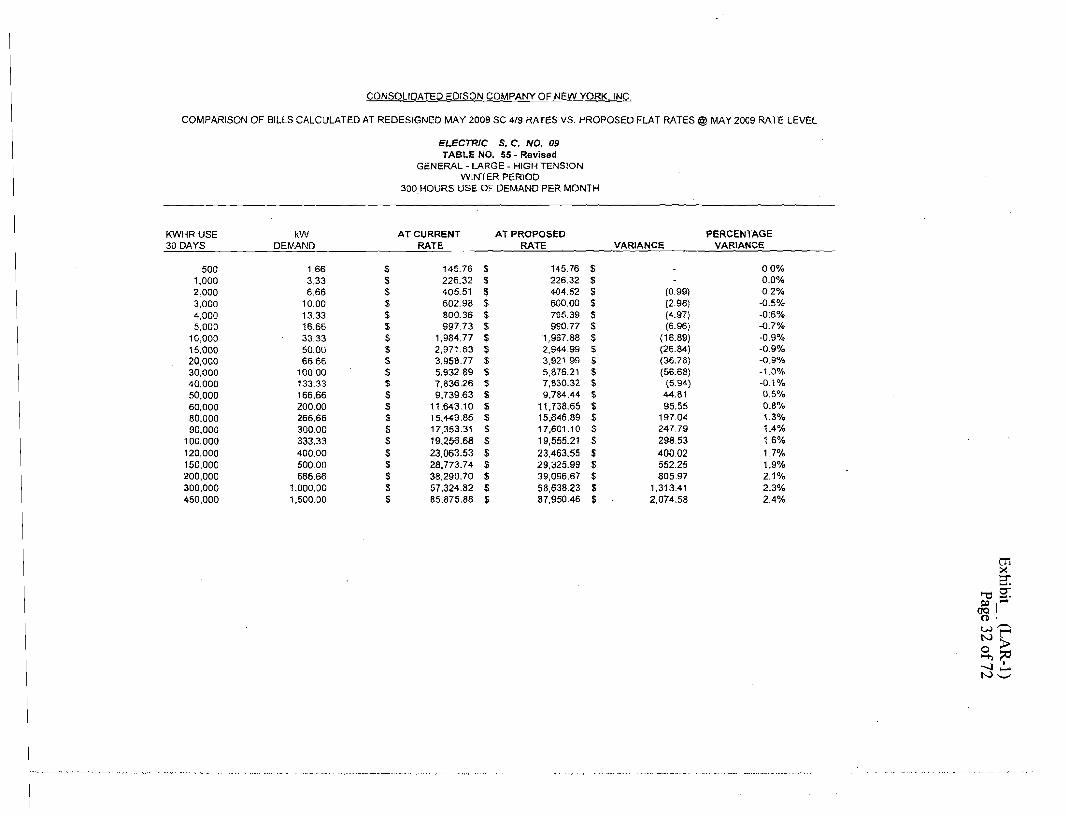
CONSOLIDATED EDISON COMPANY OF NEW YORK, INC.
COMPARISON OF BILLS CALCULATED AT REDESIGNED MAY 2009 SC 4/9 RATES VS. PROPOSED FLAT RATES @ MAY 2009 RATE LEVEL
ELECTRIC S. C, NO. 09 TABLE NO. 55 - Revisod
GENERAL - LARGE - HIGH TENSION WINTER PERIOD
300HOURS USE OF DEMAND PER MONTH
KWHRUSE kW AT CURRENT AT PROPOSED PERCENTAGE 30 DAYS DEMAND RATE RATE VARIANCE VARIANCE
500 1.66 S 145.76 S 145.76 $ 0.0% 1,000 3.33 s 226.32 S 226.32 $ 0.0% 2,000 6.66 S 405.51 S 404.52 s (099) -0.2% 3,000 10.00 S 602.98 S 600,00 s (2.98) -0.5% 4,000 13.33 $ 800.36 s 795.39 $ (4.97) -0:6% 5,000 16,65 s 997.73 $ 990.77 S (6.96) -0.7%
10,000 33,33 S 1.984.77 S 1.967.88 s (16.89) -0,9%
'5,000 50.00 S 2,971.83 $ 2,944.99 s (26.84) -0.9% 20.000 66.66 S 3,958,77 $ 3.92199 S (36.78) -0.9% 30,000 100.00 S 5.932.89 S 5,876.21 S (56.68) -1.0% 40,000 133.33 $ 7.836.26 S 7.830.32 s (5.94) -0.1% 50,000 166.66 $ 9,739.63 $ 9.784.44 S 44.81 0.5% 60,000 200.00 $ 11.643.10 $ 11.738.65 $ 95.55 0.8% 80,000 266,66 s 15,449.85 s 15,646.89 $ 197.04 C~%
90,000 300.00 s 17.353.3' $ 17,601.10 s 247.79 1.4% 100.000 333,33 $ 19,256.68 $ 19,555.21 S 298.53 1.6% 120.000 400.00 $ 23,063.53 s 23,463.55 $ 400.02 1.7% 150.000 500.00 s 28.773.74 s 29,325.99 s 552.25 1,9% 200.000 666.66 s 38,290.70 S 39,096.67 s 805.97 2.1% 300.000 1,000,00 s 57,324.82 s 58,638.23 $ 1,313.41 2.3% 450.000 1,500.00 s 85,875.88 $ 87,950.46 $ 2,074.58 2.4%
~ e:
""Cg: ~( w,-.,Nt""' o >""+l~ -....)'N-::::

CONSOLIDATED EDISON COMPANY OF NEW YORK, INC.
COMPARISON OF BILLS CALCULATED AT REDESIGNED MAY 2009 SC 4/9 RATES VS. PROPOSED FLAT RATES @ MAY 2009 RATE LEVEL
ELECTRIC S, C. NO. 09 TABLE NO. 56 - Revised
GENERAL - LARGE - HIGH TENSION WINTER PERIOD
400 HOURS USE OF DEMAND PER MONTH
KWHRUSE kW AT CURRENT AT PROPOSED. PERCENTAGE 3D DAYS DEMAND RATE RATE VARIANCE VARIANCE
500 1.25 $ 145.76 s 145.76 S 0.0% 1,000 2.50 S 226.32 S 226.32 s 0.0% 2,000 5.00 S 387.45 S 387.45 s 0.0% 3,000 7.50 S 575.78 S 574.29 s (1.49) -0.3% 4.000 10.00 S 764.12 S 76114 S (2.98) -0.4% 5,000 12.50 s 952.46 s 947.98 S (4.48) -0.5%
10.000 25.00 $ 1,894.12 $ 1.88219 s (11.93) -0.6% 15.000 37.50 S 2,835.80 S 2.816.41 S (19.39) -0.7% 20,000 50.00 s 3,777.47 S 3.750.62 $ (26.85) ·0.7% 30.000 75.00 S 5,660.82 s 5,619.06 S (41.76) -0.7% 40,000 100.00 S 7,544.17 S 7,487.49 S (56.68) -08% 50,000 125.00 S 9,374.54 s 9,355.92 s (18.62) -0.2% 60,000 150.00 S 11,204.91 s 11,224.35 s 19.44 0.2% 80,000 200.00 S 14,865.67 s 14,961.23 s 95.56 0.6% 90,000 225.00 $ 16,696.04 $ 16,829.66 s 133.62 0.8%
100,000 250.00 $ 18,526,41 s 18,698.09 s 171.68 0.9% 120,000 300.00 $ 22,187.17 s 22,434.96 s 247.79 1.1% 150,000 375.00 s 27,678.28 s 28,040.25 s 361.97 1.3% 200.000 500.00 $ 36,830.16 s 37,382.41 S 552.25 1.5% 300,000 750.00 $ 55,133.91 $ 56.066.74 S 932.83 1.7% 450,000 1,125.00 S 82.589.52 S 84,093.23 s 1.503.71 1.8% 500.000 1,250.00 s 91,741.39 S 93,435.39 s 1,694.00 1.8%
tI'i ;.<::::r",g:
<§Iw -. Wt"""
s,~ -....)'tv":::

·CONSOLIDATED EDISON COMPANY OF NEW YORK, INC.
COMPARISON OF BILLS CALCULATED AT REDESIGNED MAY 2009 SC 4/9 RATES VS. PROPOSED FLAT RATES@ MAY 2009 RATE LEVEL
ELECTRIC S.C. NO. 09 TABLE NO. 57· Revised
GENERAL· LARGE - HIGH TENSION SUMMER PERIOD
100 HOURS USE OF DEMAND PER MONTH
KWHRUSE kW AT CURRENT AT PROPOSED PERCENTAGE 30 DAYS DEMAND RATE RATE VARIANCE VARIANCE
500 5.00 s 164.90 s 164.90 s 0.0% 1,000 10.00 s 318.99 s 315.60 s (3.39) ·1.1% 2.000 20.00 $ 627.21 s 617.03 s (10.18) -1.6% 3,000 30.00 s 935.43 s 918.45 s (16.98) ·1.8% 4,000 40.00 s 1,243.65 S 1,219.89 S (23.76) -1.9% 5,000 50.00 s 1,551.87 s 1,521.32 s (30.55) -2.0%
10,000 100.00 S 3.092.95 s 3,028.46 s (64.49) -2.1% 15,000 150.00 S 4,51936 S 4,535.61 s 16.25 0.4% 20,000 200.00 $ 5,945.75 s 6,042.74 s 96.99 1.6% 30,000 300.00 s 8,798.55 s 9.057.04 S 258.49 2.9% 40,000 400.00 s 11.651.35 s 12,071.32 s 419.97 3.6% 50.000 500.00 S 14,504.15 s 15,085.61 s 581.46 4.0% 60,000 600.00 S 17,356.94 s 18,099.90 $ 742,96 4.3% 80,000 800.00 s 23,062.54 s 24,128.48 $ 1.065.94 4.6% 90,000 900.00 $ 25,915.34 s 27.142.76 $ 1.227.42 4.7%
100,000 1.000.00 S 28.768.13 $ 30,157.05 $ 1,388.92 4.8% 120,000 1.200.00 $ 34,473.74 $ 36,185.63 $ 1,711.89 5.0% 150.000 1,500.00 s 43,032.12 $ 45.228.48 S 2,196.36 5.1%
~ ""C8: ~\-w,-.., +:-.t'"
~~ -...J' N~
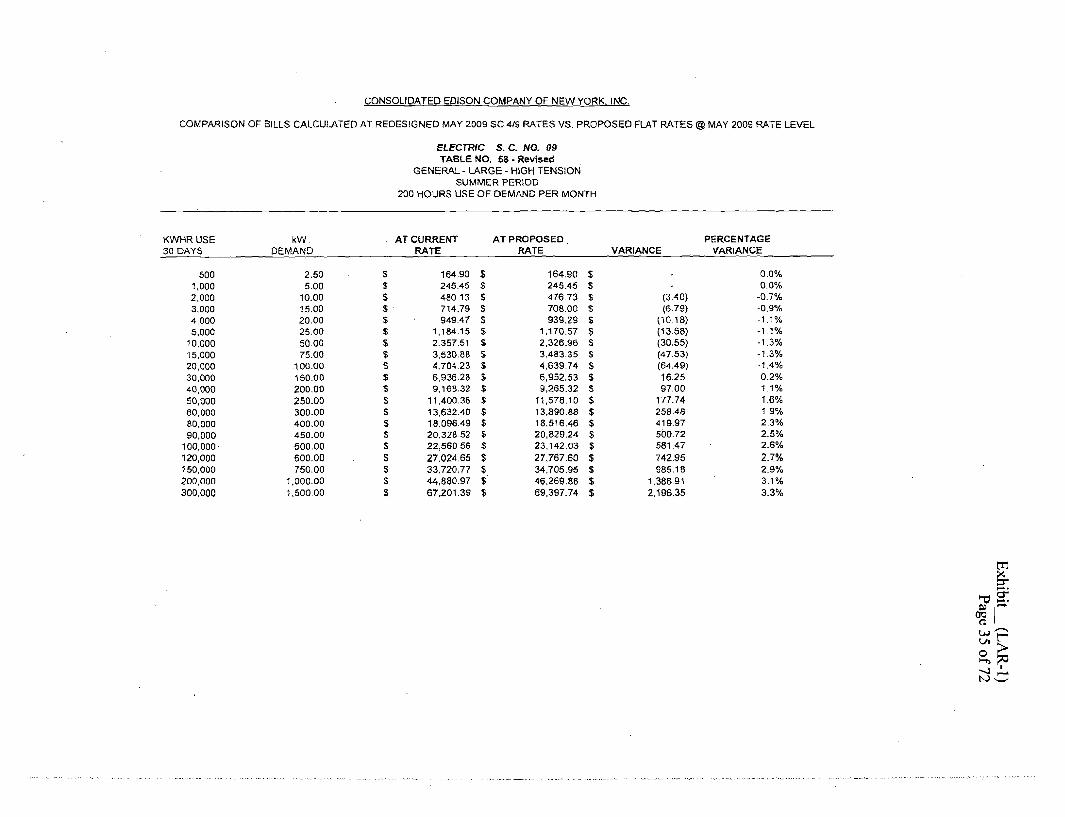
CONSOLIDATED EDISON COMPANY OF NEW YORK. INC.
COMPARISON OF BILLS CALCULATED AT REDESIGNED MAY 2009 SC 419 RATES YS. PROPOSED FLAT RATES@MAY 2009 RATE LEVEL
ELECTRIC S. C. NO. 09 TABLE NO. 58 - Revised
GENERAL - LARGE - HIGH TENSION SUMMER PERIOD
200 HOURS USE OF DEMAND PER MONTH
KWHRUSE kW. AT CURRENT AT PROPOSED PERCENTAGE 30 DAYS DEMAND RATE RATE VARIANCE VARIANCE
500 2.50 S 164.90 s 164.90 s 0.0% 1,000 5.00 $ 245.45 s 245.45 S 0.0% 2,000 10.00 S 48013 s 476.73 $ (3.40) -0.7% 3,000 15.00 $' 714.79 s 708.00 S (6.79) -0.9% 4,000 20.00 $ 949.47 S 939.29 s (10.18) ·1.1% 5,000 25.00 s 1,184.15 s 1,170.57 S (13.58) -1.1%
10.000 50.00 s 2,357.51 $ 2,326.96 S (30.55) -1.3% 15.000 75.00 $ 3,530.8B s 3.483.35 $ (47.53) -1.3% 20,000 100.00 S 4,704.23 S 4,639.74 S (64.49) -1.4% 30,000 150.00 s 6,936.28 s 6,952.53 s 16.25 0.2% 40,000 200.00 $ 9,168.32 $ 9,265.32 S 97.00 1.1% 50,000 250.00 S 11,400.36 s 11,578.10 S 177.74 1.6% 60,000 300.00 s 13,632.40 s 13.890.88 $ 258.48 1.9% 80,000 400.00 S 18.096.49 $ 18,516.46 S 419.97 2.3% 90,000 450.00 $ 20,328.52 s 20,829.24 S 500.72 2.5%
100.000 . 500.00 s 22,560.56 s 23,142.03 ::; 581.47 2.6% 120,000 600.00 $ 27,024.65 S 27,767.60 s 742.95 2.7% 150,000 750.00 $ 33,720.77 $ 34.70595 $ 985.18 2.9% 200,000 1.000.00 s 44,880.97 $ 46,269.88 $ 1.388.91 3.1% 300,000 1,500.00 s 67,201.39 s 69,397.74 s 2.196.35 3.3%
~ ~§: ~I-w"-.,,VIr-'
~~ ....,J'N'-'
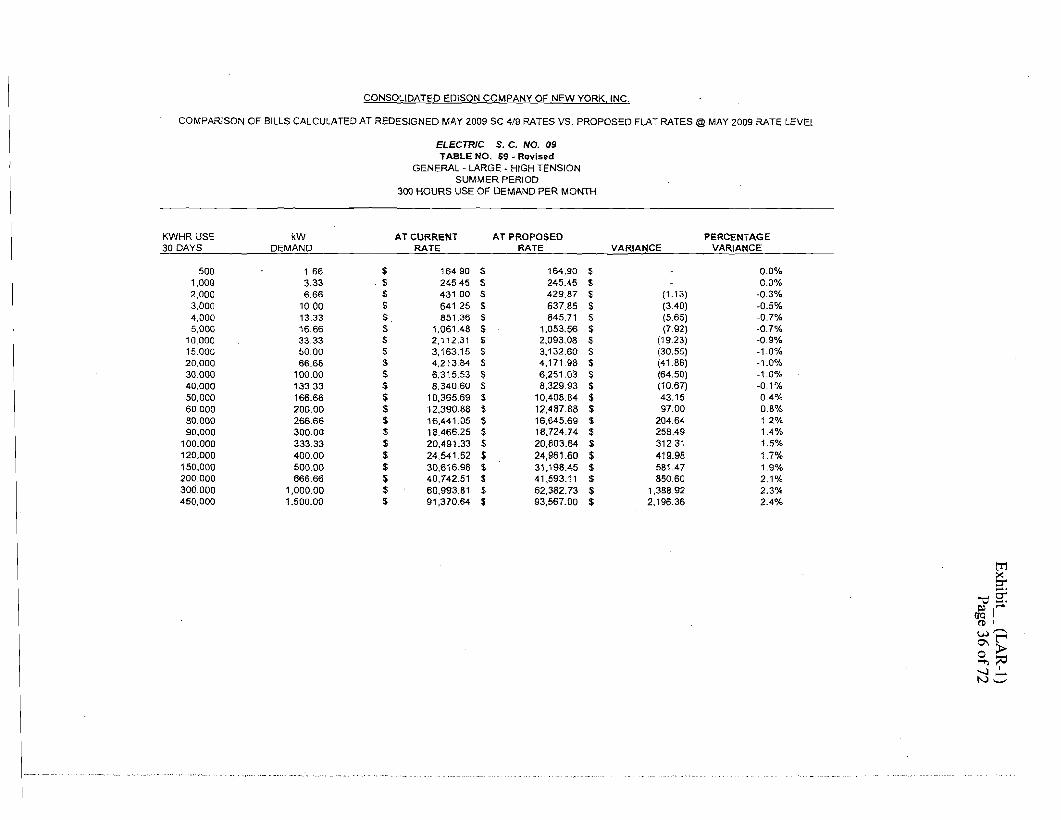
CONSOLIDATED EDISON COMPANY OF NEW YORK. INC.
COMPARISON OF BILLS CALCULATED AT REDESIGNED MAY 2009 SC 4/9 RATES VS. PROPOSED FLAT RATES @ MAY 2009 RATE LEVEL
ELECTRIC S. C. NO. 09 TABLE NO. 59 - Revised
GENERAL - LARGE - HIGH TENSION SUMMER PERIOD
300 HOURS USE OF DEMAND PER MONTH
KWHRUSE kW AT CURRENT AT PROPOSED PERCENTAGE 30 DAYS DEMAND RATE RATE VARIANCE VARIANCE
500 1.66 s 164.90 S 164.90 s 0.0% 1,000 3.33 . $ 245.45 s 245.45 s 0.0% 2,000 6.66 s 431.00 S 429.87 S (1.13) .-0.3% 3,000 1000 $ 641.25 s 637.85 s (3.40) -0.5% 4,000 13.33 S 85136 S 845.71 S (5.65) -0.7% 5,000 16.66 S 1,061.48 $ 1,053.56 s (7.92) -0.7%
10.000 33.33 S 2,112.31 s 2,093.08 S (19.23) -0.9% 15.000 50.00 S 3,163.15 S 3,132.60 S (30.55) -1.0% 20,000 66.66 s 4,213.84 s 4,17198 s (41.86) -1.0% 30,000 100.00 $ 6,315.53 $ 6,251.03 S (64.50) -1.0% 40,000 13333 s 8,34060 S 8,329.93 s (10,67) -0.1% 50,000 166.66 s 10,365.69 $ 10,408.84 $ 43.15 0.4% 60,000 200.00 $ 12,390.88 $ 12,487.88 S 97.00 0.8% 80,000 266.66 s 16,441.05 S 16,645.69 $ 204.64 1.2% 90,000 300.00 s 18,466.25 s 18,724.74 s 258,49 1.4%
100,000 333.33 S 20,491.33 s 20,803.64 s 312.31 1.5% 120,000 400.00 $ 24,541,62 $ 24,961.60 $ 419.98 1.7% 150,000 500.00 s 30,616.98 s 31,198.45 s 581.47 1.9% 200,000 666,66 S 40,742.51 s 41,593.11 S 850.60 2.1% 300,000 1,000.00 s 60,993.81 s 62,382.73 S 1,388.92 2.3% 450,000 1,500.00 $ 91,370.64 $ 93,567.00 s 2,196.36 2.4%
~ ::J'"
ll[ w,-..,0"It""" o >'"""l:::O -....:I' N~
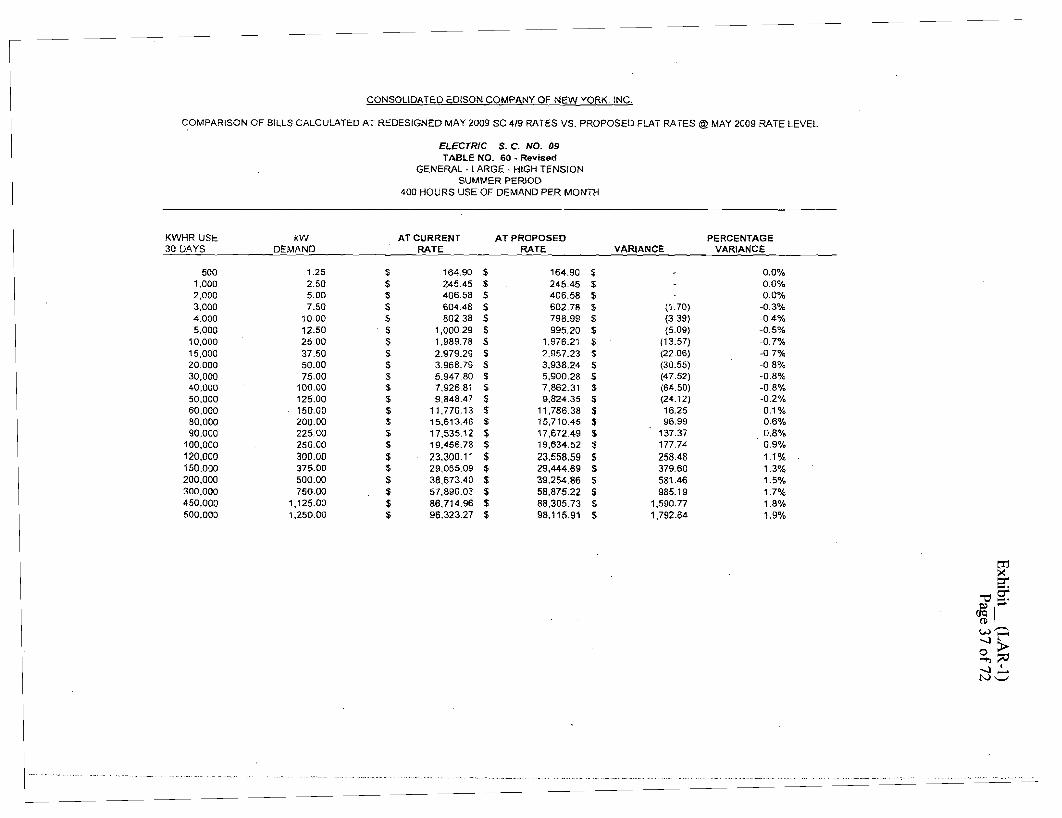
CONSOLIDATED EDISON COMPANY OF NEW YORK. INC.
COMPARISON OF BILLS CALCULATED AT REDESIGNED MAY 2009 SC 4/9 RATES VS. PROPOSED FLAT RATES @ MAY 2009 RATE LEVEL
ELECTRIC S. C. NO. 09 TABLE NO. 60· Revised
GENERAL - LARGE - HIGH TENSION SUMMER PERIOD
400 HOURS USE OF DEMAND PER MONTH
KWHR USE kW AT CURRENT AT PROPOSED PERCENTAGE 30 DAYS DEMAND RATE RATE VARIANCE VARIANCE
500 1.25 $ 164.90 5) 164.90 5) 0.0% 1.000 2.50 5) 245.45 s 245.45 S 0.0% 2,000 5.00 5 406.58 S 406.58 5) 0.0% 3,000 7.50 5) 604.48 s 602.78 S (1.70) -0.3% 4.000 1000 S 802.38 S 798.99 S (3.39) -04% 5.000 12.50 S 1,000.29 s 995.20 S (5.09) -0.5%
10,000 25.00 S 1.989.78 S 1,976.21 S (13.57) -0.7% 15,000 37.50 s 2.979.29 s 2.957.23 S (22.06) -07% 20.000 50.00 S 3.96879 s 3,938.24 S (30.55) -0.8% 30,000 75.00 S 5.947.80 $ 5,900.28 s (47.52) -0.8% 40,000 100.00 s 7,92681 5) 7,862.31 s (64.50) -0.8% 50,000 125.00 5) 9,848.47 5) 9,824.35 S (24.12) -0.2% 60,000 150.00 s 11.770.13 s 11,786.38 5) 16.25 0.1% 80,000 200.00 s 15,613.46 5) 15,710.45 S 96.99 0.6% 90,000 225.00 5) 17,535.12 s 17,672.49 s 137.37 0.8%
100,000 250.00 S 19,456.78 S 19,634.52 S 177.74 0.9% 120,000 300.00 s 23,300.11 s 23,558.59 $ 258.48 1.1% 150.000 375.00 s 29,065.09 $ 29,444.69 s 379.60 1.3% 200,000 500.00 S 38,673.40 $ 39,254.86 S 581.46 1.5% 300,000 750.00 $ 57,890.03 s 58,875.22 s 985.19 1.7% 450,000 1,125.00 s 86,714.96 $ 88,305.73 s 1.590.77 1.8% 500,000 1,250.00 s 96.323.27 $ 98,115.91 S 1,792.64 1.9%
~ e:"'dg: ~I-w.---.)~ a,~ --.)'N~

CONSOLIDATED EDISON COMPANY OF NEW YORK, INC,
COMPARISON OF BILLS CALCULATED AT CURRENT RATES VS. PROPOSED FLAT RATES @ MAY 2009 RATE LEVEL
ELECTRIC S. C. NO. 12 TABLE NO, 61
MULTIPLE DWELLING - SPACE HEATING - LOW TENSION WINTER PERIOD
200 HOURS USE OF DEMAND PER MONTH
KWHR USE 30 DAYS
kW DEMAND
AT CURRENT RATE
AT PROPOSED RATE VARIANCE
PERCENTAGE VARIANCE
1,000 1,500 2,000
. 3,000 5,000
10,000 15,000 20,000 30,000 40,000 50,000 60.000 80,000 90,000
100,000 120,000 150,000 200,000 300,600
5.00 7.50
10.00 1500 25.00 50.00 75.00
100.00 150.00 20000 250.00 300.00 400.00 450.00 500.00 600.00 750.00
1,000.00 1,500.00
$ 233.79 s 339.84 S 445.88 $ 657.96 s 1,082.14 S 2,142.56 $ 3,202.99 s 4,263.41 S 6,38426 s 8,505.10 S 10,526.70 S 12,548.29 $ 16,591.47 S 18,613.06 s 20,634.66 s 24.677.83 $ 30,742.60 $ 40,850.55 s 61,066.46
S 228.80 S 332.35 S 435.90 S 642.99 s 1,057.20 s 2,092.67 S 3,128.16 s 4,163.64 s 6,23460 $ 8,305.56 $ 10,376.53 S 12,447.49 s 16.589.41 S 18,660.37 S 20,731.34 $ 24.873.26 s 31,086.15 $ 41,440.97 $ 62,150.60
$ ::; $ s $ s ::; S S S 5 s s is S is S s s
(4.99) (7.49) (9.98)
(14,97) (24.94) (49.89) (74.83) (99.77)
(149.66) (199.54) (150.17) (100.80)
(2.06) 47.31 96.68
195.43 343.55 590.42
1.084.14
-2.1% -2.2% -2.2% -2.3% -2.3% -2.3% -2.3% -2.3% -2.3% -2.3% -1.4% -0.8% 0.0% 0.3% 0.5% 0.8% 1.1% 1A% 1.8%
~ i\[ v,>"""'"
OO~s,:;tl-...,J.':" N '-"'

CONSOLIDATED EDISON COMPANY OF NEW YORK, INC.
COMPARISON OF BILLS CALCULATED AT CURRENT RATES VS PROPOSED FLAT RATES @ MAY 2009 RATE LEVEL
ELECTRIC S. C. NO. 12 TABLE NO. 62
MULTIPLE DWELLING - SPACE HEATING -LOW TENSION WINTER PERIOD
300 HOURS USE OF DEMAND PER MONTH
KWHRUSE 30 DAYS
kW DEMAND
AT CURRENT RATE
AT PROPOSED RATE VARIANCE
PERCENTAGE VARIANCE
1,000 1,500 2,000 3,000 5,000
10.000 15,000 20.000 30,000 40.000 50,000 60.000 80.000 90,000
100.000 120.000 150,000 200.000 300.000 450,000
3.33 5.00 6.66
10.00 16.66 33.33 50.00 66.66
100.00 133.33 166.66 200.00 266.66 300.00 333.33 400.00 500.00 666.66
1,000.00 1.500.00
$ 233.79 $ 312.04 s 40873 s 602.36 s 989.40 s 1,957.20 $ 2,925.01 s 3.89270 S 5,828.30 S 7,763.80 S 9,699.29 S 11.634.90 S 15.373.55 $ 17,242.97 $ 19.112.30 S 22.851.04 s 28.459.12 s 37,805.85 $ 56,499.50 $ 84,539.87
s 228.80 $ 307.05 S 402.09 $ 592.38 $ 972.78 $ 1,923.95 s 2,875.12 $ 3,826.19 $ 5,728.53 $ 7,630.77 S 9.533.01 s 11,435.35 S 15.239.83 s 17.142.17 $ 19,044.42 S 22.848.99 S 28,555.81 $ 38,067.10 $ 57,089.91 S 85,624.01
s (4.99) $ (4.99) S (6.64) S (9.98) $ (16.62) $ (33.25) S (49.89) S (66.51) S (99.n) s (133.03) S (166.28) S (199.55) S (133.72) s (100.80) s (67.88) s (2.05)
S 96.69 $ 261.25 $ 590.41 S 1,084.14
-2.1% -1.6% -1.6% -1.7% -1.7% -1.7% -1.7% -1-7% -1.7% -1.7% -1.7% -1.7% -0.9% -0.6% -0.4% 0.0% 0.3% 0.7% 1.0% 1.3%
~ ita: w,-.,'Os;: g,~ --..J'N .......
'-"

CONSOLIDATED EDISON COMPANY OF NEW YORK. INC.
COMPARISON OF BILLS CALCULATED AT CURRENT RATES VS. PROPOSED FLAT RATES @ MAY 2009 RATE LEVEL
ELECTRIC S. C. NO. 12 TABLE NO. 63
MULTIPLE DWELLING - SPACE HEATING - LOW TENSION WINTER PERIOD
.400 HOURS USE OF DEMAND PER MONTH'
KWHRUSE kW AT CURRENT AT PROPOSED PERCENTAGE 30 DAYS DEMAND RATE RATE VARIANCE VARIANCE
1,000 2.50 S 233.79 $ 228.80 s (4.99) -2.1% 1,500 3.75 s 312.04 $ .307.05 $ (4.99) -1.6% 2,000 5.00 s 390.28 $ 385.29 S (4.99) ·1.3% 3,000 7.50 $ 57457 s 567.08 s (7.49) -1.3% 5,000 12.50 s 943.16 $ 930.68 $ (12.48) -1.3%
10,000 25.00 s 1,86458 $ 1,839.63 S (24.95) -1.3% 15,000 37.50 $ 2,786.03 S 2,748.61 s (37.42) -1.3% 20.000 50.00 s 3.707.46 S 3.657.57 S {49.89) -1.3% 30,000 75.00 s 5,550.33 S 5,475.49 $ (74.84) -1.3% 40,000 100.00 S 7,393.19 S 7,293.42 s (99.77) -1.3% 50,000 125.00 S 9,236.07 s 9,111.35 S (124.72) -1.4% 60,000 150.00 $ 11,078.94 s 10,929.28 S (14966) -1.4% 80,000 200.00 $ 14,764.69 S 14,565.14 $ (199.55) -1.4% 90,000 225.00 s 16,557,93 s 16.383.06 s (174.87) -1.1%
100,000 250.00 s 18,351.17 S 18,201.00 s (150.17) -0.8% 120,000 300.00 $ 21,937.65 S 21,836.85 $ (100.80) -0.5% 150,000 375.00 $ 27,317.38 $ 27.290.63 $ (26.75) -0,1% 200,000 500,00 $ 36,283.59 s 36,380.28 S 96.69 0.3% 300,000 750.00 s 54,21602 $ 54,559.57 S 343.55 0.6% 450,000 1,125.00 s 81,114.65 s 81,828.49 s 713.84 0.9% 500,000 1.250.00 $ 90,080.86 s 90,918.14 S 837.28 0.9%
~ ::r'
>-o§: ~( ~,--...,
Ot"""
~~ -....,J'tv":::

CONSOLIDATED EDISON COMPANY OF NEW YORK. INC.
COMPARISON OF BILLS CALCULATED AT CURRENT RATES VS PROPOSED FLAT RATES @MAY 2009 RATE LEVEL
ELECTRIC S. C. NO. 12 TABLE NO. 64
MULTIPLE DWELLING - SPACE HEATING - LOW TENSION WINTER PERIOD
500 HOURS USE OF DEMAND PER MONTH
KWHRUSE 30 DAYS
kW DEMAND
AT CURRENT RATE
AT PROPOSED RATE VARIANCE
PERCENTAGE VARIANCE
1,000 1,500 2,000 3,000 5,000
10.000 15,000 20,000 30,000 40,000 50,000 60,000 80.000 90,000
100,000 120,000 150,000 200,000 300,000 450,000 500,000 750,000
200 3.00 4.00 600
10.00 20.00 30.00 4000 60.00 80.00
100.00 120.00 160.00 180.00 200.00 24000 300.00 400.00 600.00 900.00
1,000.00 1,500.00
s 233.79 S 312.04 s 390.28 s 557.88 S 915.36 S 1,80898 S 2,702.63 S 3.59627 S 5,383.54 S 7.170.81 $ 8,95809 $ 10,745.37 s 14.319.92 s 16,107.20 s 17,894.48 S 21,389.62
s 26,632.33 $ 35,370.20 s 52,845.93 $ 79,059.51 $ 87,797.38 S 131,486.69
s 228.80 $ 307.05 $ 385.29 S 551.90 s 905.38 S 1.78903 S 2,672.70 S 3,556.36 S 5,323.67 S 7,090.99 S 8.858.32 $ 10,625.64 s 14,160.28 s 15,927.60 $ 17,694.93 $ 21,229.57
S 26,531.53 S 35,368.14 S 53,041.36 s 79,551.18 S 88,387.79 s 132,570.83
S S S s $ S S s S S S $
S s s $ S s S
s S S
(4.99) (4.99) (4.99) (598) (9.98)
(19.95) (29.93) (39.91) (59.87) (79.82) (99.77)
(119.73) (159.64) (179.60) (199.55) (160.05) (100.80)
(2.06) 195.43 491.67 590.41
1,084.14
-2.1% -1.6% -1.3% -1.1 % -1.1% -1.1% -1.1% -1.1% -1.1% -1.1% -1.1% -1.1% -1.1% -1.1% -1.1 % -0.7% -0.4% 0.0% 0.4% 0.6% 0.7% 0.8%
~ "'O§: ~I-~,--.., ...... t'""'
~~ -..,J'N ......
'-"

CONSOLIDATED EDISON COMPANY OF NEW YORK. INC.
COMPARISON OF BILLS CALCULATED AT CURRENTRATES VS. PROPOSED FLAT RATES@ MAY 2009 RATE LEVEL
ELECTRIC S. C. NO. 12 TABLE NO. 65
MUL TIPLE DWELLING - SPACE HEATING - LOW TENSION WINTER PERIOD
600 HOURS USE OF DEMAND PER MONTH
KWHRUSE kW AT CURRENT AT PROPOSED PERCENTAGE 30 DAYS DEMAND RATE RATE VARIANCE VARIANCE
1,000 166 S 233.79 s 228.80 S (4.99) -2.1 % 1.500 2.50 S 31204$ 307.05 s (4.99) -1.6% 2,000 3.33 S 390.2B $ 385.29 S (4.99) -1.3% 3,000 500 S 546.76 $ 541.78 S (4.98) -0.9% 5,000 8.33 s 896.79 s 888.48 s (8.31 ) -0.9%
10,000 16.66 S 1,771.84 s 1,755.22 s (16.62) -0.9% 15.000 2500 s 2.647.03 s 2,622.09 s (24.94) -0.9% 20,000 33.33 $ 3,522.10 s 3,488.85 S (33.25) -0.9% 30,000 50.00 s 5.272.35 s 5,222.46 s (49.89) -0.9% 40,000 6666 s 7,022.48 $ 6.955.97 S (6651 ) -0.9% 50,000 83.33 s 8,772.74 s 8,689.60 s (83.14) -0.9% 60,000 100.00 s 10,52298 s 10,423,21 $ (99.77) -0.9% 80.000 133.33 s 14,023.38 s 13,890.35 s (133.03) -0.9% 90,000 150.00 $ 15,773.62 s 15,623.96 s (149.66) -0.9%
100,000 166.66 s 17,523.76 S 17,357.48 $ (166.28) -0.9% 120,000 200.00 $ 21,024.26 s 20,824.71 s (199.55) -0.9% 150,000 250.00 $ 26,175.64 $ 26,025.46 $ (150.18) -0.6%
. 200,000 333.33 S 34,761.24 $ 34,693.35 $ (67.89) -0.2% 300,000 500.00 S 51,932.54 S 52,029.22 $ 96.68 0.2% 450,000 750.00 $ 77,689.43 S 78,032.98 s 343.55 0.4% 500,000 833.33 s 86.275.03 S 86,700.87 s 425.84 0.5% 750,000 1,250.00 $ 129.203.21 S 130,040.49 s 837.28 0.6%
~ t:T'
>-tl8: ~I-~,-...,
Nt"'" o ;J>'""'l:-O -...:I'N0

CONSOLIDATED EDISON COMPANY OF NEW YORK, INC,
COMPARISON OF BILLS CALCULATED AT CURRENT RATES VS. PROPOSED FLAT RATES @ MAY 2009 RATE LEVEL
ELECTRIC S. C. NO. 12 TABLE NO. 66
MULTIPLE DWELLING - SPACE HEATING - LOW TENSION SUMMER PERIOD
200 HOURS USE OF DEMAND PER MONTH
KWHR USE 30 DAYS
kW DEMAND
AT CURRENT RATE
AT PROPOSED RATE VARIANCE
PERCENTAGE VARIANCE
1,000 1,500 2,000 3,000 5,000
10,000 15,000 20,000 30,000 40,000 50,000 60,000 80,000 90,000
100,000 120,000 150,000 200,000 300,000
5.00 7.50
10.00 15.00 25.00 50.00 75.00
100.00 150.00 200.00 250.00 300.00 400.00 450.00 500.00 600.00 750.00
1,000.00 1,500.00
s 273.29 5> 399.09 s 524.87 S 77645 S 1,279.63 S 2,537.54 s 3,79546 s 5,053.37 S 7,569.20 s 10,085.03 s 12,501.60 $ 14,918.17 S 19,751.32 S 22,167.88 s 24,584.46 s 29,417.59
S 36,667.31 S 48,750.16 S 72,915.87
s 268.30 S 391.60 S 514.90 s 76148 S 1,254.69 S 2,487.65 S 3,720.63 S 4,953.60 S 7,419.54 S 9,885.48 s 12,351.43 S 14,817.37 S 19,749.26 $ 22,215.20 s 24,681.15 $ 29,613.03 $ 37,010.86 $ 49,340.58 S 74,000.01
$ (4.99) S (7.49) S (9.97) S (14.97) S (24.94) S (49.89) s (74.83) S (99.77) S (149.66) S (199.55) S (150.17) S (100.80) S (2.06) s 47.32 5> 96.69 $ 195.44
S 343.55 S 590.42 S 1,084.14
-1.8% -1.9% -1.9% -1.9% -1.9% -2.0% -2.0% -2.0% -2.0% -2.0% -1.2% -0.7% 0.0% 0.2% 0.4% 0.7% 0.9% 1.2% 1.5%
~ ::J'"
'"O§: ~( +;>.--VJr-'
~~ -:I'N-'"-'

CONSOLIDATED EDISON COMPANY OF NEW YORK. INC.
COMPARISON OF BILLS CALCULATED AT CURRENT RATES VS. PROPOSED FLAT RATES @ MAY 2009 RATE LEVEL
ELECTRIC S. C. NO. 12 TABLE NO. 67
MULTIPLE DWELLING - SPACE HEATING - LOW TENSION SUMMER PERIOD
300 HOURS USE OF DEMAND PER MONTH
KWHR USE 30 DAYS
kW DEMAND
AT CURRENT RATE
AT PROPOSED RATE VARIANCE
PERCENTAGE VARIANCE
1.000 1,500 2,000 3,000 5,000
10,000 15,000 20,000 30,000 40,000 50,000 60,000 80,000 90,000
100,000 120,000 150,000 200,000 300,000 450,000
3.33 5.00 6.66
10.00 16.66 33.33 50.00 66.66
10000 133.33 166.66 200.00 266.66 300.00 333.33 40000 500.00 666.66
1,000.00 1,500.00
$ 273.29 s 351.54 $ 461.35 $ 681.36 s 1,121.01 s 2,220.49 $ 3,319.99 S 4,419.29 S 6,618.26 S 8,817.05 S 11,015.84 S 13,214.82 S 17,480.06 $ 19,612.85 S 21,745.48 S 26,010.89 S 32,408.92 S 43,072.20 s 64,399.11 $ 96,389.28
S 268.30 S 346.55 S 454.70 s 671.38 $ 1,104.39 s 2,187.24 $ 3,270.11 S 4,352.78 $ 6,518,49 s 8,684.02 s 10,849.56
s 13,015.27 s 17,346.34 s 19,512.05 s 21,677.59 S 26,008.83 s 32,505.61 $ 43,333.46 s 64,989.52 $ 97,473.42
S (4.99) s (4.99) s (6.65)
S (9.98) $ (16.62) S (3325) $ (49.88) S (66.51) S (99.77) S (133.03) s (166.28)
S (199.55) 5 (133.72) $ (100.80) 5 (67.89) S (2.06)
s 96.69 S 261.26 S 590.41 $ 1,084.14
-1.8% -1-4% -1,4% -1.5% -1.5% -1.5% -1.5% -1.5% -1.5% -1.5% -1.5% -1.5% -0.8% -0,5% -0.3% 0.0% 0.3% 0.6% 0.9% 1.1%
~ ""dS: ~I-~---~5: ~id -.}'N~
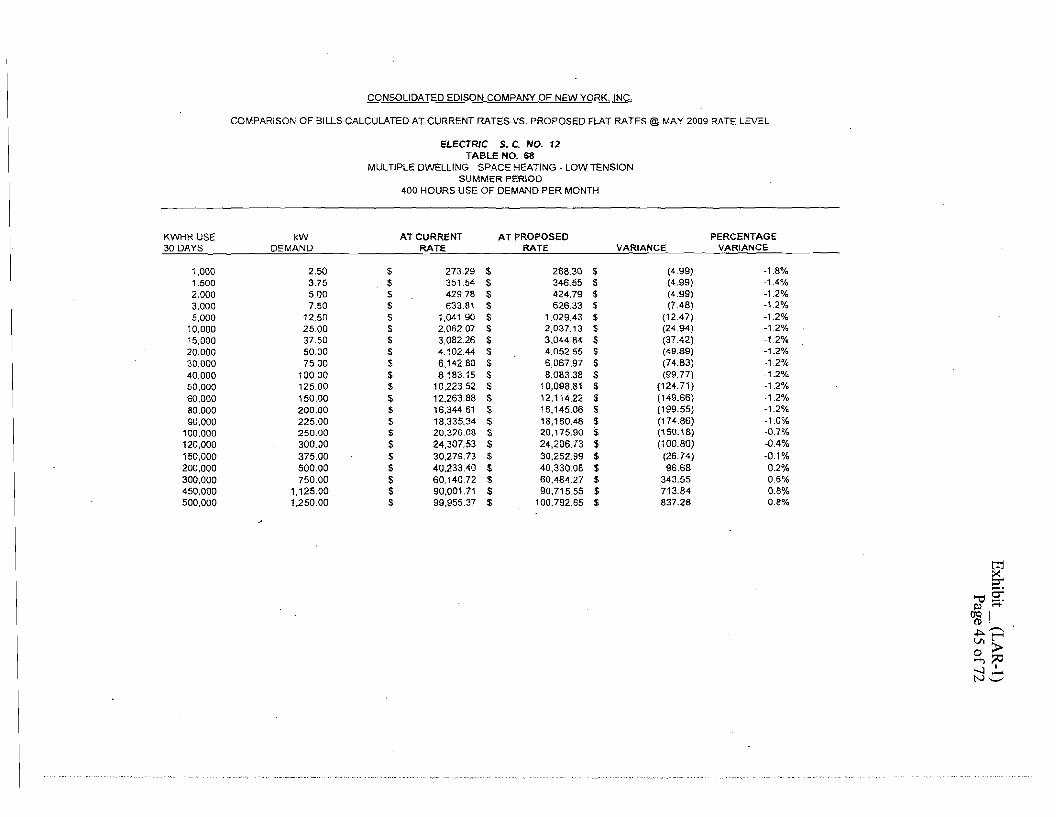
CONSOLIDATED EDISON COMPANY OF NEW YORK, INC.
COMPARISON OF BILLS CALCULATED AT CURRENT RATES VS. PROPOSED FLAT RATES @ MAY 2009 RATE LEVEL
ELECTRIC S. C. NO. 12 TABLE NO, 68
MULTIPLE DWELLING - SPACE HEATING - LOW TENSION SUMMER PERIOD
400 HOURS USE OF DEMAND PER MONTH
KWHR USE 30 DAYS
kW DEMAND
AT CURRENT RATE
AT PROPOSED RATE VARIANCE
PERCENTAGE VARIANCE
1,000 1,500 2,000 3,000 5,000
10.000 15,000 20,000 30,000 40,000 50,000 60,000 80,000 90,000
100.000 120,000 150,000 200,000 300.000 450,000 500,000
2.50 3.75 5.00 7.50
12.50 25.00 37.50 50.00 75.00
10000 125.00 150.00 200.00 225.00 250.00 300.00 375.00 500.00 750.00
1,125.00 1.250.00
S 273.29 $ 351.54 S 429.78 s 633.81 $ 1,041.90 S 2,062.07 $ 3,082.26 $ 4.102.44 S 6,142.80 S 8.183.15 S 10,223.52 S 12,263.88 $ 16,344.61 s 18,335.34 s 20,326.08 S 24,307.53 s 30,279.73 s 40.233.40 S 60,14072 $ 90.001.71 s 99,955.37
S 268.30 S 346.55 s 424.79 $ 626.33 s 1,029.43 S 2,037.13 $ 3.044.84 s 4,052.55 $ 6,067.97 s 8,083.38 S 10,098.81 s 12,114.22 $ 16,145.06 S 18,160,48 S 20,175.90 S 24,206.73 $ 30.252.99 $ 40,330.08 s 60.484.27 S 90,715.55 s 100.792.65
$ (499) S (4.99) $ (4.99) s (7.48)
s (12.47) s (2494) s (37,42) $ (49.89)
S (74.83) S (99.77) s (124.71)
S (149.66) s (199.55) $ (174.86) S (150.18) $ (100.80) $ (26.74) $ 96.68 s 343.55 $ 713.84 $ 837.28
-1.8% -1.4% -1.2% -1.2% -1.2% -1.2% -1.2% -1.2% -1.2% -1.2% -1.2% -1.2% -1.2% -1.0% -0.7% -0.4% -0.1% 0.2% 0.6% 0.8% 0.8%
~ ~§: Il) I..... ~ .,j::;..-Vlt'""" o >>-i'):;z:::l -...J'N-':::

CONSOLIDATED EDISON COMPANY OF NEW YORK, INC.
COMPARISON OF BILLS CALCULATED AT CURRENT RATES VS, PROPOSED FLAT RATES @ MAY 2009 RATE LEVEL
ELECTRIC S. C. NO. 12 TABLE NO. 69
MULTIPLE DWELLING - SPACE HEATING - LOW TENSION SUMMER PERIOD
500 HOURS USE OF DEMAND PER MONTH
KWHR USE 30 DAYS
kW DEMAND
AT CURRENT RATE
AT PROPOSED RATE VARIANCE
PERCENTAGE VARIANCE
1,000 1.500 2.000 3,000 5,000
10,000 15.000 20,000 30,000 40,000 50,000 60.000 80,000 90,000
100,000 120.000 150,000 200,000 300.000 450,000 500,000 750,000
2,00 300 4.00 6.00
10.00 20.00 30.00 40.00 60.00 80.00
100.00 120.00 160.00 180.00 200.00 240.00 300.00 400.00 600.00 900.00
1,000.00 1,500.00
s 273.29 S 351.54 s 429.78 s 605.28 S 99435 S 1.966.97 S 2,939.62 S 3.912.25 s 5.857.51 S 7,80278 S 9,748.05 S 11,693.32 S 15,583.86 s 17,529.12 S 19,474.40 S 23,285.52 s 29.002.22 S 38,530.04 s 57,585.69 $ 86,169.16 s 95,696.99 s 143,336.11
S 268.30 S 346.55 S 424.79 S 599.29 S 984.38 S 1,947.02 S 2,90969 s 3,872.34 S 5,797.65 S 7,722.96 $ 9,648.28 S 11,573.59 s 15,424.22 s 17,349.53 S 19,274.85 s 23,125.47 $ 28,901.41 s 38,527.98 $ 57,781.13 s 86,660.83 s 96,287.40 s 144,420.25
s (4.99) S (499) S (4.99) s (5.99) S (9.97) S (19.95) S (2993) S (39.91) s (59.86) S (79.82) S (99.77) s (119.73) s (159.64) s (179.59) S (199.55) S (160.05)
s (100.81) S (2.06) s 195.44 s 491.67 $ 590.41 $ 1.084.14
-1.8% -1.4% -1.2% ·1.0% -1.0% -1.0% -1.0% -1.0% ·1.0% .1.0% ·1.0% ·1.0% ·1.0% -1.0% -1.0% -0.7%
·0.3% 0.0% 0.3% 0.6% 0.6% 0.8%
~ ::r"
""dO-: ~I::;" ~~
O\~ s"?O .....:I'N'-'

CONSOLIDATED EDISON COMPANY OF NEW YORK, INC.
COMPARISON OF BILLS CALCULATED AT CURRENT RATES VS. PROPOSED FLAT RATES @ MAY 2009 RATE lEVEL
ELECTRIC S. C. NO. 12 TABLE NO. 70
MULTIPLE DWELLING· SPACE HEATING - LOW TENSION SUMMER PERIOD
600 HOURS USE OF DEMAND PER MONTH
KWHRUSE 30 DAYS
kW DEMAND
AT CURRENT RATE
AT PROPOSED RATE VARIANCE
PERCENTAGE VARIANCE
1,000 1,500 2,000 3,000 5,000
10,000 15,000 20,000 30,000 40,000 50.000 60,000 80,000 90,000
100,000 120,000 150,000 200,000 300,000 450,000 500,000 750.000
1.66 250 3.33 . 5.00 8.33
16.66 2500 33.3\3 50.00 66.66 83.33
100.0.0 133.33 150.00 166.66 200.00 250.00 333.33 50000 750.00 833.33
1.250.00
$ 273.29 s 351.54 s 429.78 s 586.26 S 962.59 $ 1,903.45 s 2.844.52 S 3,785.39 s 5,66733 s 7,549.07 s 9,431.01 s 11,312.95 s 15,076.63 $ 16,958.56 s 18.840.31 s 22,604.18 s 28,15054 s 37,394.41 s 55,882.34 S 83,614.13 s 92,858.00 s 139,077.73
s 268.30 S 346.55 S 424.79 S 581.27 $ 954.28 $ 1,886.83 $ 2,819.58 s 3.752.14 s 5,617.44 s 7,482.56 s 9,347.87 s 11,213.17 s 14,943.60 S 16.808.90 s 18,674.03 s 22,404.63 S 28,000.36 $ 37,326.52 s 55,979.03 $ 83,957.68 s 93,283.84 s 139.915.00
S (4.99) s (4.99) S (4.99) S (4.99) s (831) s (16.62) $ (24.94) $ (3325) $ (49.89) S (66.51 ) $ (83.14) s (99.78) s (133.03) $ (149,66) $ (166.28) s (199.55) $ (150.18) s (67.89) s 9669 $ 343.55 s 425.84 s 837.27
-1.8% -1.4% -1.2% -0.9% -09% ·0.9% -0.9% -0.9% -0.9% -0.9% ·0.9% -0.9% -0.9% -0.9% -0.9% -0.9% -0.5% -0.2% 0.2% 0.4% 0.5% 0.6%
~ i:T'
"'t;jg: ~I~ +::-.--...1~ g,~ -...1'N0

CONSOLIDATED EDISON COMPANY OF NEW YORK, INC.
COMPARISON OF BILLS CALCULATED AT CURRENT RATES vS PROPOSED FLAT RATES @ MAY 2009 RATE LEVEL
ELECTRIC S. C. NO. 12 TABLE NO, 71
MULTIPLE DWELLING - SPACE HEATING - NONDEMAND WINTER PERIOD
KWHR USE AT CURRENT AT PROPOSED PERCENTAGE 30 DAYS RATE RATE VARIANCE VARIANCE
10 S 9.92 S 992 s 0.0% 20 $ 12.25 S 12.01 $ (0.24) -2.0% 30 S 14.57 S 14.09 s (0,48) -3.3% 50 S 19.20 S 18.26 S (0.94) -4.9% 60 S 21.54 S 20.37 S (1.17) -5.4% 80 S 26.19 s 24.55 $ (1.64) -6.3%
100 s 30.83 S 28.72 S (2.11 ) -6.8% 120 .$ 35.47 S 32.89 $ (2.58) -7.3% 150 s 42,43 $ 39.15 S (3,28). -7.7% 200 S 54.06 S 49.60 S (4.46) -8.3% 210 $ 56.39 $ 5UO S (4.69) -8.3% 240 s 6334 s 57.95 s (5.39) -8.5% 250 s 65.67 S 60.05 s (5.62) -8.6% 300 s 77.29 s 70.49 $ (6.80) -8.8% 360 s 88.60 s 83.03 s (5.57) -6.3% 400 s 96.13 s 91.36 $ (4.77) -5,0%
450 s 105.56 S 101.82 s (3.74) -3.5% 500 S 11498 $ 112.25 s (2.73) -2.4% 750 S 162.10 s 164.46 $ 2.36 1.5% 780 s 167.76 s 170.73 s 2.97 1.8%
1000 '$ 209.21 $ 216.67 $ 7,46 3,6% 1500 s 303.46 $ 321,10 $ 17.64 5.8% 3000 s 586.17 $ 634,36 S 48,19 8.2% 6000 s 1.151.60 s 1.260,89 S 109.29 9.5%
m :>< ::r.....
'"t;lS: ~I~ ~r-. COt:"'"' o :> '""l~ ......:II N~

CONSOLIDATED EDISON COMPANY OF NEW YORK, INC.
COMPARISON OF BILLS CALCULATED AT CURRENT RATES VS. PROPOSED FLAT RATES @ MAY 2009 RATE LEVEL
ELECTRIC S. C. NO. 12 TABLE NO. 72
MULTIPLE DWELLING - SPACE HEATING - NONOEMAND SUMMER PERIOD

Exhibit_ (LAR-1) Page 50 of 72
Company Name: Con Edison Case Description: 2009 Electric Rate Filing
Case: 09-E-0428
Response to DPS Interrogatories - Set DPS41 Date of Response: 08/10/2009
Responding Witness: Rate Panel
Question No. :397 .Subject: ECOS NYPA Deficiency - As a follow up to the ECOS / rate design technical conference on July 27, 2009, explain what the Company believes to be the causes of the continuing NYPA class deficiency in the 2007 ECOS study.
Response: The 2007 ECOS study shows a NYPA revenue deficiency essentially due to the fact that the 2005 ECOS NYP A deficiency was not fully addressed in cases 07-E-0523 and 08-E0539. As a result of not aligning NYPA's rates to reflect the full deficiency, any rate increases in those cases were allocated disproportionally more to Con Edison classes, thus exacerbating a deficiency position for NYPA.
Another factor contributing to the NYPA class deficiency in the 2007 ECOS study is the exclusion ofNYPA from a miscellaneous revenue allocation related to Late Payment Charges, POR Discount Revenues and CUBS Credit Revenues.

Exhibit_ (LAR-1) Page 51 of72
Company Name: Con Edison Case Description: 2009 Electric Rate Filing
Case: 09-E-0428
Response to DPS Interrogatories - Set DPS49 Date of Response: 08/24/2009
Responding Witness: Electric Rate Panel
Question No. :449 Subject: Declining Block Rates - As a follow up to the Company's response to DPS-361, provide redesigned SC1 and SC7 rates at the May 2009 rate level and the related bill
. tables, assuming the following two alternate rate designs: 1. Same flat rates for all winter usage blocks and for the first 250 kWh in summer; Inclining block rate for the summer block over 250kWh; Maintain the Winter Space Heating Discount for usage over 360 kWh in SC7. 2. Same flat rates for all winter usage blocks and for the first 250 kWh in summer; Inclining block rate for the summer block over 250 kWh; Eliminate the Winter Space Heating Discount for SC7.
Response: See attached.

Exhibit_ (LAR-1) Page 52 of 72
Alternate Rate Design 1 Same Flat Rates for All Winter Usage Blocks and
for the First 250 kWh in Summer Inclining Block Rate for Summer Block over 250 kWh
Maintain Winter Space Heating DIscount for Usage over 360 kWh in SC 7
SC 1
Current Redesigned
Customer Charge $ 14.18 $ 14.18
Winter Rate Per kWhr 0-250 $ 0.06674 $ 0.06435 >250 $ 0.06136 $ 0.06435
Summer Rate Per kWhr 0-250 $ 0.06674 $ 0.06435 >250 s 0.07511 S 0.07710
SC7 Current Redesigned
Customer Charge $ 14.18 $14.18
Winter Rate Per kWhr 0-250 s 0.06674 s 0.06435 250 - 360 s 0.06136 $ 0.06435 >360 Space Heating s 0.04600 s 0.04630
s Summer Rate Per kWhr s 0-250 s 0.06674 s 0.06435 >250 $ 0.07511 s 0.07710
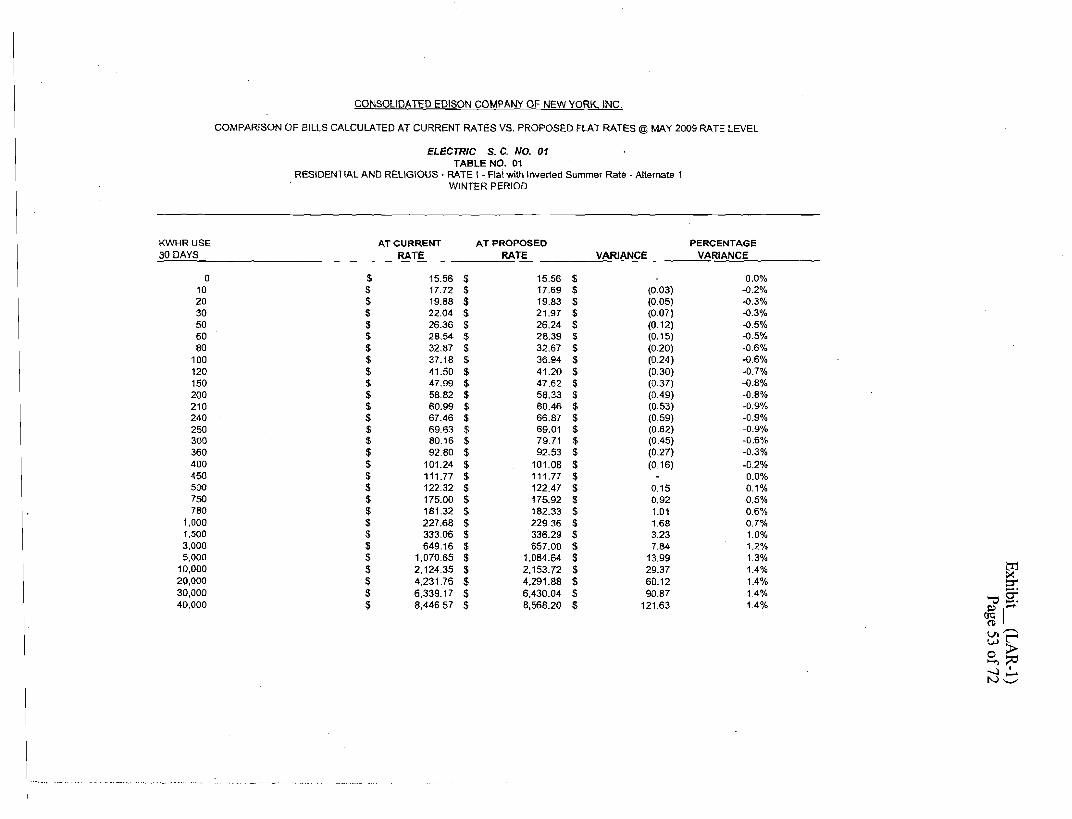
CONSOLIDATED EDISON COMPANY OF NEW YORK, INC.
COMPARISON OF BILLS CALCULATED AT CURRENT RATES VS. PROPOSED FLAT RATES@ MAY 2009 RATE LEVEL
ELECTRIC S. C. NO. 01 TABLE NO. 01
RESIDENTIAL AND RELIGIOUS - RATE I - Flat with Inverted Summer Rate - Alternate 1 WINTER PERIOD
KWHR USE AT CURRENT ATPROPOSEO PERCENTAGE 30 DAYS RATE RATE VARIANCE VARIANCE
0 s 15.56 $ 15.56 $ 0.0% 10 $ 17.72 $ 17.69 $ (0.03) -0.2% 20 $ 19.88 s 19.83 $ (0.05) -0.3% 30 $ 22.04 $ 21.97 $ (0.07) -0.3% 50 $ 26.36 $ 26.24 s (0.12) -0.5% 60 $ 28.54 $ 28.39 s (0.15) -0.5% 80 $ 32.87 $ 32.67 $ (0.20) -0.6%
100 $ 37.18 $ 36.94 $ (0.24) -0.6% 120 s 41.50 $ 41.20 $ (0.30) -0.7% 150 $ 47.99 $ 47.62 $ (0.37) -0.8% 200 $ 58.82 $ 58.33 $ (0.49) -0.8% 210 $ 60.99 $ 60.46 $ (0.53) -0.9% 240 $ 67.46 $ 66.87 $ (0.59) -0.9% 250 $ 69.63 $ 69.01 $ (0.62) -0.9% 300 s 80.16 $ 79.71 $ (0.45) -0.6% 360 $ 92.80 $ 92.53 $ (0.17) -0.3% 400 $ 101.24 $ 101.08 $ (0.16) -0.2% 450 $ 111.77 $ 111.77 $ - 0.0% 500 $ 122.32 $ 122.47 $ 0.15 0.1% 750 $ 175.00 $ 175.92 $ 0.92 0.5% 780 $ 181.32 $ 182.33 $ 1.01 0.6%
1.000 $ 227.68 $ 229.36 $ 1.68 0.7% 1,500 s 333.06 $ 336.29 $ 3.23 1.0% 3,000 $ 649.16 $ 657.00 s 7.84 1.2% 5,000 $ 1,070.65 $ 1.084.64 s 13.99 1.3%
10,000 20,000
$ $
2,124,35 4.231.76
$ $
2,153.72 4,291.88
$ $
29.37 60.12
1.4% 1.4%
~ ::r_.
30,000 40,000
$ $
6,339.17 8,446.57
$ $
6,430.04 8,568.20
$ $
90.87 121.63
1.4% 1.4%
""dg: ~( \Jl---v,)t""" o > ......,~ ......:JIN-':::::
_.~ ".. ,. ".... _-,... . ... ".." '_..." -....•

CONSOLIDATED EDISON COMPANY OF NEW YORK, INC.
COMPARISON OF BILLS CALCULATED AT CURRENT RATES VS. PROPOSED FLAT RATES @ MAY 2009 RATE LEVEL
ELECTRIC S. C. NO. 01 • TABLE NO. 02
RESIDENTIAL AND RELIGIOUS· RATE I • Flat with Inverted Summer Rate· Alternate 1 SUMMER PERIOD
KWHRUSE AT CURRENT AT PROPOSED PERCENTAGE 30 DAYS RATE RATE VARIANCE VARIANCE
0 $ 15.56 s 15.56 $ 0.0% 10 .$ 17.72 $ 17.69 $ (0.03) -02% 20 $ 19.88 s 19.83 $ (0.05) -0.3% 30 s 22.04 $ 21.97 $ (0.07) -0.3% 50 $ 26.36 s 26.24 $ (0.12) -0.5% 60 $ 28.54 s 28.39 $ (0.15) -0.5% 80 $ 32.87 $ 32.67 $ (0.20) -0.6%
100 s 37.18 $ 36.94 $ (0.24) -0.6% 120 s 41.50 $ 41.20 $ (0.30) -0.7% 150 s 47.99 s 47.62 $ (0.37) -0.8% 200 $ 58.82 $ 58.33 s (0.49) -0.8% 210 $ 60.99 $ 60.46 s (0.53) -0.9% 240 $ 67.46 $ 66.87 s (0.59) -0.9% 250 s 69.63 $ 69.01 $ (0.62) -0.9% 300 $ 80.87 $ 80.35 $ (0.52) -0.6% 360 $ 94.37 $ 93.97 $ (0.40) -0.4% 400 $ 103.36 s 103.05 $ (0.31) -0.3% 450 $ 114.60 $ 114.39 $ (0.21) -0.2% 500 $ 125.84 s 125.74 $ (0.10) -0.1% 750 s 182.07 $ .182.48 $ 0.41 0.2% 780 $ 188.81 $ 189.28 s 0.47 0.2%
1,000 $ 238.28 $ 239.20 $ 0.92 0.4% 1,500 $ 350.73 s 352.67 $ 1.94 0.60/0 3,000 $ 688.05 $ 693.06 $ 5.01 0.7% 5,000
10,000 20,000
$ $ $
1,137.83 2,262.25 4,511.08
$ s $
1,146.93 2,281.59 4,550.89
s $ s
9.10 19.34 39.81
0.8% 0.9% 0.9%
trJ ;><::r_.
30,000 40.000
$ $
6,759.92 9,008.75
$ $
6,820.20 9,089.50
$ $
60.28 80.75
0.9% 0.9% "'tiS:
~I-v-,-~r o ;l>....,:::-:; -...J' N~

CONSOLIDATED EDISON COMPANY OF NEW YORK, INC.
COMPARISON OF BILLS CALCULATED AT CURRENT RATES VS. PROPOSED FLAT RATES @ MAY 2009 RATE LEVEL
ELECTRIC S. C. NO. 07 TABLE NO. 35
RESIDENTIAL AND RELIGIOUS - SPACE or.SPACE and WATER HEATING - RATE I- Maintain Space Heating Rate - Alternate 1 WINTER PERIOD
KWHRUSE AT CURRENT AT PROPOSED PERCENTAGE 30 DAYS RATE RATE VARIANCE VARIANCE
0 $ 15.56 s 15.56 $ 0.0% 10 s 17.71 $ 17.68 $ (0.03) -0.2%
100 s 37.13 $ 36.89 $ (0.24) -0.6% 120 $ 41.44 $ 41.14 $ (0.30) -0.7% 150 s 47.91 $ 47.54 $ (0.37) -0.8% 200 s 58.70 s 58.21 $ (0.49) -0.8% 210 $ 60.87 $ 60.34 s (0.53) -0.9% 240 $ 67.32' s 66.73 s (0.59) -0.9% 250 $ 69.48 S 68.86 $ (0.62) -0.9% 300 s 80.00 s 79.55 s (0.45) -0.6% 360 $ 92.60 $ 92.33 s (0.27) -0.3% 400 $ 100.37 $ 100.11 s (0.26) -0.3% 450 $ 110.10 $ 109.85 $ (0.25) -0.2% 500 $ 119.81 $ 119.59 s (0.22) -0.2% 750 $ 168.40 $ 168.25 $ (0.15) -0.1% 780 $ 174.24 $ 174.09 $ (0.15) -0.1%
1,000 $ 216.99 s 216.91 $ (0.08) 0.0% 1.500 $ 314.19 $ 314.27 $ 0.08 0.0%
. 2,500 $ 508.57 $ 508.96 $ 0.39 0.1% 3.000 s 605.74 s 606.29 $ 0.55 0.1% 5,000 s 994.50 s 995.66 $ 1.16 0.1%
10,000 $ 1,966.38 s 1,969.09 s 2.71 0.1% 20,000 $ 3.910.14 s 3,915,93 $ 5.79 0.1% 30,000 $ 5,853,89 s 5,862.76 S 8.87 0.2% 40,000 50,000 60,000 70,000
100,000 120,000
S 7,797.65 $ 9,741.40 s 11,685.16 $ 13,628.92 $ 19,460.19 $ 23,347.70
$ 7,809.61 $ 9,756.45 $ 11.703.30 $ 13,650.14 $ 19,490.66 $ 23,384.35
s $ $ s s s
11.96 15.05 18.14 21.22 30.47 36.65
0.2% 0.2% 0.2% 0.2% 0.2% 0.2%
trJ ><::r.....
~g: ~ 1~ VI--VIr o >"'"'liti .....:1':N '-"

CONSOLIDATED EDISON COMPANY OF NEW YORK, INC.
COMPARISON OF BILLS CALCULATED AT CURRENT RATES VS. PROPOSED FLAT RATES@ MAY 2009 RATE LEVEL
ELECTRIC S. C. NO. 07 TABLE NO. 36
RESIDENTIAL AND RELIGIOUS - SPACE or SPACE and WATER HEATING· RATE I • Maintain Space Heating Rate - Alternate 1 SUMMER PERIOD
KWHRUSE AT CURRENT AT PROPOSED PERCENTAGE 30 DAYS RATE RATE VARIANCE VARIANCE
0 $ 15.56 s 15.56 $ - 0.0% 10 $ 17.71 $ 17.68 $ (0.03) -0.2%
100 $ 37.13 $ 36.89 $ (0.24) -0.6% 120 $ 41.44 $ 41.14 $ (0.30) -0.7% 150 $ 47.91 s 47.54 $ (0.37) -0.8% 200 s 58.70 $ 58.21 $ (0.49) -0.8% 210 $ 60.87 $ 60.34 $ (0.53) -0.9%
·240 $ 67.32 $ 66.73 $ (0.59) -0.9% 250 s 69.48 $ 68.86 $ (0.62) -0.9% 300 $ 80.71 $ . 80.19 $ (0.52) -0.6% 360 $ 94.17 $ 93.77 $ (0.40) -0.4% 400 s 103.13 $ 102.82 $ (0.31) -0.3% 450 $ 114.36 $ 114.15 $ (0.21) . -0.2% 500 $ 125.56 $ 125.46 $ (0.10) -0.1% 750 s 181.64 $ 182.05 s 0.41 0.2% 780 $ 188.37 s 188.84 $ 0.47 0.2%
1,000 $ 237.71 $ 238.63 s 0.92 0.4% 1,500 s 349.88 $ 351.82 s 1.94 0.6% 2,500 $ 574.21 s 578.20 s 3.99 0.7% 3.000 s 686.35 s 691.36 s 5.01 0.7% 5,000 $ 1,135.00 $ 1,144,10 $ 9.10 0.8%
10,000 $ 2,256.59 $ 2,275.93 $ 19.34 0.9% 20,000 s 4,499.77 s 4.539.58 s 39.81 0.9% 30,000 s 5,742.94 $ 6,803.22 s 60.28 0.9% 40,000 s 8,986.12 s 9,066.87 s 80.75 0.9% 50,000 $ 11,229.31 s 11,330.52 . $ 101.21 0.9% ~ 60.000 70,000
100,000 120,000
s 13,472.49 s 15,715.67 s 22,445.21 $ 25.931.57
$ 13.594.17 $ 15,857.82 $ 22,648.77 s 27,176.07
$ s $ s
121.68 142.15 203.56 244.50
0.9% 0.9% 0.9% 0.9%
e: "'"09': ~( Vl ,..-.... O\t""" o ;:»Jo-I')~ ......:I'N-::=

Exhibit_ (LAR-l) Page 57 of 72
Alternate Rate Design 2 • Same Flat Rates for All Winter Usage Blocks and
for the First 250 kWh in Summer Inclining Block Rate for Summer Block over 250 kWh
Eliminate Space Heating Discount for SC 7
SC 1 Current Redesigned
CustomerCharge $ 14.18 $ 14.18
Winter Rate Per kWhr 0·250 >250
$ 0.06674 $ 0.06136
$ 0,06415 s 0.06415
SummerRate PerkWhr 0-250 >250
s s
0,06674 0.07511
$ 0.06415 $ 0.07726
Current SC 7
Redesigned
CustomerCharge $ 14,18 $ 14.18
Winter RatePer kWhr 0-250 250 - 360 >360 SpaceHeating
$ 0.06674
s 0.06136 $ 0.04600
s 0,06415 $ 0.06415 $ 0.06415
SummerRate PerkWhr 0-250 >250
s 0.06674 $ 0.07511
$ 0.06415 s 0.07726
• Assumescombined SC 1 and 7 revenUe requirement.

CONSOLIDATED EDISON COMPANY OF NEW YORK, INC,
COMPARISON OF BILLS CALCULATED AT CURRENT RATES VS. PROPOSED FLAT RATES@ MAY 2009 RATE LEVEL
ELECTRIC S. C. NO, 01 TABLE NO. 01
RESIDENTIAL AND RELIGIOUS • RATE I - Combined SC 1 & 7 Flat Rates with Inverted Summer - Alternate 2 WINTER PERIOD
KWHR USE AT CURRENT AT PROPOSED PERCENTAGE 30 DAYS RATE RATE VARIANCE VARIANCE
0 s 15.56 $ 15.56 $ 0.0% 10 s 17.72 $ 17.69 $ (0.03) -0.2% 20 $ 19.88 s 19.82 $ (0.06) -0.3% 30 S 22.04 $ 21.96 $ (0.08) -0.4% 50 $ 26.36 $ 26.23 $ (0.13) -0.5% 60 $ 28.54 s 28.38 $ (0.16) -0.6% 80 $ 32.87 s 32.65 $ (0.22) -0.7%
100 $ 37.18 $ 36.92 $ (0.26) -0.7% 120 $ 41.50 $ 41.18 s (0.32) -0.8% 150 s 47.99 $ 47.58 $ (0.41 ) -0.9% 200 s 58.82 $ 58.29 s (0.53) -0.9% 210 $ 60.99 $ 60.42 $ (0.57) -0.9% 240 s 67.46 $ 66.83 $ (0.63) -0.9% 250 $ 69.63 $ 68.96 $ (0.67) -1.1)% 300 $ 80.16 $ 79.64 $ (0.52) -06% 360 $ 92.80 $ 92.45 $ (0.35) -0.4% 400 $ 101.24 s 101.00 $ (0.24) -0.2% 450 s 111.77 $ 111.67 s (0.10) -0.1% 500 $ 122.32 s 122.37 s 0.05 0.0% 750 $ 175.00 $ 175.76 $ 0.76 0.4% 780 $ 181.32 $ 182.18 $ 0.86 0.5%
1,000 $ 227.68 $ 229.16 $ 1.48 0.7% 1,500 s 333.06 $ 335.98 $ 2.92 0.9% 3,000 s 649.16 $ 65638 s 7.22 1.1% 5.000
10,000 20.000
$ $ s
1,070.65 2,124.35 4,231.76
$ $ $
1,083.61 2,151.66 4,287.76
$ $ $
12.96 27.31 56.00
1.2% 1.3% 1.3%
m X ::r'_.
30,000 $ 6,339.17 $ 6,423.87 $ 84.70 1.3% ~g: 40,000 s 8,446.57 $ 8,559.97 $ 113.40 1.3%
~( Vl--oor o > ....,~ -..J'tv0

CONSOLIDATED EDISON COMPANY OF NEW YORK, INC.
COMPARISON OF BILLS CALCULATED AT CURRENT RATES VS. PROPOSED FLAT RATES@ MAY 2009 RATE LEVEL
ELECTRIC S. C. NO. 01 TABLE NO. 02
RESIDENTIAL AND RELIGIOUS - RATE I • Combined SC 1 & 7 Flat Rates with Inverted Summer· Alternate 2 SUMMER PERIOD
KWHRUSE AT CURRENT AT PROPOSED PERCENTAGE 30 DAYS RATE RATE VARIANCE VARIANCE
0 $ 15.56 $ 15.56 $ 0.0% 10 s 17.72 $ 17.69 s (0.03) -0.2% 20 s 19.88 $ 19.82 $ (0.06) -0.3% 30 s 22.04 s 21.96 $ (0.08) -0.4% 50 $ 26.36 $ 26.23 $ (0.13) -0.5% 60 s 2854 $ 28.38 $ (0.16) -0.6% 80 $ 32.87 $ 32.65 s (0.22) -0.7%
100 s 3718 $ 36.~2 s (0.26) -0.7% 120 $ 41.50 $ 41.18 $ (0.32) -0.8% 150 $ 47.99 $ 47.58 $ (0.41 ) -0.9% 200 $ 58.82 s 58.29 $ (0.53) -0.9% 210 $ 60.99 $ 60.42 $ (0.57) -0.9% 240 $ 67.46 $ 66.83 s (0.63) -0.9% 250 s 69.63 s 68.96 s (0.67) -1.0% 300 $ 80.87 $ 80.31 $ (0.56) -0.7% 360 s 94.37 s 93.94 $ (0.43) -0.5% 400 s 10336 $ 103.03 $ (0.33) -03% 450 $ 114.60 s 114.37 $ (0.23) -0.2% 500 $ 125.84 $ 125.73 $ (0.11 ) -0.1% 750 $ 182.07 $ 182.51 $ 0.44 0.2% 780 $ 188.81 $ 189.33 $ 0.52 0.3%
1,000 s 238.28 $ 239.27 $ 0.99 0.4% .1.500 s 350.73 $ 352.83 $ 2.10 0.6% 3,000 $ 688.05 $ 693.46 s 5.41 0.8% 5,000 s 1,137.83 $ 1,147.66 $ 9,83 0.9% tn
10,000 20,000 30.000
s s $
2,262,25 4,511.08 6,759.92
$ $ $
2,283.14 4,554.09 6,825.04
s $ $
20.89 43.01 65.12
0.9% 1.0% 1.0%
~ ::r.... '"Os:
40,000 $ 9,008.75 s 9,095.99 $ 87.24 1.0% ~I~ Vl"-" '-D~ o :> .....,~
-.....J~ N,-,

CONSOLIDATED EDISON COMPANY OF NEW YORK, INC.
COMPARISON OF BILLS CALCULATED AT CURRENT RATES VS. PROPOSED FLAT RATES@ MAY 2009 RATE LEVEL
ELECTRIC S. C. NO. 07 TABLE NO. 35
RESIDENTIAL AND RELIGIOUS· SPACE or SPACE and WATER HTING·RATE I-Combined SC 1&7 Flat Rates with Inverted Summer-No Space Ht Block - Alternate 2 WINTER PERIOD
KWHRUSE AT CURRENT AT PROPOSED PERCENTAGE 30 DAYS RATE RATE VARIANCE VARIANCE
0 $ 15.56 $ 15.56 $ 0.0% 10 $ 17.71 s 17.68 $ (0.03) -0.2%
100 $ 37.13 $ 36.87 s (0.26) -0.7% 120 $ 41.44 s 41.12 $ (0.32) -0.8% 150 $ 47.91 $ 47.50 $ (0.41 ) -0.9% 200 $ 58.70 $ 58.17 $ (0.53) -0.9% 210 $ 60.87 s 60.30 $ (0.57) -0.9% 240 $ 67.32 $ 66.69 s (0.63) -0.9% 250 $ 69.48 $ 68.81 s (0.67) -1.0% 300 $ 80.00 $ 79.48 $ (0.52) -0.7% 360 $ 92.60 $ 92.25 $ (0.35) -0.4% 400 $ 100.37 $ 100.77 s 0.40 0.4% 450 $ 110.10 $ 111.43 $ 1.33 1.2% 500 $ 119.81 s 122.09 s 2.28 1.9% 750 $ 168.40 $ 175.33 $ 6.93 4.1% 780 s 174.24 s 181.74 s 7.50 4.3%
1.000 $ 216.99 $ 228.59 $ 11.60 5.3% 1,500 $ 314.19 $ 335.13 $ 20.94 6.7% 2,500 $ 508.57 $ 548.18 $ 39.61 78% 3,000 $ 605.74 s 654.68 $ 48.94 8.1% 5,000 $ 994.50 $ 1.080.78 $ 86.28 8.7%
10,000 $ 1,966.38 $ 2,146.00 $ 179.62 9.1% 20.POO $ 3,910.14 s 4,276.45 s 366.31 9.4% 30,000 $ 5,853.89 $ 6,406.89 $ 553.00 9.4% 40.000 50,000 60,000
s s $
7,797.65 9,741.40
11,685.16
$ $ s
8,53734 10,667.79 12,798.24
$ $ $
739.69 926.39
1.113.08
9.5% 9.5% 9.5%
tT:l:x::r_.
70,000 100,000 120,000
$ $ $
13,628.92 19,460.19 23,347.70
s $ $
14,928.68 21,320.02 25,580.92
$ $ $
1,299.76 1,859.83 2.233.22
9.5% 9.6% 9.6%
'"Cst. ~ I.....
08 0'1"-""Or o >'"'+lid -...,J' N~

CONSOLIDATED EDISON COMPANY OF NEW YORK, INC.
COMPARISON OF BILLS CALCULATED AT CURRENT RATES VS. PROPOSED FLAT RATES @ MAY 2009 RATE LEVEL
ELECTRIC S. C. NO. 07 TABLE NO. 36
RESIDENTIAL AND RELIGIOUS - SPACE or SPACE and WATER HTING-RATE I-Combined SC 1&7 Flat Rates with Inverted Summer - No Space Ht Block-Alternate 2 SUMMER PERIOD
KWHR USE AT CURRENT AT PROPOSED PERCENTAGE 30 DAYS RATE RATE VARIANCE VARIANCE
0 $ 15.56 $ 15.56 $ 0.0% 10 $ 17.71 $ 17.68 s (0.03) -0.2%
100 $ 37.13 $ 36.87 $ (0.26) -0.7% 120 s 41.44 $ 41.12 $ (0.32) -0.8% 150 $ 47.91 $ 4750 $ (0.41 ) -0.9% 200 $ 58.70 $ 58.17 $ (0.53) -0.9% 210 $ 60.87 s 60.30 s (0.57) -0.9% 240 $ 67.32 $ 66.69 $ (0.63) -0.9% 250 $ 69.48 $ 68.81 $ (0.67) -1.0% 300 $ 80.71 $ 80.15 $ (0.56) -0.7% 360 $ 94.17 $ 93.74 s (0.43) -0.5% 400 $ . 103.13 $ 102.80 $ (0.33) -0.3% 450 s 114.36 s 114.13 $ (0.23) -0.2% 500 $ 125.56 $ 125.45 s (0.11 ) -0.1% 750 $ 181.64 $ 182.08 $ 0.44 '0.2% 780 $ 188.37 $ 188.89 $ 0.52 0.3%
1,000 $ 237.71 s 238.70 $ 0.99 0.4% 1,500 $ 349.88 $ 351.98 $ 2.10 0.6% 2.500 $ 574.21 $ 578.52 s 4.31 0.8% 3,000 $ 686.35 $ 691.76 $ 5.41 0.8% 5,000 $ 1,135.00 s 1,144.83 s 9.83 0.9%
10,000 s 2,256.59 s 2.277.48 $ 20.89 0.9% 20,000 $ 4,499.77 $ 4,542.78 $ 43.01 1.0% 30,000 $ 6,742.94 $ 6,808.06 $ 65.12 1.0% 40,000 $ 8,986.12 $ 9,073.36 $ 87.24 1.0% 50,000 60,000
$ $
11,229.31 13,472.49
$ s
11,338.66 13,603.95
$ $
109.35 131.46
1.0% 1.0%
t'I1 &_.
70,000 100,000 120,000
$ $ $
15,715.67 22,445.21 26,931.57
$ s $
15,869.25 22,665.13 27,195.73
$ $ $
153.58 219.92 264.16
1.0% 1.0% 1.0%
"'08': ~I-0\-" .... r o >'""">:-0 -..J' N~

Exhibit_ (LAR-I) Page 62 of 72
Company Name: Con Edison Case Description: 2009 Electric Rate Filing
Case: 09-E-0428
Response to DPS Interrogatories - Set DPS50 Date of Response: 08/25/2009
Responding Witness: Electric Rate Panel
Question No. :450 Subject: Declining Block Rates. Follow up to DPS-361. - As a follow up to the Company's response to DPS-361, provide the impact on customer's bills of a three and a four year phase-out of the space heating discount applicable to the usage block over 360 kWh.
Response: See attached.


CONSOLIDATED EDISON COMPANY OF NEW YORK INC.
COMPARISON OF BILLS CALCULATED AT CURRENT RATES VS. PROPOSED FLAT RATES @ MAY 2009 RATE LEVEL
ELECTRIC S. C. NO. 01 TABLE NO. 01
RESIDENTIAL AND RELIGIOUS· RATE I - Combined SC 1&7 Flat Rates With Inverted Summer Rate - 3YR Sp Heat Phaseout WINTER PERIOD
KWHRUSE AT CURRENT Year 1 Year 2 Year 3 % Year 1 % Year 2 % Year 3 % Year 3 30 DAYS RATE RATE RATE RATE vs. Current YS. Year 1 YS. Year 2 YS. Current
0 $ 15.56 $ 15.56 $ 15.56 $ 15.56 0.000% 0.000% 0.000% 0.000% 10 $ 17.72 $ 17.69 $ 17.69 $ 17.69 -0.170% 0.000% 0.000% -0.170% 20 $ 19.88 $ 19.83 $ 19.82 $ 19.82· -0.250% -0.050% 0.000% -0.300% 30 $ 22.04 s 21.97 $ 21.97 $ 21.96 -0.320% 0.000% -0.050% -0.360% 50 $ 26.36 $ 26.23 $ 26.23 $ 26.23 -0.490% 0.000% 0.000% -0.490% 60 $ 28.54 $ 28.39 $ 28.38 $ 28.38 -0.530% -0.040% 0.000% -0.560% 80 $ 32.87 $ 32.66 $ 32.66 $ 32.65 -0.640% 0.000% -0.030% -0.670%
100 $ 37.18 $ 36.93 $ 36.92 $ 36.92 -0.670% -0.030% 0.000% -0.700% 120 $ 41.50 $ 41.19 $ 41.19 $ 41.18 -0.750% 0.000% -0.020% -0.770% 150 $ 47.99 $ 47.61 $ 47.59 $ 47.58 -0.790% -0.040% -0.020% -0-,850% 200 $ 58.82 $ 58.32 $ 58.30 $ 58.29 -0.850% -0.030% -0.020% -0.900% 210 $ 60.99 $ 60.45 $ 60.43 $ 60.42 -0.890% -0.030% -0.020% -0.930% 240 $ 67.46 $ 66.86 $ 66.84 $ 66.83 -0.890% -0.030% -0.010% -0.930% 250 $ 69.63 $ 6$.99 $ 68.97 $ 68.96 -0.920% -0.030% -0.010% -0.960% 300 $ 80.16 $ 79.68 $ 79.65 $ 79.64 -0.600% -0.040% -0.010% -0.650% 360 $ 92.80 s 92.50 $ 92.48 $ 92.45 -0.320% -0.020% -0.030% -0.380% 400 $ 101.24 $ 101.05 $ 101.02 $ 101.00 -0.190% -0.030% -0.020% -0.240% 450 $ 111.77 s 111.74 $ 111.69 $ 111.67 -0.030% -0.040% -0.020% -0.090% 500 $ 122.32 $ 122.43 $ 122.40 $ 122.37 0.090% -0.020% -0.020% 0.040% 750 $ 175.00 $ 175.87 $ 175.81 $ 175.76 0.500% -0.030% -0.030% 0.430% 780 $ 181.32 $ 182.28 $ 182.22 $ 182.18 0.530% -0.030% -0.020% 0.470%
1,000 $ 227.68 $ 229.29 $ 229.22 $ 229.16 0.710% -0.030% -0.030% 0.650% 1,500 $ 333.06 $ 336.18 $ 336.07 $ 335.98 0.940% -0.030% -0.030% 0.880% 3,000 5,000
10,000
$ 649.16 $ 1,070.65 $ 2,124.35
$ $ $
656.79 1,084.28 2,153.00
$ 656.57 $1,083.92 $ 2,152.28
$ 656.38 $ 1,083.61 $ 2,151.66
1.180% 1.270% 1.350%
-0.030% -0.030% -0.030%
-0.030% -0.030% -0.030%
1.110% 1.210% 1.290%
trl ;.< ::T'_.
20,000 $ 4,231.76 $ 4,290.44 $4,289.00 $ 4,287.76 1.390% -0.030% -0.030% 1.320% ~g: 30;000 40,000
$ 6,339.17 $ 8,446.57
$ $
6,427.88 8,565.32
$6,425.72 $ 8,562.44
$ 6,423.87 $ 8,559.97
1.400% 1.410%
-0.030% -0.030%
-0.030% -0.030%
1.340% 1.340% ~I-
OI~ ~t""" o >~~ -.....)'N0

CONSOLIDATED EDISON COMPANY OF NEW YORK. INC.
COMPARISON OF BILLS CALCULATED AT CURRENT RATES VS. PROPOSED FLAT RATES @ MAY 2009 RATE LEVEL
ELECTRIC S. C. NO. 01 TABLE NO. 02
RESIDENTIAL AND RELIGIOUS - RATE I - Combined SC 1&7 Flat Rates With Inverted Summer Rate - 3YR Sp Heat Phaseout SUMMER PERIOD
KWHR USE AT CURRENT Year 1 Year 2 Year 3 % Year 1 % Year 2 % Year 3 % Year 3 30 DAYS RATE RATE RATE RATE vs. Current vs. Year 1 vs. Year 2 vs. Current
0 $ 15.56 $ 15.56 $ 15.56 $ 15.56 0.000% 0.000% 0.000% 0.000% 10 $ 17.72 $ 17.69 $ 17.69 $ 17.69 -0.170% 0.000% 0.000% -0.170% 20 $ 19.88 $ 19.83 $ 19.82 $ 19.82 -0.250% -0.050% 0.000% -0.300% 30 $ 22.04 $ 21.97 $ 21.97 $ 21.96 -0.320% 0.000% -0.050% -0.360% 50 $ 26.36 $ 26.23 $ 26.23 $ 26.23 -0.490% 0.000% 0.000% -0.490% 60 $ 28.54 $ 28.39 $ 28.38 $ 28.38 -0.530% -0.040% 0.000% -0.560% 80 $ 32.87 $ 32.66 $ 32.66 $ 32.65 -0.640% 0.000% -0.030% -0.670%
100 $ 37.18 $ 36.93 $ 36.92 $ 36.92 -0.670% -0.030% 0.000% -0.700% 120 $ 41.50 $ 41.19 $ 41.19 $ 41.18 -0.750% 0.000% -0.020% -0.770% 150 $ 47.99 $ 47.61 $ 47.59 $ 47.58 -0.790% -0.040% -0.020% -0.850% 200 $ 58.82 $ 58.32 $ 58.30 $ 58.29 -0.850% -0.030% -0.020% -0.900% 210 $ 60.99 $ 60.45 $ 60.43 $ 60.42 -0.890% -0.030% -0.020% -0.930% 240 $ 67.46 $ 66.86 $ 66.84 $ 66.83 -0.890% -0.030% -0.010% -0.930% 250 $ 69.63 $ 68.99 $ 68.97 $ 68.96 -0.920% -0.030% -0.010% -0.960% 300 $ 80.87 $ 80.34 $ 80.32 $ 80.31 -0.660% -0.020% -0.010% -0.690% 360 $ 94.37 $ 93.96 $ 93.95 $ 93.94 -0.430% -0.010% -0.010% -0.460% 400 $ 103.36 $. 103.04 $ 103.04 $ 103.03 -0.310% 0.000% -0.010% -0.320% 450 $ 114.60 $ 114.38 $ 114.38 $ 114.37 -0.190% 0.000% -0.010% -0.200% 500 $ 125.84 $ 125.74 $ 125.74 $ 125.73 -0.080% 0.000% -0.010% -0.090% 750 $ 182.07 $ 182.49 $ 182.50 $ 182.51 0.230% 0.010% 0.010% 0.240% 780 $ 188.81 $ 189.29 $ 189.31 $ 189.33 0.250% 0.010% 0.010% 0.280%
1,000 $ 238.28 $ 239.23 $ 239.26 $ 239.27 0.400% 0.010% 0.000% 0.420% 1,500 $ 350.73 $ 352.74 $ 352.80 $ 352.83 0.570% 0.020% 0.010% 0.600% 3,000 $ 688.05 $ 693.22 $ 693.37 $ 693.46 0.750% 0.020% 0.010% 0.790% 5,000 $ 1,137.83 $ 1,147.21 $1,147.49 $ 1,147.66 0.820% 0.020% 0.010% 0.860% tti
10,000 20,000
$ 2,262.25 $ 4,511.08
$ $
2,282.17 4,552.09
$ 2,282.76 $4,553.29
$ 2,283.14 $4,554.09
0.880% 0.910%
0.030% 0.030%
0.020% 0.020%
0.920% 0.950%
:>< ~_.
30,000 $ 6,759.92 $ 6,822.02 $6,823.84 $6,825.04 0.920% 0.030% 0.020% 0.960% ~g: 40,000 $ 9,008.75 $ 9,091.94 $ 9,094.38 $ 9,095.99 0.920% 0.030% 0.020% 0.970% ~(
.O\? Vl;l> a,.~ ......:I'N0

CONSOLIDATED EDISON COMPANY OF NEW YORK. INC.
COMPARISON OF BILLS CALCULATED AT CURRENT RATESVS. PROPOSED FLAT RATES@MAY2009 RATE LEVEL
ELECTRIC S. C. NO. 07 TABLE NO. 35
RES AND REL - SPACE or SPACE & WATER HT-RATE I-Combined SC 1&7 Flat Rates With Inverted Summer Rate - 3YR Sp Ht Phaseout VIIINTER PERIOD
KWHRUSE AT CURRENT Year 1 Year 2 Year 3 % Year 1 % Year 2 % Year 3 % Year 3 30 DAYS RATE RATE RATE RATE vs. Current vs. Year 1 vs. Year 2 vs. Current
0 $ 15.56 $ 15.56 $ 15.56 $ 15.56 0.000% 0.000% 0.000% 0.000% 10 $ 17.71 $ 17.68 $ 17.68 $ 17.68 -0.170% 0.000% 0.000% -0.170%
100 $ 37.13 $ 36.88 $ 36.87 $ 36.87 -0.670% -0.030% 0.000% -0.700% 120 $ 41.44 $ 41.13 $ 41.13 $ 41.12 -0.750% 0.000% -0.020% -0.770% 150 $ 47.91 $ 47.53 $ 47.51 $ 47.50 -0.790% -0.040% -0.020% -0.860% 200 $ 58.70 $ 58.20 $ 58.18 $ 58.17 -0.850% -0.030% -0.020% -0.900% 210 $ 60.87 $ 60.33 $ 60.31 $ 60.30 -0.890% -0.030% -0.020% -0.940% 240 $ 67.32 $ 66.72 $ 66.70 $ 66.69 -0.890% -0.030% -0.010% -0.940% 250 $ 69.48 $ 68.84 $ 68.82 $ 68.81 -0.920% -0.030% -0.010% -0.960% 300 $ 80.00 $ 79.52 $ 79.49 $ 79.48 -0.600% -0.040% -0.010% -0.650% 360 $ 92.60 $ 92.30 $ 92.28 $ 92.25 -0.320% -0.020% -0.030% -0.380% 400 $ 100.37 $ 100.33 $ 100.54 $ 100.77 -0.040% 0.210% 0.230% 0.400% 450 $ 110.10 $ 110.37 $ 110.90 $ 111.43 0.250% 0.480% 0.480% 1.210% 500 $ 119.81 $ 120.42 $ 121.24 $ 122.09 0.510% 0.680% 0.700% 1.900% 750 $ 168.40 $ 170.61 $ 172.97 $ 175.33 1.310% 1.380% 1.360% 4.120% 780 $ 174.24 $ 176.64 $ 179.19 $ 181.74 1.380% 1.440% 1.420% 4.300%
1.000 $ 216.99 $ 220.80 $ 224.69 $ 228.59 1.760% 1.760% 1.740% 5.350% 1,500 $ 314.19 $ 321.22 $ 328.17 $ 335.13 2.240% 2.160% 2.120% 6.660% 2,500 $ 508.57 $ 522.04 $ 535.10 $ 548.18 2.650% 2.500% 2.440% 7.790% .3.000 $ 605.74 $ 622.42 $ 638.55 $ 654.68 2.750% 2.590% 2.530% 8.080% 5,000 $ 994.50 $ 1,024.03 $ 1,052.40 $ 1,080.78 2.970% 2.770% 2.700% 8.680%
10,000 $ 1,966.38 $ 2,028.05 $ 2,087.02 $ 2,146.00 3.140% 2.910% 2.830% 9.130% 20,000 $ 3,910.14 $ 4,036.10 $ 4,156.27 $ 4,276.45 3.220% 2.980% 2.890% 9.370% 30,000 $ 5,853.89 $ 6,044.14 $ 6,225.51 $ 6,406.89 3.250% . 3.000% 2.910% 9.450% 40,000 50.000
$ 7,797.65 $ 9,741.40
$ $
8,052.18 10,060.23
$ $
8,294.75 10,364.00
$ $
8,537.34 10,667.79
3.260% 3.270%
3.010% 3.020%
2.920% 2.930%
9.490% 9.510%
m ;l< t:r'_.
60,000 70,000
100,000
$ 11,685.16 $ 13,628.92 $ 19,460.19
$ $ $
12,068.27 14,076.32 20,100.44
$ $ $
12,433.25 14,502.50 20,710.23
$ $ $
12,798.24 14,928.68 21,320.02
3.280% 3.280% 3.290%
3.020% 3.030% 3.030%
2.940% 2.940% 2.940%
9.530% 9.540% 9.560%
"'Os: ~I-
120,000 $ 23,347.70 $ 24,116.54 $ 24,848.72 $ 25,580.92 3.290% 3.040% 2.950% 9.570% O'I~ 0'It""' o »......,:;;0 .....:I' N~

CONSOLIDATED EDISON COMPANY OF NEW YORK. INC.
COMPARISON OF BILLS CALCULATED AT CURRENT RATES VS. PROPOSED FLAT RATES @ MAY 2009 RATE LEVEL
ELECTRIC S. C. NO. 07 TABLE NO. 36
RES AND REL - SPACE or SPACE & WATER HT-RATE I-Combined SC 1&7 Flat Rates With Inverted Summer Rate - 3YR Sp Ht Phaseout SUMMER PERIOD
KWHRUSE AT CURRENT Year 1 Year 2 Year 3 % Year 1 % Year 2 % Year 3 % Year 3 30 DAYS RATE RATE RATE RATE vs. Current vs. Year 1 vs. Year 2 vs. Current
0 $ 15.56 $ 15.56 $ 15.56 $ 15.56 0.00% 0.00% 0.00% 0.00% 10 $ 17.71 $ 17.68 $ 17.68 $ 17.68 -0.17% 0.00% 0.00% -0.17% ...
100 $ 37.13 $ 36.88 $ 36.87 $ 36.87 -0.67% -0.03% 0.00% -0.70% 120 $ 41.44 $ 41.13 $ 41.13 $ 41.12 -0.75% 0.00% -0.02% -0.77% 150 $ 47.91 $ 47.53 $ 47.51 $ 47.50 -0.79% -0.04% -0.02% -0.86% 200 $ 58.70 $ 58.20 $ 58.18 $ 58.17 -0.85% -0.03% -0.02% -0.90% 210 $ 60.87 $ 60.33 $ 60.31 $ 60.30 -0.89% -0.03% -0.02% -0.94% 240 $ 67.32 $ 66.72 $ 66.70 $ 66.69 -0.89% -0.03% -0.01% -0.94% 250 $ 69.48 $ 68.84 $ 68.82 $ 68.81 -0.92% -0.03% -0.01% -0.96% 300 $ 80.71 $ 80.18 $ 80.16 $ 80.15 -0.66% -0.02% -0.01% -0.69% 360 $ 94.17 $ 93.76 $ .93.75 $ 93.74 -0.44% -0.01% -0.01% -0.46% 400 $ 103.13 $ 102.81 $ 102.81 $ 102.80 -0.31% 0.00% -0.01% -0.32% 450 $ 114.36 $ 114.14 $ 114.14 $ 114.13 -0.19% 0.00% -0.01% -0.20% 500 $ 125.56 $ 125.46 $ 125.46 $ 125.45 -0.08% 0.00% -0.01% -0.09% 750 $ 181.64 $ 182.06 $ 182.07 $ 182.08 0.23% 0.01% 0.01% 0.24% 780 $ 188.37 $ 188.85 $ 188.87 $ 188.89 0.25% 0.01% 0.01% 0.28%
1,000 $ 237.71 $ 238.66 $ 238.69 $ 238.70 0.40% 0.01% 0.00% 0.42% 1,500 $ 349.88 $ 351.89 $ 351.95 $ 351.98 0.57% 0.02% 0.01% 0.60% 2,500 $ 574.21 $ 578.32 $ 578.44 $ 578.52 0.72% 0.02% 0.01% 0.75% 3,000 $ 686.35 $ 691.52 $ 691.67 $ 691.76 0.75% 0.02% 0.01% 0.79% 5,000 $ 1,135.00 $ 1,144.38 $ 1,144.66 $ 1,144.83 0.83% 0.02% 0.01% 0.87%
10,000 $ 2,256.59 $ 2,276.51 $ 2,277.10 $ 2,277.48 0.88% 0.03% 0.02% 0.93% 20,000 $ 4,499.77 $ 4,540.78 $ 4,541.98 $ 4,542.78 0.91% 0.03% 0.02% 0.96% 30,000 40,000 50,000
$ 6,742.94 $ 8,986.12 $ 11,229.31
$ $ $
6,805.04 9,069.31
11,333.58
$ $ $
6,806.86 9,071.75
11,336.63
$ $ $
6,808.06 9,073.36
11,338.66
0.92% 0.93% 0.93%
0.03% 0.03% 0.03%
0.02% 0.02% 0.02%
0.97% 0.97% 0.97%
m ><::r_.
60,000 70,000
100,000
$ 13,472.49 $ 15,715.67 $ 22,445.21
$ $ $
13,597.84 15,862.11 22,654.91
$ $ $
13,601.52 15,866.40 22,661~05
$ $ $
13,603.95 15,869.25 22,665.13
0.93% 0.93% 0.93%
0.03% 0.03% 0.03%
0.02% 0.02% 0.02%
0.98% 0.98% 0.98%
""C8: ~I-
120,000 $ 26,931.57 $ 27,183.45 $ 27,190.82 $ 27,195.73 0.94% 0.03% 0.02% 0.98% 0'1 ,..-...-.....It"'" o >>-I-)IC -.....l'N0

Exhibit_ (LAR-1) Page 68 of72
Alternate Rate Design 2*
Assumes: (1) Same Flat Rates for All Winter Usage Blocks and for the First 250 kWh in Summer; (2) Inclining Block Rate for Summer Block over 250 kWh; and (3) Four Year Phase-out of Space Heating Discount for SC 7
SC 1
Rates Effective 5/1/09 Current Year 1 Year 2 Year 3 Year 4
Customer Charge $ 14.18 $ 14.18 $ 14.18 $ 14.18 $ 14.18
Winter Rate Per kWh 0-250 $ 0.06674 $ 0.06430 $ 0.06425 $ 0.06420 $ 0.06415 >250 $ 0.06136 $ 0.06430 $ 0.06425 $ 0.06420 $ 0.06415
Summer Rate Per kWh 0-250 $ 0.06674 $ 0.06430 $ 0.06425 $ 0.06420 $ 0.06415 >250 $ 0.07511 $ 0.07713 $ 0.07717 $ 0.07721 $ 0.07726
Current Year 1
SC 7
Year 2 Year 3 Year 4
Customer Charge $ 14.18 $ 14.18 $ 14.18 $ 14.18 $ 14.18
Winter Rate Per kWh 0-250 250-360 >360 Space Heating
$ 0.06674 $ 0.06136 $ 0.04600
$ 0.06430 $ 0.06430 $ 0.05076
$ 0.06425 $ 0.06425 $ 0.05523
$ 0.06420 $ 0.06420 $ 0.05969
$ 0.06415 $ 0.06415 $ 0.06415
Summer Rate Per kWh 0-250 >250
$ 0.06674 $ 0.07511
$ 0.06430 $ 0.07713
$ 0.06425 $ 0.07717
$ 0.06420 $ 0.07721
$ 0.06415 $ 0.07726
*Based on Combined SC 1&7 revenue requirement

CONSOLIDATED EDISON COMPANY OF NEW YORK, INC.
COMPARISON OF BILLS CALCULATED AT CURRENT RATES VS. PROPOSED FLAT RATES @ MAY2009 RATE LEVEL
ELECTRIC S. C. NO. 01 TABLE NO. 01
RESIDENTIAL AND RELIGIOUS - RATE 1- Combined SC 1&7 Flat Rates With Inverted Summer Rate - 4YR Sp Heat Phaseout WINTER PERIOD
KWHRUSE· AT CURRENT Year 1 Year 2 Year 3 Year 4 % Year 1 % Year 2 % Year 3 % Year 4 % Year 4 30 DAYS RATE RATE RATE RATE RATE vs. Current vs. Year 1 vs. Year 2 vs. Year 3 vs. Current
0 $ 15.56 $ 15.56 $ 15.56 $ 15.56 $ 15.56 0.000% 0.000% 0.000% 0.000% 0.000% 10 $ 17.72 $ 17.69 $ 17.69 $ 17.69 $ 17.69 -0.170% 0.000% 0.000% 0.000% -0.170% 20 $ 19.88 $ 19.83 $ 19.83 $ 19.82 $ 19.82 -0.250% 0.000% -0.050% 0.000% -0:300% 30 $ 22.04 $ 21.97 $ 21.97 $ 21.97 $ 21.96 -0.320% 0.000% 0.000% -0.050% -0.360% 50 $ 26.36 $ 26.24 $ 26.23 $ 26.23 $ 26.23 -0.460% -0.040% 0.000% 0.000% -0.490% 60 $ 28.54 $ 28.39 $ 28.39 $ 28.38 $ 28.38 -0.530% 0.000% -0.040% 0.000% -0.560% 80 $ 32.87 $ 32.66 $ 32.66 $ 32.66 $ 32.65 -0.640% 0.000% 0.000% -0.030% -0.670%
100 $ 37.18 $ 36.93 $ 36.93 $ 36.92 $ 36.92 -0.670% 0.000% -0.030% 0.000% -0.700% 120 $ 41.50 $ 41.20 $ 41.19 $ 41.18 $ 41.18 -0.720% -0.020% -0.020% 0.000% -0.770% 150 $ 47.99$ 47.62 $ 47.61 $ 47.59 $ 47.58 -0.770% -0.020% -0.040% -0.020% -0.850% 200 $ 58.82 $ 58.32 $ 58.31 $ 58.30 $ 58.29 -0.850% -0.020% -0.020% -0.020% -0.900% 210 $ 60.99 $ 60.45 $ 60.44 $ 60.43 $ 60.42 -0.890% -0.020% -0.020% -0.020% -0.930% 240 $ 67.46 $ 66.86 $ 66.85 $ 66.84 $ 66.83 -0.890% -0.010% -0.010% -0.010% -0.930% 250 $ 69.63 $ 69.00 $ 68.98 $ 68.97 $ 68.96 -0.900% -0.030% -0.010% -0.010% -0.960% 300 $ 80.16 $ 79.69 $ 79.68 $ 79.65 $ 79.64 -0.590% . -0.010% -0.040% -0.010% -0.650% 360 $ 92.80 $ 92.51 $ 92.49 $ 92.47 $ 92.45 -0.310% -0.020% -0.020% -0.020% -0.380% 400 $ 101.24 $ 101.06 $ 101.04 $ 101.02 $ 101.00 -0.180% -0.020% -0.020% -0.020% -0.240% 450 $ 111.77 $ 111.75 $ 111.71 $ 111.69 $ 111.67 -0.020% -0.040% -0.020% -0.020% -0.090% 500 $ 122.32 $ 122.44 $ 122.42 $ 122.39 $ 122.37 0.100% -0.020% -0.020% -0.020% 0.040% 750 $ 175.00 $ 175.89 $ 175.84 $ 175.80 $ 175.76 0.510% -0.030% -0.020% -0.020% 0.430% 780 $ 181.32 $ 182.29 $ 182.26 $ 182.22 $ 182.18 0.530% -0.020% -0.020% -0.020% 0.470%
1,000 $ 227.68 $ 229.31 $ 229.26 $ 229.21 $ 229.16 0.720% -0.020% -0.020% -0.020% 0.650% 1,500 $ 333.06 $ 336.21 $ 336.13 $ 336.05 $ 335.98 0.950% -0.020% -0.020% -0.020% 0.880% 3,000 $ 649.16 $ 656.85 $ 656.69 $ 656.54 $ 656.38 1.180% -0.020% -0.020% -0.020% 1:110% 5,000
10,000 $ 1,070.65 $ 2,124.35
$ $
1,084.38 2,153.21
$1,084.12 $ 2,152.69
$1,083.87 $ 2,152.18
$1,083.61 $ 2,151.66
1.280% 1.360%
-0.020% -0.020%
-0.020% -0.020%
-0.020% -0.020%
1.210% 1.290% ~
::r_. 20,000 30,000 40,000
$ 4,231.76 $ 6,339.17 $ 8,446.57
$ $ $
4,290.85 6,428.50 8,566.14
$ 4,289.82 $ 6,426.96 $ 8,564.08
$4,288.79 $ 6,425.41 $ 8,562.03
$4,287.76 $6,423.87 $ 8,559.97
1.400% 1.410% 1.420%
-0.020% -0.020% -0.020%
-0.020% -0.020% -0.020%
-0.020% -0.020% -0.020%
1.320% 1.340% 1.340%
'"Csr. ~I~ 0\'--"'-Or ~~ -....I' N~

CONSOLIDATED EDISON COMPANY OF NEW YORK, INC,
COMPARISON OF BILLSCALCULATED AT CURRENT RATES VS, PROPOSED FLAT RATES @ MAY2009 RATE LEVEL
ELECTRIC S. C. NO. 01, TABLE NO. 02
RESIDENTIAL AND RELIGIOUS -RATE I- Combined SC 1&7 Flat Rates With Inverted Summer Rate -4YR Sp Heat Phaseout SUMMER PERIOD
KWHRUSE AT CURRENT Year 1 Year 2 Year 3 Year 4 % Year 1 % Year 2 % Year 3 % Year 4 % Year 4 30 DAYS RATE RATE RATE RATE RATE vs. Current vs. Year 1 vs. Year 2 vs. Year 3 vs. Current
0 $ 15.56 $ 15.56 $ 15.56 $ 15.56 $ 15.56 0.000% 0.000% 0.000% 0.000% 0.000% 10 $ 17.72 $ 17,69 $ 17.69 $ 17.69 $ 17.69 -0.170% 0.000% 0.000% 0.000% -0,170% 20 $ 19.88 $ 19.83 $ 19.83 $ 19.82 $ 19.82 -0.250% 0.000% -0.050% 0.000% -0,300% 30 $ 22.04 $ 21.97 $ 21.97 $ 21,97 $ 21,96 -0.320% 0.000% 0.000% -0.050% -0.360% 50 $ 26.36 $ 26.24 $ 26.23 $ 26.23 $ 26.23 -0.460% -0.040% 0.000% 0.000% -0.490% 60 $ 28.54 $ 28.39 $ 28.39 $ 28,38 $ 28.38 -0.530% 0.000% -0.040% 0.000% -0.560% 80 $ 32.87 $ 32.66 $ 32.66 $ 32.66 $ 32.65 -0.640% 0.000% 0.000% -0.030% -0.670%
100 $ 37,18 $ 36.93 $ 36.93 $ 36.92 $ 36.92 -0.670% 0.000% -0.030% 0.000% -0.700% 120 $ 41.50 $ 41.20 $ 41.19 $ 41.18 $ 41.18 -0.720% -0.020% -0.020% 0.000% -0.770% 150 $ 47.99 $ 47,62 $ 47.61 $ 47.59 $ 47.58 -0.770% -0.020% -0.040% -0.020% -0.850% 200 $ 58.82 $ 58.,32 $ 58.31 $ 58.30 $ 58.29 -0.850% -0.020% -0.020% -0.020% -0.900% 210 $ 60.99 $ 60.45 $ 60.44 $ 60.43 $ 60.42 -0,890% -0.020% -0.020% -0.020% -0.930% 240 $ 67.46 $ 66,86 $ 66.85 $ 66.84 $ 66.83 -0.890% -0.010% -0.010% -0.010% -0.930% 250 $ 69,63 $ 69,00 $ 68.98 $ 68.97 $ 68.96 -0.900% -0.030% -0.010% -0,010% -0.960% 300 $ 80.87 $ 80,34 $ 80.33 $ 80.32 $ 80.31 -0.660% -0.010% -0.010% -0.010% -0.690% 360 $ 94.37 $ 93.96 $ 93.95 $ 93.94 $ 93.94 -0.430% -0.010% -0.010% 0.000% -0.460% 400 $ 103.36 $ 103.04 $ 103,04 $ 103.03 $ 103.03 -0.310% 0.000% -0.010% 0.000% -0.320% 450 $ 114.60 $ 114.38 $ 114,38 $ 114.37 $ 114.37 -0,190% 0,000% -0.010% 0.000% -0.200% 500 $ 125.84 $ 125.74 $ 125.74 $ 125,73 $ 125.73 -0.080% 0.000% -0.010% 0.000% -0.090% 750 $ 182,07 $ 182.48 $ 182.49 $ 182.50 $ 182.51 0.230% 0.010% 0.010% 0,010% 0.240% 780 $ 188.81 $ 189.28 $ 189.29 $ 189.30 $ 189.33 0.250% 0.010% 0.010% 0.020% 0.280%
1,000 $ 238.28 $ 239.21 $ 239.23 $ 239.25 $ 239.27 0.390% 0.010% 0.010% 0.010% 0.420% 1,500 $ 350,73 $ 352.70 $ 352.75 $ 352.78 $ 352.83 0.560% 0.010% 0.010% 0.010% 0.600% 3,000 $ 688.05 $ 693.14 $ 693.24 $ 693.34 $ 693.46 0,740% 0.010% 0.010% 0.020% 0.790% 5.000 $ 1,137.83 $ 1,147.06 $1,147.25 $1,147.43 $ 1,147.66 0.810% 0.020% 0.020% 0.020% 0.860% m
10,000 20,000 30,000 40,000
$ 2,262.25 $ 4,511.08 $ 6,759.92 $ 9,008.75
$ $ $ $
2,281.87 4,551.48 6,821.10 9,090,71
$ 2,282.26 $ 4,552,29 $ 6,822.32 $ 9,092,34
$ 2,282.66 $ 4,553.09 $ 6,823.53 $ 9,093.96
$ 2,283.14 $4,554.09 $6,825.04 $ 9,095.99
0,870% 0.900% 0.910% 0.910%
0.020% 0.020% 0.020% 0.020%
0.020% 0.020% 0.020% 0.020%
0.020% 0.020% 0.020% 0.020%
0.920% 0.950% 0.960% 0.970%
~ ::r.....
""Csr. ~I'-+ --...J----Ot""' o > ..... ::0 --...J'N0

COMPARISON OF BILLS CALCULATED AT CURRENT RATES VS. PROPOSED FLAT RATES @ MAY2009 RATE LEVEL
ELECTRIC S. .C. NO. 07 TABLE NO. 35
RES AND REL - SPACE or SPACE and WATER HEATING· RATE 1- Combined SC 1&7 Flat Rates With Inverted Summer Rate - 4YR Sp Heat Phaseout WINTER PERIOD
KWHRUSE AT CURRENT Year 1 Year 2 Year 3 Year 4 % Year 1 % Year 2 % Year 3 % Year 4 % Year 4 30 DAYS RATE RATE RATE RATE RATE vs. Current vs. Year 1 vs. Year 2 vs, Year 3 vs. Current
0 $ 15.56 $ 15.56 $ 15.56 $ 15.56 $ 15.56 0.000% 0.000% 0.000% 0.000% 0.000% 10 $ 17.71 $ 17.68 $ 17.68 $ 17.68 $ 17.68 -0.170% 0.000% 0.000% 0.000% -0.170%
100 $ 37.13 $ 36.88 $ 36.88 $ 36.87 $ 36.87 -0.670% 0.000% -0.030% o.oooss -0.700% 120 $ 41.44 $ 41.14 $ 41.13 $ 41.12 $ 41.12 -0.720% -0.020% -0.020% 0.000% -0.770% 150 $ 47.91 $ 47.54 $ 47.53 $ 47.51 $ 47.50 -0.770% -0.020% -0.040% -0.020% -0.860% 200 $ 58.70 $ 58.20 $ 58.19 $ 58.18 $ 58.17 -0.850% -0.020% -0.020% -0.020% -0.900% 210 $ 60.87 $ 60.33 $ 60.32 $ 60.31 $ 60.30 -0.890% -0.020% -0.020% -0.020% -0.940% 240 $ 67.32 $ 66.72 $ 66.71 $ 66.70 $ 66.69 -0.890% -0.010% -0.010% -0.010% -0.940% 250 $ 69.48 $ 68.85 $ 68.83 $ 68.82 $ 68.81 -0.910% -0.030% -0.010% -0.010% -0.960% 300 $ 80.00 $ 79.53 $ 79.52 $ 79.49 $ 79.48 -0.590% -0.010% -0.040% -0.010% -0.650% 360 $ 92.60 $ 92.31 $ 92.29 $ 92.27 $ 92.25 -0.310% -0.020% -0.020% -0.020% -0.380% 400 $ 100.37 $ 100.28 $ 100.44 $ 100.61 $ 100.77 -0.090% 0.160% 0.170% 0.160% 0.400% 450 $ 110.10 $ 110.25 $ 110.64 $ 111.03 $ 111.43 0.140% 0.350% 0.350% 0.360% 1.210% 500 $ 119.81 $ 120.20 $ 120.83 $ 121.46 $ 122.09 0.330% 0.520% 0.520% 0.520% 1.900% 750 $ 168.40 $ 170.01 $ 171.79 $ 173.56 $ 175.33 0.960% 1.050% 1.030% 1.020% 4.120% 780 $ 174.24 $ 176.01 $ 177.92 $ 179.82 $ 181.74 1.020% 1.090% 1.070% 1.070% 4.300%
1,000 $ 216.99 $ 219.82 $ 222.76 $ 225.67 $ 228.59 1.300% 1.340% 1.310% 1.290% 5.350% 1,500 $ 314.19 $ 319.47 $ 324.70 $ 329.91 $ 335.13 1.680% 1.640% 1.600% 1.580% 6.660% 2,500 $ 508.57 $ 518.75 $ 528.58 $ 538.38 $ 548.18 2.000% 1.890% 1.850% 1.820% 7.790% 3,000 $ 605.74 $ 618.37 $ 630.50 $ 642.59 $ 654.68 2.090% 1.960% 1.920% 1.880% 8.080% 5,000 $ 994.50 $ 1,016.92 $ 1,038.25 $ 1,059.51 $ 1,080.78 2.250% 2.100% 2.050% 2.010% 8.680%
10,000 $ 1,966.38 $ 2,013.28 $ 2,057.60 $ 2,101.79 $ 2,146.00 2.390% 2.200% 2.150% 2.100% 9.130% 20,000 $ 3,910.14 $ 4,006.00 $ 4,096.29 $ 4,186.37 $ 4,276.45 2.450% 2.250% 2.200% 2.150% 9.370% 30,000 $ 5,853.89 $ 5,998.71 $ 6,134.98 $ 6,270.93 $ 6,406.89 2.470% 2.270% 2.220% 2.170% 9.450% 40,000 $ 7,797.65 $ 7,991.43 $ 8,173.68 $ 8,355.50 $ 8,537.34 2.490% 2.280% 2.220% 2.180% 9.490% 50,000 $ 9,741.40 $ 9,984.15 $10,212.38 $ 10,440.08 $10,667.79 2.490% 2.290% 2.230% 2.180% 9.510% 60,000 $ 11,685.16 $11,976.87 $12,251.07 $ 12,524.65 $ 12,798.24 2.500% 2.290% 2.230% 2.180% 9.530% tri 70.000
100,000 120,000
$ 13,628.92 $ 19,460.19 $ 23,347.70
$ 13,969.59 $19,947.74 $ 23,933.18
$14,289.77 $ 20,405.85 $ 24,483.25
$14,609.22 $ 20,862.93 $ 25,032.08
$14,928.68 $ 21,320.02 $ 25,580.92
2.500% 2.510% 2.510%
2.290% 2.300% 2.300%
2.240% 2.240% 2.240%
2.190% 2.190% 2.190%
9.540% 9.560% 9.570%
X ::T'_.
"'Os: ~( -.....)- _t"""' o ;> '""l~ -.....)'N-::::

CONSOLIDATED EDISON COMPANY OF NEW YORK. INC.
COMPARISON OF BILLS CALCULATED AT CURRENT RATES VS. PROPOSED FLAT RATES @ MAY 2009 RATE LEVEL
ELE.CTRIC S. C. NO. 07 TABLE NO. 36
RES AND REL - SPACE or SPACE and WATER HEATING - RATE 1- Combined SC 1&7 Flat Rates With Inverted Summer Rata- 4YR Sp Heat Phaseout SUMMER PERIOD
KWHRUSE AT CURRENT Year 1 Year 2 Year 3 Year 4 % Year 1 % Year 2 % Year 3 % Year 4 % Year 4 30 DAYS RATE RATE RATE RATE RATE vs. Current vs. Year 1 vs. Year 2 vs. Year 3 vs. Current
0 $ 15.56 $ 15.56 $ 15.56 $ 15.56 $ 15.56 0.00% 0.00% 0.00% 0.00% 0.00% 10 $ 17.71 $ 17.68 $ 17.68 $ 17.68 $ 17.68 -0.17% 0.00% 0.00% 0.00% -0.17%
100 $ 37.13 $ 36.88 $ 36.88 $ 36.87 $ 36.87 -0.67% 0.00% -0.03% 0.00% -0.70% 120 $ 41.44 $ 41.14 $ 41.13 $ 41.12' $ 41.12 -0.72% -0.02% -0.02% 0.00% -0.77% 150 $ 47.91 $ 47.54 $ 47.53 $ 47.51 $ 47.50 -0.77% -0.02% -0.04% -0.02% -0.86% 200 $ 58.70 $ 58.20 $ 58.19 $ 58.18 $ 58.17 -0.85% -0.02% -0.02% -0.02% -0.90% 210 $ 60.87 $ 60.33 $ 60.32 $ 60.31 $ 60.30 -0.89% -0.02% -0.02% -0.02% -0.94% 240 $ 67.32 $ 66.72 $ 66.71 $ 66.70 s 66.69 -0.89% -0.01% -0.01% -0.01% -0.94% 250 $ 69.48 $ 68.85 $ 68.83 $ 68.82 $ 68.81 -0.91% -0.03% -0.01% -0.01% -0.96% 300 $ 80.71 $ 80.18 $ 80.17 $ 80.16 $ 80.15 -0.66% -0.01% -0.01% -0.01% -0.69% 360 $ 94.17 $ 93.76 $ 93.75 $ 93.74 $ 93.74 -0.44% -0.01% -0.01% 0.00% -0.46% 400 $ 103.13 $ 102.81 $ 102.81 $ 102.80 $ 102.80 -0.31% 0.00% -0.01% 0.00% -0.32% 450 $ 114.36 $ 114.14 $ 114.14 $ 114.13 $ 114.13 -0.19% 0.00% -0.01% 0.00% -0.20% 500 $ 125.56 $ 125.46 $ 125.46 $ 125.45 $ 125.45 -0.08% 0.00% -0.01% 0.00% -0.09% 750 $ 181.64 $ 182.05 $ 182.06 $ 182.07 $ 182.08 0.23% 0.01% 0.01% 0.01% 0.24% 780 $ 188.37 $ 188.84 $ 188.85 $ 188.86 $ 188.89 0.25% 0.01% 0.01% 0.02% 0.28%
1,000 $ 237.71 $ 238.64 $ 238.66 $ 238.68 $ 238.70 0.39% 0.01% 0.01% 0.01% 0.42% 1,500 $ 349.88 $ 351.85 $ 351.90 $ 351.93 $ 351.98 0.56% 0.01% 0.01% 0.01% 0.60% 2,500 $ 574.21 $ 578.26 $ 578.34 $ 578.41 $ 578.52 0.71% 0.01% 0.01% 0.02% 0.75% 3,000 $ 686.35 $ 691.44 $ 691.54 $ 691.64 $ 691.76 0.74% 0.01% 0.01% 0.02% 0.79% 5,000 $ 1,135.00 $ 1,144.23 $ 1,144.42 $ 1,144.60 $ 1,144.83 0.81% 0.02% 0.02% 0.02% 0.87%
10,000 $ 2,256.59 $ 2,276.21 $ 2,276.60 $ 2,277.00 $ 2,277.48 0.87% 0.02% 0.02% 0.02% 0.93% 20,000 $ 4,499.77 $ 4,540.17 $ 4,540.98 $ 4,541.78 $ 4,542.78 0.90% 0.02% 0.02% 0.02% 0.96% 30,000 $ 6,742.94 $ 6,804.12 $ 6,805.34 $ 6,806.55 $ 6,808.06 0.91% 0.02% 0.02% 0.02% 0.97% 40,000 50,000 60,000 70,000
$ 8,986.12 $ 11,229.31 $ 13,472.49 $ 15,715.67
$ 9,068.08 $ 11,332.04 $13,596,00 $15,859,96
$ 9,069.71 $11,334,08 $ 13,598.45 $15,862.82
$ 9,071.33 $11,336,12 $ 13,600.90 $ 15,865.68
$ 9,073.36 $ 11,338.66 $13,603.95 $ 15,869,25
0.91% 0.91% 0,92% 0.92%
0.02% 0.02% 0.02% 0,02%
0.02% 0,02% 0.02% 0.02%
0.02% 0,02% 0.02% 0.02%
0.97% 0.97% 0,98% 0.98%
tr:l ;X ~_.
""dg: 100,000 120,000
$ 22,445.21 $ 26,931.57
$ 22,651.83 $27,179.75
$22,655,93 $ 27, 184,67
$ 22,660.02 $ 27, 189,59
$ 22,665.13 $27,195.73
0.92% 0,92%
0.02% 0.02%
0.02% 0.02%
0,02% 0,02%
0.98% 0.98% ~(
.....:1"'-'"Nt:-' o >'""+'):;:0 .....:I'Ne