
BEFORE THE FEDERAL ENERGY REGULATORY COMMISSION …
39
1 UNITED STATES OF AMERICA BEFORE THE FEDERAL ENERGY REGULATORY COMMISSION Inquiry Regarding the Commission’s Policy ) For Determining Return on Equity ) Docket No. PL19-4-000 ) COMMENTS OF THE ENVIRONMENTAL DEFENSE FUND Pursuant to the March 28, 2019 Federal Register Notice establishing an Initial Comment due date of June 26, 2019, the Environmental Defense Fund (“EDF”) respectfully submits the following comments and affidavit of James J. Murchie, Co-Founder and CEO of Energy Income Partners LLC (“EIP”), in the above-captioned proceeding. The Federal Energy Regulatory Commission’s (“Commission” or “FERC”) March 21, 2019 Notice of Inquiry (“Notice of Inquiry”) 1 seeks information and stakeholder views to help the Commission explore whether, and if so how, it should modify its policies concerning the determination of the return on equity (“ROE”) to be used in designing jurisdictional rates charged by public utilities. The Commission also seeks comment on whether any changes to its policies concerning public utility ROEs should be applied to interstate natural gas and oil pipelines. As explained below, the interstate natural gas pipeline industry’s health, and the willingness of the capital markets to continue to invest, depends on evolving rates of return predicated on putting more steel into the ground to a commercial design that provides enhanced rates of return based on the value of delivery services. Allowing and incentivizing pipeline operators to profit from the market value of transportation services, while staying faithful to regulated rate of return principles, will foster efficient allocation of capital, clarify investment signals for capacity expansion, enhance utilization of 1 Inquiry Regarding the Commission’s Policy for Determining Return on Equity, Notice of Inquiry, 166 FERC ¶ 61,207 (2019) (“Notice of Inquiry”).
Transcript of BEFORE THE FEDERAL ENERGY REGULATORY COMMISSION …

1
UNITED STATES OF AMERICA BEFORE THE FEDERAL ENERGY REGULATORY COMMISSION
Inquiry Regarding the Commission’s Policy ) For Determining Return on Equity ) Docket No. PL19-4-000 )
COMMENTS OF THE ENVIRONMENTAL DEFENSE FUND
Pursuant to the March 28, 2019 Federal Register Notice establishing an Initial Comment
due date of June 26, 2019, the Environmental Defense Fund (“EDF”) respectfully submits the
following comments and affidavit of James J. Murchie, Co-Founder and CEO of Energy Income
Partners LLC (“EIP”), in the above-captioned proceeding. The Federal Energy Regulatory
Commission’s (“Commission” or “FERC”) March 21, 2019 Notice of Inquiry (“Notice of
Inquiry”)1 seeks information and stakeholder views to help the Commission explore whether,
and if so how, it should modify its policies concerning the determination of the return on equity
(“ROE”) to be used in designing jurisdictional rates charged by public utilities. The Commission
also seeks comment on whether any changes to its policies concerning public utility ROEs
should be applied to interstate natural gas and oil pipelines. As explained below, the interstate
natural gas pipeline industry’s health, and the willingness of the capital markets to continue to
invest, depends on evolving rates of return predicated on putting more steel into the ground to a
commercial design that provides enhanced rates of return based on the value of delivery services.
Allowing and incentivizing pipeline operators to profit from the market value of transportation
services, while staying faithful to regulated rate of return principles, will foster efficient
allocation of capital, clarify investment signals for capacity expansion, enhance utilization of
1 Inquiry Regarding the Commission’s Policy for Determining Return on Equity, Notice of
Inquiry, 166 FERC ¶ 61,207 (2019) (“Notice of Inquiry”).

2
existing infrastructure, and align the market design with a more renewable, lower carbon energy
system. As the energy system continues to transform, the Commission can and should use its
longstanding tools for incentivizing beneficial market behaviors in pursuit of its cornerstone cost
causation and allocative efficiency precepts.
I. INTERESTS OF EDF
EDF is a membership organization, with over 2 million members, whose mission is to
preserve the natural systems on which all life depends. Guided by science and economics, EDF
seeks practical solutions to resolve environmental problems. EDF uses the power of markets to
speed the transition to clean energy resources, and consistent with its organizational purpose is
engaged in activities to facilitate cost-effective and efficient energy market designs that
encourage investment to modernize the energy grid so that it can support the ongoing
deployment of renewable energy resources and energy efficiency. Fundamentally, EDF asserts
that well designed markets, which stimulate competition and reward innovation, advance the
public interest and foster environmental improvement. EDF works collaboratively with market
participants sharing these goals and is a member of the North American Energy Standards Board
and the New England Power Pool.
Before this Commission, EDF has long advocated that competitive market outcomes,
structured and optimized within the rubric of fair market competition, will safeguard energy
customers, channel economic energy infrastructure investment and facilitate beneficial
environmental outcomes.2 EDF has also presented extensive analyses to the Commission to
2 See, e.g., Technical Conference on Environmental Regulations and Electric Reliability,
Wholesale Electricity Markets, and Energy Infrastructure, Prepared Statement of Environmental Defense Fund – N. Jonathan Peress, Docket No. AD15-4 at 2 (March 11, 2015) (“When markets provide clear and efficient price signals, participants are able to make investment decisions to determine the most cost-effective means to maintain reliability.”).

3
support its suggested market reforms—all of which have been aimed to increase efficiency and
competition and provide customer benefit.3
II. COMMENTS
The Commission acknowledges the “potentially significant and widespread effect of [its]
ROE policies upon public utilities,” which extends beyond the particular interests of the parties
to the Emera Maine proceeding.4 In the post-Emera Maine proceedings, the Commission
proposed to change its approach to determining base ROE by giving equal weight to four
financial models—the Discounted Cash Flow (“DCF”) model, the Capital Asset Pricing Model,
the Expected Earnings model, and the Risk Premium model—instead of primarily relying on the
DCF methodology.5 The Commission found that “relying on multiple financial models makes it
more likely that the Commission’s decision will accurately reflect how investors make their
investment decisions.”6
3 See, e.g., Grid Resilience in Regional Transmission Organizations and Independent System
Operators, Reply Comments of the Environmental Defense Fund, Docket No. AD18-7 (May 9, 2018) (demonstrating that grid resilience can be enhanced by establishing a standardized means to transact for and reflect the value of non-ratable pipeline flows in the electric market).
4 Notice of Inquiry at P 3. In the Emera Maine decision, the U.S. Court of Appeals for the District of Columbia Circuit reversed and vacated Opinion No. 531. Emera Maine v. FERC, 854 F.3d 9 (D.C. Cir. 2017). Following the Emera Maine decision, the Commission issued two orders proposing a methodology for addressing the issues that were remanded to the Commission. Martha Coakley v. Bangor Hydro-Elec. Co., 165 FERC ¶ 61,030 (2018); Ass’n of Businesses Advocating Tariff Equity v. Midcontinent Indep. Sys. Operator, Inc., 165 FERC ¶ 61,118 (2018).
5 Martha Coakley v. Bangor Hydro-Elec. Co., 165 FERC ¶ 61,030 at P 34 (2018); Ass’n of Businesses Advocating Tariff Equity v. Midcontinent Indep. Sys. Operator, Inc., 165 FERC ¶ 61,118 at P 36 (2018).
6 Notice of Inquiry at P 24 (citing 165 FERC ¶ 61,030 at P 34 and 165 FERC ¶ 61,118 at P 36) (emphasis added).

4
In Attachment A to its Comments, EDF submits the Affidavit of James J. Murchie, Co-
Founder and CEO of EIP, a Registered Investment Adviser that oversees about $6 billion of
client assets.7 As an experienced and credible representative of the capital markets, this affidavit
will assist the Commission in this proceeding by further detailing “how investors make their
investment decisions.” EIP’s long-term approach to valuation provides a unique perspective—
and most notably—dispels the notion that investment success and consumer and environmental
interests are somehow incompatible.8 The Commission has an opportunity in this proceeding to
update its ROE policies in order to align the interests of the public, ratepayers, and investors by
allowing the ROE to vary in such a way as to provide incentives to perform better in terms of
cost, reliability, safety, and environmental impact.9 As EDF explains below, providing the
means for rewarding efficient and more capable utilization of regulatory assets will channel
capital to its highest and best uses, including investments that complement clean energy
deployment to achieve emissions reductions needed to safeguard climate. Using the framework
established in FERC’s 1996 Incentive Ratemaking Policy Statement,10 the Commission should
7 The affidavit expresses the views of James Murchie as an individual, and as a longstanding
investment advisor in capital markets focused on utility investment. Other than as expressed in his affidavit, the positions set forth in these comments are those of EDF and EDF alone.
8 Murchie Affidavit, Exhibit JJM-01 at pages 4-5 (“While we analyze financial statements and valuation like all other fund managers, our extreme focus on the quality of management is unusual among investment managers but consistent with our long-term approach… Companies that give short shrift to issues of worker safety, system reliability and environmental stewardship also tend to be poor allocators of capital, have higher operating costs and usually have poor relationships with regulators and other stakeholders. They also tend to have lower shareholder returns.”).
9 Murchie Affidavit, ¶ 7. 10 Alternatives to Traditional Cost-of-Service Ratemaking for Natural Gas Pipelines (1996
Incentive Ratemaking Policy Statement), 74 FERC ¶ 61,076 (1996).

5
provide incentive rates of return to pipelines who provide greater system value through more
responsive gas transportation service deliveries.
A. The Commission Should Evaluate its Policies in Light of Contemporaneous and Evolving Market Conditions
The energy industry generally, and the natural gas market in particular,11 are in the midst
of a massive transformation. Due in part to the cost advantages created by abundant shale gas
supply,12 natural gas fired power plants are now the dominant source of electric power in the
U.S.13 Other drivers of change include the development of new technologies, evolving customer
expectations, and state policy goals advancing sustainability and directing greenhouse gas
emission reductions.14 Moreover, the pace of change could accelerate even further if other
11 Certification of New Interstate Natural Gas Facilities, Notice of Inquiry, 163 FERC ¶ 61,042
(2018) (acknowledging that the industry has seen unprecedented change, including: “(1) a revolution in natural gas production technology leading to dramatic increases in production; (2) new areas of major natural gas production; (3) flows on pipeline systems becoming bidirectional or reversing; (4) customers routinely entering into long-term precedent agreements for firm service during the formative stage of potential projects and the use of those precedent agreements as applicants’ principal evidence of the need for their projects; and (5) the increased use of natural gas as a fuel source for electric generation, resulting in a closer relationship between natural gas transportation and natural gas-fired electric generation”).
12 U.S. Energy Information Administration, International Energy Outlook 2017 at 56 (September 14, 2017) (“Shale resource development accounts for 50% of U.S. natural gas production in 2015, increasing to nearly 70% in 2040….”), https://www.eia.gov/outlooks/ieo/pdf/0484(2017).pdf.
13 Whereas electric generators were the smallest sector for natural gas demand in 1988, they now have become the largest. North American Electric Reliability Corporation, 2011 Special Reliability Assessment: A Primer of the Natural Gas and Electric Power Interdependency in the United States at 43 (December 2011), http://www.nerc.com/files/gas_electric_interdependencies_phase_i.pdf.
14 Proceeding on Motion of the Commission as to the Rates, Charges, Rules and Regulations of Consolidated Edison Company of New York, Inc. for Gas Service, Case No. 19-G-0066, Gas Policy Panel Testimony at pages 26-27 (January 31, 2019).

6
sectors of the economy turn to electrification as a means of decarbonization.15 It is appropriate
for the Commission to evaluate its policies in light of these contemporaneous and evolving
market conditions.
Against this backdrop of change, regulators are forced to consider how regulated
companies “make money in order to better manage this change, reward innovation, and provide
more value for customers’ money.”16 In order to link shareholder and societal value, regulatory
policies should create incentives for companies to innovate. Instead of relying on rate of return
as the sole value driver, regulators should allow companies to earn increased revenues when they
provide value-based products and services.17 There must also be a means to differentiate among
company performance:
Merely permitting all regulated companies as a matter of course to earn rates of return in excess of the cost of capital does not supply the answer; there has to be some means of seeing to it that those supernormal returns are earned, some means, for example, of identifying the companies that have been unusually enterprising or efficient and offering higher profits to them while denying them to others.18
This is particularly critical where system buildout is no longer a primary objective. As discussed
below, the extensive pipeline system buildout over the past five years is diminishing further
opportunities for pipeline capacity additions, and thus a focus on the value of gas delivery
15 Rich Glick and Matthew Christiansen, FERC and Climate Change, Energy Law Journal, Vol.
40:1 at page 11 (April 27, 2019). 16 Steve Kihm et al., You Get What You Pay For: Moving Toward Value in Utility
Compensation – Part 1 Revenue and Profit at page 2 (June 2015), https://americaspowerplan.com/wp-content/uploads/2016/07/CostValue-Part1-Revenue.pdf.
17 Id. 18 Alfred Kahn, The Economics of Regulation: Principles and Institutions, John Wiley & Sons
(1970).
7
services in a more renewable and dynamic energy system is critical to the health of the pipeline
industry.
B. Market Rules Should Reward Efficient and More Capable Use of Existing Regulatory Assets
Under the current regulatory framework, companies create investor value every time they
make capital investments.19 While traditional cost-of-service regulation provides a return
sufficient to finance and build essential infrastructure, it offers few incentives for higher levels of
reliability and safety and lower levels of cost and environmental impact demanded today.20 To
achieve emissions reductions needed to safeguard climate, it is necessary for the market design
to reward efficient and more capable use of regulatory assets rather than simply incentivizing
more steel in the ground.21
The unprecedented buildout of the natural gas pipeline network best demonstrates this
point. Since 1999, FERC has approved 400 pipeline applications for an additional 180 billion
cubic feet per day (“Bcfd”) of pipeline capacity.22 In 2017 alone, the Commission certificated 49
pipeline projects encompassing 30.8 Bcfd of capacity and 2,739 miles of pipelines.23 As a point
of comparison, average consumption of natural gas in the United States during January 2017 was
19 Steve Kihm et al., You Get What You Pay For: Moving Toward Value in Utility
Compensation – Part 1 Revenue and Profit at page 5 (June 2015). 20 Murchie Affidavit, ¶ 26. 21 Id., ¶ 7. 22 Sue Tierney, Analysis Group, Natural Gas Pipeline Certification – Policy Considerations for
a Changing Industry at 1, (November 6, 2017), http://www.analysisgroup.com/uploadedfiles/content/insights/publishing/ag_ferc_natural_gas_pipeline_certification.pdf.
23 FERC State of the Markets Report 2017 at 4 (April 2018), https://www.ferc.gov/market-oversight/reports-analyses/st-mkt-ovr/2017-som-A-3-full.pdf.

8
93.1 Bcfd, and peak consumption was 137 Bcfd during the 2014 Polar Vortex.24 While this
massive infrastructure expansion has largely relieved natural gas transportation constraints in
most areas,25 the question remains whether such infrastructure will be utilized efficiently.
The current natural gas market design fosters incompatibility between the wholesale gas
and electric sectors.26 In an increasingly dynamic system with more renewable penetration, the
needs of generators must be aligned with the services provided by pipelines.27 Whereas the gas
market design generally assumes uniform hourly flow for the average day, the flow used by
generators is far more shaped over the course of the day in order to match electrical output with
load:
24 Id. at 2. 25 FERC State of the Markets Report 2015 at 4 (March 17, 2016), https://www.ferc.gov/market-
oversight/reports-analyses/st-mkt-ovr/2015-som.pdf (“midstream investments over the past 10 years have largely relieved natural gas transportation constraints.”).
26 See, e.g., Algonquin Gas Transmission, LLC, Comments on ISO-NE Operational Fuel Security Analysis at 1, n.1 (February 15, 2018) (“To the extent the region needs or desires capacity dedicated to supporting the electric market, there has to be a paradigm change in terms of how that pipeline capacity for the electric market is funded.”).
27 As suggested by PJM Interconnection L.L.C., FERC should “encourage the development of additional pipeline services tailored to the flexibility needs of natural gas-fired generation so as to encourage appropriate tailoring and pricing of services beyond today’s traditional firm/interruptible paradigm.” Comments and Responses of PJM Interconnection, L.L.C., Docket No. AD18-7 at 7 (March 9, 2018).

9
Because there is no transparent market information to establish the value of the responsive
shaped flow service28 upon which natural gas-fired power plants rely, generators are challenged
to express the marginal cost of such a service in their hourly offers. The resulting diminished
price signals likewise fail to inform pipelines and other market participants what investments
(and/or market innovations29) are economically justified to serve power generation or otherwise
meet the ultimate load required to be served. Pricing regimes that optimize hourly energy supply
offers with the sub-day cost of flexible (including seasonally-varying) natural gas fuel supply are
therefore necessary. As recently observed in a report commissioned by the INGAA Foundation,
28 Shaped flow involves the explicit request for and confirmation of differing hourly quantities
of gas across a gas day (i.e., a shape). 29 Market innovations could include peak hour injections of LNG back-hauled to generators,
batteries charged during off-hours and discharged in peak hours, and demand response to name a few. However, in all cases, absent transparent market signals for the value of hourly pipeline ramp and de-ramp services, these possible market innovations have no “price to beat” and thus cannot compete for or against an un-priced service.
10
“diminished baseload utilization of pipeline and storage assets in certain regions due to stagnant
demand growth can lead to opportunities to provide additional non-ratable services that pipeline
operators may not have had the flexibility to provide previously.”30 Until one of the most
valuable services pipelines provide (i.e., non-ratable just-in-time delivery service and non-ratable
“packing” to support both pre-ramping and de-ramping of gas-fired electric generation) is
delineated and priced, and a transactional structure is in place between pipelines and generators
for providing it, market incompatibly challenges will persist.31 The missing piece is a means of
incentivizing a pipeline to establish such operations in an effective way.
C. Incentive Rate Structures Can Benefit Both Consumers and Regulated Companies
Increasing the utilization of existing assets through improved pricing structures would
reduce the need for new pipelines, improve the capital efficiency of the entire pipeline network,
and reduce environmental impacts.32 More than two decades ago, the Commission recognized
the role that incentive ratemaking could play in achieving these objectives. In its 1996 Incentive
Ratemaking Policy Statement, the Commission stated that it would allow utilities to propose
incentive rate mechanisms as alternatives to traditional cost-of-service regulation, noting that
such proposals “should result in lower rates to consumers and provide utilities the opportunity to
earn higher returns.”33 Its observation that “ratemaking flexibility would permit pipelines to
30 Black & Veatch Management Consulting, LLC for the INGAA Foundation, Inc., The Role of
Natural Gas in the Transition to a Lower-Carbon Economy at page 52 (May 2019) (“INGAA Report”).
31 For a further discussion of the merits of non-ratable services, see Reply Comments of the Environmental Defense Fund, Docket No. AD18-7 (May 9, 2018).
32 Murchie Affidavit, ¶ 32. 33 Alternatives to Traditional Cost-of-Service Ratemaking for Natural Gas Pipelines (1996
Incentive Ratemaking Policy Statement), 74 FERC ¶ 61,076 at p. 61,237 (1996).
11
tailor natural gas transportation rates for electric generators to meet the swings in gas
consumption often experienced by such generators”34 still rings true today:
The need for fast ramping electric generation resources will continue to grow with the transition to a lower-carbon economy. Developing no-notice or short-notice transportation rates that reflect the time of use element of the delivered gas volumes will be an important step to allocate the appropriate level of costs to each shipper on the system. A shipper that can avoid using gas deliveries on those specific hours, like LDCs or industrial customers can capture some cost savings by allowing the pipeline to offer no-notice services to these electric resources and sharing the incremental revenue with its existing shippers.35
While certain refinements may be needed to FERC’s 1996 policy, it can provide a starting place
for a suitable framework. As the energy system continues to transform, the Commission can and
should use its longstanding tools for incentivizing beneficial market behaviors in pursuit of its
cornerstone cost causation and allocative efficiency precepts.36 Allowing and incentivizing
pipeline operators to profit from the market value of transportation services37 will clarify
investment signals to channel capital to the purposes most valued within the market. To explore
these ideas further, FERC should expand its inquiry in this docket, or open a separate docket, in
order to evaluate and obtain further stakeholder input on this issue.
34 Id. at p. 61,226. 35 INGAA Report at page 56. 36 See, e.g., Transcontinental Gas Pipe Line Co. LLC, 166 FERC ¶ 61,222 at P 19, n.22 (2019)
(quoting Midwest ISO Transmission Owners v. FERC, 373 F.3d 1361, 1368 (D.C. Cir. 2004) (describing cost causation principles as “requir[ing] that all approved rates reflect to some degree the costs actually caused by the customer who must pay them.”); Algonquin Gas Transmission, LLC, 156 FERC ¶ 61,151 at P 27 (2016) (explaining that allocative efficiency is enhanced by ensuring the capacity is used for its highest valued use).
37 INGAA Report at page 54 (recommending a “hourly rate structure that will allow pipelines to allocate costs based on when customers need gas supply the most and to the customers who need it the most” or alternatively proposing that “pipelines should be permitted to price based on the value of the service instead of the cost to provide the service.”).
12
III. CONCLUSION
It is appropriate for the Commission to evaluate its policies in light of contemporaneous
and evolving market conditions. To this end, the Commission should revisit its approach for
establishing rates of return predicated on putting more steel in the ground to a commercial design
that provides enhanced rates of return based on the value of delivery services. This will ensure
existing infrastructure is utilized in an efficient manner and capital allocation meets investment
expectations—in a way that complements the ongoing transformation to a more responsive
renewable and lower carbon energy system. By granting incentive rates of return to pipelines
that provide more responsive variable gas deliveries, the Commission can better link shareholder
and societal value while ensuring the continued health of the pipeline industry.
Dated: June 26, 2019 Respectfully submitted,
/s/ Natalie Karas Natalie Karas Lead Counsel, Energy Markets and Utility Regulation Environmental Defense Fund 1875 Connecticut Ave. NW Washington, DC 20009 (202) 572-3389 [email protected]
N. Jonathan Peress Senior Director, Energy Markets and Utility Regulation Environmental Defense Fund 16 Tremont Street, Suite 850 Boston, MA 02108 (617) 406-1838 [email protected]

Attachment A
1
UNITED STATES OF AMERICA BEFORE THE
FEDERAL ENERGY REGULATORY COMMISSION
Inquiry Regarding the Commission’s Policy ) for Determining Return on Equity ) Docket No. PL19-4-000
AFFIDAVIT OF JAMES J. MURCHIE
on behalf of The Environmental Defense Fund
I. Introduction
1. My name is James J. Murchie.1 I am Co-founder and CEO of Energy Income Partners,
LLC (EIP). EIP is a Registered Investment Adviser that oversees about $6 billion2 of
client assets. EIP advises or sub-advises six mutual funds (five of which are New York
Stock Exchange listed funds), two investment partnerships and hundreds of separately
managed accounts for individuals and institutions. EIP invests all of these client assets in
equity securities of publicly traded energy infrastructure companies located primarily in
the U.S. with some investments in Canada and nominal investments overseas. EIP
invests in companies that operate natural gas and petroleum pipelines and related storage
and terminals, regulated power generation, transmission and distribution as well as
developers and operators of renewable energy selling power on long term contracts. Our
investment strategy seeks stable cash flows being generated by regulated assets with
modest growth.
1 This Affidavit represents solely the views of James Murchie as of the submittal date. The views expressed herein address certain matters set forth in the June 26, 2019 Comments of the Environmental Defense Fund, but do not address all of the matters covered therein. No inferences should be drawn regarding the views of Mr. Murchie or Energy Income Partners, LLC, regarding any matter not specifically addressed in this Affidavit.
2 As of March 31, 2019.
2
2. EIP was established in 2003 and is an outgrowth of my personal investments in energy
infrastructure dating back to the late 1990s. My experience includes 8 years at British
Petroleum and its predecessor company the Standard Oil Company of Ohio, 5 years at the
Wall Street research house Sanford C. Bernstein and 2 years at Julian Robertson’s Tiger
Management. EIP’s original fund, started in 2003, has generated a double digit
compounded annual growth rate that exceeds the returns of the S&P 500, the PHLX
Utility Sector Index, the Alerian MLP Index and the NAREIT REIT Index over the same
time period.3 Such outperformance is rare; recent studies by Standard & Poor’s have
shown that, on average, about 94% of active fund managers have underperformed their
benchmarks over the last 15 years.4 EIP’s success in achieving these returns is a result of
three main factors. The first is our long-term investment horizon, the second is our focus
on investing in companies with stable and predictable earnings and the third is EIP’s
emphasis on the track record and capabilities of the management teams that run our
portfolio companies.
3. This affidavit was prepared at the request of the Environmental Defense Fund (EDF) in
order to present the view of a successful long-term investor whose clients provide the
capital that funds North America’s energy infrastructure. In my experience, EDF has a
deep understanding of the energy sector, and its approach is informed by evidence to
develop market-based solutions, values that we share. My comments and
recommendations focus on the importance of setting an allowed regulatory return
3 Bloomberg. The references to the performance of account is not representative of other EIP accounts that may not have experienced the same performance described above. Past performance is no guarantee of future results.
4 SPIVA ® U.S. Scorecard, S&P Global, Year-End 2017.
3
sufficient to attract capital in a marketplace that considers the risks and rewards of a
broad range of investment opportunities extending well beyond utilities and pipelines.
4. I am attaching the following exhibit to my affidavit:
Exhibit JJM-01: July 12, 2018 Testimony of James J. Murchie Before the U.S. Senate Committee on Energy and Natural Resources Regarding Natural Gas Pipeline Development
II. Summary of Recommendations
5. The Federal Energy Regulatory Commission’s (Commission or FERC) Notice of Inquiry
specifically seeks comment on whether, and if so how, it should modify its policies
concerning determination of Return on Equity (ROE) used in designing rates charged by
public utilities. I have two specific observations with respect to the determination of
ROEs.
6. The first is that the cost of capital for a particular company or group of companies and
the return those companies earn on that capital (which I will refer to as the Accounting
ROE and is simply reported earnings divided by book value) are two entirely different
concepts. Capital will only be made available to utility and pipeline companies to build
new capacity if their allowed returns exceed the cost of capital; as such, the practice of
equating cost of capital to allowed ROE is fundamentally flawed. Yet despite the
differences in these two concepts, the current DCF method uses estimates of the cost of
capital to derive an appropriate Accounting ROE. Factors included in this DCF method
assessment include the growth rate and riskiness of earnings as well as indirect measures
of earnings such as the dividend yield and the dividend payout ratio. These and other
factors are combined to assess what the market charges for equity capital in order to
determine a just and reasonable Accounting ROE. This seems an unnecessary

4
intermediate step that is fraught with its own shortcomings. A better method, in my view,
would be to use an easily observable measure of Accounting ROE, such as the long-term
actual ROE of the S&P 500, to reflect an actual competitive market return as a “Base
ROE.” The shortcomings of the DCF approach are well-documented and I agree with
most of those criticisms. Chief among them: 1) using a peer group of electric or pipeline
utilities ignores the need to compete outside the peer group for capital, 2) non-utility
businesses housed with utility assets distort the DCF outcome, and 3) market pricing
anomalies must continually be adjusted for. However, none of these capture the most
fundamental flaw of conflating the cost of equity capital with the accounting return on
that capital.
7. My second observation is that to align the interests of the public, ratepayers and
investors, allowed ROEs should vary from a Base ROE in such a way as to provide
incentives for companies to perform better in terms of cost, reliability, safety and
environmental impact. The current ROE methodology descends from a long line of
legislative, judicial and regulatory guidance that traces its roots to incentivizing new
investment. While this remains a central reason for providing a just and reasonable
return, the increased complexity of the energy delivery system and the new demands
being placed on that system by state-level initiatives, rapid growth of renewable and
natural gas generation (and the attendant need for increased coordination), as well as
growing demand for reduced environmental impact calls for a more flexible approach to
incentivizing energy delivery solutions other than simply putting more steel in the
ground. At the state level, going back decades, electric and natural gas utilities have been
rewarded for investing in conservation if that conservation is a cheaper alternative to new

5
capacity. Likewise, there may be opportunities for pipelines to utilize existing
infrastructure more efficiently, providing better investor returns without simply adding
new capacity, thereby lowering costs to customers and mitigating environmental impact.
The product that utilities should provide is more than just the delivery of energy, it is the
delivery of safe, reliable, clean and low-cost energy. The ROEs allowed should not only
reflect these public benefits but should further incentivize and reward the companies who
best deliver them above a baseline of average performance.
III. Historical Context of Today’s ROE Requirement
8. My perspective on capital formation, pricing, and allowed ROEs for utility businesses is
informed by the history of utility regulation as detailed in my July 12, 2018 testimony
before the Senate Committee on Energy and Natural Resources, provided as Exhibit JJM-
01 to my affidavit.
9. Natural monopolies are a rarity and somewhat of an anomaly in classical economics, but
their existence was made evident during the railroad boom in the middle of the 19th
century. During that time Charles Francis Adams Jr., the grandson of John Quincy
Adams, head of the Massachusetts Railroad Commission (and later the Union Pacific
Railroad) observed that the railroad industry was a natural monopoly where “competition
and the cheapest possible transportation are wholly incompatible” and that “the cheapest
possible transportation [results from] the largest possible volume of movement through
the fewest possible channels.” 5
10. Subsequently, regulatory constructs evolved at the state and federal levels to provide a
5 Prophets of Regulation: Charles Francis Adams; Louis Brandeis; James M. Landis; Alfred E. Kahn, by Thomas K. McCraw, 1984, Harvard University Press.

6
“just and reasonable return” on privately sourced energy infrastructure capital in
exchange for limited competition, an obligation to serve, open access, reliability, and
safety. Regulators are charged with approving new capital investment upon a
determination that these conditions have been met and that an investment’s public
benefits exceed the public’s costs.
11. What constitutes a just and reasonable return remains a topic of debate that is ultimately
guided by the U.S. Supreme Court in Hope Natural Gas where it held that “the return to
the equity owner should be commensurate with the return on investments in other
enterprises having corresponding risks” and “return, moreover, should be sufficient to
assure confidence in the financial integrity of the enterprise, so as to maintain its credit
and to attract capital.”6 The court did not, however, equate that return on investment to
the prevailing market for debt and equity capital which fluctuates widely with sentiment.
I will address this further in Section IV.
12. The downside of the utility model, as history has demonstrated, is the moral hazard that
comes from a return on investment to a private enterprise that may view that allowed
return as a guarantee. These hazards have included over-leverage, cost inflation and
forays into highly risky businesses because of the comfort provided by the base business
being perceived by management as guaranteed. The challenge for society is to reap the
benefits of the privately funded regulated monopoly business model while avoiding the
accompanying hazards.
13. Despite this moral hazard, the investor owned utility has proven the superior model
relative to the alternative of government ownership as can be seen in today’s critical lack
6 Federal Power Comm’n v. Hope Nat. Gas Co., 320 U.S. 591, 603 (1944).

7
of capital available for publicly-owned civil infrastructure in the United States. But this
is not to say that regulation cannot be improved by blending the benefits of competition
in terms of operating efficiency while retaining the characteristics that lower the cost of
financing by reducing investor risk. As articulated by Alfred E. Kahn:
Merely permitting all regulated companies as a matter of course to earn rates of return in excess of the cost of capital does not supply the answer; there has to be some means of seeing to it that those…returns are earned, some means, for example, of identifying the companies that have been unusually enterprising or efficient and offering higher profits to them while denying them to others.7
I will further address this concept in Section V.
IV. Separating Allowed ROE from the Cost of Equity Capital
14. Allowed ROEs and the cost of capital are separate concepts that are often wrongly
conflated in a regulatory context. Capital cost is set by the market and allowed returns
should be set by the regulator based on competitive Accounting ROEs across the capital
markets, adjusted for differences in risk.
15. Broadly speaking, the expected return for equities in the U.S.—in other words, the
market cost of equity capital—is generally calculated to be about 8-9% being made up
today of a roughly 2% dividend yield and expectations for long-term growth of 6-7% for
the S&P 500. This differs significantly from the earned returns on equity for the S&P
500 over the last ten years of about 13.7% and over the last 25 years of about 13.8%.8
The spread between the market cost of capital and the Accounting ROE is indicative of
an equity capital market that can be a source of funds for new investment should it be
warranted.
7 The Economics of Regulation, Alfred E. Kahn, 1988, MIT Press. 8 Factset and Bloomberg.

8
16. While some may dismiss a calculation based solely on accounting measures that ignores
concepts like intrinsic value and economic earnings that might be factored into equity
prices, the setting of the allowed ROE in a regulatory context is often similarly
monolithic.
17. The question regulators must answer is not what the market is theoretically willing to
pay for a stream of cash flows but what returns at the company level are needed to attract
sufficient capital from alternative uses elsewhere in the capital markets. Answering this
via DCF—a method affected by large fluctuations in short term market sentiment—for
20-30-year projects is inappropriate and unnecessarily complex. As mentioned above,
the current DCF method uses estimates of the cost of capital in order to determine an
appropriate Accounting ROE. Factors included in this assessment include the growth
rate and riskiness of earnings as well as indirect measures of earnings such as the
dividend yield and the dividend payout ratio. These and other factors are distilled to
assess what the market charges for equity capital to then arrive at a just and reasonable
accounting measure of the company’s return on equity. This seems a rather circuitous
route when a more robust alternative—namely the Accounting ROE of the broader equity
market—is readily available. Such a change is not radical, it merely changes the
denominator from a fluctuating market price to actual accounting cost. In fact, in Hope,
the Supreme Court rejected the notion of using market value in determining rates: “[t]he
heart of the matter is that rates cannot be made to depend upon “fair value” when the
value of the ongoing enterprise depends on earnings under whatever rates may be
anticipated.”9
9 Federal Power Comm’n v. Hope Nat. Gas Co., 320 U.S. 591, 601 (1944).

9
18. This is not to suggest that a single Accounting ROE provides a just and reasonable return
for each energy infrastructure project, only that it provides a starting point for a Base
Accounting ROE. To arrive at a return commensurate with other enterprises having
similar risks requires further consideration. A fully regulated electric utility with a state-
granted monopoly franchise, for example, differs from a natural gas pipeline operating in
competitive markets. As investors, we factor in significantly higher risk for an interstate
natural gas pipeline, whose upside is capped by a regulated return, but whose downside is
unlimited if it becomes redundant in a competitive market with no regulatory backstop.
The state regulated pure monopoly utility may be viewed as having less risk than the
S&P 500 while an interstate gas pipeline may be deemed riskier than the S&P 500 owing
not just to competition but the vagaries of commodity prices and the changing economics
of different hydrocarbon supply basins that could leave assets stranded.
19. The pipeline sector also faces growing risks and opposition to project siting and
development. The resulting delays and cancellations have dramatically changed the way
investors handicap future growth versus just 5 years ago, when earnings accretion from
future identified and contracted projects were almost fully factored into expected future
earnings growth. Pipeline development is a multi-year process requiring a considerable
capital commitment even before actual construction commences, and the potential for
cancellation during the development process poses a risk that the initial investment
becomes stranded. To account for this risk, my firm reduces the expected return our
portfolio companies will ultimately earn on the entirety of their invested assets. For
example, the prospect of a 50% chance of losing 20% of the cost of a new pipeline that is
abandoned on cancellation would raise the required ROE by 1.3%, assuming a 13%
10
baseline ROE (50% X 20% X 13% = 1.3%) all else equal. While these assessments of
risk are forward looking and bound to suffer from estimation error, they do align with the
expertise of the Commission, pipeline companies and intervenors, whereas estimates of
the nuances and vagaries of capital markets do not.
20. Setting allowed ROEs based on the accounting ROE for the broader market would not in
any way eliminate the influence of the cost of capital on investment decisions. The cost
of capital can be very different for two groups of companies earning the exact same
accounting ROE due to investors’ perceptions of growth and risk which are directly
influenced by company management and regulators. Management teams can affect
growth rates in many ways but especially by their capital allocation decisions, which—
when well executed—can generate per share earnings growth. This can even be achieved
in an industry lacking unit sales growth by repurchasing shares. Conversely, poor capital
allocation can produce flat to declining per share earnings growth even when industry
growth rates are high. This was amply demonstrated by the poor growth in earnings for
the pipeline sector over the last ten years at a time when annualized U.S. hydrocarbon
production growth was about 6%. As such, a company’s track record on growth and the
consistency of that growth can exert significant influence on the cost of equity capital.
21. Regulators can affect growth rates and have a larger perceived role in investor
assessments of risk and the predictability of earnings. This was demonstrated in the
aftermath of the Commission’s March 15, 2018 Revised Policy Statement10 denying
recovery of a tax provision for partnership-owned pipelines. The uncertainty raised by
10 Inquiry Regarding the Commission’s Policy for Recovery of Income Tax Costs, Revised
Policy Statement on Treatment of Income Taxes,162 FERC ¶ 61,227 (2018).
11
that Policy Statement drove expected 2020 earnings down by more than 20% for ten
publicly traded partnerships that owned FERC regulated pipelines over the first five
months after issuance of that policy statement.11 That, coupled with an abrupt departure
from past accepted practice, caused a significant negative share price reaction, driving
pipeline capital costs higher.
22. This illustrates that management teams and regulators wield considerable influence over
the cost of capital. By conducting business in a way that reduces investor uncertainty,
both management teams and regulators can positively affect the cost of capital and
thereby lower the cost to consumers separately and distinct from the allowed ROE.
23. Of course, market events can cause the cost of capital to move in a way completely
unrelated to the utility company’s prospects as happened during the period of high
interest rates in the early 1980s. During this period, authorized rates of return for utilities
were in the 13% to 15% range, with earned returns being closer to 10% to 12%.12 The
cost of debt (which is lower than the cost of equity) reached levels in excess of 16%. This
situation alarmed those in Congress that “the nation’s electricity supply could become
less cost-effective if regulatory incentives continue to bias utilities away from capital
investments.”13 This episode demonstrates that the spread between the allowed rates of
return and the cost of capital is critical to attracting capital in the market and that equating
11 Average Bloomberg 2020 Adjusted EPS Estimates as of January 31, 2018 compared to Average Bloomberg 2020 Adjusted EPS Estimates as of June 29, 2018 for BPL, BWP, DM, EEP, ET, MMP, TEP, SEP, TCP, & WPZ.
12 “You Get What You Pay For: Moving Toward Value in Utility Compensation – Part 1 Revenue and Profit” Steve Kihm et. al. America’s Power Plan, Energy Innovation and U.C. Berkeley, https://americaspowerplan.com/wp-content/uploads/2016/07/CostValue-Part1-Revenue.pdf (hereinafter “Value in Utility Compensation”).
13 Id. at page 12.
12
the two fails to meet the test in Hope—“[t]hat return, moreover, should be sufficient to
assure confidence in the financial integrity of the enterprise, so as to maintain its credit
and to attract capital.”14 While we now view the high interest rates of that era as an
anomaly, the market did not, and the result made it dilutive for companies to issue equity
and debt to finance new utility investment.
24. Perhaps the most important concept that emerges in separating the cost of equity from
allowed ROE is that regulators can use this spread as a tool to achieve policy goals:
Many in the regulatory community appear to believe that the utility’s rate of return is the sole value driver, and that rates of return are set at the cost of equity. Neither of these perceptions is correct. Instead, the financial “value engine” – the difference between a utility’s return on investment and its cost of capital – drives shareholder returns. Regulators should use this value engine to align utilities’ financial motivations with delivering value to customers and society. They can offer utilities and regulated pipelines opportunities to earn increased revenues when they provide value-based products and services. Regulators can also influence utilities’ cost of capital by taking actions that increase the predictability of returns on valuable investments.15 I next turn to how to align utilities’ financial motivations with delivering value to
customers and society.
V. Providing Incentives
25. We are at the threshold of significant changes in how our energy system will work. The
increased role of natural gas is due in part to its lower cost resulting from shale drilling
and in part to its critical role in backing up intermittent renewables. This larger role calls
for a more synchronized coordination between the gas transportation and power
generation segments of the business that operate under different regulatory constructs.
The growth in the use of intermittent renewables, battery storage, and the emergence of a
14 Federal Power Comm’n v. Hope Nat. Gas Co., 320 U.S. 591, 603 (1944). 15 Value in Utility Compensation at page 2.
13
more distributed model are also driving significant changes. These are just a few of the
technological changes occurring at a time when the public is demanding a lower cost,
more resilient energy system with less environmental impact.
26. Traditional cost-of-service regulation (COSR) has provided a return sufficient to finance
and build essential pipeline and utility infrastructure, but it offers few incentives to
achieve higher levels of reliability and safety and lower levels of cost and environmental
impact being demanded today:
This regulatory model works reasonably well to align utility motivation with public interest when rapid system build-out is the top goal for policy makers. In fact, without a rate of return above the cost of equity for utilities, the system would stagnate – no activities would be profitable. But when capital-based solutions are not preferred, or new technology creates room for competition, COSR may create a disconnect between utility shareholder value and outcomes that most benefit society.16
27. The impetus for restructuring of electric generation was a series of events that led to cost
overruns for new power plants at a time of lower demand that drove up customer prices
to levels that were uncompetitive with non-utility independent alternatives. While
restructuring did lower the cost of wholesale electricity by introducing competition, a
significant portion of those savings were then offset by a substantially higher cost of
equity and debt financing as markets correctly perceived greater risk to these assets in a
competitive versus a regulated construct. By some estimates, the cost of capital for
merchant power producers is about twice the levels of regulated utilities.
28. Of course, power generation does not exhibit the same natural monopoly characteristics
16 “You Get What You Pay For: Moving Toward Value in Utility Compensation – Part 2
Regulatory Alternatives” Dan Aas and Michael O’Boyle. America’s Power Plan, Energy Innovation and U.C. Berkeley, https://americaspowerplan.com/wp-content/uploads/2016/08/2016_Aas-OBoyle_Reg-Alternatives.pdf.

14
as transmission infrastructure, but many parts of the natural gas transmission network
have sufficient alternative routes to be deemed competitive. While still operating with
regulatory oversight, arms-length agreements (“black-box settlements”) between shippers
and pipeline operators have generally been approved with a wide range of resulting
returns on equity.
29. In the non-competitive markets, however, the challenge is to incentivize efficiency
without risking cash flow stability and undermining those efficiencies with a higher cost
of equity and debt financing. Even if competition could be introduced, it is not clear that
competitive markets would provide greater reliability and safety and lower environmental
impact. For this reason, many state regulators have developed “patches” to the
competitive markets to incentivize ample capacity, supply diversity and carbon-free
generation. Of course, the inability of any competitive market to deal with externalities is
not new and drives a wide range of regulation across many industries. For natural
monopolies, COSR can broadly penalize negative externalities such as environmental
impact and poor safety record but it cannot as specifically target performance differences
in these negative externalities among utility companies nor reward positive externalities
such as reliability and capital and operational efficiency.
30. Incentive ratemaking providing higher equity returns for better performance in
reliability, safety, cost efficiency and environmental impact would impart the benefits of
competition and accounting of externalities while preserving the lower cost of financing
owing to lower risk and stable cash flows that are lacking in a purely competitive
construct.
31. An incentive approach, for example, could be applied to the challenge of better

15
allocating contracted but unused capacity in interstate pipelines when merchant power
generators have a higher short-term willingness to pay for that capacity. I would caution
against any changes that would be viewed by the capital markets as tantamount to
converting a regulated utility into a trading/cyclical merchant business with a
correspondingly higher cost of equity and debt financing.
32. Incentivizing more fulsome utilization of existing assets by such methods might reduce
the need for new pipelines, improving the capital efficiency of the entire network and
reducing externalities such as environmental impact. Sharing some of those benefits with
the pipeline company in the form of a higher allowed ROE would stimulate more
efficient use of the assets without raising the cost of equity and debt financing. As an
investor, I believe pipeline companies should be working to improve efficiency of
existing assets. Building unnecessary pipelines is risky to investors and a waste of
capital.
33. An important starting place could be FERC’s 1996 Incentive Ratemaking Policy
Statement.17 That policy stated:
Where companies have market power, market-based rates are not appropriate. However, in order to enhance productive efficiency in non-competitive markets, the Commission will allow utilities to propose incentive rate mechanisms as alternatives to traditional cost-of-service regulation. Such proposals should result in lower rates to consumers and provide utilities the opportunity to earn higher returns.18
Although certain updates may be needed to that policy, its observation that “ratemaking
flexibility would permit pipelines to tailor natural gas transportation rates for electric
17 Alternatives to Traditional Cost-of-Service Ratemaking for Natural Gas Pipelines (1996 Incentive Ratemaking Policy Statement), 74 FERC ¶ 61,076 (1996).
18 Id. at p. 61,237.
16
generators to meet the swings in gas consumption often experienced by such
generators”19 can help inform the challenges faced by the Commission today in this
evolving regulatory environment.
VI. Conclusion
34. Attracting capital needed to finance the construction of the essential utility and pipeline
infrastructure regulated by the Commission requires setting allowed equity returns at
levels able to attract capital on economic terms in a competitive marketplace that
considers investment alternatives well beyond the utility and pipeline sectors. Returns
must exceed—not merely equal—the cost of capital to achieve this end.
35. The pipeline and utility companies regulated by the Commission today face a changing
energy landscape, shifts in the fuel mix, public scrutiny, and regulatory and policy
changes that collectively heighten business risk, which in turn puts upward pressure on
the cost of capital in a competitive market. Regulation can mitigate these risks and lower
capital costs to the ultimate benefit of consumers, but only if it is consistent, stable, and
transparent.
36. Better alignment of interests among utility shareholders, regulated utilities and their
many stakeholders can be achieved with a regulatory system that incentivizes monopolies
toward the efficiency of a competitive business while retaining the lower cost of equity
and debt financing attendant to stable cash flows and lower market risk embodied in the
regulatory construct to ultimately serve the public with safe, reliable, low cost energy
with the least environmental impact. In such a system the utilities that provide the most
public benefits will enjoy better returns on invested capital at a lower cost of debt and
19 Id. at p. 61,226.

17
equity financing. Capital would then flow to those companies creating the most value for
all stakeholders and away from those that create the least.

TESTIMONY OF
JAMES J. MURCHIE
CEO AND CO-FOUNDER
ENERGY INCOME PARTNERS, LLC
BEFORE THE
U.S. SENATE COMMITTEE ON ENERGY AND NATURAL RESOURCES
REGARDING
NATURAL GAS PIPELINE DEVELOPMENT
JULY 12, 2018
Madam Chair and Members of the Committee:
My name is Jim Murchie. I am Co-founder and CEO of Energy Income Partners, LLC or EIP
for short. EIP is a Registered Investment Adviser that oversees about $6 billion1 of client assets.
EIP advises or sub-advises six mutual funds (five of which are New York Stock Exchange listed
funds), two investment partnerships and hundreds of separately managed accounts for
individuals and institutions. EIP invests all of these client assets in equity securities of publicly
traded energy infrastructure companies located primarily in the U.S. with significant investments
in Canada and nominal investments overseas. EIP invests in companies that operate natural gas
and petroleum pipelines and related storage and terminals, regulated power generation,
transmission and distribution as well as developers and operators of renewable energy selling
power on long term contracts. Our investment strategy seeks stable cash flows being generated
by regulated assets with modest growth.
EIP was established in 2003 and is an outgrowth of my personal investments in energy
infrastructure dating back to the late 1990s. My firm and I appreciate the opportunity to present
testimony to the Committee today.
I am joined here today by my colleague Sam Brothwell. The investment team at EIP is
comprised of six individuals, including myself and Sam; we all have extensive energy and
financial industry experience. My own experience includes 8 years at British Petroleum and its
predecessor company the Standard Oil Company of Ohio, 5 years at the well-known Wall Street
research house Sanford C. Bernstein and 2 years at Julian Robertson’s Tiger Management. Sam
1 As of June 30,2018
Docket No. PL19-4-000 Exhibit No. JJM-01
Page 1 of 8

has worked in the industry at Public Service of New Mexico and Questar as well as on Wall
Street at Merrill Lynch and Wells Fargo and has testified before the Federal Energy Regulatory
Commission on pipeline ratemaking policy.
EIP’s original fund which started in 2003 has generated a double digit compounded annual
growth rate that exceeds the returns of the S&P 500, the PHLX Utility Sector Index, the Alerian
MLP Index and the NAREIT REIT Index over the same time period.2 Such outperformance is
rare as recent studies by Standard & Poor’s have shown that, on average, about 94% of active
fund managers have underperformed their benchmarks over the last 15 years.3 We believe EIP’s
success in achieving these returns is a result of three main factors. The first is our long-term
investment horizon, the second is our focus on investing in companies with stable and
predictable earnings and the third is that EIP does not adhere to the typical asset allocation
guardrails imposed on most money managers by institutional investors that would pigeonhole us
into being either a “utility” manager or an “MLP” manager.
One of the tenets of EIP’s approach is a focus on total or absolute investment returns rather than
returns relative to index benchmarks. In assessing both past and forecasted returns, we
disaggregate the portion of the investment return contributed by dividend yield from the portion
of the return contributed by share price appreciation. Separating these two components is critical
to understanding how we invest and what factors we seek in our portfolio companies to
maximize our returns. The yield component of our returns is about 6%, the balance has come
from appreciation of the underlying share prices.
While share prices fluctuate daily, the long-term driver of share price appreciation is growth in
per-share earnings and dividends. For investment managers with a short investment horizon,
these fluctuations are far more important to their strategy and approach. Since those short-term
fluctuations are caused so often by transient factors in the news for the economy, an industry or a
particular company, it is those short-term factors that most investment managers focus on.
Watching most portfolio managers speak on television business programs provides a good
window into this investing style.
The higher yield of our portfolio over time versus the stock market averages (the yield on the
S&P 500 is currently 1.9%4) is mostly a result of a higher dividend payout ratio, which is the
portion of a company’s earnings paid to its shareholders each quarter. Higher payout ratios tend
to be found in companies with more stable earnings and in slower-growing mature industries.
Stability of earnings matter because dividends are viewed by investors a little like the coupon
payment of a bond. A dividend cut is a broken promise and often indicates more serious
problems at a company. As a result, company boards of directors strive to set dividends at a
level they will never have to cut. The more stable the earnings, the higher the payout ratio can
2 Source: Bloomberg. The references to the performance of account is not representative of other EIP accounts that may not have experienced the same performance described above. Past performance is no guarantee of future results. 3 Source: SPIVA ® U.S. Scorecard, S&P Global, Year-End 2017. 4 Source: Bloomberg. Data as of July 3, 2018.
Docket No. PL19-4-000 Exhibit No. JJM-01
Page 2 of 8
be. Slower growing industries also tend to have higher payout ratios because there are fewer
growth opportunities requiring reinvestment of earnings.
We believe that pipelines and related storage as well as certain electric and natural gas utilities
possess both of these attributes. Energy is a mature business (U.S. primary energy demand
grows less than 1% per year5) and these businesses tend to operate under federal or state
jurisdiction that earn allowed rates of return on their invested capital.6 That means that they are
less subject to the cycles of the economy, commodity prices or changes in the rate of inflation.
Businesses that have these allowed rates of return are often referred to as Regulatory Asset Base
businesses or RAB for short.
In the early history of the electric and natural gas industries, these regulated asset base businesses
represented an alternative to public ownership. Today, the vast majority of electric and natural
gas transportation infrastructure in the United States is owned by publicly traded corporations
and publicly traded partnerships. By contrast, over 85% of water and sewer infrastructure is
owned by municipalities and special government districts.7 That U.S. energy consumers enjoy
some of the lowest electricity and natural gas rates in the OECD is partially the result of an
abundance of available capital to build and maintain energy infrastructure at reasonable cost, in
our view. Again, by contrast, many municipal water systems are today reaching the end of their
useful life and are increasingly being sold to investor-owned publicly traded utilities that can
access the capital needed to modernize their pipes and related equipment without unduly
increasing rates charged to consumers. Infrastructure assets have long—but not infinite—lives,
and over time face stricter safety and environmental standards as well as ongoing technological
evolution in the sources and uses of the products they transport that require constant
reinvestment.
This RAB model in the U.S. traces its history back to a famous speech given by Sam Insull at the
June 1898 (that’s eighteen-ninety-eight) meeting of the National Electric Light Association, the
forerunner of today’s Edison Electric Institute. Insull had left the General Edison Electric
Company (now General Electric) as Thomas Edison’s right-hand man to head up what became
Commonwealth Edison in Chicago. He was arguing for a regulated investor-owned utility
framework that would benefit all stakeholders, including the customers buying the electricity
during a time when the electric industry was in its “Wild West” infancy. Here’s the essence of
his message:
“Acute competition necessarily frightens the investor, and compels corporations to pay a very
high price for capital….The best service at the lowest possible price can only be obtained….by
exclusive control of a given territory being placed in the hands of one undertaking…..The more
certain this protection is made, the lower the rate of interest and the lower the total cost of
5 Sources: BP Statistical Review of World Energy: June 2018; U.S. Energy Information Administration (EIA) 6 Sources: BP Statistical Review of World Energy: June 2018; U.S. Energy Information Administration (EIA). 7 Source: American Water Investor Presentation: June 2018.
Docket No. PL19-4-000 Exhibit No. JJM-01
Page 3 of 8

operation will be, and consequently the lower the price of the service to public and private
users.”8
Recognizing that regulation has since evolved to bring the benefits of competition to utility
consumers, the essence of Insull’s message remains as relevant today as it was 120 years ago;
that risk and cost of capital are highly correlated. The regulatory framework under which
pipelines and utilities operate reduces risk, takes advantage of scale, and is critical to achieving
reliable, low cost service to customers, while providing reasonable and competitive returns to
investors. The regulatory model articulated by Insull has resulted in an extensive U.S. energy
infrastructure system that provides abundant energy to businesses and consumers at prices that
are among the lowest in the developed world.9
The yield component of EIP’s returns for its clients is a direct result of a regulatory framework
that provides stable and more predictable earnings that allows for a payout ratio well above that
for other industries or the stock market as a whole. As most of the investors in our funds and
other investment products are individuals, this higher yield is a critical component of the
investment return they are seeking.
Nonetheless, the growth component has been a larger contributor to our returns. At first glance it
seems incongruous to have enjoyed growth in earnings and dividends from an industry whose
unit demand grows at less than 1%.10 There are two factors that explain the difference. The first
is that unit demand growth of about 1% might still result in sales growth of 2-4% depending on
the rate of inflation. This matches the average dividend growth over the last 15 years for the
utility and MLP indices of about 4%.11 The second factor is our successful stock selection as we
have been able to identify companies with higher than average growth rates.
In assessing our own track record, we have found that higher growth rates result from our ability
to select companies with good management teams operating under consistent and balanced
regulation. If we can get these two parts right, a third component kicks in, which is a lowering of
the company’s cost of debt and equity financing also referenced in Insull’s 1898 speech.
While we analyze financial statements and valuation like all other fund managers, our extreme
focus on the quality of management is unusual among investment managers but consistent with
our long-term approach. It is the management teams that determine where their competitive
advantages lie and how to best allocate capital. It is the management teams that work with the
regulators at the state and federal levels. It is the management teams that hire and retain the best
employees. It is the management teams that determine the safety and environmental record of the
company. All these activities determine a company’s ability to deliver energy to its customers in
8 Source: Insull, Samuel. “Standardization, Cost System of Rates, and Public Control” (1898). Reprinted in S. Insull, Central-Station Electric Service, 34–47. Chicago: Privately Printed, 1915. 9 Based on electricity pricing data sourced from U.S. Energy Information Administration as of December 2017 and the European residential electricity prices sourced from Eurostat as of December 2017. 10 BP Statistical Review of World Energy: June 2018; U.S. Energy Information Administration (EIA). 11 Source: Bloomberg. MLPS are represented by the Alerian MLP Index. Utilities are represented by the PHLX Utility Sector Index.
Docket No. PL19-4-000 Exhibit No. JJM-01
Page 4 of 8
an economical, safe, reliable and responsible manner. Companies that consistently do this well
over time tend to have superior shareholder returns. Companies that give short shrift to issues of
worker safety, system reliability and environmental stewardship also tend to be poor allocators of
capital, have higher operating costs and usually have poor relationships with regulators and other
stakeholders. They also tend to have lower shareholder returns.
Just as the quality of management teams varies, so does the tenor of regulation, so all else equal,
we seek the best regulatory constructs that we can find. One recent success is reflected in a
portfolio shift we made several years ago to increase our weighting in state-regulated natural gas
utilities also known as Local Distribution Companies or LDCs.
The leak and tragic explosion of a natural gas utility pipeline in San Bruno, California in 2010
and a similar incident in New York City in 2014 led many state regulators to encourage the
accelerated replacement of old pipe through the use of incentives and rate tracking mechanisms
that added regulatory certainty, facilitating a step change in the pace of investment. This, in turn,
has driven improved worker and public safety, system reliability and perhaps even a reduction in
fugitive releases of methane, a potent greenhouse gas. Shareholders also benefitted from lower
regulatory risk and higher rates of earnings and dividend growth, and as those higher growth
rates were recognized in the market, these stocks traded at higher valuations. Those higher
valuations reduce the cost of equity just as a higher credit rating lowers the cost of debt. Lower
capital costs benefit consumers, who ultimately bear the cost of utility financing.
The case of accelerated pipe replacement for LDCs and the regulatory structures that enabled
them at the state level are a great example of the Regulatory Asset Base regulated model working
for all stakeholders.
I once met a financial adviser who derided regulation as “a lot of red tape.” My response was
that so-called “red tape” consists of extensive public hearings, the consideration of all relevant
testimony by regulators and oversight by an independent judiciary that insures that regulatory
decisions have considered all the evidence and are arrived at by reasoned judgment and are
therefore neither arbitrary nor capricious. This process, so long as it follows established law and
procedures, protects all stakeholders including customers, the environment, as well as investors.
The 120-year history of these industries is also one of technological advancements that have
driven lower costs, better worker and public safety, increased reliability and lower emissions of
pollutants of all kinds. That holds true today as technological advances continue improving the
performance and cost-effectiveness of renewable energy resources such as wind, solar, and
energy storage the costs of which have declined about 70% over the last 8 years and have
emerged as the most cost-effective source of new supply in many regions of the U.S.
Increased use of renewables, however, has actually been facilitated by another technological
advancement: shale gas. The dramatically lower cost of natural gas has shifted electricity
generation away from coal in favor of natural gas and increasingly, renewables. Contrary to the
public debate pitting fossil fuels against renewables, natural gas and renewables actually
complement each other because of the intermittent and variable output of wind and solar and the
flexibility of gas-fired generation to respond quickly to the rapid changes in output from wind
Docket No. PL19-4-000 Exhibit No. JJM-01
Page 5 of 8
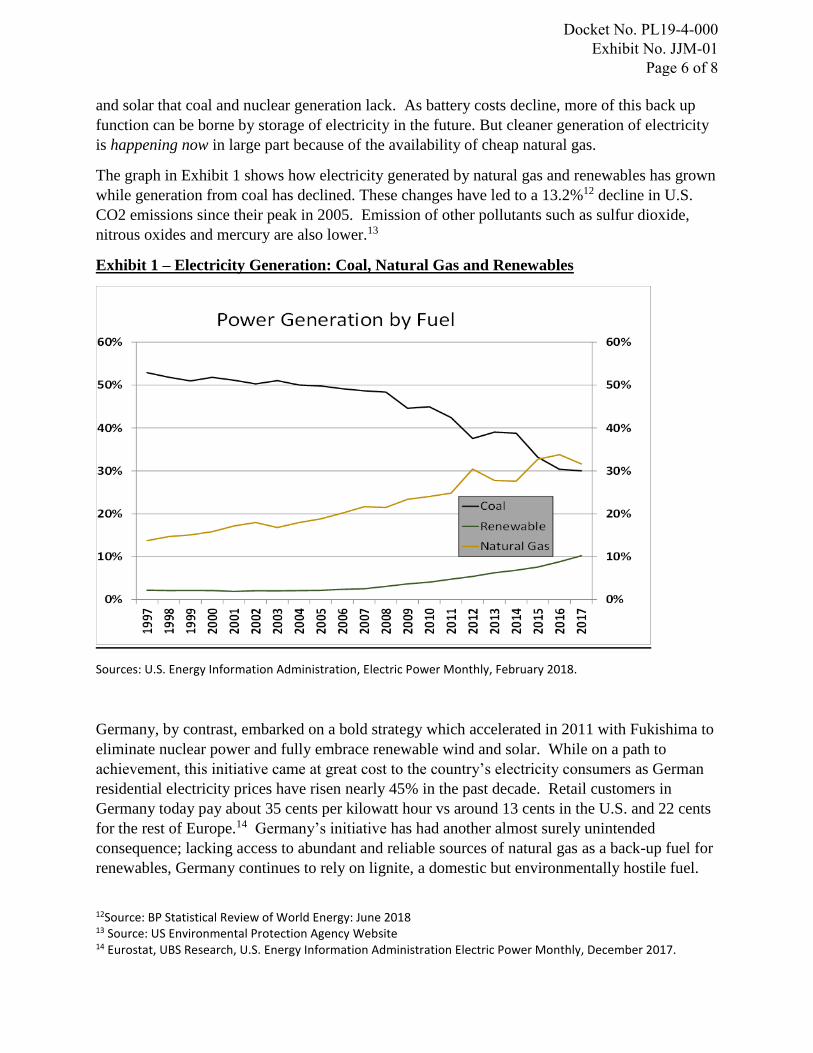
and solar that coal and nuclear generation lack. As battery costs decline, more of this back up
function can be borne by storage of electricity in the future. But cleaner generation of electricity
is happening now in large part because of the availability of cheap natural gas.
The graph in Exhibit 1 shows how electricity generated by natural gas and renewables has grown
while generation from coal has declined. These changes have led to a 13.2%12 decline in U.S.
CO2 emissions since their peak in 2005. Emission of other pollutants such as sulfur dioxide,
nitrous oxides and mercury are also lower.13
Exhibit 1 – Electricity Generation: Coal, Natural Gas and Renewables
Sources: U.S. Energy Information Administration, Electric Power Monthly, February 2018.
Germany, by contrast, embarked on a bold strategy which accelerated in 2011 with Fukishima to
eliminate nuclear power and fully embrace renewable wind and solar. While on a path to
achievement, this initiative came at great cost to the country’s electricity consumers as German
residential electricity prices have risen nearly 45% in the past decade. Retail customers in
Germany today pay about 35 cents per kilowatt hour vs around 13 cents in the U.S. and 22 cents
for the rest of Europe.14 Germany’s initiative has had another almost surely unintended
consequence; lacking access to abundant and reliable sources of natural gas as a back-up fuel for
renewables, Germany continues to rely on lignite, a domestic but environmentally hostile fuel.
12Source: BP Statistical Review of World Energy: June 2018 13 Source: US Environmental Protection Agency Website 14 Eurostat, UBS Research, U.S. Energy Information Administration Electric Power Monthly, December 2017.
Docket No. PL19-4-000 Exhibit No. JJM-01
Page 6 of 8

Since these goals were laid out in 2011, Germany’s CO2 emissions have actually increased by
0.4% while over this same time frame the U.S. has lowered its CO2 emissions by 5.3%.15
It is in this context that we view the debate about the Greenhouse gas (GHG) impact of
permitting new natural gas pipelines. To be direct, we view the debate as a false choice. When
regulators and the courts are asked to address the impact of a particular new natural gas pipeline
on GHGs, the discussion centers around considering the impact upstream of the pipeline (more
natural gas production) and downstream of the pipeline (more natural gas usage). Missing from
the discussion, in our view, is recognition that natural gas pipeline infrastructure enables natural
gas to reduce coal usage, reducing power plant emissions of all kinds, including CO2 and further
facilitates adding more renewables to the mix.
From a portfolio management perspective, we see uncertainty surrounding pipeline certification
and approval as a growing risk that we must factor into how and where we allocate our investor’s
capital. These risks affect primarily the growth component of our returns but in the rare case of
an existing pipeline being shut down, the impact could also affect the dividend payments of the
company that owns that pipeline.
Perhaps more important than any changes we would make to the EIP portfolios are fund
redemptions by investors as they see the cancellation of new pipeline projects due to objections
by regulators as well as some of the recent rulings by FERC as risks that outweigh the rewards of
a 6% portfolio yield. We believe that this flight of capital from the equity securities of
companies that own federally regulated pipelines has had a negative effect on valuation and
therefore a negative effect on the cost of capital for building new pipelines which is ultimately
paid for by consumers.
As investors in a capital-intensive commodity industry we recognize that lower costs ultimately
win out. And in our analysis, we include the costs of externalities like pollution and safety
because under our system of government the cost of those externalities are eventually paid for by
those who cause them. In short, we want to own the low-cost way of shipping the lowest-cost
form of energy.
While natural gas pipelines are a significant part of our portfolio, so too are operators and
developers of low cost renewable power, including a growing number of utilities that recognize
the opportunity in aligning their strategy with the direction of public policy. In the future we
expect to have a significant investment in companies providing infrastructure for electric
vehicles as we see them as eventually being the low-cost, higher performance means of
transportation.
We believe our investment success in the future will be directly impacted by policy makers’ and
regulators’ ability to use our existing regulatory construct to facilitate rather than frustrate the
increased adoption of these new technologies that improve the reliability, cost, safety and
environmental impact of our domestic energy system. Because adoption of these new
15 Source: BP Statistical Review of World Energy: June 2018
Docket No. PL19-4-000 Exhibit No. JJM-01
Page 7 of 8

technologies cuts across industries and therefore the mandate of the relevant regulatory agencies,
there is an important role to play for policy makers as well as regulators.
Our investors have benefitted from great management teams operating essential businesses under
a consistent rule of law administered by regulation that balances consumer and investor interests
to the benefit of all. We will continue to manage the allocation of the capital we are entrusted
with to seek fair returns and minimize risk by investing in well-run companies operating under
the guidance of balanced, reasoned and predictable regulation.
This concludes my testimony. Thank you for the opportunity to share my Firm’s views on these
very important issues.
EIP submits this testimony at the request of the U.S. Senate Committee on Energy and Natural Resources. The information provided is accurate as of the date submitted but may change at any time without notice. EIP cited sources from third parties believed to be accurate but does not warrant the accuracy of any third-party information. The testimony is not an offer to purchase or sell or a solicitation of an offer to purchase or sell any security, investment services or products.
Docket No. PL19-4-000 Exhibit No. JJM-01
Page 8 of 8


