BEFORE: Electricity Access Maps Used Prior to EI Data Collection Efforts
22
Indonesia NEP - Least cost electrification investment plan coordinated grid & off-grid access rollout, technology choice • Prepare a least-cost electrification roll-out plan for grid and off-grid communities to meet national targets by beneficiary type • Key digitized geo-referenced data layers for spatial least cost electrification rollout planning and costing platform - - Where are the MV lines today – Population settlements and patterns – Where are the schools, clinics, administrative centers • Earth Institute modeling platform – proof of concept funded and managed by World Bank (Kenya, Senegal, Rwanda)
-
Upload
boris-pickett -
Category
Documents
-
view
46 -
download
1
description
Indonesia NEP - Least cost electrification investment plan coordinated grid & off-grid access rollout, technology choice. Prepare a least-cost electrification roll-out plan for grid and off-grid communities to meet national targets by beneficiary type - PowerPoint PPT Presentation
Transcript of BEFORE: Electricity Access Maps Used Prior to EI Data Collection Efforts
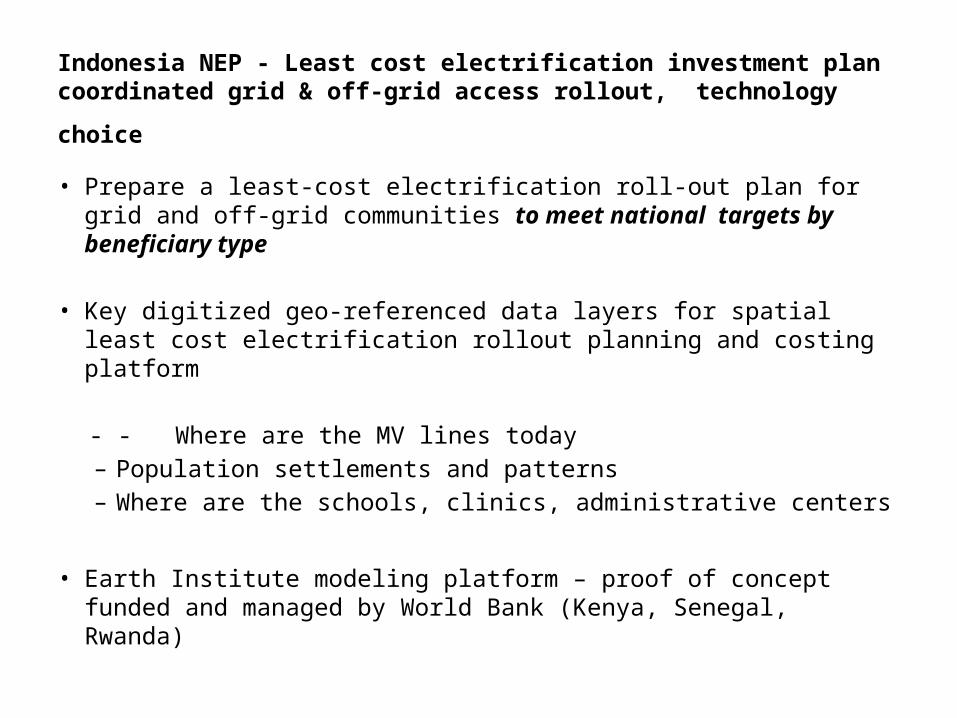
Indonesia NEP - Least cost electrification investment plan
coordinated grid & off-grid access rollout, technology choice
• Prepare a least-cost electrification roll-out plan for grid and off-grid communities to meet national targets by beneficiary type
• Key digitized geo-referenced data layers for spatial least cost electrification rollout planning and costing platform
- - Where are the MV lines today– Population settlements and patterns – Where are the schools, clinics, administrative centers
• Earth Institute modeling platform – proof of concept funded and managed by World Bank (Kenya, Senegal, Rwanda)

BEFORE: Electricity Access Maps Used Prior to EI Data Collection Efforts (Eastern Indonesia, 9/2012)
Electrified AreasArea Difficult to Reach
Medium VoltageConstrained MV Plans due to Protected ForestDiesel Plants

PLN staff training In Kupang, West Timor office for MV line data capture and digitization

4
EI Team Supports Local Utility Workers to Create MV Grid Map with smartphones – hands on training by doing

AFTER: MV Line Map Results from EI Data Collection Efforts (Eastern Indonesia, 4/2013)
*Average line data collection rate by vehicle was
50-100km/day (varies w/ road conditions)


7
• Satellite imagery or other high accuracy data source is used to geo-locate communities, including remote rural locations
Example Desa in Flores Island Group: Pondo, Lembor, NTT
Settlement Locations Data – nucleation patterns
1 km

8
• Communities are designated for grid expansion or off-grid systems based on least cost analysis
Example Desa in Flores Island Group: Pondo, Lembor, NTT
Coordinated grid and off-grid planning – target driven
1 km
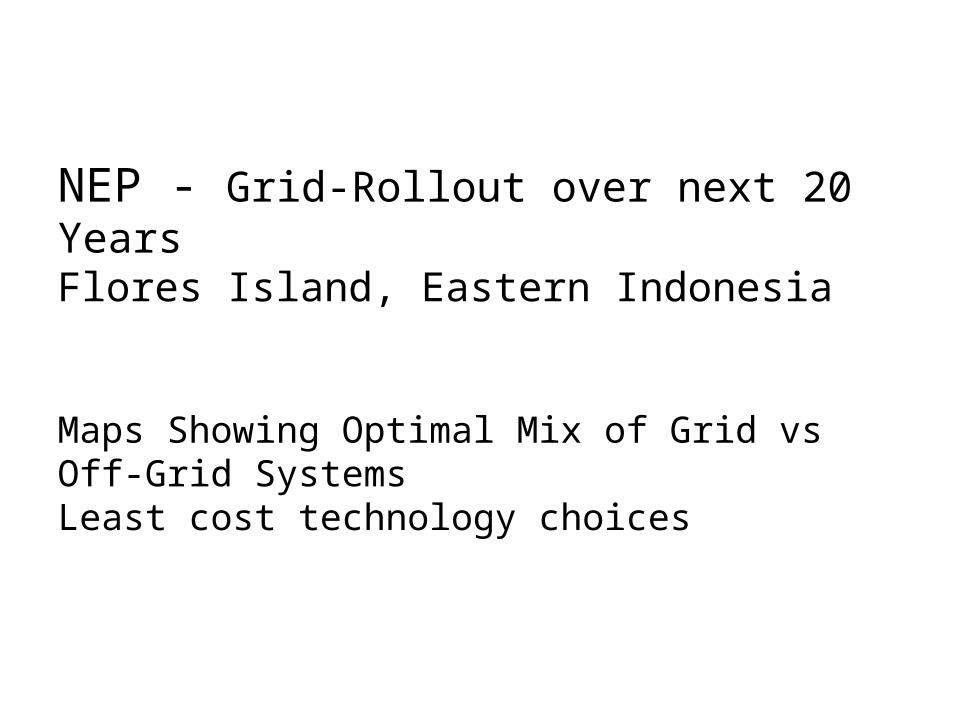
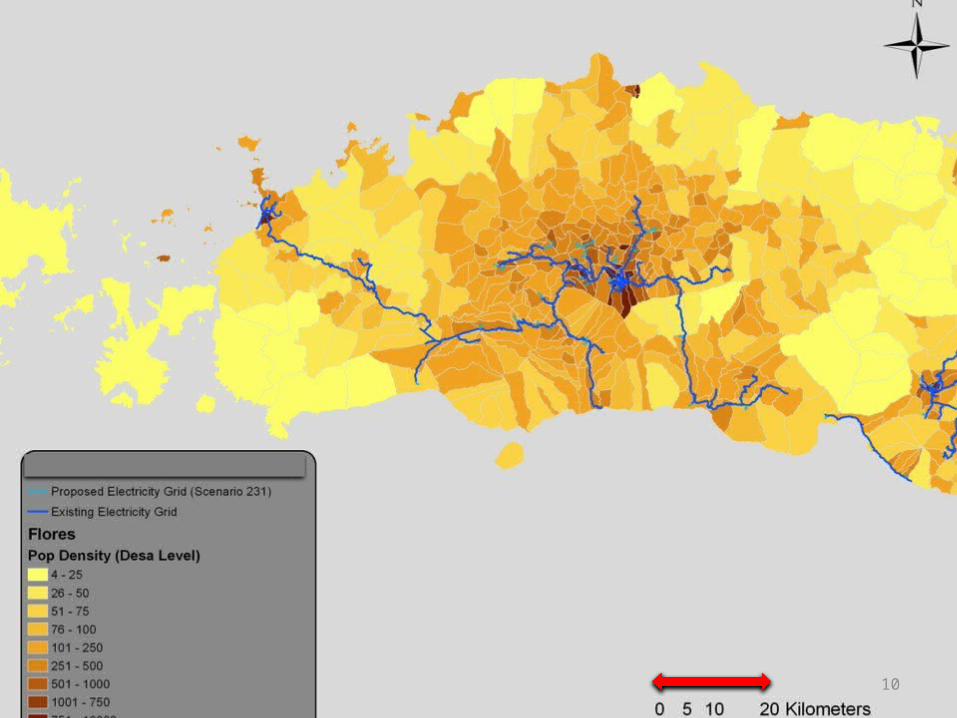
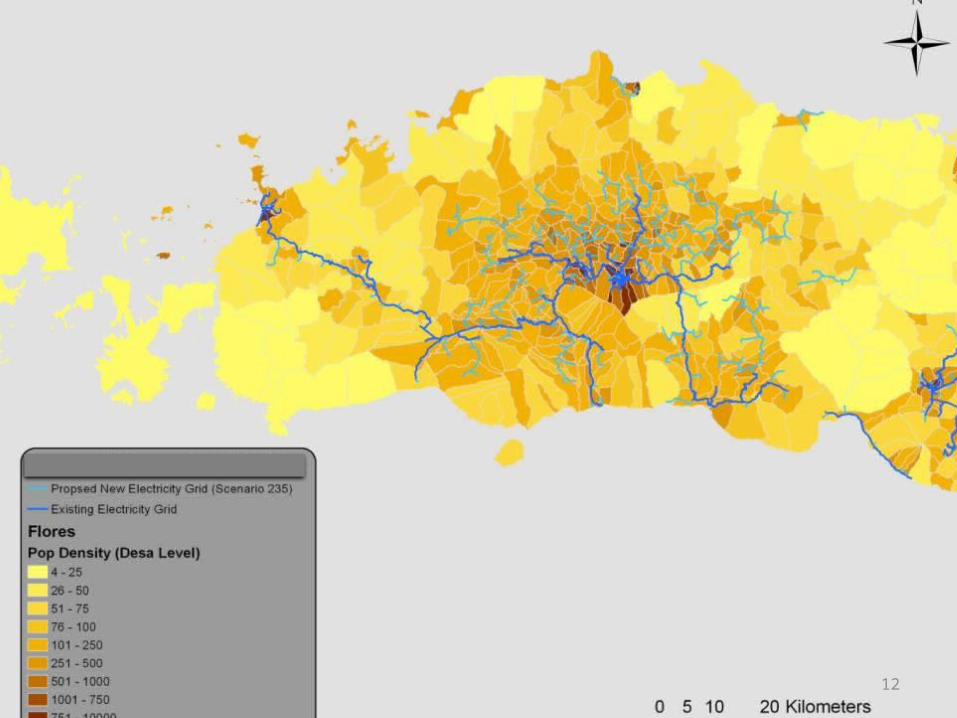
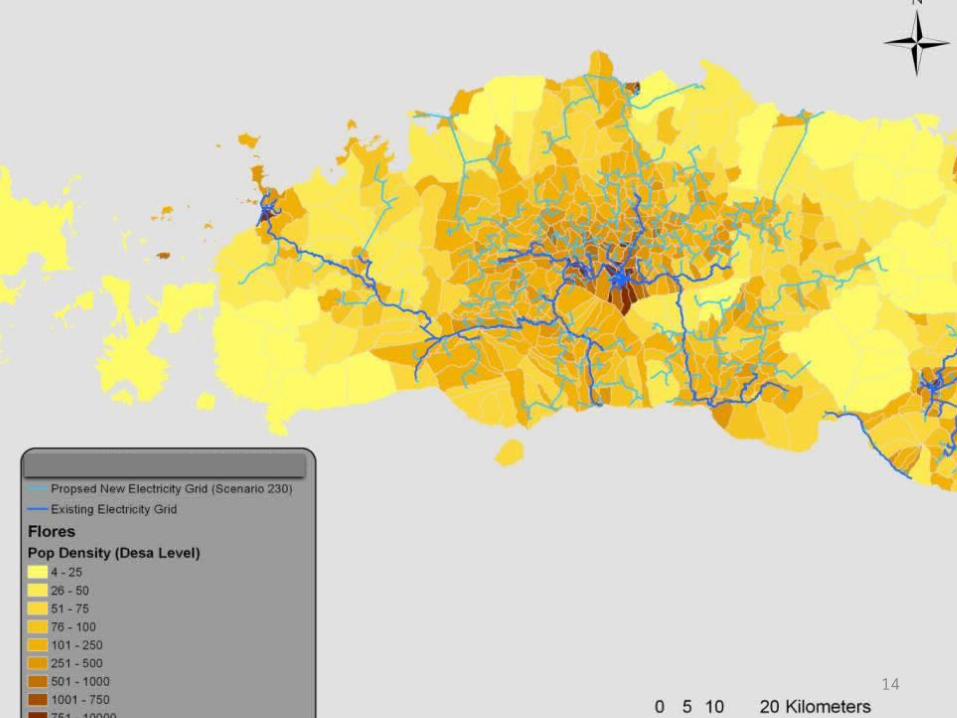
NEP - Grid-Rollout over next 20 YearsFlores Island, Eastern Indonesia
Maps Showing Optimal Mix of Grid vs Off-Grid SystemsLeast cost technology choices
10

11
12

13
14

15
All Flores Island Group

16
West Flores Island

Indonesia NEP
Least cost electrification configurations by settlement size

18
Grid “least-cost” expansion settlements
0-1011-20
21-50
51-100
101-250
251-500
501-1000>1000
0%10%20%30%40%50%60%70%80%90%
100%
Household SolarVillage Solar Mini-GridProposed GridGrid Connected
Bins: Number of Households per Settlement
Perc
enta
ge o
f Hou
seho
lds
by T
ech
Type

19
Proposed Grid: 166,000 HHsVillage Solar Mini-Grid: 84,000 HHs
020,00040,00060,00080,000
100,000120,000140,000
Household SolarVillage Solar Mini-GridProposed GridGrid Connected
Bins: Number of Households per Settlement
Tota
l Num
ber o
f H
ouse
hold
s by
Tec
h Ty
pe
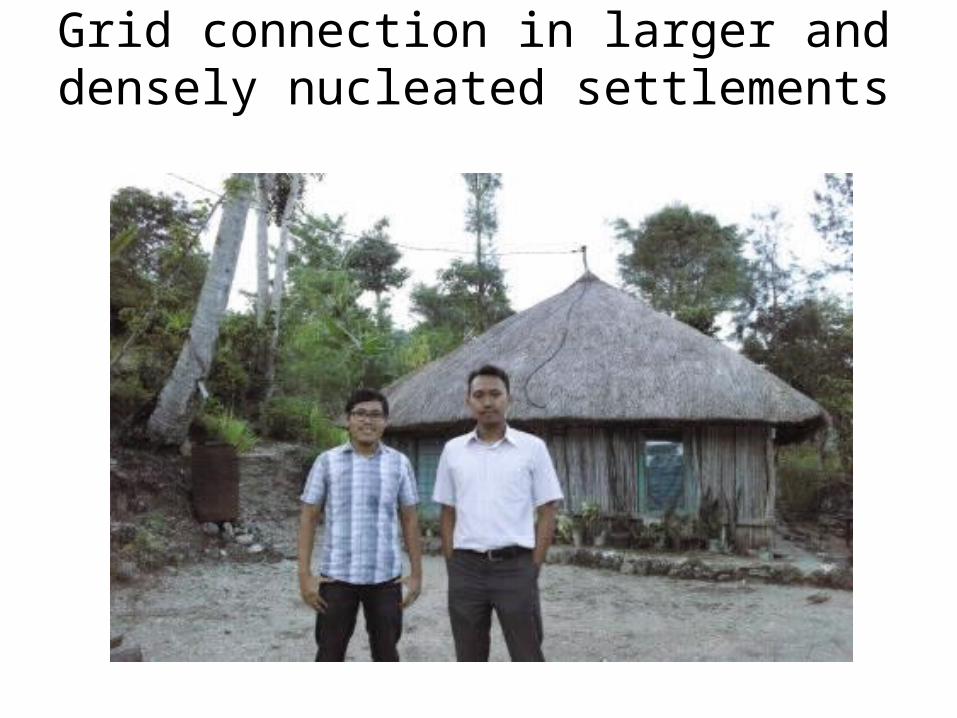
Grid connection in larger and densely nucleated settlements

100m or 300 ft

INSIDE SHED
STORAGE BATTERIESMETERING + COMM + uPROC INVERTER+CC+BREAKERS


![ôhJ aiueo bag— table [téibl a [ei C apple ] DhJC [ei ... · aiueo bag— table [téibl a [ei C apple ] DhJC [ei ] [béibi ] 6hJ CD [ei ! baby 20 . Author: OutlinePDF-Advance 4.01](https://static.fdocuments.in/doc/165x107/5fcb57a4c51287467d468c9c/hj-aiueo-baga-table-tibl-a-ei-c-apple-dhjc-ei-aiueo-baga-table.jpg)