Befesa Earnings Presentation FY 2014 FINAL VERSION … · Abengoa, €10m Triton as part of Initial...
35
BEFESA FY 2014 Earnings Presentation BEFESA 26 th February 2015
Transcript of Befesa Earnings Presentation FY 2014 FINAL VERSION … · Abengoa, €10m Triton as part of Initial...

BEFESA
FY 2014 Earnings Presentation
BEFESA
26th February 2015

BEFESA Forward-looking Statement
2
This presentation contains forward-looking statements and information relating to Befesa and its affiliates that are based on the beliefs
of its management as well as assumptions made and information currently available to Befesa and its affiliates.
Such statements reflect the current views of Befesa and its affiliates with respect to future events and are subject to risks, uncertainties
and assumptions.
Many factors could cause the actual results, performance or achievements of Befesa and its affiliates to be materially different from any
future results, performance or achievements that may be expressed or implied by such forward-looking statements, including, among
others: changes in general economic, political, governmental and business conditions globally and in the countries in which Befesa and
its affiliates does business; changes in interest rates; changes in inflation rates; changes in prices; decreases in government expenditure
budgets and reductions in government subsidies; changes to national and international laws and policies that support renewable energy
sources; inability to improve competitiveness of our renewable energy services and products; decline in public acceptance of renewable
energy sources; legal challenges to regulations, subsidies and incentives that support renewable energy sources and industrial waste
recycling; extensive governmental regulation in a number of different jurisdictions, including stringent environmental regulation; our
substantial capital expenditure and research and development requirements; management of exposure to credit, interest rate, exchange
rate and commodity price risks; the termination or revocation of our operations conducted pursuant to concessions; reliance on third-
party contractors and suppliers; acquisitions or investments in joint ventures with third parties; unexpected adjustments and
cancellations of our backlog of unfilled orders; inability to obtain new sites and expand existing ones; failure to maintain safe work
environments; effects of catastrophes, natural disasters, adverse weather conditions, unexpected geological or other physical conditions,
or criminal or terrorist acts at one or more of our plants; insufficient insurance coverage and increases in insurance cost; loss of senior
management and key personnel; unauthorized use of our intellectual property and claims of infringement by us of others intellectual
property; our substantial indebtedness; our ability to generate cash to service our indebtedness changes in business strategy and
various other factors.
Should one or more of these risks or uncertainties materialize, or should underlying assumptions prove incorrect, actual results may vary
materially from those described herein as anticipated, believed, estimated, expected or targeted.
Befesa and its affiliates does not intend, and does not assume any obligations, to update these forward-looking statements.

BEFESA
Rafael PérezHead of Strategy & Investor Relations
IntroductionBusiness
HighlightsZinc Business Performance
Non-Zinc Business Performance
FinancialsBusiness Outlook
Q&A Appendix
3

BEFESA
Javier MolinaChief Executive Officer
4
IntroductionBusiness
HighlightsZinc Business Performance
Non-Zinc Business Performance
FinancialsBusiness Outlook
Q&A Appendix
BEFESA Befesa 2014 Highlights
Solid and stable financing position at 3 levels (Zinc, Non-Zinc, Corporate) with total leverage at x4,4
Strategic growth projects moving forward in Germany, Korea, Turkey and the Gulf
Annual revenues of €651 million, Up 4% compared to 2013. Higher volumes in steel and secondary aluminum
Strong Annual EBITDA of €140 million, up 16% YoY. Margins at 21,6% above 19,2% of 2013. Cost savings and new South Korea plant
Cost savings plan delivering positive results in line with expectations
5

BEFESA
Asier ZarraonandiaManaging Director of Zinc Business
6
IntroductionBusiness
HighlightsZinc Business Performance
Non-Zinc Business Performance
FinancialsBusiness Outlook
Q&A Appendix

BEFESA Zinc Business Performance
Strong performance in crude steel in 2014 with growth in volumes. South Korean plant delivering at full capacity. Still weak stainless steel.
� EAF Throughput
- 156.084 tons of crude steel dust treated in 4Q 2014 (+1,9% vs. 4Q 2013), and 605.564 tons treated in FY 2014 (+10,5% vs. 2013)
� WOX Sales
- 55.491 tons of WOX sold in 4Q 2014 (+1,2% vs. 4Q 2013), and 208.918 tons sold in FY 2014 (+9,6% vs. 2013)
Highlights
� Crude steel dust deliveries in line with expectations
� Good throughput levels mainly driven by strong performance of our Western European plants
� Increase in crude steel throughput mainly explained by Korea plant operating at full speed (included from 3Q 2013)
� Still weak volumes in stainless steel
� No extraordinary stoppages apart from annual standstills
Operational Performance
� Stainless Steel Throughput:
- 29.035 tons of stainless steel dust treated in 4Q 2014 (+19,8% vs. 4Q 2013); 89.268 tons treated in FY 2014 (-15,7% vs. 2013)
7

BEFESA Zinc Prices & Hedging
Zinc prices during the 4Q 2014 maintained the upward trend seen during 2014 ending the quarter close to 1.800 €/t
Source: London Metal Exchange; Company data
1.000
1.200
1.400
1.600
1.800
2.000
2.200
LME Zinc Daily Cash Settlement Price (€/t) Zinc Hedging Price through Swaps (€/t)
Zinc Hedging Price through Options (€/t)
2012:1.703 €/t
2013:1.700 €/t
1.560 €/t
1Q 2014:1.550 €/t
2Q 2014:1.500 €/t
H2 ‘14 & H1 ‘15: Floor @ 1.300 €/t
Zinc Prices
� During the 4Q 2014 zinc prices traded above 2013 on average
� Attractive zinc fundamentals with world consumption of zinc, driven by China, outpacing world production resulting in a deficit in 1H’14.
Hedging Strategy
� Hedging strategy focused on ensuring min. business earnings to meet our financial obligations and benefit from recovering zinc prices
� Hedging closed for 2H 2014, full year 2015 and 1H 2016 through options with floor @ 1.300 €/t for 1H’15 and 1.250 for 2H’15 and 1H’16
� Preparing 2H 2016 hedging
€1.536/t
2013 & 2014
Average
1.000
1.200
1.400
1.600
1.800
2.000
LME Zinc Daily Cash Settlement Price (€/t) Avg LTM LME Zinc Daily Price (€/t)
4Q End > €1.750/t
8
4Q Full Year
2013 2014 % Var. 2013 2014 % Var.
BefesaBlended Zinc Price (€/t)
1.575 1.789 +14% 1.603 1.644 +3%
Avg. LMEZinc Price (€/t)
1.402 1.789 +28% 1.438 1.632 +13%
H2 ‘15 & H1 ‘16: Floor @ 1.250 €/t

BEFESA
Javier MolinaChief Executive Officer
9
IntroductionBusiness
HighlightsZinc Business Performance
Non-Zinc Business Performance
FinancialsBusiness Outlook
Q&A Appendix

BEFESA Aluminum Performance
Alu performance mainly driven by stronger secondary aluminum volumes while salt slag volumes remains in line with previous year
� Salt Slag/SPLs Recycled
- 120.660 tons of salt slag/SPL recycled in 4Q 2014 (+18% vs. 4Q 2013); 432.174 tons in FY 2014 (-1,1%vs. 2013)
� Secondary Aluminum Alloys
- 30.482 tons of alloys produced in 4Q 2014 (+2% vs. 4Q 2013); 126.464 tons in FY 2014 (+11% vs. 2013)
Highlights
� Strong secondary aluminum volumes over the 4Q (thanks to start of operations of Bernburg in Dec ‘14) and whole 2014versus previous year
� Good salt slag and SPLs volumes over the 4Q 2014 versus previous year helping to achieve full year similar performance (-1,1% compared to 2013)
Operational Performance
10
BEFESA 2014 Growth Strategy – Aluminum and IES
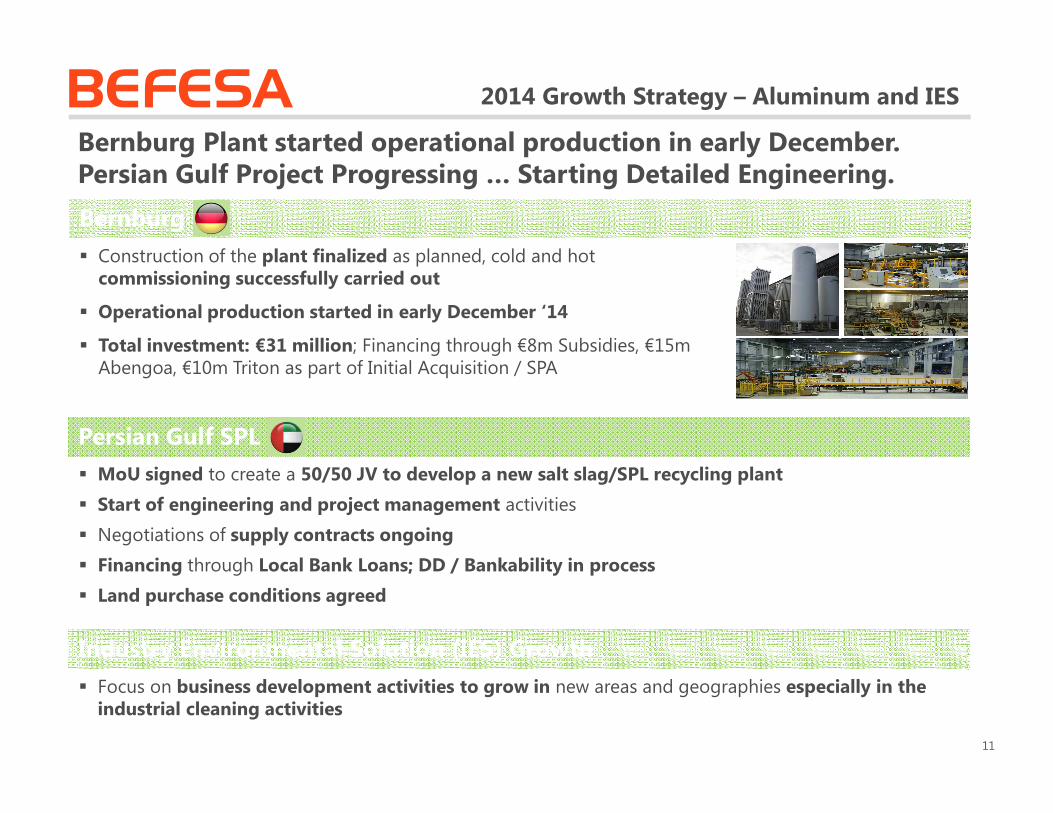
� Construction of the plant finalized as planned, cold and hot commissioning successfully carried out
� Operational production started in early December ‘14
� Total investment: €31 million; Financing through €8m Subsidies, €15m Abengoa, €10m Triton as part of Initial Acquisition / SPA
Bernburg
� MoU signed to create a 50/50 JV to develop a new salt slag/SPL recycling plant
� Start of engineering and project management activities
� Negotiations of supply contracts ongoing
� Financing through Local Bank Loans; DD / Bankability in process
� Land purchase conditions agreed
Persian Gulf SPL
� Focus on business development activities to grow in new areas and geographies especially in the industrial cleaning activities
Industry Environmental Solution (IES) Growth
Bernburg Plant started operational production in early December. Persian Gulf Project Progressing … Starting Detailed Engineering.
11

BEFESA
Wolf LehmannChief Financial Officer
12
IntroductionBusiness
HighlightsZinc Business Performance
Non-Zinc Business Performance
FinancialsBusiness Outlook
Q&A Appendix

BEFESA
Zinc Financial Highlights
13
IntroductionBusiness
HighlightsZinc Business Performance
Non-Zinc Business Performance
FinancialsBusiness Outlook
Q&A Appendix

BEFESA Crude Steel Financial Highlights
Strong crude steel segment 4Q EBITDA fueled by significant increase in zinc prices and operations in South Korea plant
Crude Steel Revenues (€m)
50,2
183,9
57,3
200,8
4Q '14 vs '13 FY '14 vs '13
Crude Steel EBITDA (€m)
21,3
77,5
26,9
88,8
4Q '14 vs '13 FY '14 vs '13
4Q Highlights Y-o-Y
� Crude steel dust segment revenues increased by 14% and EBITDA by 26% in 4Q YoY. Main drivers were:
- Zinc blended price increased by 14%
- 28% increase in average LME zinc pricescompared to 4Q 2013
- No zinc price hedging for 2H 2014, compared to 1.700 €/t closed for 2013
- 1% increase in tons of WOX soldcompared to 4Q 2013
- Cost saving contribution to higher EBITDA
FY Highlights Y-o-Y
� On an annual basis, crude steel dust segment revenues and EBITDA increased year over year by 9% and 15% respectively. Main drivers were:
- 9,6% increase in tons of WOX soldcompared to 2013 mainly driven by Korean plant
- 3% increase in zinc blended price
- 13% increase in average LME zinc prices
- Zinc price hedged @ 1.550 €/t for 1Q, ’14, @ 1.500 €/t for 2Q ‘14, and no hedging for 2H ’14; compared to 1.700 €/t closed for the whole 2013
- Cost saving contribution to higher EBITDA
42% 47% 42% 44%
2013 2014
2013 2014
% %2013 EBITDA margin 2014 EBITDA margin
2013 2014 14
BEFESA Stainless Steel Financial Highlights
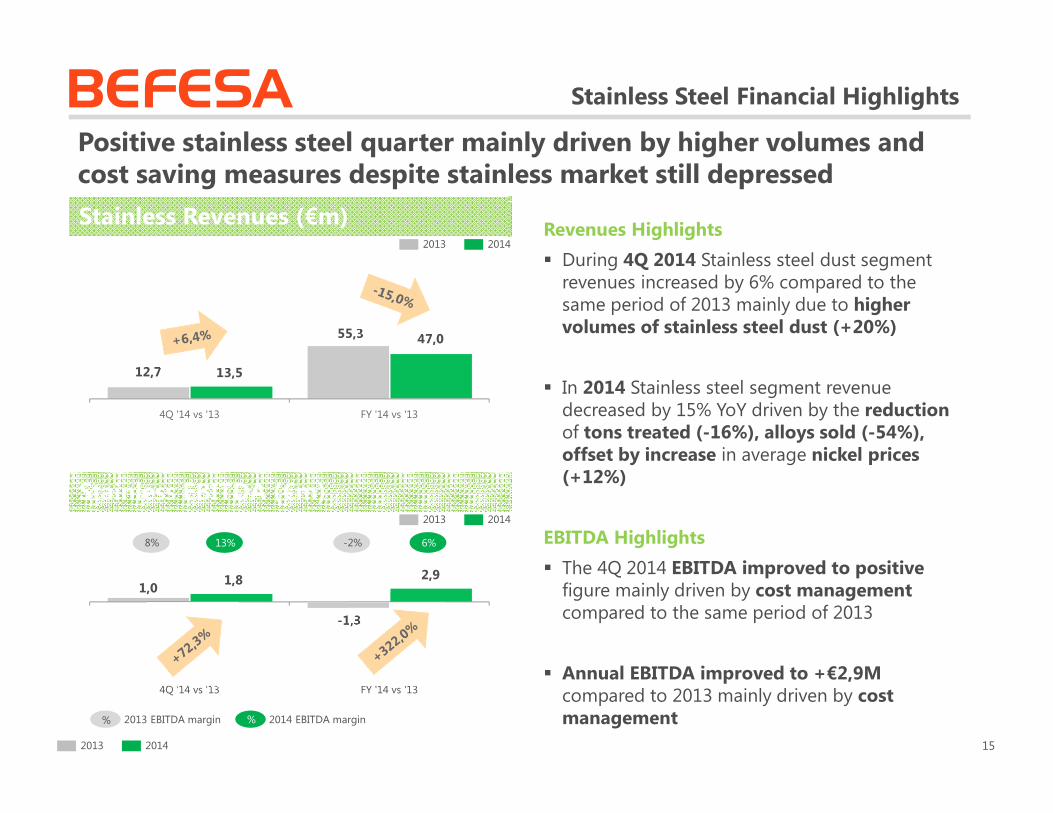
Positive stainless steel quarter mainly driven by higher volumes and cost saving measures despite stainless market still depressed
Revenues Highlights
� During 4Q 2014 Stainless steel dust segment revenues increased by 6% compared to the same period of 2013 mainly due to higher volumes of stainless steel dust (+20%)
� In 2014 Stainless steel segment revenue decreased by 15% YoY driven by the reduction of tons treated (-16%), alloys sold (-54%), offset by increase in average nickel prices (+12%)
EBITDA Highlights
� The 4Q 2014 EBITDA improved to positivefigure mainly driven by cost managementcompared to the same period of 2013
� Annual EBITDA improved to +€2,9Mcompared to 2013 mainly driven by cost management
Stainless Revenues (€m)
12,7
55,3
13,5
47,0
4Q '14 vs '13 FY '14 vs '13
Stainless EBITDA (€m)
1,0
-1,3
1,8 2,9
4Q '14 vs '13 FY '14 vs '13
8% 13% -2% 6%
2013 2014
2013 2014
% %2013 EBITDA margin 2014 EBITDA margin
2013 2014 15

BEFESA Zinc Cash Flow & Liquidity
Cash flow generation influenced by the results of the operations
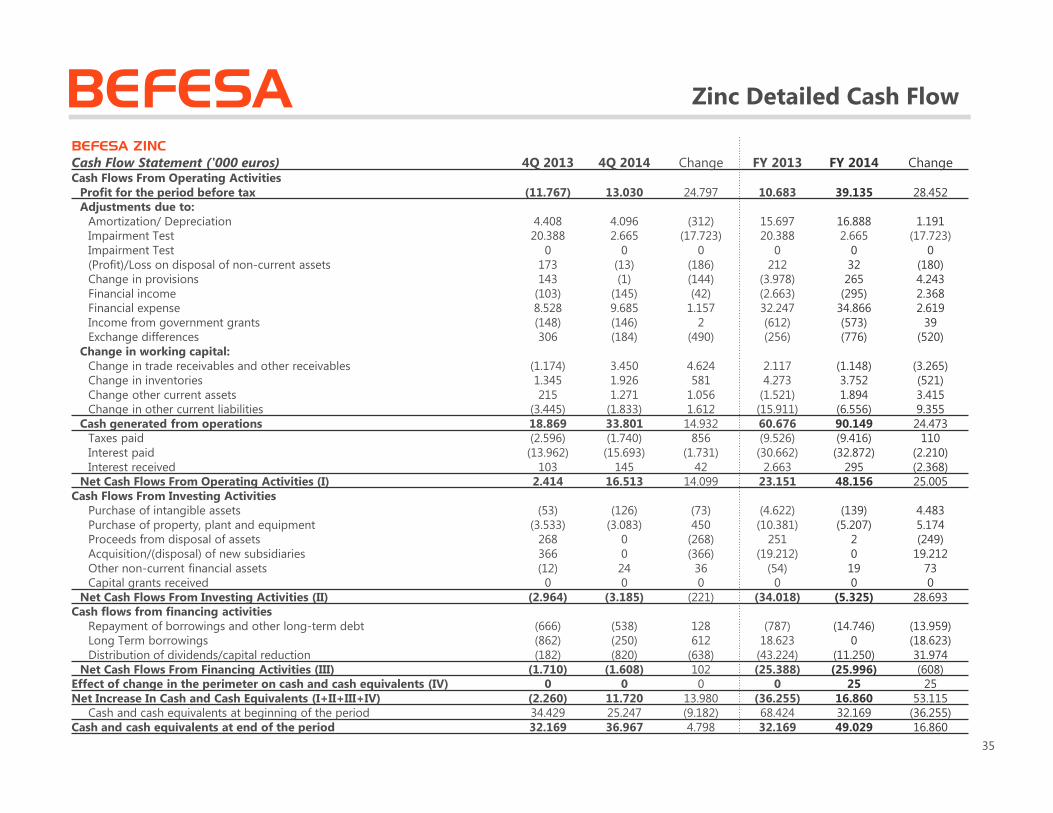
� Operating activities: During 2014 the net cash flows generated by operating activities amounted to €48,2 million (a €25,0 million increase compared to 2013), mainly driven by higher volumes of WOX sold, better zinc prices and cost saving measures
� Investing activities: During 2014 the net cash flows used in investing activities were €5,3 million primarily for maintenance needs of our plants.
� Financing activities: During 2014 Befesa Zinc paid a dividend to its shareholder for €10,3 million and additionally we used the € 12 million of equity contribution we made in South Korea (as part of the 3rd phase of the South Korea plant acquisition) to pay back part of the loan from the Korea´s minority shareholders that was still in our balance.
� Liquidity: As of December 31st 2014, our liquidity amounted to €49,0 million including cash on hand and short-term financial investments. Befesa Zinc is compliant with its debt covenants.
BEFESA ZINC
Cash Flow Statement ('000 euros) 4Q 2013 4Q 2014 Change FY 2013 FY 2014 Change
Cash generated from operations 18.869 33.801 14.932 60.676 90.149 24.473
Taxes paid (2.596) (1.740) 856 (9.526) (9.416) 110
Interest paid (13.962) (15.693) (1.731) (30.662) (32.872) (2.210)
Interest received 103 145 42 2.663 295 (2.368)
Net cash flows from operating activities (I) 2.414 16.513 14.099 23.151 48.156 25.005
Net cash flows from investing activities (II) (2.964) (3.185) (221) (34.018) (5.325) 28.693
Net cash flows from financing activities (III) (1.710) (1.608) 102 (25.388) (25.996) (608)
Effect in change of the perimeter (IV) 0 0 0 0 25 25
Net increase in cash and cash equivalents (I+II+III+IV) (2.260) 11.720 13.980 (36.255) 16.860 53.115
Cash and cash equivalents BoP 34.429 25.247 68.424 32.169
Cash and cash equivalents EoP 32.169 36.967 32.169 49.029
16

BEFESA
Aluminum Financial Highlights
17
IntroductionBusiness
HighlightsZinc Business Performance
Non-Zinc Business Performance
FinancialsBusiness Outlook
Q&A Appendix
BEFESA
Revenues Highlights
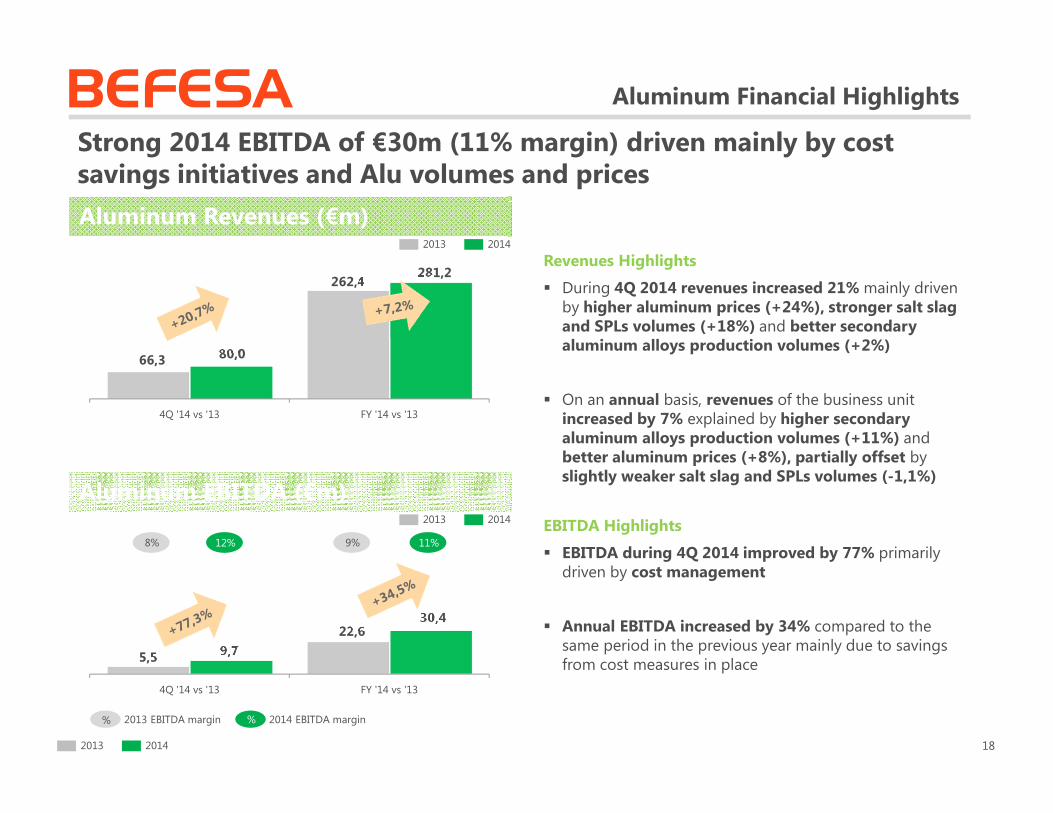
� During 4Q 2014 revenues increased 21% mainly driven by higher aluminum prices (+24%), stronger salt slag and SPLs volumes (+18%) and better secondary aluminum alloys production volumes (+2%)
� On an annual basis, revenues of the business unit increased by 7% explained by higher secondary aluminum alloys production volumes (+11%) and better aluminum prices (+8%), partially offset by slightly weaker salt slag and SPLs volumes (-1,1%)
EBITDA Highlights
� EBITDA during 4Q 2014 improved by 77% primarily driven by cost management
� Annual EBITDA increased by 34% compared to the same period in the previous year mainly due to savings from cost measures in place
Aluminum Financial Highlights
Strong 2014 EBITDA of €30m (11% margin) driven mainly by cost savings initiatives and Alu volumes and prices
Aluminum Revenues (€m)
66,3
262,4
80,0
281,2
4Q '14 vs '13 FY '14 vs '13
Aluminum EBITDA (€m)
5,5
22,6
9,7
30,4
4Q '14 vs '13 FY '14 vs '13
8% 12% 9% 11%
2013 2014
2013 2014
% %2013 EBITDA margin 2014 EBITDA margin
2013 2014 18
BEFESA
IES Financial Highlights
19
IntroductionBusiness
HighlightsZinc Business Performance
Non-Zinc Business Performance
FinancialsBusiness Outlook
Q&A Appendix
BEFESA IES Financial Highlights
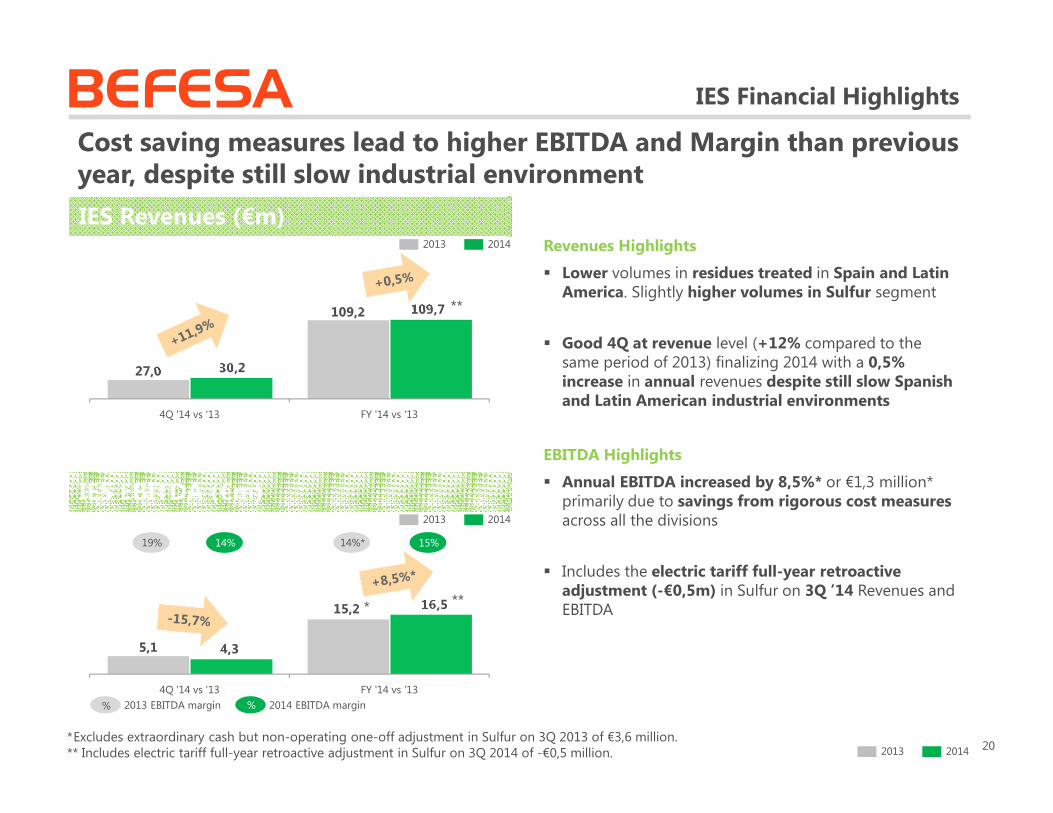
Cost saving measures lead to higher EBITDA and Margin than previous year, despite still slow industrial environment
IES Revenues (€m)
27,0
109,2
30,2
109,7
4Q '14 vs '13 FY '14 vs '13
IES EBITDA (€m)
5,1
15,2
4,3
16,5
4Q '14 vs '13 FY '14 vs '13
19% 14% 14%* 15%
2013 2014
2013 2014
% %2013 EBITDA margin 2014 EBITDA margin
Revenues Highlights
� Lower volumes in residues treated in Spain and Latin America. Slightly higher volumes in Sulfur segment
� Good 4Q at revenue level (+12% compared to the same period of 2013) finalizing 2014 with a 0,5% increase in annual revenues despite still slow Spanish and Latin American industrial environments
EBITDA Highlights
� Annual EBITDA increased by 8,5%* or €1,3 million* primarily due to savings from rigorous cost measuresacross all the divisions
� Includes the electric tariff full-year retroactive adjustment (-€0,5m) in Sulfur on 3Q ’14 Revenues and EBITDA
202013 2014
*Excludes extraordinary cash but non-operating one-off adjustment in Sulfur on 3Q 2013 of €3,6 million.** Includes electric tariff full-year retroactive adjustment in Sulfur on 3Q 2014 of -€0,5 million.
* **
**
BEFESA
Consolidated Financial Highlights
21
IntroductionBusiness
HighlightsZinc Business Performance
Non-Zinc Business Performance
FinancialsBusiness Outlook
Q&A Appendix
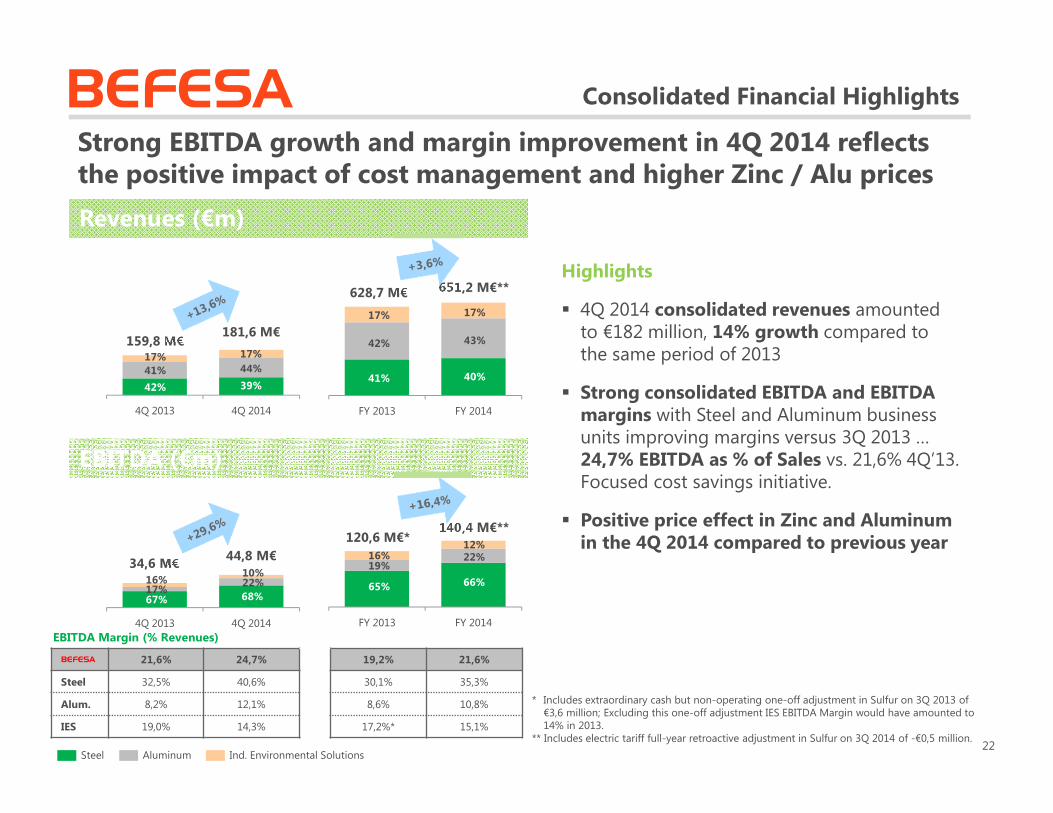
BEFESA Consolidated Financial Highlights
Highlights
� 4Q 2014 consolidated revenues amounted to €182 million, 14% growth compared to the same period of 2013
� Strong consolidated EBITDA and EBITDA margins with Steel and Aluminum business units improving margins versus 3Q 2013 … 24,7% EBITDA as % of Sales vs. 21,6% 4Q’13.Focused cost savings initiative.
� Positive price effect in Zinc and Aluminum in the 4Q 2014 compared to previous year
Revenues (€m)
EBITDA (€m)
4Q 2013 4Q 2014
159,8 M€
AluminumSteel Ind. Environmental Solutions
EBITDA Margin (% Revenues)
Strong EBITDA growth and margin improvement in 4Q 2014 reflects the positive impact of cost management and higher Zinc / Alu prices
FY 2013 FY 2014
181,6 M€
628,7 M€ 651,2 M€**
4Q 2013 4Q 2014
34,6 M€
FY 2013 FY 2014
44,8 M€
120,6 M€*140,4 M€**
BEFESA 21,6% 24,7% 19,2% 21,6%
Steel 32,5% 40,6% 30,1% 35,3%
Alum. 8,2% 12,1% 8,6% 10,8%
IES 19,0% 14,3% 17,2%* 15,1%
22
17%
43%
40%
17%
42%
41%
12%22%
66%
16%19%
65%
17%
41%
42%
17%
44%
39%
16%17%67%
10%22%
68%
* Includes extraordinary cash but non-operating one-off adjustment in Sulfur on 3Q 2013 of €3,6 million; Excluding this one-off adjustment IES EBITDA Margin would have amounted to 14% in 2013.
** Includes electric tariff full-year retroactive adjustment in Sulfur on 3Q 2014 of -€0,5 million.

BEFESA
BEFESA
Profit & Loss Statement ('000 euros) 4Q 2013 4Q 2014 Change FY 2013 FY 2014 Change
Revenue 159.826 181.562 21.736 628.655 651.193 22.538
EBITDA 34.595 44.832 10.237 120.640 140.405 19.765
Depreciation, amortisation and impairment provisions (51.062) (11.705) 39.357 (75.247) (46.283) 28.964
Financial result (10.846) (18.818) (7.972) (52.131) (61.900) (9.769)
Earnings Before Taxes (27.265) 14.432 41.697 (6.542) 32.520 39.062
Net Income (18.535) 8.325 26.860 (1.429) 20.940 22.369
Consolidated P&L
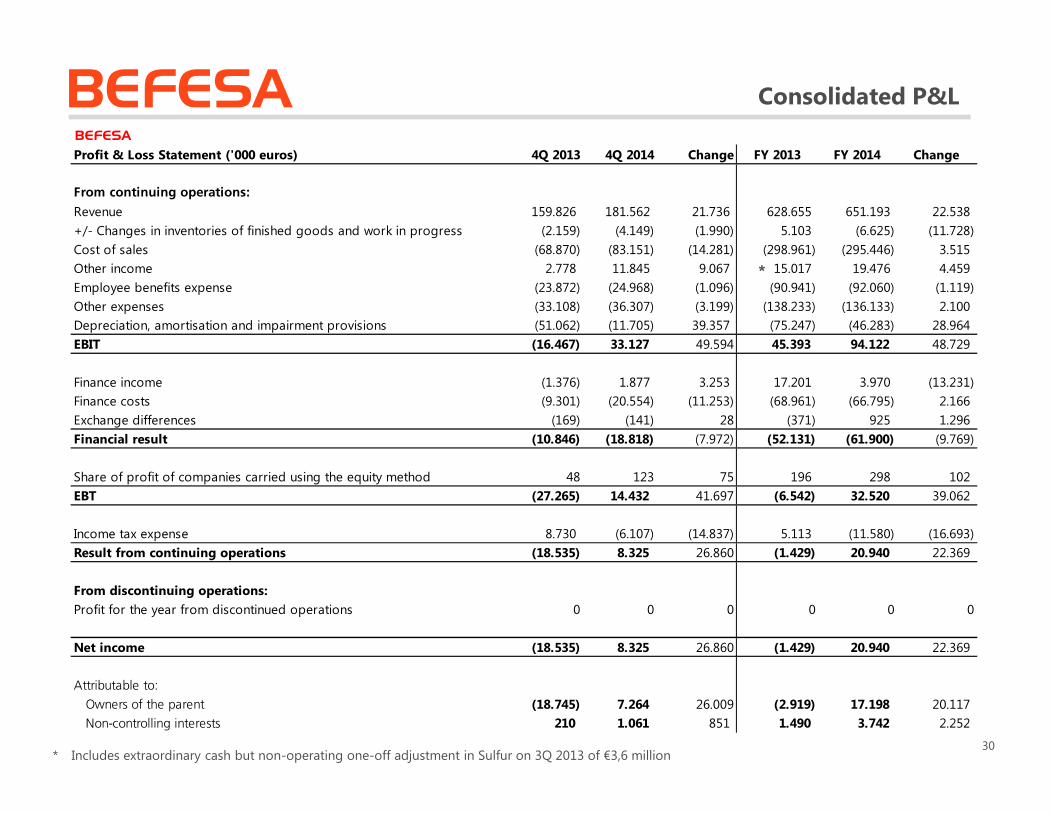
4Q 2014 EBITDA Up 30% or €10 million vs. 2013 … Net Income Up 145% or €27 million
Consolidated P&L (‘000 euros)
Highlights
� During 2014 the revenue of the Group amounted to 651 million euros (182 million in 4Q´14) and theEBITDA amounted to 140 million euros (45 million in 4Q´14). A 16,4% EBITDA YoY increase and a3,6% revenue YoY increase driven by cost and price improvements.
� Depreciation, amortization and impairment provisions in 2014 decreased 38% YoY, due to the extraordinary write-offs made in 2013 to the goodwill of some subsidiaries recorded in Befesa.
� Financial result in 2014 decreased 19% YoY driven principally by the extraordinary financial income in 2013 due to the sale of some subsidiaries linked to the purchase process of Befesa by Triton.
23* Includes extraordinary cash but non-operating one-off adjustment in Sulfur on 3Q 2013 of €3,6 million
*
BEFESA Consolidated Cash Flow Statement
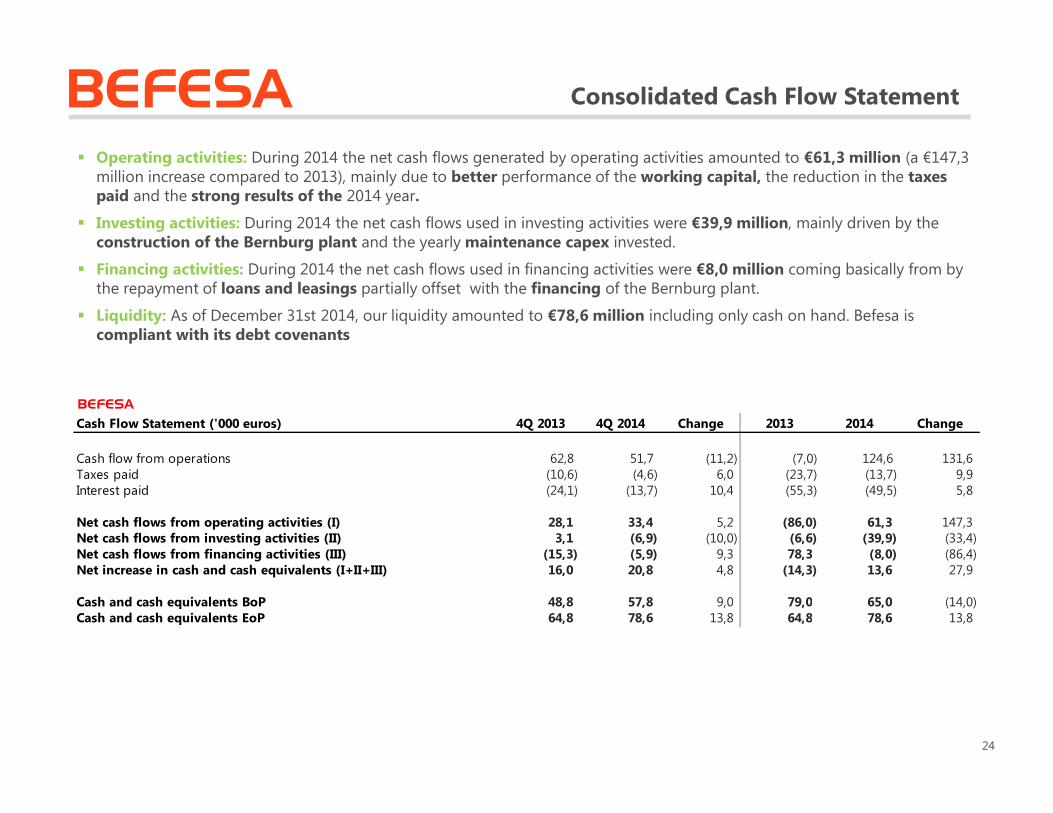
� Operating activities: During 2014 the net cash flows generated by operating activities amounted to €61,3 million (a €147,3 million increase compared to 2013), mainly due to better performance of the working capital, the reduction in the taxes paid and the strong results of the 2014 year.
� Investing activities: During 2014 the net cash flows used in investing activities were €39,9 million, mainly driven by the construction of the Bernburg plant and the yearly maintenance capex invested.
� Financing activities: During 2014 the net cash flows used in financing activities were €8,0 million coming basically from by the repayment of loans and leasings partially offset with the financing of the Bernburg plant.
� Liquidity: As of December 31st 2014, our liquidity amounted to €78,6 million including only cash on hand. Befesa is compliant with its debt covenants
24
BEFESA
Cash Flow Statement ('000 euros) 4Q 2013 4Q 2014 Change 2013 2014 Change
Cash flow from operations 62,8 51,7 (11,2) (7,0) 124,6 131,6Taxes paid (10,6) (4,6) 6,0 (23,7) (13,7) 9,9Interest paid (24,1) (13,7) 10,4 (55,3) (49,5) 5,8
Net cash flows from operating activities (I) 28,1 33,4 5,2 (86,0) 61,3 147,3Net cash flows from investing activities (II) 3,1 (6,9) (10,0) (6,6) (39,9) (33,4)Net cash flows from financing activities (III) (15,3) (5,9) 9,3 78,3 (8,0) (86,4)Net increase in cash and cash equivalents (I+II+III) 16,0 20,8 4,8 (14,3) 13,6 27,9
Cash and cash equivalents BoP 48,8 57,8 9,0 79,0 65,0 (14,0)Cash and cash equivalents EoP 64,8 78,6 13,8 64,8 78,6 13,8

BEFESASolid and stable financing position at 3 levels (Zinc, Non-Zinc and Corporate) with total leverage at x4,4
Debt Structure & Net Debt Position – Dec YTD 2014
300 20 6 326
134 15 5 154 10
160 650
82
568
BZ Bond Hankook Other Zinc Zinc Gross
Debt
Non-Zinc
Syndicated
Bernburg Other Non-
Zinc
Non-Zinc
Gross Debt
Public Entity
Debt
PIK Note Total Gross
Debt
Total Cash &
Equiv.
Total Net
Debt
Total Net Debt Position (Excl. Vendor Note & Factoring/Confirming): December YTD 2014 (€m)
x4,0(2)
(1) Excludes Factoring and Confirming of 57,4 M€(2) Assuming December 31st 2014 Consolidated EBITDA of 140,4 M€(3) Assuming December 31st 2014 Zinc EBITDA of 92,5 M€(4) Assuming December 31st 2014 Non Zinc EBITDA of 47,8 M€
Zinc Non Zinc Perimeter
Befesa Medio Ambiente
Vendor Note 50 M€PIK Note 160 M€
Net Debt(1)
278 M€
Ring fence structure
Net Debt(1)
130 M€
Net Debt / LTM Dec 2014 EBITDATotal Net
Debt(1) 618 M€x4,4(2)
Net Debt / LTM Dec 2014 EBITDA
x3,0(3)
Net Debt / LTM Dec 2014 EBITDA(4)
x2,7(4)
x#,# December YTD 2014 Net Debt / Dec. 31st 2014 Consolidated EBITDA 25

BEFESA
Javier MolinaChief Executive Officer
26
IntroductionBusiness
HighlightsZinc Business Performance
Non-Zinc Business Performance
FinancialsBusiness Outlook
Q&A Appendix

BEFESA 2015 Business Focus
Main priorities for 2015
• Expand plant and maintain leadership position of Befesa Zinc in South Korea, a key market for Befesa
• Deliver our new secondary aluminum plant in Bernburg to reach full capacity, as planned
• Maintain operational excellence efforts in order to achieve additional cost savings for 2015 in a sustainable manner
• Increase our presence in Turkey in steel dust as a key market for Befesa Zinc
• Grow in new geographies in IES business, specially in the services business
27
Main priorities for 2015 focused on parallel path of operational excellence and profitable growth for the next years

BEFESA
Questions
28
IntroductionBusiness
HighlightsZinc Business Performance
Non-Zinc Business Performance
FinancialsBusiness Outlook
Q&A Appendix

BEFESA
29
IntroductionBusiness
HighlightsZinc Business Performance
Non-Zinc Business Performance
FinancialsBusiness Outlook
Q&A Appendix
BEFESABEFESA
Profit & Loss Statement ('000 euros) 4Q 2013 4Q 2014 Change FY 2013 FY 2014 Change
From continuing operations:
Revenue 159.826 181.562 21.736 628.655 651.193 22.538
+/- Changes in inventories of finished goods and work in progress (2.159) (4.149) (1.990) 5.103 (6.625) (11.728)
Cost of sales (68.870) (83.151) (14.281) (298.961) (295.446) 3.515
Other income 2.778 11.845 9.067 15.017 19.476 4.459
Employee benefits expense (23.872) (24.968) (1.096) (90.941) (92.060) (1.119)
Other expenses (33.108) (36.307) (3.199) (138.233) (136.133) 2.100
Depreciation, amortisation and impairment provisions (51.062) (11.705) 39.357 (75.247) (46.283) 28.964
EBIT (16.467) 33.127 49.594 45.393 94.122 48.729
Finance income (1.376) 1.877 3.253 17.201 3.970 (13.231)
Finance costs (9.301) (20.554) (11.253) (68.961) (66.795) 2.166
Exchange differences (169) (141) 28 (371) 925 1.296
Financial result (10.846) (18.818) (7.972) (52.131) (61.900) (9.769)
Share of profit of companies carried using the equity method 48 123 75 196 298 102
EBT (27.265) 14.432 41.697 (6.542) 32.520 39.062
Income tax expense 8.730 (6.107) (14.837) 5.113 (11.580) (16.693)
Result from continuing operations (18.535) 8.325 26.860 (1.429) 20.940 22.369
From discontinuing operations:
Profit for the year from discontinued operations 0 0 0 0 0 0
Net income (18.535) 8.325 26.860 (1.429) 20.940 22.369
Attributable to:
Owners of the parent (18.745) 7.264 26.009 (2.919) 17.198 20.117
Non-controlling interests 210 1.061 851 1.490 3.742 2.252
Consolidated P&L
30* Includes extraordinary cash but non-operating one-off adjustment in Sulfur on 3Q 2013 of €3,6 million
*

BEFESA Consolidated Balance Sheet
31
BEFESA
Balance Sheet ('000 euros)
Assets 31.12.14 31.12.13 Equity and liabilities 31.12.14 31.12.13
Equity:
Non-current assets Attibutable to owners of the parent -Intangible assets Share capital 13 13
Goodwill 373.860 373.860 Reserve for valuation adjustments deferred in equity 9.355 9.632Other intangible assets 22.177 22.426 Share premium 400.495 400.495
396.037 396.286 Other reserves (250.276) (235.054)Property, plant and equipment - Translation differences (1.534) (3.991)
Property, plant and equipment in use 364.447 367.175 Net profit for the period 17.198 6.771Property, plant and equipment in progress 47.184 17.699 175.251 177.866
411.631 384.874 Non-controlling interests 35.581 36.392
Investments carried under the equity method 1.650 1.809 Total equity 210.832 214.258Non-current assets -
Securities portfolio 4.439 4.791 Non-current liabilities:
Other financial assets 21.453 32.995 Provisions 14.833 43.49325.892 37.786 Non-recourse borrowing 475.306 464.833
Deferred income tax assets 78.128 107.890 Recourse borrowings 110.737 121.629Total non-current assets 913.338 928.645 Finance lease payables 1.859 2.248
Deferred income tax liabilities 41.652 42.471Other non-current liabilities 106.725 69.219
Total non-current liabilities 751.112 743.893
Current assets: Non-recourse borrowings 7.965 10.165Inventories 41.900 41.206 Recourse borrowings 25.502 21.222
Trade and other receivables 77.432 66.769 Finance lease payables 1.162 1.068
Trade receivables, related parties 1.835 20.301 Trade payables, related parties 1.935 4.320Tax receivables 17.510 15.341 Trade and other accounts payable 106.627 116.544
Other receivables 4.490 8.447 Provisions 152 278
Other current financial assets 3.546 8.298 Other payables -Cash and cash equivalents 78.615 65.012 Taxes payable 16.633 13.887
Total current assets 225.328 225.374 Other current liabilities 16.746 28.38433.379 42.271
Total current liabilities 176.722 195.868
Total Assets 1.138.666 1.154.019 Total equity and liabilities 1.138.666 1.154.019

BEFESA Consolidated Cash Flow Statement
32
BEFESA
Cash Flow Statement ('000) 4Q 2013 4Q 2014 Change 2013 2014 Change
Cash flows from operating activities:
Profit (loss) for the period before tax (27.265) 14.432 41.697 (6.542) 32.520 39.062
Adjustments due to:
Depreciation and amortisation charge 12.685 9.261 (3.424) 36.870 43.839 6.969
Impairment losses on goodwill 32.435 - (32.435) 32.435 - (32.435)
Impairment losses on property, plant and equipment 7.616 2.622 (4.994) 7.616 2.622 (4.994)
Share of profit (loss) of associates (48) (123) (75) (196) (298) (102)
Changes in long-term provisions 2.508 37 (2.471) 2.392 (285) (2.677)
Interest income 1.375 (1.736) (3.111) (17.201) (4.895) 12.306
Finance costs 9.470 20.554 11.084 69.332 66.795 (2.537)
Other income/expenses (4.951) (801) 4.150 (5.500) (1.503) 3.997
Changes in working capital: Trade receivables and other current assets 12.565 3.502 (9.063) (10.268) (766) 9.502
Inventories (4.348) (9.754) (5.406) (12.166) 2.751 14.917
Trade payables 22.116 14.124 (7.992) (96.591) (13.043) 83.548
Other cash flows from operating activities:
Interest paid (24.141) (13.713) 10.428 (55.329) (49.543) 5.786
Taxes paid (10.572) (4.608) 5.964 (23.663) (13.733) 9.930
Provisions paid (1.316) (438) 878 (7.182) (3.160) 4.022
Net cash flows from operating activities (I) 28.129 33.359 5.230 (85.993) 61.301 147.294
Cash flows from investing activities: Investments in intangible assets (1.952) (3.167) (1.215) (4.251) (5.216) (965)
Investments in property, plant and equipment (7.508) (18.425) (10.917) (23.463) (44.927) (21.464)
Proceeds from disposal of assets 1.361 1.324 (37) 4.623 1.324 (3.299)
Proceeds from disposal of non-current financial assets (3.610) 28 3.638 (243) - 243
Investments in subsidiaries and other non-current financial assets 686 3.969 3.283 (18.058) (1.270) 16.788
Disbursement due to other current financial assets 12.279 7.153 (5.126) 32.975 7.576 (25.399)
Interests collected 1.832 1.721 (111) 1.832 2.117 285
Dividends - 458 458 - 458 458
Net cash flows from investing activities (II) 3.088 (6.939) (10.027) (6.585) (39.938) (33.353)
Cash flows from financing activities:
Net financial account with Group companies 1 (418) (419) 4.705 1.125 (3.580)
Bank borrowings and other non-current borrowings (9.419) 15.842 25.261 148.692 20.345 (128.347)
Repayment of bank borrowings and other long term debt (5.833) (21.065) (15.232) (75.079) (29.235) 45.844
Dividends paid (268) (268) - (268) (268)
Net cash flows from financing activities (III) (15.251) (5.909) 9.342 78.318 (8.033) (86.351)
Effect of foreign exchange rate changes on cash and cash equivalents - 273 273 - 273 273
Net increase in cash and cash equivalents (I+II+III+IV) 15.966 20.784 4.818 (14.260) 13.603 27.863
Cash and cash equivalents at beginning of year 48.813 57.831 9.018 79.039 65.012 (14.027)
Cash and cash equivalents at end of year 64.779 78.615 13.836 64.779 78.615 13.836
BEFESA Zinc Detailed Balance Sheet
33
BEFESA ZINC
Balance Sheet ('000 Euros)
Assets 31.12.2014 31.12.2013 Equity and Liabilities 31.12.2014 31.12.2013
Non-Current Assets: Equity:
Intangible assets: Of the Parent:
Goodwill 286.287 286.287 Share capital 25.010 25.010
Other intangible assets 6.973 8.818 Unrealized Asset and Liability Revaluation Reserve 6.767 7.322
293.260 295.105 Other reserves 68.911 82.093
Translation differences 1.174 (890)
Property, plant and equipment: Net profit for the year 24.961 6.235
Property, plant and equipment in use 119.505 127.802 126.823 119.770
Property, plant and equipment in the course of construction 10.864 3.561 Of Minority Interests 17.488 19.191
130.369 131.363 Total Equity 144.311 138.961
Investments accounted for using the equity method Non-Current Liabilities:
Non-current financial assets: Provisions for contingences and expenses 15.896 15.455
Investments securities 1.670 1.674 Bank borrowings and finance leases 1.012 2.174
Other financial assets 336 352 Non Recourse Finance 315.857 314.534
2.006 2.026 Capital Grants 2.144 2.717
Derivative financial instruments 464 0 Other non-current liabilities 12.593 227
Deferred tax assets 43.401 41.366 Derivative financial instruments 958 0
Total Non-Current Assets 469.500 469.860 Deferred tax liabilities 21.586 22.349
Total Non-Current Liabilities 370.046 357.456
Current Assets: Current Liabilities:
Inventories 12.638 12.944 Non Recourse Finance 3.688 3.699
Trade and other receivables 30.588 29.449 Bank borrowings and finance leases 1.604 2.627
Trade receivables, related companies 413 11.007 Trade payables, related companies 1.874 3.272
Tax receivables 5.240 3.846 Trade and other payables 28.542 28.345
Other receivables 1.289 3.503 Derivative financial instruments 2.434 0
Derivative financial instruments 139 236 Other payables:
Other current financial assets 28 0 Tax payables 9.100 5.383
Cash and cash equivalents 49.001 32.169 Other current liabilities 7.237 23.271
Total Current Assets 99.336 93.154 16.337 28.654
Total Current Liabilities 54.479 66.597
Total Assets 568.836 563.014 Total Equity and Liabilities 568.836 563.014

BEFESA Zinc Detailed P&L
BEFESA ZINC
Profit & Loss Statement ('000 euros) 4Q 2013 4Q 2014 Change FY 2013 FY 2014 Change
Revenue 67.080 74.971 7.891 253.181 262.156 8.975
Cost of sales (40.644) (43.695) (3.051) (159.036) (157.257) 1.779
Other operating income 957 4.732 3.775 5.007 10.804 5.797
Gross Profit 27.393 36.008 8.615 99.152 115.703 16.551
Depreciation and amortization charge (4.408) (4.096) 312 (15.697) (16.888) (1.191)
General and administrative expenses (5.633) (6.861) (1.228) (23.056) (23.220) (164)
Impairment losses (20.388) (2.665) 17.723 (20.388) (2.665) 17.723
Income From Operations (3.036) 22.386 25.422 40.011 72.930 32.919
Finance income 103 145 42 2.663 295 (2.368)
Finance costs (8.528) (9.685) (1.157) (32.247) (34.866) (2.619)
Exchange differences (gains and losses) (306) 184 490 256 776 520
Financial Loss (8.731) (9.356) (625) (29.328) (33.795) (4.467)
Profit Before Tax (11.767) 13.030 24.797 10.683 39.135 28.452
Income tax 2.876 (3.189) (6.065) (2.797) (11.751) (8.954)
Profit for the year from continuing operations (8.891) 9.841 18.732 7.886 27.384 19.498
Profit for the year (8.891) 9.841 18.732 7.886 27.384 19.498
Attributable to:
Shareholders of the parent (9.050) 9.252 18.302 6.235 24.961 18.726
Minority interests 159 589 430 1.651 2.423 772
EBITDA 21.760 29.147 7.387 76.096 92.483 16.387
34
BEFESA Zinc Detailed Cash Flow
BEFESA ZINC
Cash Flow Statement ('000 euros) 4Q 2013 4Q 2014 Change FY 2013 FY 2014 ChangeCash Flows From Operating Activities
Profit for the period before tax (11.767) 13.030 24.797 10.683 39.135 28.452Adjustments due to:
Amortization/ Depreciation 4.408 4.096 (312) 15.697 16.888 1.191Impairment Test 20.388 2.665 (17.723) 20.388 2.665 (17.723)Impairment Test 0 0 0 0 0 0(Profit)/Loss on disposal of non-current assets 173 (13) (186) 212 32 (180)Change in provisions 143 (1) (144) (3.978) 265 4.243Financial income (103) (145) (42) (2.663) (295) 2.368Financial expense 8.528 9.685 1.157 32.247 34.866 2.619Income from government grants (148) (146) 2 (612) (573) 39Exchange differences 306 (184) (490) (256) (776) (520)
Change in working capital:Change in trade receivables and other receivables (1.174) 3.450 4.624 2.117 (1.148) (3.265)Change in inventories 1.345 1.926 581 4.273 3.752 (521)Change other current assets 215 1.271 1.056 (1.521) 1.894 3.415Change in other current liabilities (3.445) (1.833) 1.612 (15.911) (6.556) 9.355
Cash generated from operations 18.869 33.801 14.932 60.676 90.149 24.473Taxes paid (2.596) (1.740) 856 (9.526) (9.416) 110Interest paid (13.962) (15.693) (1.731) (30.662) (32.872) (2.210)Interest received 103 145 42 2.663 295 (2.368)
Net Cash Flows From Operating Activities (I) 2.414 16.513 14.099 23.151 48.156 25.005Cash Flows From Investing Activities
Purchase of intangible assets (53) (126) (73) (4.622) (139) 4.483Purchase of property, plant and equipment (3.533) (3.083) 450 (10.381) (5.207) 5.174Proceeds from disposal of assets 268 0 (268) 251 2 (249)Acquisition/(disposal) of new subsidiaries 366 0 (366) (19.212) 0 19.212Other non-current financial assets (12) 24 36 (54) 19 73Capital grants received 0 0 0 0 0 0
Net Cash Flows From Investing Activities (II) (2.964) (3.185) (221) (34.018) (5.325) 28.693Cash flows from financing activities
Repayment of borrowings and other long-term debt (666) (538) 128 (787) (14.746) (13.959)Long Term borrowings (862) (250) 612 18.623 0 (18.623)Distribution of dividends/capital reduction (182) (820) (638) (43.224) (11.250) 31.974
Net Cash Flows From Financing Activities (III) (1.710) (1.608) 102 (25.388) (25.996) (608)Effect of change in the perimeter on cash and cash equivalents (IV) 0 0 0 0 25 25Net Increase In Cash and Cash Equivalents (I+II+III+IV) (2.260) 11.720 13.980 (36.255) 16.860 53.115
Cash and cash equivalents at beginning of the period 34.429 25.247 (9.182) 68.424 32.169 (36.255)Cash and cash equivalents at end of the period 32.169 36.967 4.798 32.169 49.029 16.860
35