BEEF & VEAL MARKET SITUATION
29
BEEF & VEAL MARKET SITUATION "Single CMO" Management Committee 29 August 2013
-
Upload
wilma-farmer -
Category
Documents
-
view
26 -
download
4
description
BEEF & VEAL MARKET SITUATION. " Single CMO " Management Committee 29 August 2013. P R O D U C T I O N. H I S T O R I C T O N N E S. P R O D U C T I O N. % E V O L U T I O N T O N N E S. P R O D U C T I O N. E.U. E V O L U T I O N T O N N E S. P R I C E S - PowerPoint PPT Presentation
Transcript of BEEF & VEAL MARKET SITUATION

BEEF & VEALMARKET SITUATION
"Single CMO" Management Committee 29 August 2013

2
P R O D U C T I O N P R O D U C T I O N H I S T O R I C
T O N N E S
H I S T O R I C
T O N N E S
0
100
200
300
400
500
600
700
800
Jan Feb Mar Apr May Jun Jul Aug Sep Oct Nov Dec
1.00
0 T
on
ne
s
2 0 1 1 2 0 1 2 2 0 1 3
Beef & Veal Production (E27 Slaughtering) - Tonnes
Source : EStat-Newcronos

3
P R O D U C T I O N P R O D U C T I O N % E V O L U T I O N
T O N N E S
% E V O L U T I O N
T O N N E S
Estimates for last month of period : Source : EStat - Newcronos
TONNESEU 15 EU 27
Jan-May 13/12
-5,2%
-5,1%
-5,9%
-3,3%
Cow
Bullock -3,1%
-5,4%
-6,1%
Meat of bovine
animals-3,8%-4,1%
+2,7% +3,0%Young cattle
Calve
-5,5%
Heifer
Bull -2,8%
-3,0%-7
,2%
+26,
1%-1
,8%
+2,4
%-6
,7%
+5,3
%+5
,3%
-8,0
%-0
,0%
-5,4
%-1
1,4%
+26,
3%+1
,3% +3
,4%
-8,7
%-2
,0%
+9,7
%+2
,3%
+3,6
%-1
,4%
-12,
3%+1
6,7%
-5,4
%-0
,4%
-0,1
%+3
,3%
-3,5
%
- 20 %
- 10 %
0%
+ 10 %
+ 20 %
+ 30 %
- 20 %
- 10 %
0%
+ 10 %
+ 20 %
+ 30 %
BE BG CZ DK DE EE IE EL ES FR IT CY LV LT LU HU MT NL AT PL PT RO SI SK FI SE UK
EU : - 3,8%

4
P R O D U C T I O N P R O D U C T I O N E.U. E V O L U T I O N
T O N N E S
E.U. E V O L U T I O N
T O N N E S
0
100
200
300
400
500
600
B E B G C Z D K D E E E I E E L E S F R I T C Y L V L T L U H U M T N L A T P L P T R O S I S K F I S E U K
Cow
Bullock
Bull
Heifer
Youngcattle
Calves
Source : EStat Newcronos 1000 TONNES : Jan-May 12 / Jan-May 13

5
E.U. E V O L U T I O N
All CAT GLOBAL VIEW
E.U. E V O L U T I O N
All CAT GLOBAL VIEW
P R I C E S C A R C A S S E S P R I C E S C A R C A S S E S
200
250
300
350
400
450
2007 2008 2009 2010 2011 2012 2013
A R3
C R3
D O3
E R3
Source : Member StatesLast Update : Week 33 - 2013

6
P R I C E S C A R C A S S E S P R I C E S C A R C A S S E S
E.U. E V O L U T I O N
Y O U N G B U L L – A.R3
E.U. E V O L U T I O N
Y O U N G B U L L – A.R3
372,05 372,45% change y/y : - 4,4% % change y/y : - 1,2%
Price in week 33 : Average price in July 2013 :
300
320
340
360
380
400
420
300
320
340
360
380
400
420
Jan Feb Mar Apr May Jun Jul Aug Sep Oct Nov Dec
2006-2010 Avg 2011 2012 2013
Source : Member States A - R 3 > Wk.33-2013

7
E.U. E V O L U T I O N
S T E E R – C.R3
E.U. E V O L U T I O N
S T E E R – C.R3
P R I C E S C A R C A S S E S P R I C E S C A R C A S S E S
423,22 436,18% change y/y : + 4,1% % change y/y : + 6,7%
Price in week 33 : Average price in July 2013 :
280
300
320
340
360
380
400
420
440
460
280
300
320
340
360
380
400
420
440
460
Jan Feb Mar Apr May Jun Jul Aug Sep Oct Nov Dec
2006-2010 Avg 2011 2012 2013
Source : Member States C - R 3 > Wk.33-2013

8
E.U. E V O L U T I O N
A / C . R3
E.U. E V O L U T I O N
A / C . R3
P R I C E S C A R C A S S E S P R I C E S C A R C A S S E S
383,42 385,42% change y/y : - 2,6% % change y/y : + 0,5%
172,4%% Ref. Price in wk 33 :
Price in week 33 : Average price in July 2013 :
289,1
311,4
333,6
355,8
378,1
400,3
422,6
130%
140%
150%
160%
170%
180%
190%
Jan Feb Mar Apr May Jun Jul Aug Sep Oct Nov Dec
€/100 kg cwe
2006-2010 Avg 2011 2012 2013
% of Reference Price
Source : Member States AC - R 3 > Wk.33-2013

9
E.U. E V O L U T I O N
C O W – D.O3
E.U. E V O L U T I O N
C O W – D.O3
P R I C E S C A R C A S S E S P R I C E S C A R C A S S E S
315,65 325,99% change y/y : - 3,3% % change y/y : + 1,7%
Price in week 33 : Average price in July 2013 :
210
230
250
270
290
310
330
350
210
230
250
270
290
310
330
350
Jan Feb Mar Apr May Jun Jul Aug Sep Oct Nov Dec
2006-2010 Avg 2011 2012 2013
Source : Member States D - O 3 > Wk.33-2013

10
E.U. E V O L U T I O N
H E I F E R – E.R3
E.U. E V O L U T I O N
H E I F E R – E.R3
P R I C E S C A R C A S S E S P R I C E S C A R C A S S E S
409,46 417,43% change y/y : + 4,4% % change y/y : + 8,1%
Price in week 33 : Average price in July 2013 :
300
320
340
360
380
400
420
440
300
320
340
360
380
400
420
440
Jan Feb Mar Apr May Jun Jul Aug Sep Oct Nov Dec
2006-2010 Avg 2011 2012 2013
Source : Member States E - R 3 > Wk.33-2013

11
Male store cattle (6-12 months; ≤ 300 kg – €/100 kg live weight)
E.U. E V O L U T I O N
MALE STORE CATTLE
E.U. E V O L U T I O N
MALE STORE CATTLE
P R I C E S L I V E B O V I N E S P R I C E S L I V E B O V I N E S
245,06 249,81% change y/y : - 6,8% % change y/y : - 6,4%
Price in week 33 : Average price in July 2013 :
200
210
220
230
240
250
260
270
200
210
220
230
240
250
260
270
Jan Feb Mar Apr May Jun Jul Aug Sep Oct Nov Dec
2006-2010 Avg 2011 2012 2013
Source : Member BROUT > Wk.33-2013

12
Male calves aged between 8 days and 4 weeks (€/head)
P R I C E S L I V E B O V I N E S P R I C E S L I V E B O V I N E S
E.U. E V O L U T I O N
Male Calves – 8D4W
E.U. E V O L U T I O N
Male Calves – 8D4W
197,03 217,96% change y/y : - 21,6% % change y/y : - 17,0%
Price in week 33 : Average price in July 2013 :
160
180
200
220
240
260
280
160
180
200
220
240
260
280
Jan Feb Mar Apr May Jun Jul Aug Sep Oct Nov Dec
2006-2010 Avg 2011 2012 2013
Source : Member 8D4W > Wk.33-2013

13
Butcher calves (€/100 kg cw)
P R I C E S L I V E B O V I N E S P R I C E S L I V E B O V I N E S
E.U. E V O L U T I O N
Butcher Calves
E.U. E V O L U T I O N
Butcher Calves
530,63 533,66% change y/y : + 1,8% % change y/y : + 2,0%
Price in week 33 : Average price in July 2013 :
460
480
500
520
540
560
580
600
460
480
500
520
540
560
580
Jan Feb Mar Apr May Jun Jul Aug Sep Oct Nov Dec
2006-2010 Avg 2011 2012 2013
Source : Member BOUCH > Wk.33-2013

14
M A R G I N M A R G I N E.U. E V O L U T I O N
Animal + Feed Purchase COST
E.U. E V O L U T I O N
Animal + Feed Purchase COST
0
50
100
150
200
250
300
350
400
450
0
100
200
300
400
| 2009 | 2010 | 2011 | 2012 | 2013 |
€u
ro/
he
ad
Remainder of: Selling price AR 3,minus purchased calf plus feedcost for grain fattening
Remainder Young Bulls A.R 3 Extra gain of FCR between 7- 6 Feedcost x*7 average remainder incl. extra gain
Feed conversion rate: (FCR) 7 or 6 kg feed = 1kg live weight.Feed ration: 40% compound feed (energy + proteine), 15% barley, 15% maize, 20% wheat, 10% straw Carcase yield: 0.57

15
M A R G I N M A R G I N E.U. E V O L U T I O N
Animal + Feed Purchase COST
E.U. E V O L U T I O N
Animal + Feed Purchase COST
0
100
200
300
400
500
0
100
200
300
400
500
| 2009 | 2010 | 2011 | 2012 | 2013 |
€u
ro/
he
ad
Remainder of: Selling price AR 3,minus purchased calf plus feedcost for grain/ grass fattening.
Remainder Young Bulls A.R 3 Extra gain of FCR between 7- 6 Feedcost x*7 average remainder incl. extra gain
Feed conversion rate: (FCR) 7 or 6 kg feed = 1kg live weight.Feed ration: 62,7% fodder (silage maize), 18,6% grains (maize + wheat, 13,3% soja cake, 5,3% straw Carcase yield: 0.57

16
EU exports of beef and live animals (1):Trade figures (COMEXT – tonnes cwe)
DestinationsDestinations
T R A D E T R A D E E.U. E X P O R T S
Beef & Live Animals
E.U. E X P O R T S
Beef & Live Animals
2009 2010 Compared
tonnes % tonnes % tonnes % tonnes % tonnes % to Jan-Jun 12
Russia 50 881 20.4% 135 991 27.9% 138 910 21.8% 98 433 19.0% 32 494 15.3% - 26.1%
Algeria 6 681 2.7% 16 259 3.3% 17 970 2.8% 17 324 3.3% 11 812 5.6% + 70.9%
Switzerland 19 072 7.7% 22 352 4.6% 26 432 4.2% 19 570 3.8% 12 594 5.9% + 39.0%
Lebanon 7 838 3.1% 33 815 6.9% 23 275 3.7% 24 100 4.6% 13 959 6.6% + 40.8%
Turkey 571 0.2% 71 029 14.6% 166 753 26.2% 100 742 19.4% 3 740 1.8% - 93.4%
Other Destinations 138 995 55.8% 184 016 37.8% 238 154 37.4% 236 730 45.6% 120 440 56.6% + 14.1%
EXTRA EU 249 165 486 621 636 480 518 880 212 612
% change + 95% + 31% - 18% - 13.7%
2011 Jan-Jun 132012

17
EU exports of beef and live animals:Trade figures (COMEXT)
386 646
233 671
154 574
122 740
85 178
292 401
318 207
369 883
949 259
776 196
633 986
0
100 000
200 000
300 000
400 000
500 000
600 000
700 000
800 000
900 000
1 000 000
Jan-Jun 11 Jan-Jun 12 Jan-Jun 13
1,0
00 E
UR
EU EXPORTS of Beef & Veal (1000 EUR)
Turkey Russia GhanaLebanon Hong Kong AlgeriaOther destinations
99 77856 944
65 773
43 982
32 494
106 618
105 567
120 440
315 100
246 415
212 612
0
50 000
100 000
150 000
200 000
250 000
300 000
350 000
Jan-Jun 11 Jan-Jun 12 Jan-Jun 13
Tonnes c
w
EU EXPORTS of Beef & Veal (Tonnes cwe)
Turkey Russia Ghana
Lebanon Hong Kong Algeria
Other destinations
T R A D E T R A D E E.U. E X P O R T S
Beef & Live Animals
E.U. E X P O R T S
Beef & Live Animals

18
0
10 000
20 000
30 000
40 000
50 000
60 000
70 000
80 000
|Jan06
2006 |Jan07
2007 |Jan08
2008 |Jan09
2009 |Jan10
2010 |Jan11
2011 |Jan12
2012 |Jan13
in Tonnes cwe
EU-28 Exports of BEEF products
LIVE ANIMALS FRESH FROZEN PREPARED OTHERS
T R A D E T R A D E E.U. E X P O R T S
B e e f P r o d u c t s
E.U. E X P O R T S
B e e f P r o d u c t s

19
EU beef Exports to TURKEYTrade figures (COMEXT data) tonnes cwe
T R A D E T R A D E E.U. E X P O R T S
B e e f t o T U R K E Y
E.U. E X P O R T S
B e e f t o T U R K E Y
0
5 000
10 000
15 000
20 000
25 000
30 000
35 000
40 000
Ja
n 1
0
Feb
10
Ma
r 1
0
Ap
r 10
Ma
y 1
0
Ju
n 1
0
Ju
l 1
0
Au
g 1
0
Se
p 1
0
Oct
10
No
v 1
0
De
c 1
0
Ja
n 1
1
Feb
11
Ma
r 1
1
Ap
r 11
Ma
y 1
1
Ju
n 1
1
Ju
l 1
1
Au
g 1
1
Se
p 1
1
Oct
11
No
v 1
1
De
c 1
1
Ja
n 1
2
Feb
12
Ma
r 1
2
Ap
r 12
Ma
y 1
2
Ju
n 1
2
Ju
l 1
2
Au
g 1
2
Se
p 1
2
Oct
12
No
v 1
2
De
c 1
2
Ja
n 1
3
Feb
13
Ma
r 1
3
Ap
r 13
Ma
y 1
3
Ju
n 1
3
Fresh Bovine "Compensated" quarters
Fresh Bovine (un)-separated Forequarters
Fresh Bovine (un)-separated Hindquarters
Frozen Bovine "Compensated" quarters
Live Animals
TOTAL

20
EU beef Exports to RUSSIATrade figures (COMEXT data) tonnes cwe
T R A D E T R A D E E.U. E X P O R T S
B e e f t o R U S S I A
E.U. E X P O R T S
B e e f t o R U S S I A
0
2 000
4 000
6 000
8 000
10 000
12 000
14 000
16 000
18 000
20 000
22 000
24 000
Jan 1
0
Fe
b 1
0
Ma
r 10
Ap
r 1
0
Ma
y 1
0
Jun 1
0
Jul 1
0
Au
g 1
0
Se
p 1
0
Oct 1
0
No
v 1
0
De
c 1
0
Jan 1
1
Fe
b 1
1
Ma
r 11
Ap
r 1
1
Ma
y 1
1
Jun 1
1
Jul 1
1
Au
g 1
1
Se
p 1
1
Oct 1
1
No
v 1
1
De
c 1
1
Jan 1
2
Fe
b 1
2
Ma
r 12
Ap
r 1
2
Ma
y 1
2
Jun 1
2
Jul 1
2
Au
g 1
2
Se
p 1
2
Oct 1
2
No
v 1
2
De
c 1
2
Jan 1
3
Fe
b 1
3
Ma
r 13
Ap
r 1
3
Ma
y 1
3
Jun 1
3
Live animals
Fresh Bovine meat
Frozen Bovine meat
Beef Offals
TOTAL

21
T R A D E T R A D E E.U. E X P O R T S
L i v e A n i m a l s
E.U. E X P O R T S
L i v e A n i m a l s
2 0
14
.
3 1
12
.
2 2
59
.
2 6
99
.
2 7
60
.
2 0
61
.
2 9
52
.
3 3
99
.
3 8
34
.
2 7
99
.
2 9
89
.
2 6
11
.
6 5
52
. 9
62
8
.
7 0
75
.
7 5
77
.
5 5
54
.
2 3
89
.
3 3
80
.
4 4
16
.
8 0
26
. 11
06
8
.
7 2
63
.
6 5
03
.
5 5
60
.
2 6
29
.
4 6
37
.
2 1
52
.
86
8
.
97
4
.
59
6
.
38
8
.
20
4
.
41
4
.
2 1
11
.
2 5
11
.
3 5
65
.
6 2
85
.
4 1
34
.
3 9
38
.
3 7
38
.
2 6
56
.
2 1
73
.
1 9
29
.
3 3
48
.
3 9
79
.
3 2
59
.
2 1
96
.
1 9
95
.
2 4
41
.
5 1
61
.
4 1
73
.
1 7
47
.
2 7
57
.
1 3
44
.
1 9
92
.
2 0
71
.
1 1
74
.
3 0
94
.
3 2
07
.
2 3
05
.
1 6
27
.
2 3
75
.
2 5
62
.
3 1
11
.
3 2
37
.
3 3
42
.
2 0
66
.
2 0
26
.
3 3
72
.
2 7
44
.
3 6
60
.
2 6
00
.
4 1
25
.
2 0
99
.
1 9
69
.
3 1
90
.
3 3
73
.
4 7
52
.
4 0
73
.
4 4
49
.
3 9
54
.
4 8
85
.
5 9
68
.
4 6
29
.
3 8
96
.
3 7
65
.
3 5
70
.
3 3
71
.
3 2
57
. 3 8
89
.
3 7
51
.
4 3
40
.
4 3
06
.
5 2
89
.
6 9
55
.
5 8
84
.
6 4
95
.
4 0
68
.
3 1
79
.
5 7
38
.
4 3
35
.
3 9
36
.
4 0
98
.
5 2
02
.
3 8
92
.
3 9
50
.
4 3
88
.
4 6
18
.
5 9
69
.
3 8
22
.
4 0
01
.
4 8
67
.
6 7
15
.
5 7
01
.
4 2
56
.
0
5 000
10 000
15 000
20 000
25 000
Jan
09
Mar
09
May 0
9
Jul 09
Sep
09
Nov 0
9
Jan
10
Mar
10
May 1
0
Jul 10
Sep
10
Nov 1
0
Jan
11
Mar
11
May 1
1
Jul 11
Sep
11
Nov 1
1
Jan
12
Mar
12
May 1
2
Jul 12
Sep
12
Nov 1
2
Jan
13
Mar
13
May 1
3
To
nn
es C
WE
.
EU-28 Exports of LIVE Bovine Animals(Source COMEXT -Tonnes cwe)
Turkey Algeria Lebanon Other
22
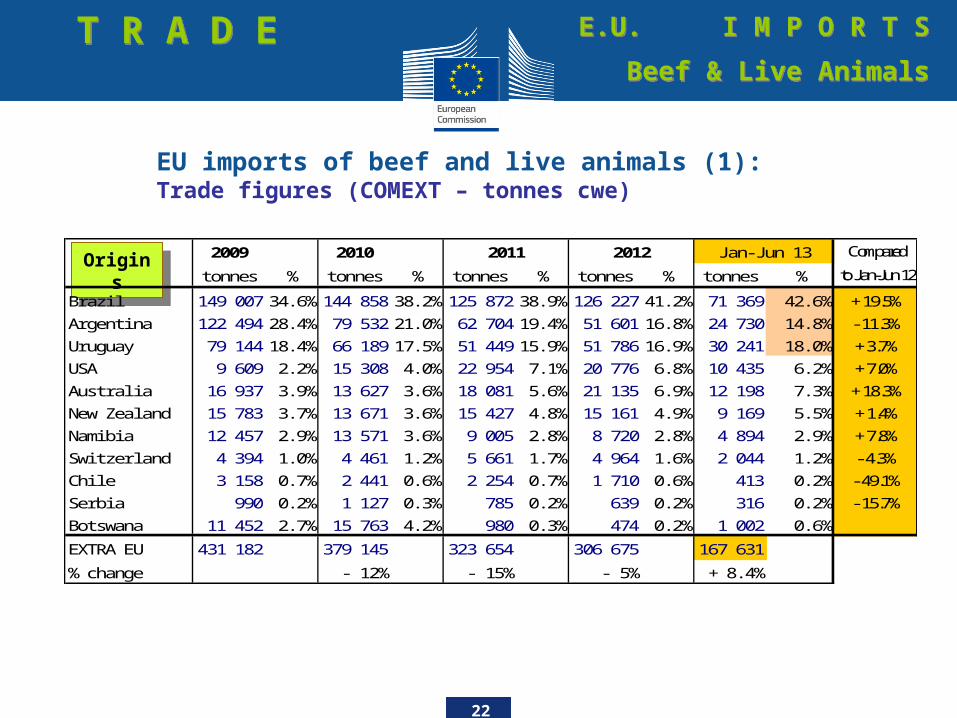
EU imports of beef and live animals (1):Trade figures (COMEXT – tonnes cwe)
OriginsOrigins
T R A D E T R A D E E.U. I M P O R T S
Beef & Live Animals
E.U. I M P O R T S
Beef & Live Animals
2009 2010 Compared
tonnes % tonnes % tonnes % tonnes % tonnes % to Jan-Jun 12
Brazil 149 007 34.6% 144 858 38.2% 125 872 38.9% 126 227 41.2% 71 369 42.6% + 19.5%
Argentina 122 494 28.4% 79 532 21.0% 62 704 19.4% 51 601 16.8% 24 730 14.8% - 11.3%
Uruguay 79 144 18.4% 66 189 17.5% 51 449 15.9% 51 786 16.9% 30 241 18.0% + 3.7%
USA 9 609 2.2% 15 308 4.0% 22 954 7.1% 20 776 6.8% 10 435 6.2% + 7.0%
Australia 16 937 3.9% 13 627 3.6% 18 081 5.6% 21 135 6.9% 12 198 7.3% + 18.3%
New Zealand 15 783 3.7% 13 671 3.6% 15 427 4.8% 15 161 4.9% 9 169 5.5% + 1.4%
Namibia 12 457 2.9% 13 571 3.6% 9 005 2.8% 8 720 2.8% 4 894 2.9% + 7.8%
Switzerland 4 394 1.0% 4 461 1.2% 5 661 1.7% 4 964 1.6% 2 044 1.2% - 4.3%
Chile 3 158 0.7% 2 441 0.6% 2 254 0.7% 1 710 0.6% 413 0.2% - 49.1%
Serbia 990 0.2% 1 127 0.3% 785 0.2% 639 0.2% 316 0.2% - 15.7%
Botswana 11 452 2.7% 15 763 4.2% 980 0.3% 474 0.2% 1 002 0.6%
EXTRA EU 431 182 379 145 323 654 306 675 167 631
% change - 12% - 15% - 5% + 8.4%
2011 Jan-Jun 132012

23
EU imports of beef and live animals (2):Trade figures (COMEXT)
T R A D E T R A D E E.U. I M P O R T S
Beef & Live Animals
E.U. I M P O R T S
Beef & Live Animals
61 842 59 74171 369
35 08127 892
24 730
31 71129 158
30 241
20 72817 748
18 658
167 103154 599
167 631
0
20 000
40 000
60 000
80 000
100 000
120 000
140 000
160 000
180 000
Jan-Jun 11 Jan-Jun 12 Jan-Jun 13
InTonnes
cwe
IMPORTS of Beef & Veal into EU (Tonnes cwe)
Brazil Argentina Uruguay Australia USA Other origins
254 436 271 806 288 135
248 121 223 067 200 184
162 503 152 268 155 017
43 375 54 105 66 511
111 746 97 056 91 110
880 958 873 083 878 727
0
100 000
200 000
300 000
400 000
500 000
600 000
700 000
800 000
900 000
1 000 000
Jan-Jun 11 Jan-Jun 12 Jan-Jun 13
in 1000EUR
IMPORTS of Beef & Veal into EU (1000 EUR)
Brazil Argentina Uruguay Australia USA Other origins

24
T R A D E T R A D E E.U. I M P O R T S
B e e f P r o d u c t s
E.U. I M P O R T S
B e e f P r o d u c t s
0
10 000
20 000
30 000
40 000
50 000
60 000
|Jan06
2006 |Jan07
2007 |Jan08
2008 |Jan09
2009 |Jan10
2010 |Jan11
2011 |Jan12
2012 |Jan13
in Tonnes cwe
EU-28 Imports of BEEF products
FRESH FROZEN PREPARED OTHERS

25
452403
446401
436 429398
491 513 529565
513556
395431
379323
228
1 263
1 1711 120
825
1 028
736
598 598
481455
352
292248
292249
485
635
392
0
200
400
600
800
1 000
1 200
1 400
1995 1996 1997 1998 1999 2000 2001 2002 2003 2004 2005 2006 2007 2008 2009 2010 2011 Jan-Sep12
1000 Tonne
IMPORTS EXPORTS
Trade balance on beef and live animals
T R A D E T R A D E E.U. T R A D E B A L A N C E
Beef & Live Animals
E.U. T R A D E B A L A N C E
Beef & Live Animals
452403
446401
436 429398
491 513 529565
513556
395431
379324 307
168
1 263
1 1711 120
825
1 028
736
598 598
481455
352292
248292
249
487
636
519
213
0
200
400
600
800
1 000
1 200
1 400
1995 1996 1997 1998 1999 2000 2001 2002 2003 2004 2005 2006 2007 2008 2009 2010 2011 2012 Jan-Jun13
1000 Tonne
IMPORTS EXPORTS

26
W O R L DB E E F M A R K E TW O R L DB E E F M A R K E T
E.U. I M P O R T S
BEEF MAIN IMPORTERS
E.U. I M P O R T S
BEEF MAIN IMPORTERS
Source : GTA * Excluding live animals (0102), fats, preparations of several types of meat (0209, 0210 99 and 1602 90)
Un
ited
Sta
tes
Un
ited
Sta
tes
Au
str
ali
a
Au
str
ali
a
Bra
zil
Bra
zil
Ind
ia (u
p t
o M
ay)
Ind
ia (u
p t
o M
ay)
New
Zeala
nd
New
Zeala
nd
Can
ad
a
Can
ad
a
EU
EU
Uru
gu
ay (
up
to
Ap
r)
Uru
gu
ay (
up
to
Ap
r)
Arg
en
tin
a
Arg
en
tin
a
Para
gu
ay
Para
gu
ay
Mexi
co
(u
p t
o M
ay)
Mexi
co
(u
p t
o M
ay)
0
100
200
300
400
500
600
700
800
900
1 000
2012 (up to June) 2013 (up to June)
Qty in 1000 Tonnes
Main Exporters of BEEF Products (up to June)
* Excluding live animals (0102), fats, preparationsof several types of meat (0209, 0210 99 and 1602 90)
27
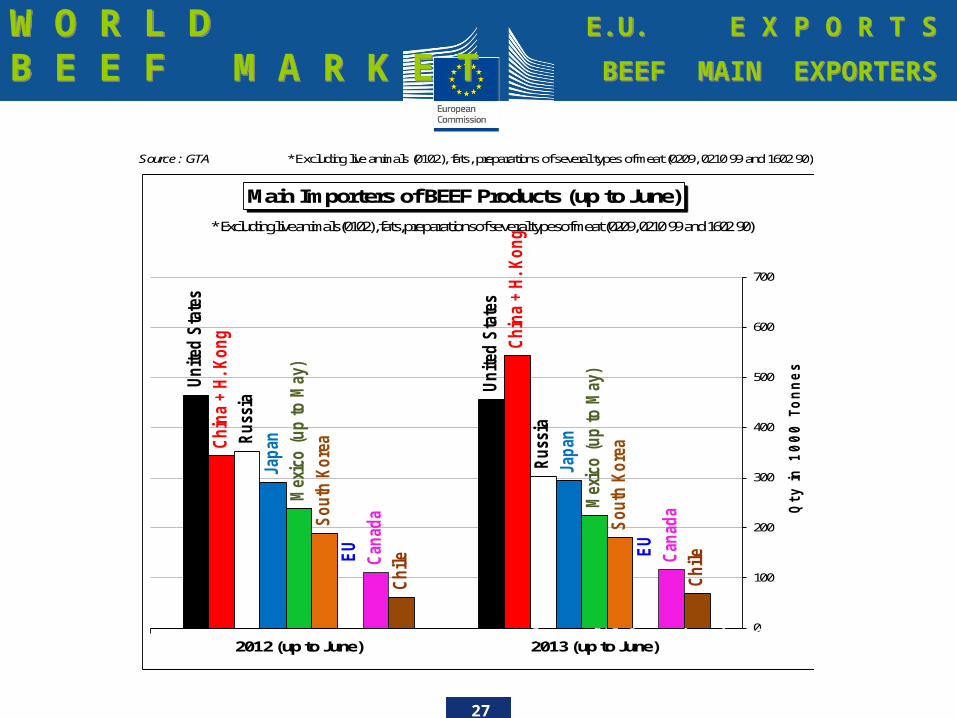
W O R L DB E E F M A R K E TW O R L DB E E F M A R K E T
E.U. E X P O R T S
BEEF MAIN EXPORTERS
E.U. E X P O R T S
BEEF MAIN EXPORTERS
Source : GTA * Excluding live animals (0102), fats, preparations of several types of meat (0209, 0210 99 and 1602 90)
0
Un
ited
Sta
tes
Un
ited
Sta
tes
Ch
ina +
H.
Ko
ng
Ch
ina +
H.
Ko
ng
Ru
ssia
Ru
ssia
Jap
an
Jap
an
Mexi
co
(u
p t
o M
ay)
Mexi
co
(u
p t
o M
ay)
So
uth
Ko
rea
So
uth
Ko
rea
EU
EU
Can
ad
a
Can
ad
a
Ch
ile
Ch
ile
0
100
200
300
400
500
600
700
2012 (up to June) 2013 (up to June)
Qty in 1000 Tonnes
Main Importers of BEEF Products (up to June)
No 2103 figures available for : Mexico, Taiwan, Chile, ...
* Excluding live animals (0102), fats, preparations of several types of meat (0209, 0210 99 and 1602 90)

28
W O R L DB E E F M A R K E TW O R L DB E E F M A R K E T
STEER PRICES
US & EU
STEER PRICES
US & EU
100,0
150,0
200,0
250,0
300,0
350,0
400,0
450,0
| 10 | 11 | 12 | 13 |
weekly US & EU Steer prices in €uro/100kg carcase
Steers 550-700lb Omaha (Nebraska) Feeder Steer 600-700lb Oklahoma CityEU Beef C R3 Steers 1050 - 1200lb Okla/ TexCanada: All Steers (agr,gc,ca) Australia: All SteersNew Zeal. Avg steers T2 NI & SI

29
100
150
200
250
300
350
400
| Year2009
| Year2010
| Year 2011 | Year2012
| Year 2013 |
€uro
/ 10
0kg
Market prices for Adult Male Bovine in Brazil (Pecuaria.com.br), Argentina (Oncca),
Argentina (abc-consrt),Uruguay (Inac) and EU
EU Beef A/C R3 AVG Arroba do Boi (6 St) (Pecuària.com.br)
Novillos Export (Oncca Argentina) Media Res Novillo (Inac Uruguay)
(abc-consort) Argentina Novillo
W O R L DB E E F M A R K E TW O R L DB E E F M A R K E T
ADULT MALE BOVINE PRICES
Brazil Argentina Uruguay EU
ADULT MALE BOVINE PRICES
Brazil Argentina Uruguay EU