
Beef Quality Grading, Yield Grading and Pricing. Slaughter By-Products ($/cwt) $66/cwt$109/cwt...
65
Beef Quality Grading, Yield Grading and Pricing
-
Upload
theodora-blake -
Category
Documents
-
view
228 -
download
2
Transcript of Beef Quality Grading, Yield Grading and Pricing. Slaughter By-Products ($/cwt) $66/cwt$109/cwt...

Beef Quality Grading, Yield Grading and Pricing
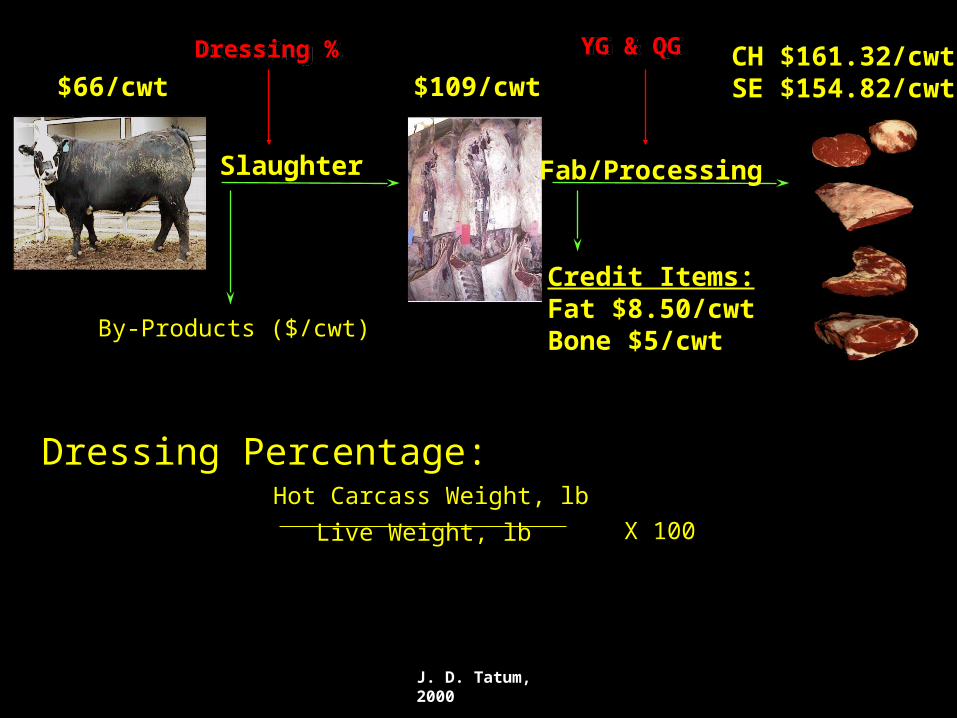
Slaughter
By-Products ($/cwt)
$66/cwt $109/cwt
Fab/Processing
Credit Items:Fat $8.50/cwtBone $5/cwt
CH $161.32/cwtSE $154.82/cwt
Dressing %Dressing % YG & QGYG & QG
J. D. Tatum, 2000
Dressing Percentage:Hot Carcass Weight, lb
Live Weight, lb
X 100

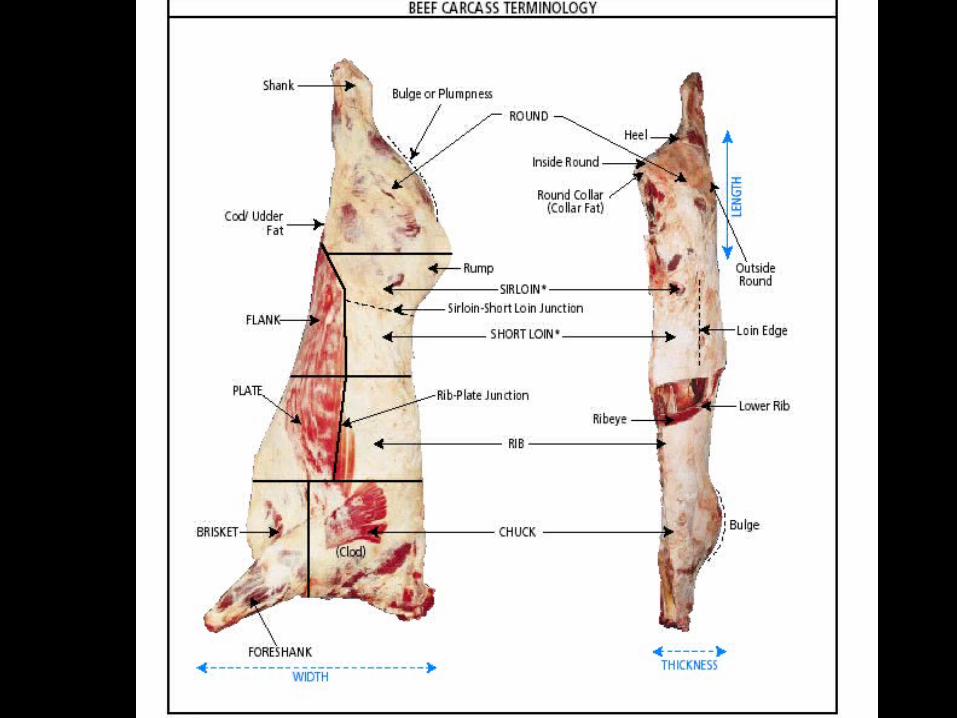
Beef Carcass Terminology• Muscling
RibeyeRoundSirloinRibChuck
• QualityMarbling, colorTexture,
firmness
• TrimnessRibeyeRoundSirloinShort loinLoin edgeRibChuckKPHCod/udder


USDA Beef Quality Grades
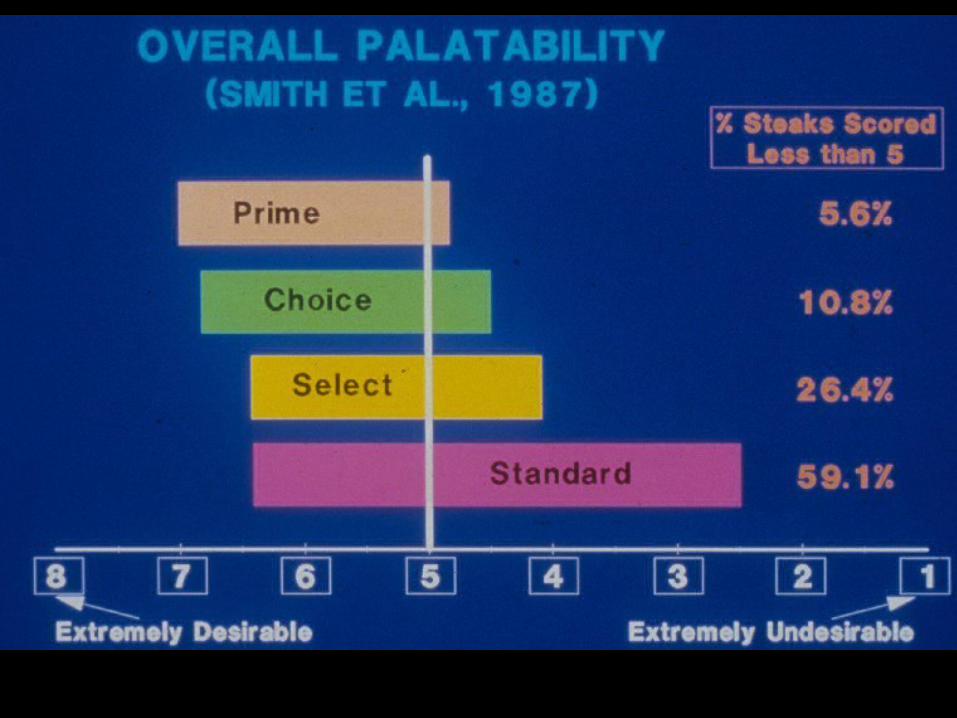
• Quality grades are an estimate of beef palatability
• Tenderness• Juiciness• Flavor

Sex Classes of Beef Carcasses
• Essential for Quality Grading because only Heifers, steers and Cows are Quality Graded.
• Heifer• Steer• Cow
• Bullock• Bull
Graded Not Graded

USDA Quality GradesBased on consideration of two general
factors:
1. Physiological Maturity• Skeletal Maturity• Lean Maturity
2. Marbling (Intramuscular Fat)• Amount• Distribution
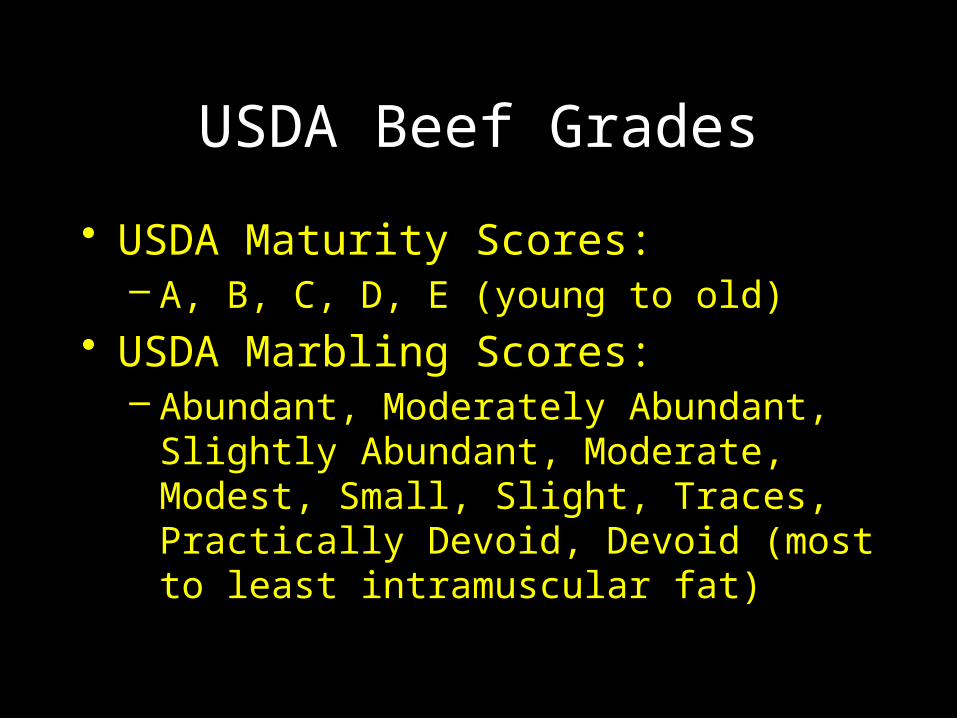
USDA Beef Grades
• USDA Maturity Scores:– A, B, C, D, E (young to old)
• USDA Marbling Scores:– Abundant, Moderately Abundant, Slightly
Abundant, Moderate, Modest, Small, Slight, Traces, Practically Devoid, Devoid (most to least intramuscular fat)

USDA Quality Grades• Grades of Youthful Carcasses (< 42 mos.)
Prime
Choice
Select
Standard• Grades of Mature Carcasses (> 42 mos.)
Commercial
Utility
Cutter
Canner

Relationship between tenderness and USDA maturity
scores
A B C D E
Maturity
Sh
ea
r F
orc
e V
alu
es

Physiological Maturity vs Chronological Maturity
• The physiological maturity of the carcass is an estimate of the actual chronological age of the animal
USDA Maturity Score Estimated chronological age
A 9 to 30 months
B 30 to 42 months
C 42 to 72 months
D 72 to 96 months
E 96 or more months
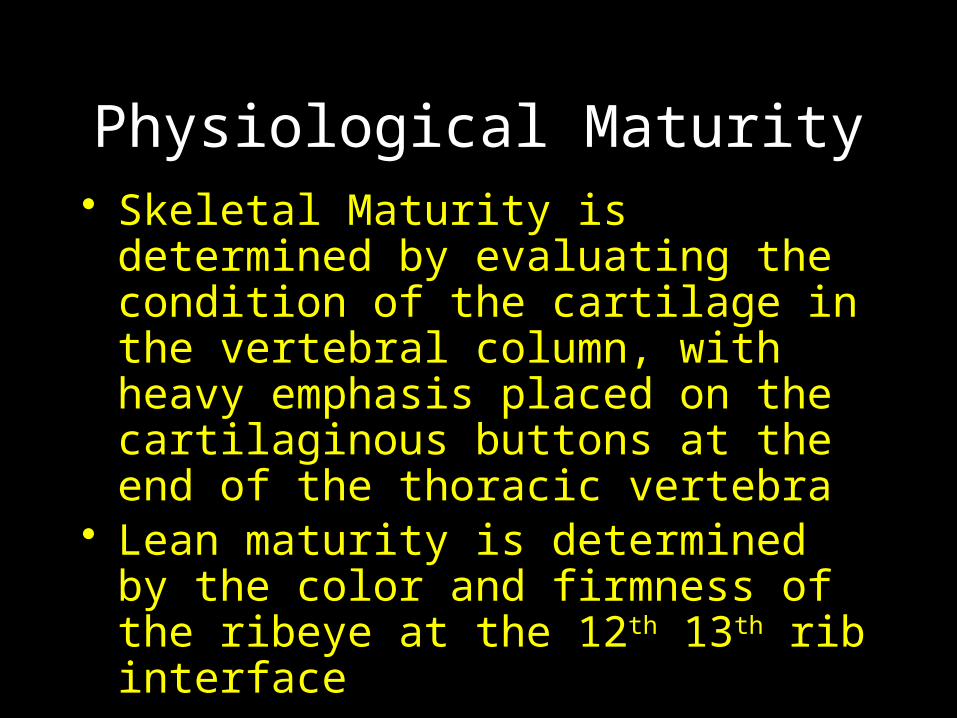
Physiological Maturity• Skeletal Maturity is determined by
evaluating the condition of the cartilage in the vertebral column, with heavy emphasis placed on the cartilaginous buttons at the end of the thoracic vertebra
• Lean maturity is determined by the color and firmness of the ribeye at the 12th 13th rib interface


Skeletal Maturity
A B C D E
Sacral Distinct separation
Some separation
Fused Fused Fused
Lumbar No ossification
Partial ossification
Mostly ossified
Ossified Ossified
Thoracic* 0-10% 10-35% 35-70% 70-90% 90% +
*Average ossification of first three thoracic vertebra

Determining Lean Maturity
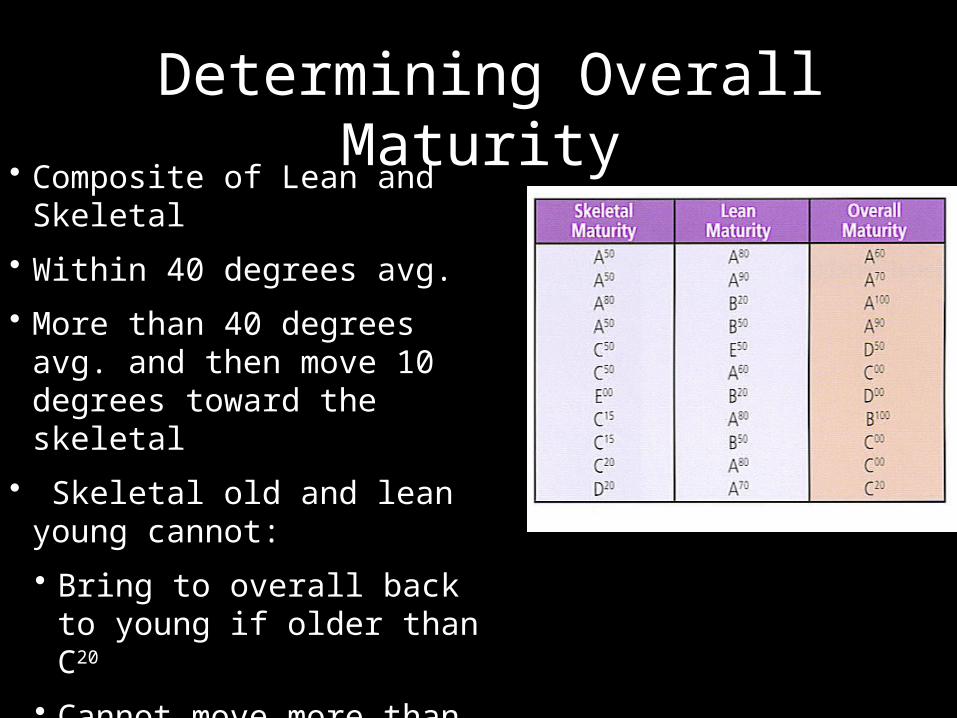
Determining Overall Maturity
• Composite of Lean and Skeletal
• Within 40 degrees avg.
• More than 40 degrees avg. and then move 10 degrees toward the skeletal
• Skeletal old and lean young cannot:
• Bring to overall back to young if older than C20
• Cannot move more than 100 degrees from skeletal
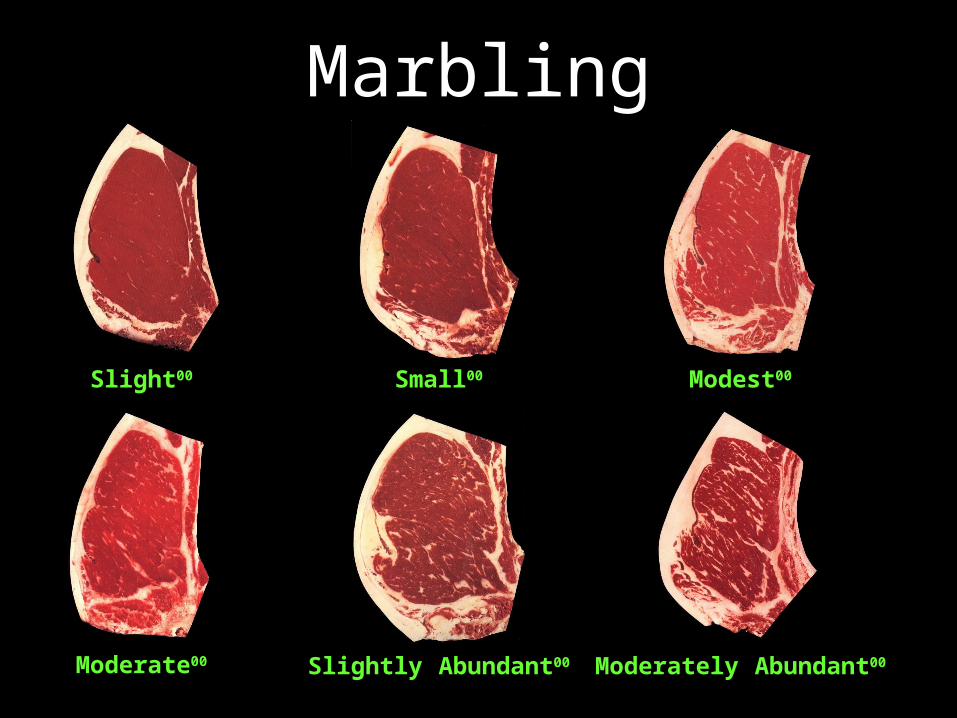
Marbling
Slight00 Small00 Modest00
Moderate00 Moderately Abundant00Slightly Abundant00

Degrees of Marbling A*** B C D E
Degrees of Marbling
Slightly Abundant
Prime Slightly Abundant
Moderate Commercial Moderate
Modest Choice Modest
Small Small
Slight Select Utility Slight
Traces Cutter Traces
Practically
Devoid Standard Practically
Devoid
Commercial
Utility
Cutter
Prime
Choice
Select
Standard
USDA Quality Grades
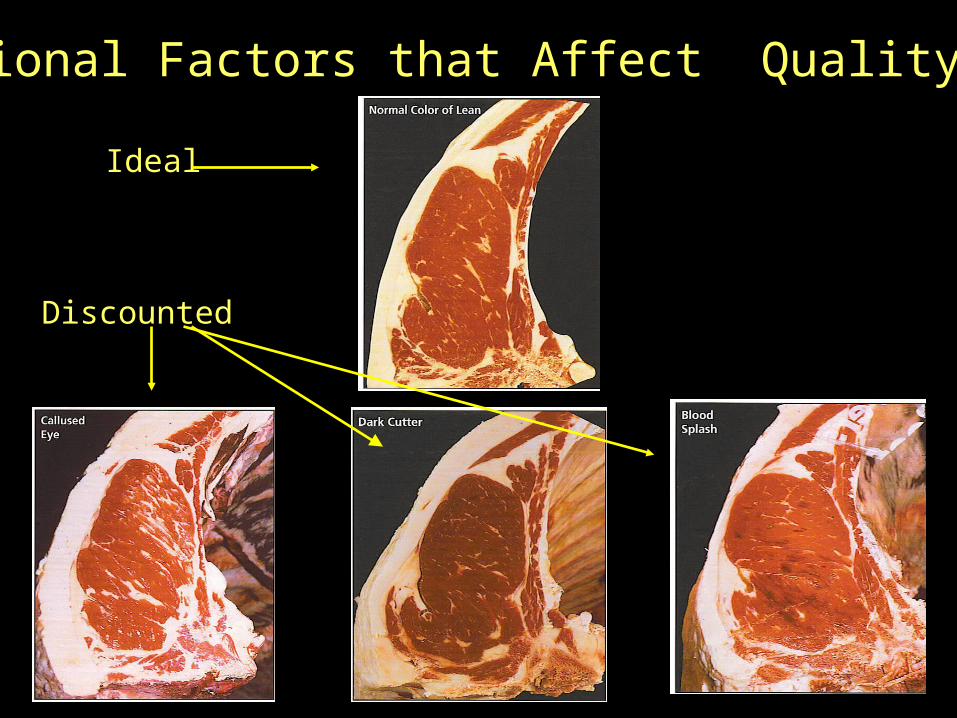
Additional Factors that Affect Quality Grades
Ideal
Discounted

Odds of an Unpleasant Eating Experience
USDA Quality Grade
Odds of Having an Unpleasant Eating
Experience
% Steers/Heifers in National Consist
(NBQA, 2000)
Prime 3% (1 in 33) 2%
Upper 2/3 Choice 10% (1 in 10) 17%
Low Choice 16% (1 in 6) 32%
Select 27% (1 in 4) 42%
Standard 50% (1 in 2) 7%

Quality Grade Distribution in 1991 and 1995
Standard Select Low Choice Upper 2/3 Choice
Prime0
10
20
30
40
50
5
47
36
11
16
37 37
18
2
NBQA 1995
NBQA 1991
%

Additional Factors that Affect Value
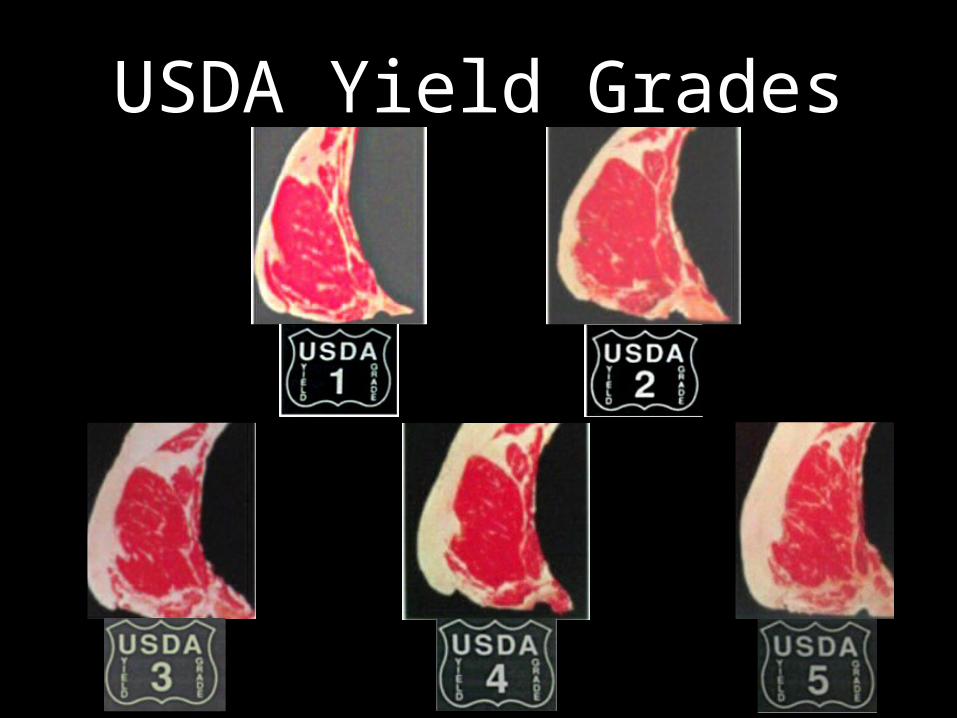
USDA Yield Grades

Beef Yield Grades
• USDA Yield Grades predict the percentage of carcass weight in boneless, closely trimmed retail cuts from the round, loin, rib and chuck

Slaughter
By-Products ($/cwt)
$66/cwt $109/cwt
Fab/Processing
Credit Items:Fat $8.50/cwtBone $5/cwt
CH $161.32/cwtSE $154.82/cwt
Dressing %Dressing % YG & QGYG & QG
J. D. Tatum, 2000
Dressing Percentage:Hot Carcass Weight, lb
Live Weight, lb
X 100
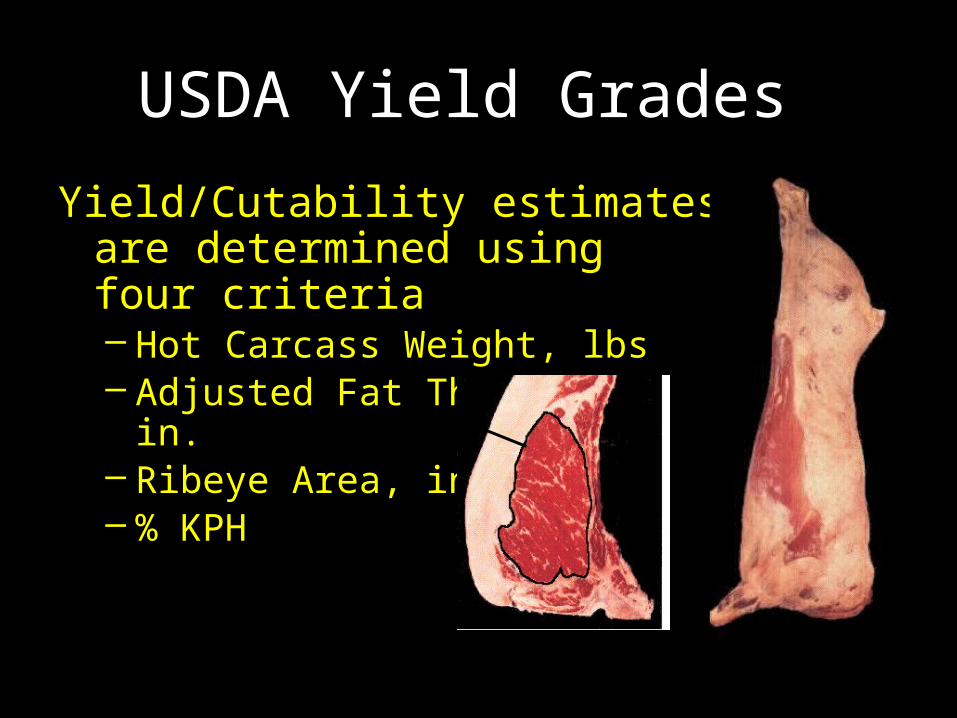
USDA Yield Grades
Yield/Cutability estimates are determined using four criteria– Hot Carcass Weight, lbs– Adjusted Fat Thickness, in.– Ribeye Area, in2
– % KPH

USDA Yield Grade
USDA YG %BCTRC
1
2
3
4
5
52.3 % or More
52.3 - 50.0%
50.0 - 47.7%
47.7 - 45.4%
45.4% or Less
%BCTRC =51.34 – 5.784(Adj.Fat) – 0.462(KPH) + 0.740(REA) – 0.0093(HCW)

Yield Grade Basics1. Fat Thickness – 12th Rib
2. Rib Eye Area to Hot Carcass Weight adj.
3. Kidney, Pelvic & Heart Fat

Step 1 Ft thickness 12th rib
Known at PYG (Preliminary Yield Grade)
Step 1. Estimate Fat thickness ¾ the distance around the ribeye.• Measured in inches.
Step 2. For every 0.1 inches add .25 to the base 2.00.
Example:
FT= 0.6
0.6/0.1 = 6 6 x 0.25 = 1.5 adjustment 2.0 + 1.5 = 3.5 PYG

Yield Grade Basics
1. Fat Thickness – 12th Rib
2. Rib Eye Area to Hot Carcass Weight adjustment
3. Kidney, Pelvic & Heart Fat

HCW to REAStep 1. Estimate the REA between the 12th and 13th rib.•Measured in square inches.
Step 2. Find the difference between the actual and the ribeye needed for the weight. Base 600 needs 11.0 and for every 100 lb change in HCW the ribeye area needed changes 1.2 sq. in.
Example:
Actual REA= 15.6 HCW= 725
15.6 - ? = ? (diff. in REA x .3)= ??

HCW REA HCW REA
600 11.0 825 13.7
625 11.3 850 14.0
650 11.6 875 14.3
675 11.9 900 14.6
700 12.2 925 14.9
725 12.5 950 15.2
750 12.8 975 15.5
775 13.1 1000 15.8
800 13.4
Ribeye to HCW adjustments

HCW to REAStep 1. Estimate the REA between the 12th and 13th rib.•Measured in square inches.
Step 2. Find the difference between the actual and the ribeye needed for the weight. Base 600 needs 11.0 and for every 100 lb change in HCW the ribeye area needed changes 1.2 sq. in.
Example:
Actual REA= 15.6 HCW= 725
15.6 – 12.5 = 3.1 (3.1 x .3)= .93
REA adjustment = -0.93

To estimate REA Live

Yield Grade Basics
1. Fat Thickness – 12th Rib
2. Rib Eye Area to Hot Carcass Weight adj.
3. Kidney, Pelvic & Heart Fat

KPHStep 1. Estimate the KPH fat as a % of the Carcass.• Do this by estimating the # of lbs. and dividing by HCW.• Estimate lbs. of fat by estimating the # of softballs of fat are present. 1 softball
weighs about 1 lb.
Step 2. Minus the percentage from the base (3.5%) and then for every 0.5% change in KPH you adjust 0.1 to the Final Yield Grade.
Example:
HCW = 725 Lbs. of KPH = 36.25 lbs
36.25/725= 5% 5% - 3.5% (base)= 1.5 % 1.5/.5 = 3
3 x .1 = .3
KPH adjustment + 0.3 to the Final Yield grade
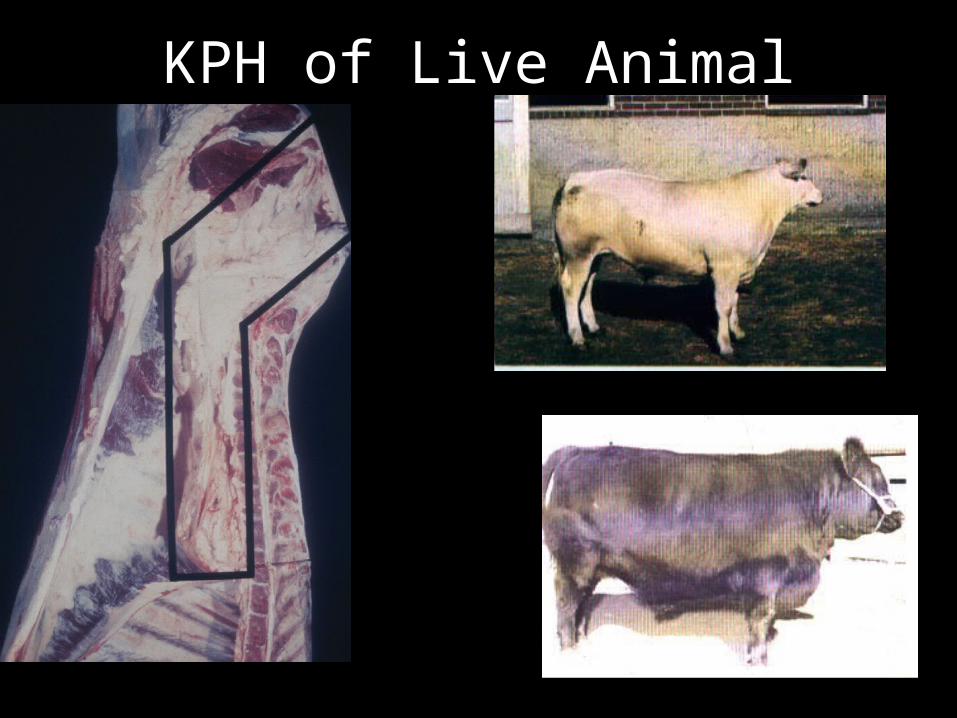
KPH of Live Animal

Step 1. Fat thicknessFT= 0.6
0.6/0.1 = 6 6 x 0.25 = 1.5 adjustment
2.0 + 1.5 = 3.5 PYG
Step 2. Ribeye to HCW Actual REA= 15.6 HCW= 725 15.6 – 12.5 = 3.1 (3.1 x .3)= .93
REA adjustment = - 0.93
Step 3. KPHHCW = 725 Lbs. of KPH = 36.25 lbs
36.25/725= 5% 5% - 3.5% (base)= 1.5 %1.5/.5 = 3 3 x .1 = .3
KPH adjustment = + 0.3
FINAL YIELD GRADE= 2.87
3 step method Summary Carcass

Step 1. ESTIMATE Fat thicknessFT= 0.6
0.6/0.1 = 6 6 x 0.25 = 1.5 adjustment
2.0 + 1.5 = 3.5 PYG
Step 2. Determine Muscling and Adjust accordingly. For heavier muscled animals subtract from the Yield Grade. For lightermuscled animals add to the yield grade.
Step 3. KPH
Usually an animal will have 2.0 -3.5 % the fatter the animal
normally the more KPH. Adjust after a guess. Or use a standard
of – 0.2 adjustment.
3 step method Summary LIVE

Adopted from: R.E. Taylor. Scientific Farm Animal Production. 4th Ed. 1992.
Yield Grade 2

Adopted from: R.E. Taylor. Scientific Farm Animal Production. 4th Ed. 1992.
Yield Grade 5

Yield Grade 2 Yield Grade 5

Yield Grade 2 Yield Grade 5

Yield Grade 2 Yield Grade 5

Yield Grade 2 Yield Grade 5

Beef Carcass Terminology• Muscling
RibeyeRoundSirloinRibChuck
• QualityMarbling, colorTexture,
firmness
• TrimnessRibeyeRoundSirloinShort loinLoin edgeRibChuckKPHCod/udder

Sample Questions on Beef Carcasses
1. Largest Ribeye?
2. Highest Marbling Score?
3. Trimmest over lower rib
4. Between __ & ___ displayed the most fat over the round?
5. Darkest Lean?
6. Plumpest Round?
7. Which carcass was displayed trimness, muscling and quality to the highest degree?
8. Between __& __ had the highest degree of marbling?
9. Which was the fattest opposite the ribeye?
10.Which carcass was the trimmest?

Beef Value Determination

Carcass Cost Basis
• Carcass cost basis is the price per cwt of carcass necessary to realize the same amount of money that was paid for the live animal.
• Carcass cost basis =
(Live price per cwt / Dressing %) x 100

Example:
Live Price = $83 / cwt
Dressing Percentage = 62%
($83 / 62) x 100 = $133.87 / cwt carcass cost basis

Simple Carcass Cost BasisRail Pricing Grid
• This method is used by plants when cattle are sold on the rail or by there carcass merit.


Maximum Price Basis
The method used to determine how much should be paid for the live animal based on:
1) The potential revenue to be received for the carcass.
2) The potential revenue to be received for the by-products, and
3) The cost of converting the live animal into a carcass and by-products.

Example:
Given
USDA Choice Carcass = $105/cwt
USDA Select Carcass = $100/cwt
USDA By-product Value = $8.18/cwt
Slaughter cost = $30 per head
A 1250 pound steer that is estimated to grade USDA Choice and dress 63%.
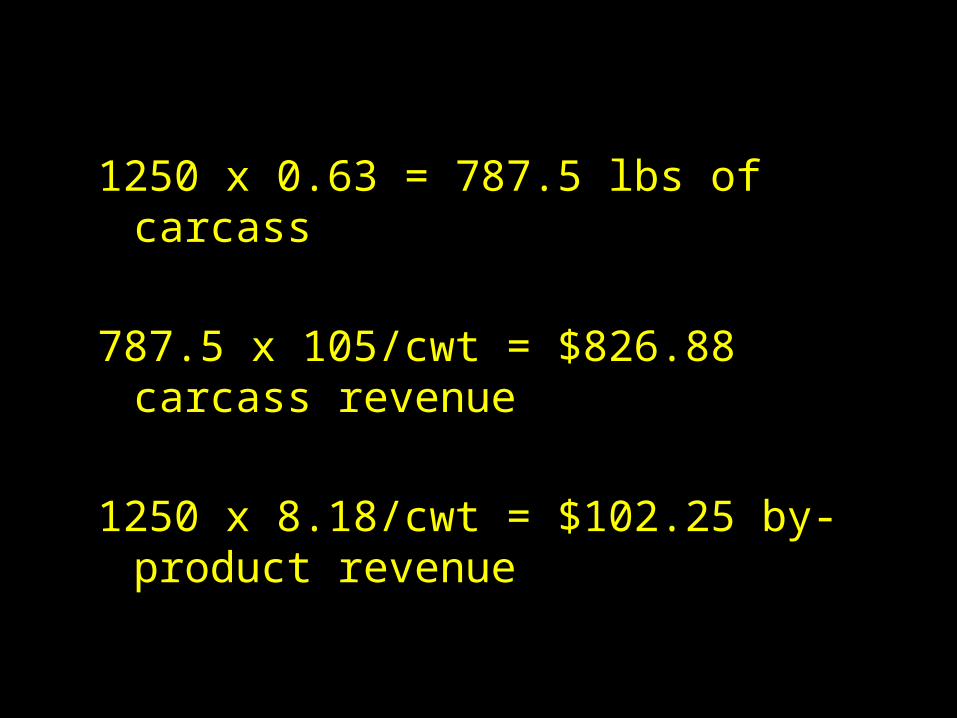
1250 x 0.63 = 787.5 lbs of carcass
787.5 x 10⁵/cwt = $826.88 carcass revenue
1250 x 8.18/cwt = $102.25 by-product revenue

$826.88 estimate carcass revenue
+$102.25 estimated by-product revenue
-$30 slaughter cost
$901.13 estimated income minus expenses
$901.13 / 1250 lb. Live weight = $72.09/cwt Maximum Price Basis

Carcass Pricing Grid ($/cwt) for March :
Yield Grade
Prime Premium Choice
Choice Select No-Roll
1.5 +$27.73 +$13.08 +$11.35 +$9.25 +$8.60
2.5 +$20.04 +$6.31 +$4.69 +$2.72 +$2.12
3.5 +$14.28 +$1.53 $94.11Base
($1.88) ($2.45)
4 ($15.00) ($15.00) ($15.00) ($15.00) ($15.00)
5 ($20.00) ($20.00) ($20.00) ($20.00) ($20.00)

Terms
• Choice/ Select Spread• Yield Grade Spread

• By-product value = $ 7.73 / cwt Live Weight
• Kill Cost = $ 30.00 / head
• Fabrication Cost = $ 65.00 / head

• Acceptable Carcass Weights = 550 to 950 lbs.
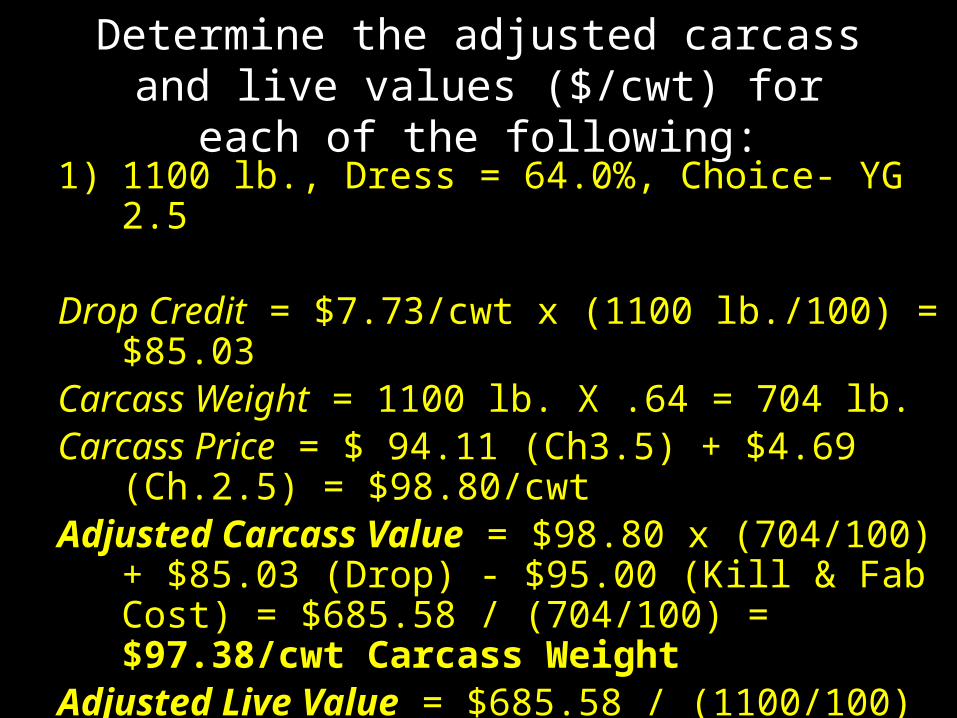
Determine the adjusted carcass and live values ($/cwt) for each of the
following:1) 1100 lb., Dress = 64.0%, Choice- YG 2.5
Drop Credit = $7.73/cwt x (1100 lb./100) = $85.03Carcass Weight = 1100 lb. X .64 = 704 lb.Carcass Price = $ 94.11 (Ch3.5) + $4.69 (Ch.2.5) =
$98.80/cwtAdjusted Carcass Value = $98.80 x (704/100) +
$85.03 (Drop) - $95.00 (Kill & Fab Cost) = $685.58 / (704/100) = $97.38/cwt Carcass Weight
Adjusted Live Value = $685.58 / (1100/100) = $62.33 / cwt Live Weight

2) 1100 lb., Dress = 64.0%, Select YG 2.5
Drop Credit = $7.73/cwt x (1100 lb./100) = $85.03Carcass Weight = 1100 lb. X .64 = 704 lb.Carcass Price = $94.11 (Ch.3.5) + $2.72 (Se2.5) =
$96.83/cwtAdjusted Carcass Value = $96.83 x (704/100) + $
85.03 (Drop) - $95.00 (Kill & Fab Cost) = $671.71 / (704/100) = $95.41/cwt Carcass Weight
Adjusted Live Value = $671.91 / (1100/100) = $61.06 / cwt Live Weight

3) 1200 lb., Dress = 64.5%, Prime YG 1.5
Drop Credit = $7.73/cwt x (1200 lb./100) = $92.76
Carcass Weight = 1200 lb. X .645 = 774 lb.
Carcass Price = $94.11 (Ch3.5) + $27.73 (Pr1.5) = $121.84/cwt
Adjusted Carcass Value = $121.84 x (774/100) + $92.76 (Drop) - $95.00 (Kill & Fab Cost) = $940.80 / (774/100) = $121.55/cwt Carcass Weight
Adjusted Live Value = $940.80 / (1200/100) = $78.40 / cwt Live Weight


![User Guide - freesat-content.tangentlabs.co.uk · b^RZTc ^] cWT QPRZ ^U cWT aTRTXeTa P]S P B20AC b^RZTc ^] cWT eXST^ ^a 3E3 aTR^aSTa 2WTRZ cWT aTR^aSTa{b \P]dP[ U^a VdXSP]RT H^d RP]](https://static.fdocuments.in/doc/165x107/5ec417b24eac4d06cc69a8f6/user-guide-freesat-brztc-cwt-qprz-u-cwt-atrtxeta-ps-p-b20ac-brztc-cwt.jpg)


