BEEF NUTRIENT MANAGEMENT PLANNING - SARE
6
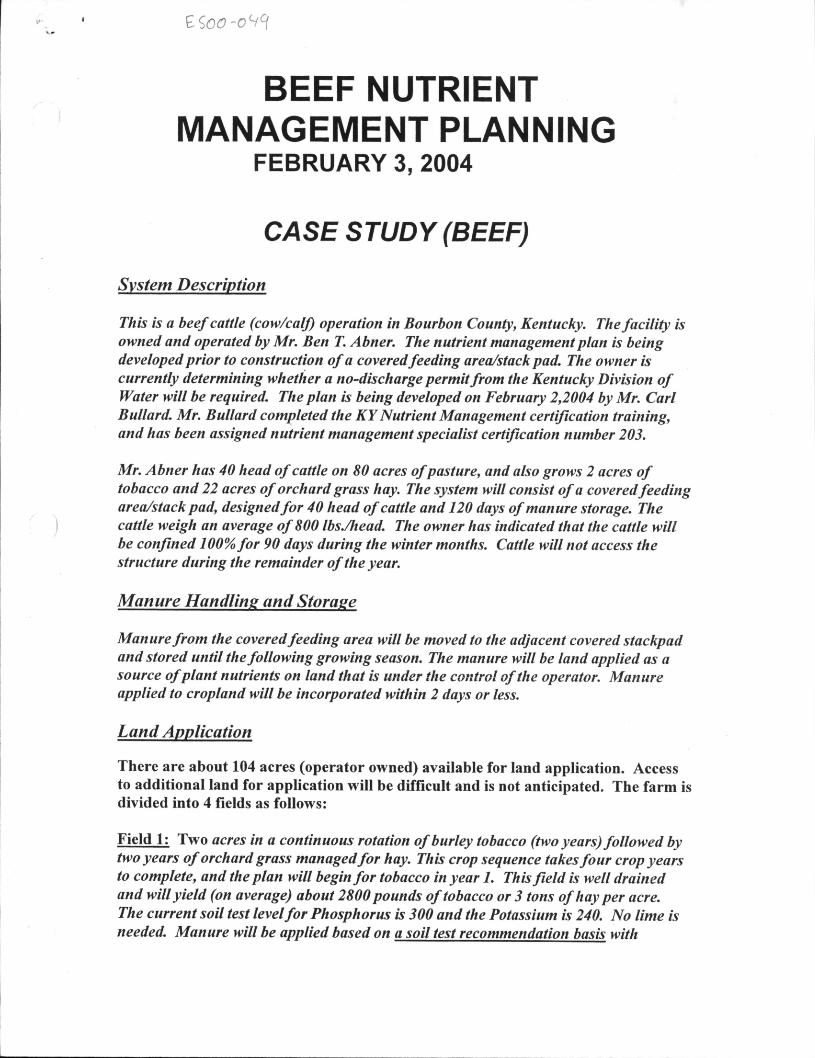
£$00-0^ BEEF NUTRIENT MANAGEMENT PLANNING FEBRUARY 3, 2004 CASE STUDY (BEEF) System Description This is a beef cattle (cow/calf) operation in Bourbon County, Kentucky. The facility is owned and operated by Mr. Ben T. Abner. The nutrient management plan is being developed prior to construction of a coveredfeeding area/stack pad. The owner is currently determining whether a no-discharge permit from the Kentucky Division of Water will be required. The plan is being developed on February 2,2004 by Mr. Carl Bullard. Mr. Bullard completed the KY Nutrient Management certification training, and has been assigned nutrient management specialist certification number 203. Mr. Abner has 40 head of cattle on 80 acres of pasture, and also grows 2 acres of tobacco and 22 acres of orchard grass hay. The system will consist of a covered feeding area/stack pad, designedfor 40 head of cattle and 120 days of manure storage. The cattle weigh an average of 800 lbs./head. The owner has indicated that the cattle will be confined 100% for 90 days during the winter months. Cattle will not access the structure during the remainder of the year. Manure Handling and Storage Manure from the coveredfeeding area will be moved to the adjacent covered stackpad and stored until the following growing season. The manure will be land applied as a source ofplant nutrients on land that is under the control of the operator. Manure applied to cropland will be incorporated within 2 days or less. Land Application There are about 104 acres (operator owned) available for land application. Access to additional land for application will be difficult and is not anticipated. The farm is divided into 4 fields as follows: Field 1: Two acres in a continuous rotation ofburley tobacco (two years) followed by two years of orchard grass managedfor hay. This crop sequence takes four crop years to complete, and the plan will begin for tobacco in year 1. This field is well drained and will yield (on average) about 2800 pounds of tobacco or 3 tons of hay per acre. The current soil test levelfor Phosphorus is 300 and the Potassium is 240. No lime is needed. Manure will be applied based on a soil test recommendation basis with
Transcript of BEEF NUTRIENT MANAGEMENT PLANNING - SARE
£$00-0^
BEEF NUTRIENT MANAGEMENT PLANNING
FEBRUARY 3, 2004
CASE STUDY (BEEF)
System Description
This is a beef cattle (cow/calf) operation in Bourbon County, Kentucky. The facility is owned and operated by Mr. Ben T. Abner. The nutrient management plan is being developed prior to construction of a covered feeding area/stack pad. The owner is currently determining whether a no-discharge permit from the Kentucky Division of Water will be required. The plan is being developed on February 2,2004 by Mr. Carl Bullard. Mr. Bullard completed the KY Nutrient Management certification training, and has been assigned nutrient management specialist certification number 203.
Mr. Abner has 40 head of cattle on 80 acres of pasture, and also grows 2 acres of tobacco and 22 acres of orchard grass hay. The system will consist of a covered feeding area/stack pad, designed for 40 head of cattle and 120 days of manure storage. The cattle weigh an average of 800 lbs./head. The owner has indicated that the cattle will be confined 100% for 90 days during the winter months. Cattle will not access the structure during the remainder of the year.
Manure Handling and Storage
Manure from the covered feeding area will be moved to the adjacent covered stackpad and stored until the following growing season. The manure will be land applied as a source of plant nutrients on land that is under the control of the operator. Manure applied to cropland will be incorporated within 2 days or less.
Land Application
There are about 104 acres (operator owned) available for land application. Access to additional land for application will be difficult and is not anticipated. The farm is divided into 4 fields as follows:
Field 1: Two acres in a continuous rotation ofburley tobacco (two years) followed by two years of orchard grass managed for hay. This crop sequence takes four crop years to complete, and the plan will begin for tobacco in year 1. This field is well drained and will yield (on average) about 2800 pounds of tobacco or 3 tons of hay per acre. The current soil test level for Phosphorus is 300 and the Potassium is 240. No lime is needed. Manure will be applied based on a soil test recommendation basis with

WORKSHEET 1 - ESTIMATING NUTRIENTS GENERATED PER CONFINEMENT PERIOD
1. Nutrients Generated (As Excreted)
SOLIDS WORKSHEET
Animal Type
Beef (all cattle and calves)
Number x rercem x Avg /, 1000 x confinement = Animal Unit Waste as * ' Mfa Weight Period (dvysftr) Days
40 x 100% x 800 / 1000 x 90 = 2880
x x / 1000 x = 0
x x / 1000 x = 0
N P205
X K2O N P205
X K2O
N
P2O5 X K2O
Table 1
Value 0.34
0.21
0.25
mm
= 1
N
979.2
=
ss
—
=
:
P2O5
(lbs)
604.8
K20
720
Step 1 Total = 2. Manure Generated (As Excreted)
979.2 604.8 720
Animal Unit Days (from Step 1)
Manure/A.u. = Volume of Manure Table 1 value
Confinement period must be adjusted for dairy cows where they are only held a short period of time during milking (e.g., 365 days x 25% confinement during the day = 91 days total confinement)
2880 0
1 2880
Step 2 Total 2,880
33 Cu.Ft/Ton
3. Bedding (cu.ft.)
4. Total Tons = Step 2 + Step 3 / (Swine, Dairy, Beef, Horse, Sheep = 33 Cu. Ft./Ton; Poultry = 74Cu.Ft./Ton)
5. Weighted Nutrient Value before Nitrogen Losses (lbs/ton) (Step 1 Total / Step 4)
87.27
cu.ft. cu.ft. cu.ft.
cu.ft.
cu.ft.
Tons
11.22 6.93 8.25
Note: All manure calculations are carried to two decimal points with no rounding. All commercial fertilizer calculations will be rounded to whole numbers with normal rules of rounding.

WORKSHEET 2 - NUTRIENT BALANCE
Tract Field No. Acres
700 1 2 Soil Test P Value (Mehlich 3)| 220
l ^ ^ r o p or Crop Sequence/Rotation
2. Realistic Yield Goal
3. Plant Nutrients Needed or Allowed (ibs/ac) (based on soil tests (ST) or crop removal (CR) rates in Table 6)
NOTE: Plant Nutrient Needs for "N" cannot exceed a one year crop
sequence (e.g., corn/wheat in a com/wheat/soybean sequence)
When based on crop removal, nutrients needed are based on yield level.
4. I f applicable, adjusted P2Os Application Rate according to Threshold or P Index.
Step 3 P2o5 x 0
5. Nitrogen Credits from previous legume crop
(Ibs/ac. from Table 4)
6. Fertilizer Credits (Starter or Other) (Ibs/ac)
7. Nitrogen credits for previous manure applications
(Ibs/ac) Table 5 value x net application of manure nutrients " N " in previous year(s)
a. Plant Nutrients Neeaea minus credits (ibs/ac)
(Step 3 for N minus Steps 5, 6, & 7 or Step 4 for PzOg minus Step 6)
Tobacco
2800
N 250
P205
0 K20 260
o Utr ientS in M a n u r e (lbs/ton) Circle^oliclsy Liquids (Use lab test or weighted value as determined in Worksheet 1)
i u . percent Nutrients Retained in system ( I aoie i) Enter Table value as a decimal. (Enter zero with lab analysis)
11. Net Retained Nutrients in Manure (Ibs./ton)
(Step 9 x Step 10) Enter zero with lab analysis.
12. Percent of available nutrients (Table 3)
13. Net available nutrients (Ibs./ton) (Step 11 x Step 12 without lab analysis. Step 9 x Step 12
with lab analysis)
14. APPLICATION RATE (tons/ac)
(Step 8 / Step 13)
Note: Application limitations may apply. See 590 Standard
15. Net Application Amount for All Nutrients (ibs/ac) [Step 13 x Step 14]
16. Nutrient Needs or Surpluses (ibs/ac) (Step 15 minus Step 8) "-" sign indicates need
Tons Available Solids
87.27 -Tons Applied in Field (Step 14 x Field Acres)
ST
20
ST
=Balance
ST
o I
0 0 0
250 0 260
11.22 6.93 8.25
80% 95% 95%
8.97 6.58 7.83
50% 80% 100%
4.48 5.26 7.83
10 10 10
44.8 52.6 78.3
-205.2 52.6 -181.7
67.27

KSHEEt2- NUTRIENT BALANCE
Tract Field No. Acres 700 3 20
Soil Test P Value (Mehlich 3)| 220
1 . Crop or Crop Sequence/Rotation
2. Realistic Yield Goal
3. Plant Nutrients Needed or Allowed (ibs/ac) (based on soil tests (ST) o r crop removal (CR) rates in Table 6)
NOTE: Plant Nutrient Needs for "N" cannot exceed a one year crop
sequence (e.g., corn/wheat in a com/wheat/soybean sequence)
When based on crop removal, nutrients needed are based on yield level.
4. I f applicable, adjusted P2O5 Application Rate according to Threshold or P Index.
Step 3 P205 x 0
5. Nitrogen Credits from previous legume crop (Ibs/ac. from Table 4)
6. Fertilizer Credits (Starter or Other) (Ibs/ac)
Otrogen credits for previous manure applications bs/ac) Table 5 value x net application of manure nutrients
"N" In previous year(s)
». Plant Nutrients Neeaea minus creaits (ibs/ac) (Step 3 for N minus Steps 5, 6, & 7 or Step 4 for P2O5 minus Step 6)
» . N u t r i e n t s in M a n u r e (lbs/ton) Circle<SoiiBs>r Liquids (Use lab test or weighted value as determined in Worksheet 1)
10. Percent Nutrients Retained in system (1 aoie i) Enter Table value as a decimal. (Enter zero with lab analysis)
1 1 . Net Retained Nutrients in Manure (Ibs./ton)
(Step 9 x Step 10) Enter zero with lab analysis.
12. Percent of available nutrients (Table 3)
13. Net available nutrients (Ibs./ton) (Step 11 x Step 12 without lab analysis. Step 9 x Step 12 with lab analysis)
14. APPLICATION RATE (tons/ac)
(Step 8 / Step 13)
Note: Application limitations may apply. See 590 Standard
15. Net Application Amount for All Nutrients (ibs/ac)
UStepl3xStepl4] lutrient Needs or Surpluses (ibs/ac)
(Step 15 minus Step 8) "-" sign indicates need
Tons Available Solids
48.69 -Tons Applied in Field (Step 14 x Field Acres)
200 ST
TOD"
mz
"50%"
8.97
60%
5.38
TH5"
14.25
-185.75
53
Orchardgrass Hay
4 Tons/Acre
P.O 2^5
ST
"^T
"55W
6.58
80%
5.26
TBS"
13.93
13.93
^ B a l a n c e
K.O
90 ST
W
"^5"
"55%
7.83
100%
7.83
TBB"
20.74
-69.26
-4.31

'Tons Available 0.00 -Tons Applied in Field Solids (Step 14 x Field Acres)
iMH WORKSHEET 2 - NUTRIENT BALANCE
Tract Field No. Acres Soil Test P V
0.000008
|
alue (Mehlich 3)Q
= Balance 0
|
1. Crop or Crop Sequence/Rotation
2. Realistic Yield Goal
N P2O5 K2O 3. Plant Nutrients Needed or Allowed (ibs/ac)
(based on soil tests (ST) or crop removal (CR) rates in Table 6)
NOTE: Plant Nutrient Needs for "N" cannot exceed a one year crop
sequence (e.g., com/wheat in a com/wheat/soybean sequence)
When based on crop removal, nutrients needed are based on yield level.
4. I f applicable, adjusted P205 Application Rate according to Threshold or P Index.
Step 3 P2o5x0
*' "V. i Nitrogen Credits from previous legume crop
H
o i
0 | : ; , , . 0 y j
: •;'; 1 (Ibs/ac. from Table 4)
6. Fertilizer Credits (Starter or Other) (Ibs/ac)
7. Nitrogen credits for previous manure applications
0
o i
0 0
: (Ibs/ac) Table 5 value x net application of manure nutrients "N" in previous year(s)
o. Kiani nutrients neeoea minus i r e a i t s (ibs/ac) 0 0 0 (Step 3 for N minus Steps 5, 6, & 7 or Step 4 for PzOg minus Step 6)
» . rauinenis m m a n u r e (lbs/ton) Qrcle<5olids^r Liquids 11.22 6.93 8.25 ^use lau lesi or weigntea value as determined in Worksheet 1)
i u . percent Nutrients Ketamea in bystem ( I aoie z; Enter Table value as a decimal. (Enter zero with lab analysis)
11. Net Retained Nutrients in Manure (Ibs./ton) 0 0 0 (Step 9 x Step 10) Enter zero with lab analysis.
12. Percent of available nutrients (Table 3)
13. Net available nutrients (Ibs./ton) 0 0 0 ^Lep i i x beep i z wicnout lao analysis, step y x step 12
with lab analysis)
±*t. M r r u c A i l u n K A I C (tons/ac) #DIV/0! #DIV/0! #DIV/0I (Step 8 / Step 13)
Note: Application limitations may apply. See 590 Standard
15. Net Application Amount for All Nutrients (ibs/ac) #DIV/0! #DIV/0! #DIV/0l
, :
1
f I

wor HEET 3 - APPLICATION RATES AND LAND REQUIRER/T S Tract No.
700 Year 1
Field No.
1
2
3
4
Acres
2
2
20
80
Crop Rotation / Sequence &
Realistic Yield
Tob 2800
Hay 4 Tons
Hay 4 Tons
Pasture 3.5T
Application Date or Timing
Spring
Spring
Spring
Spring
Application Rate2/
(tons/ac or Ibs/ac)
10 T/A
7 T/A
3 T/A
0 T/A
Form 6/
(S. L, C.)
S
S
s s
Total per Field (tons or lbs)
20 T/A
14 T/A
53 T/A
0
Soil Test Phosphorus
3/
220
300
220
240
This section to be filled out with assistance from NRCS field office
P Index Rating 4/ (low, medium, high,
very high)
>
Planned BMPs 5/
BMP Date
1/ Where land application is occurring under long term lease or agreement with adjacent landowner, fields must be included in the above table. 21 Reference maximum rate per application in 590 Standard. For phosphorus based applications, a one time application can occur for crops grown in multiple years (e.g., corn following by
winter wheat followed by soybeans). 3/ When soil test P exceeds 400, use Phosphorous Threshold or Phosphorous Index 4/ P Index Rating is used to indicate the potential movement for phosphorus. A "High" or "Very High" rating value indicates the need for BMPs to reduce P movement. 5/ Fields that have a "High" or "Very High" rating according to the current P Index will implement Best Management Practices to reduce the risk of nutrient movement to sensitive waterbodies.
BMPs may include, but not be limited to: installing vegetative buffers, reducing P205 application rate, incorporating manure, adding chemical treatments to litter that tie up soluble P and keep it from moving over the landscape, and/or adjusting application timing.
6/ Nutrient Form: Enter S for solid, L for liquid, or C for commercial fertilizer.