Beef Evaluation and Pricing continued. Estimating Yield Grade Visually evaluate animal for...
59
Beef Evaluation and Pricing continued
-
Upload
rosalyn-francis -
Category
Documents
-
view
220 -
download
0
Transcript of Beef Evaluation and Pricing continued. Estimating Yield Grade Visually evaluate animal for...
Beef Evaluation and Pricing
continued
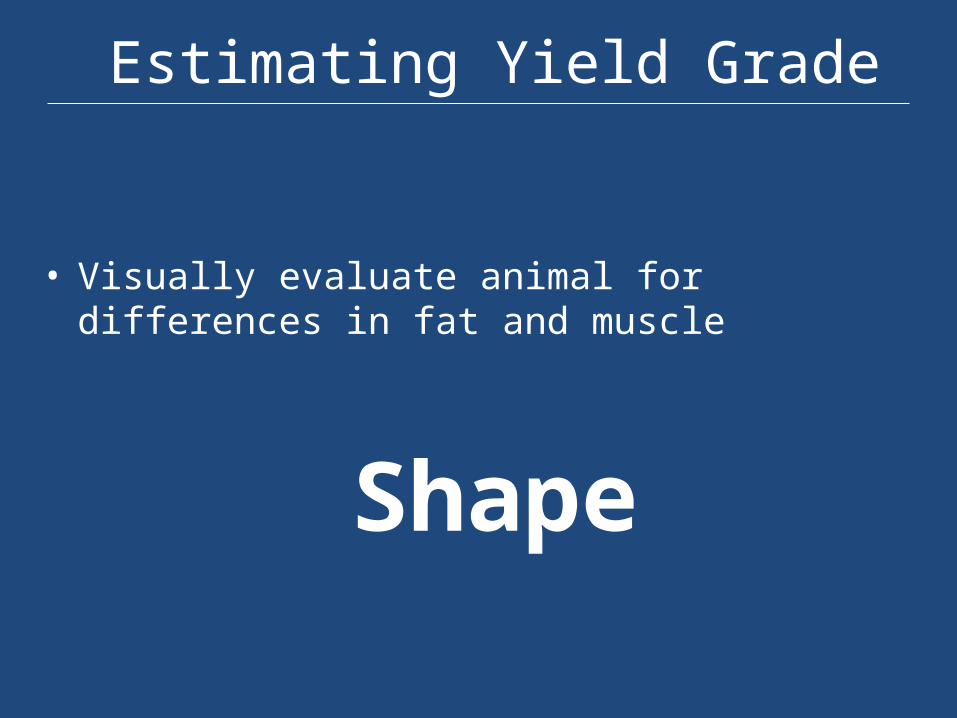
Estimating Yield Grade
• Visually evaluate animal for differences in fat and muscle
Shape
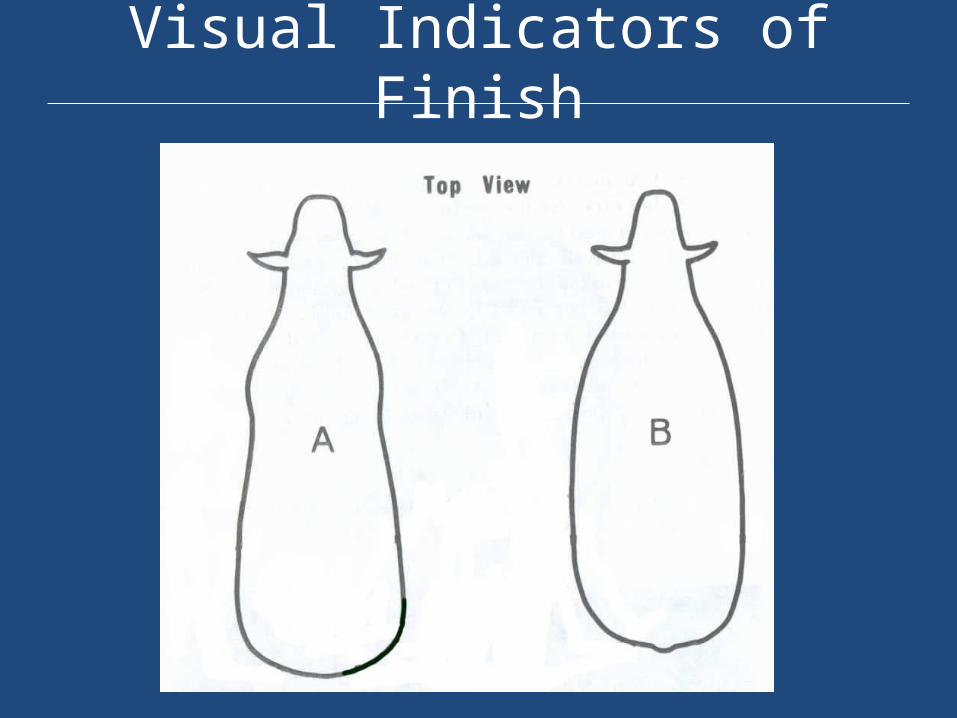
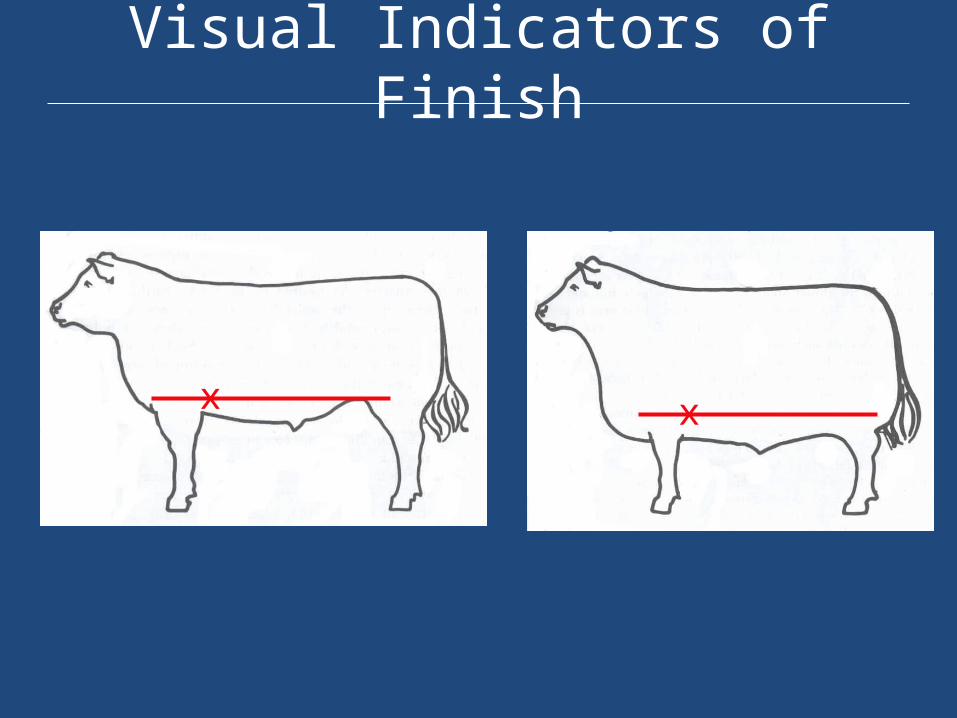
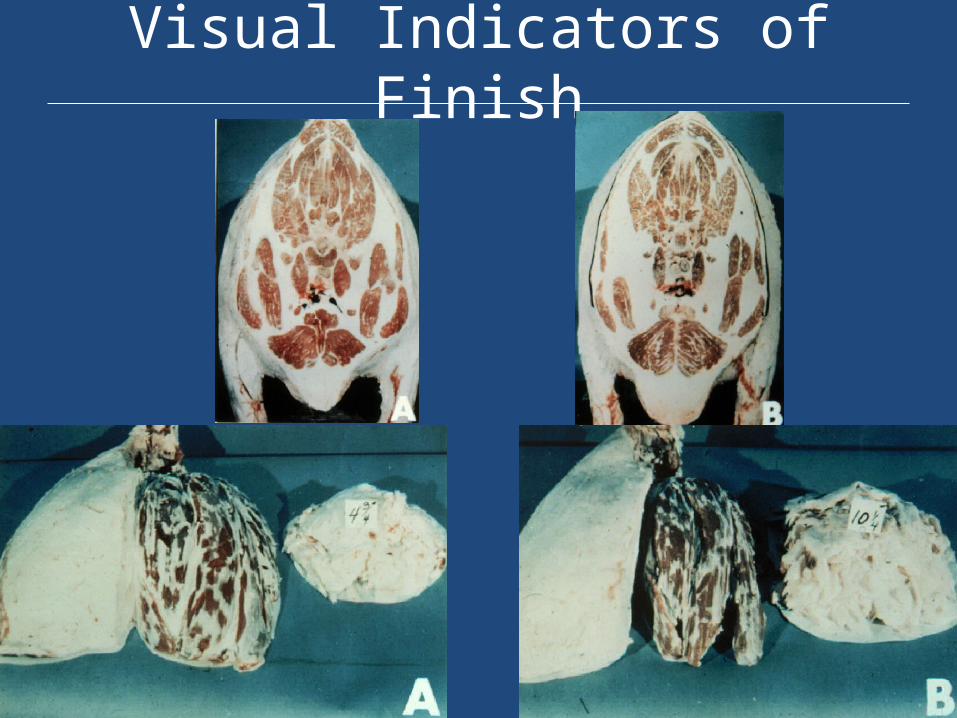
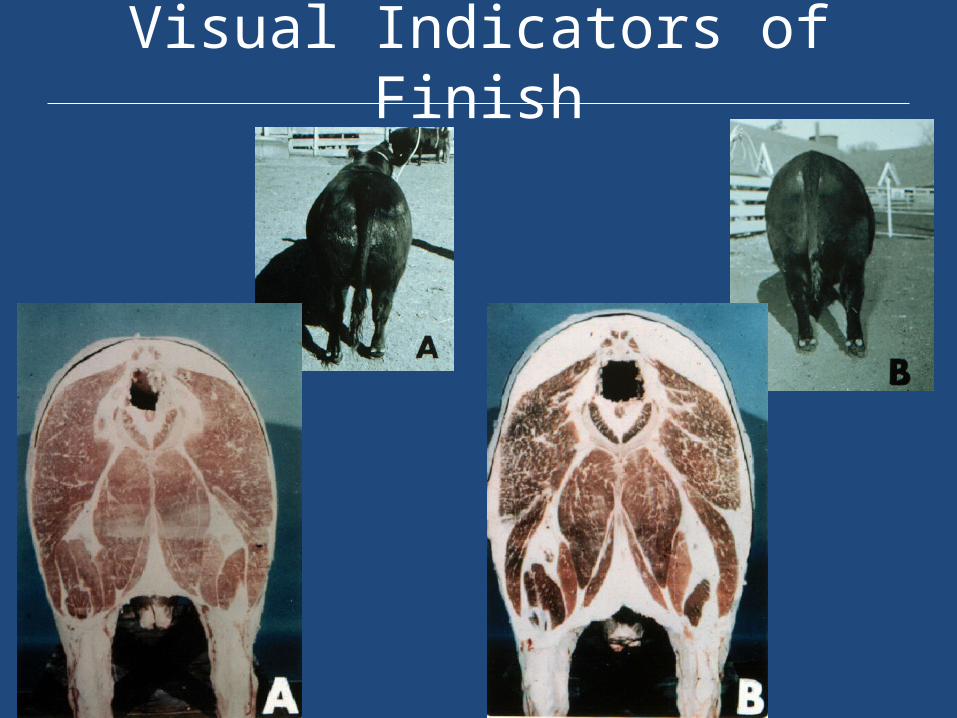
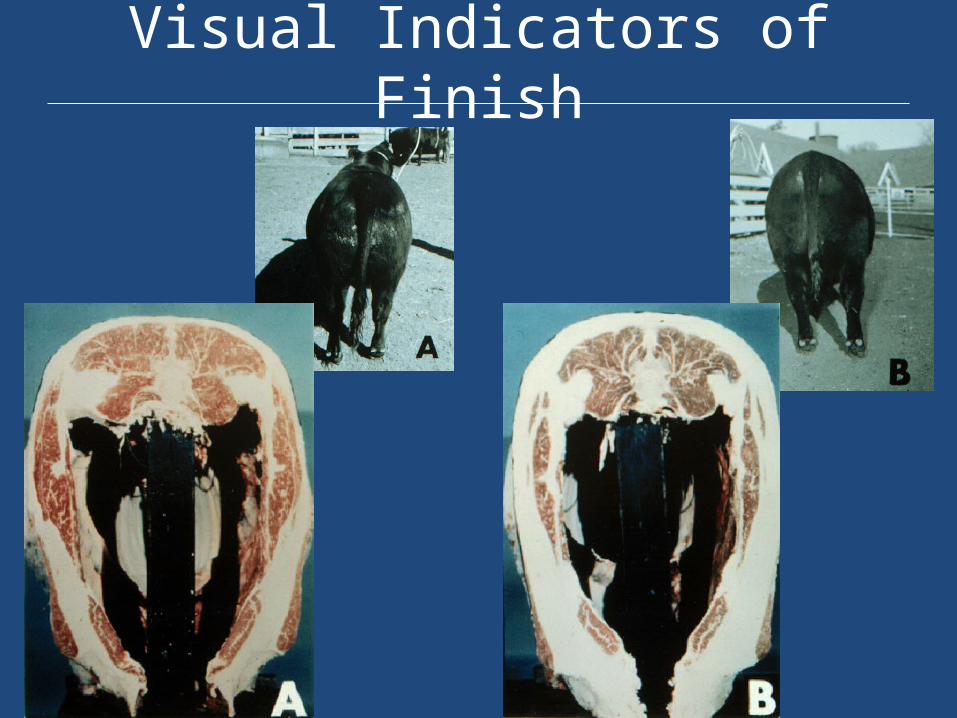
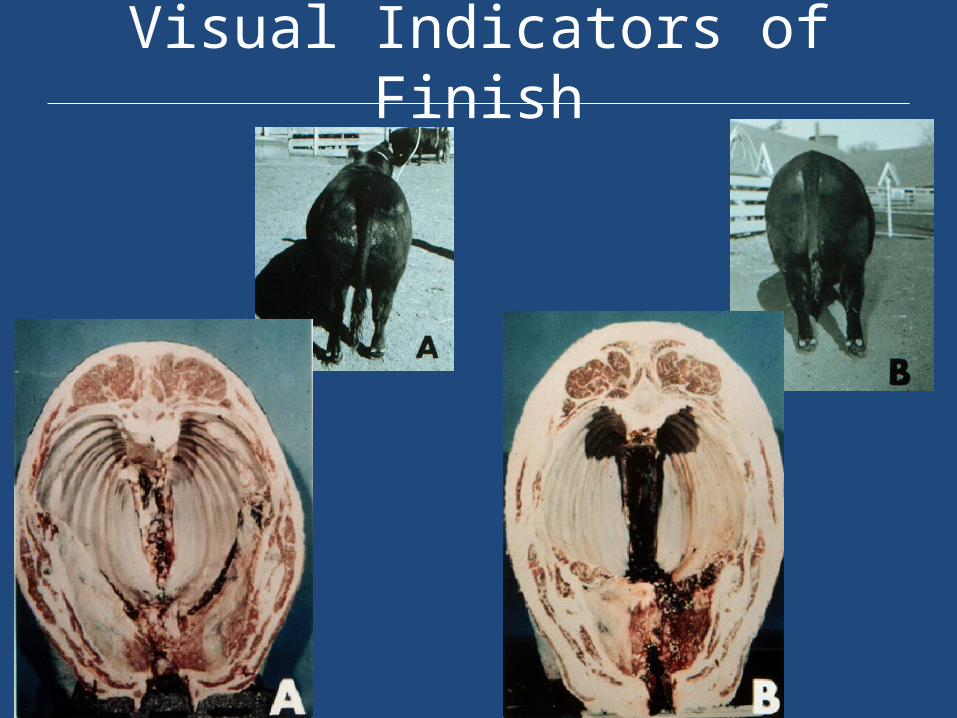
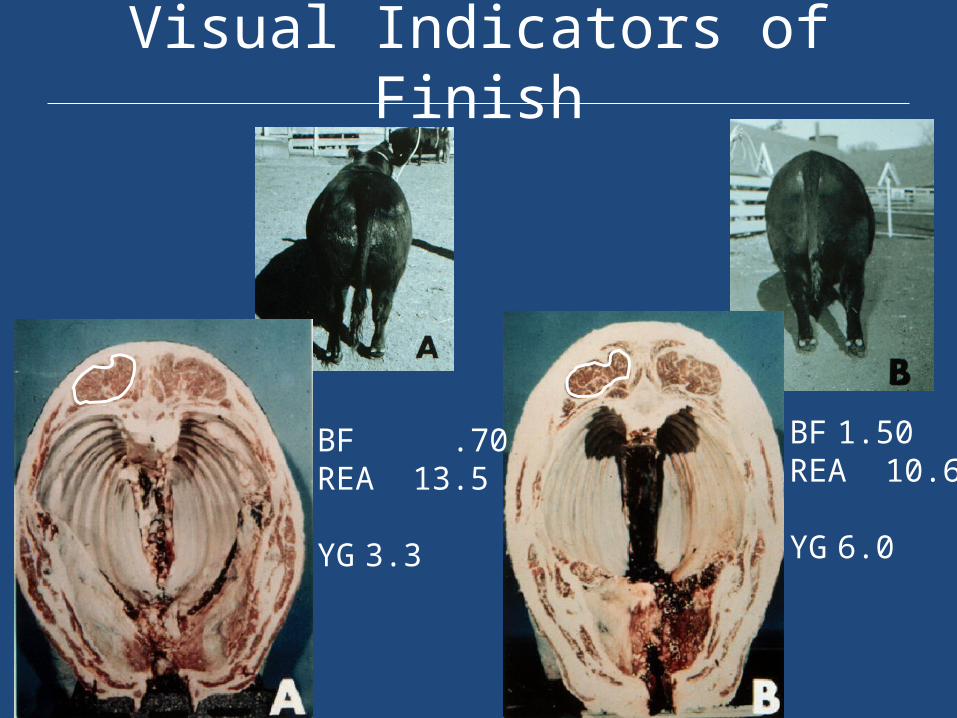
Visual Indicators of Finish
Visual Indicators of Finish
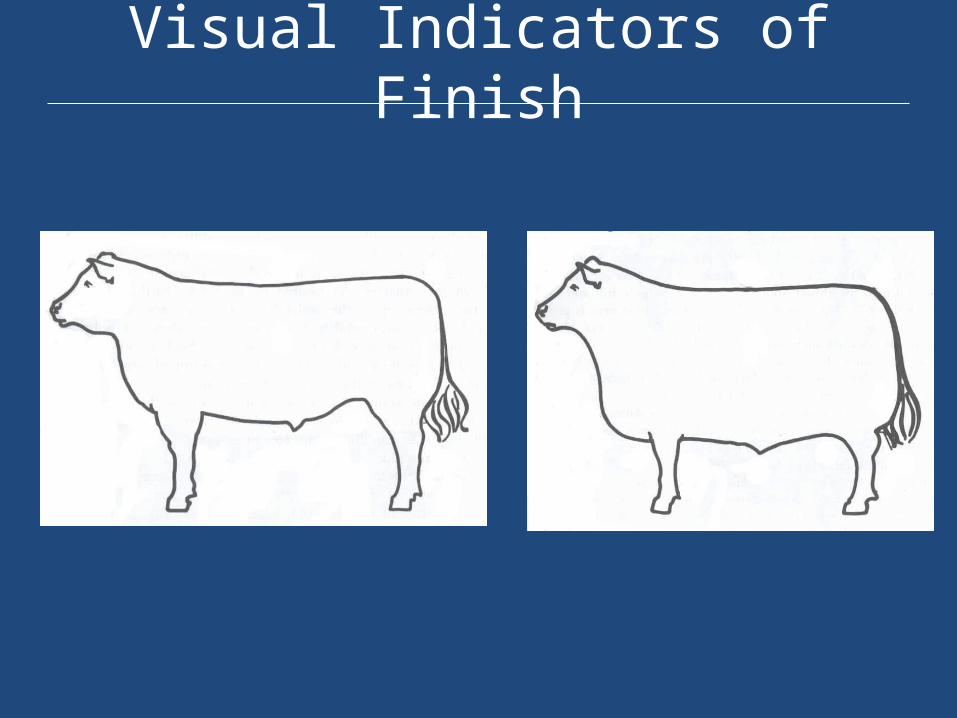
Visual Indicators of Finish
x x
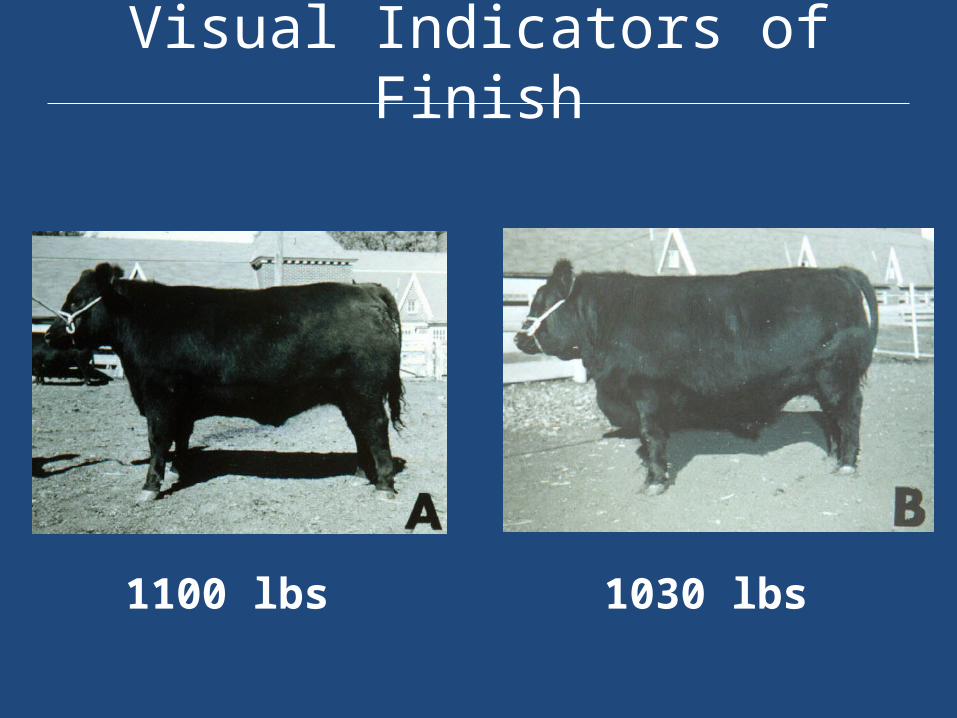
Visual Indicators of Finish
1100 lbs 1030 lbs
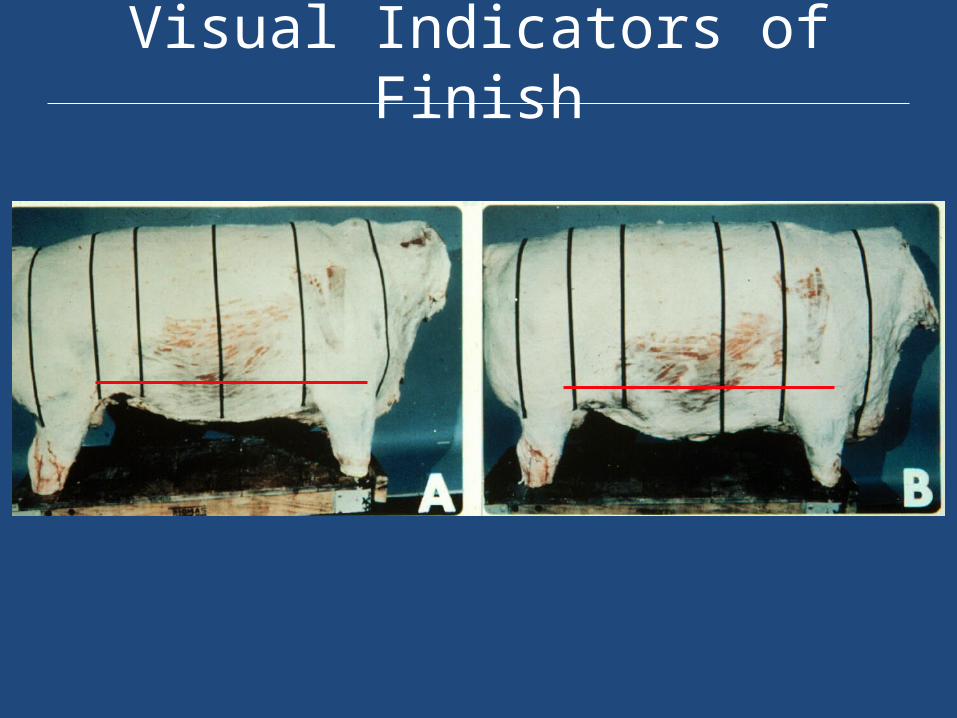
Visual Indicators of Finish
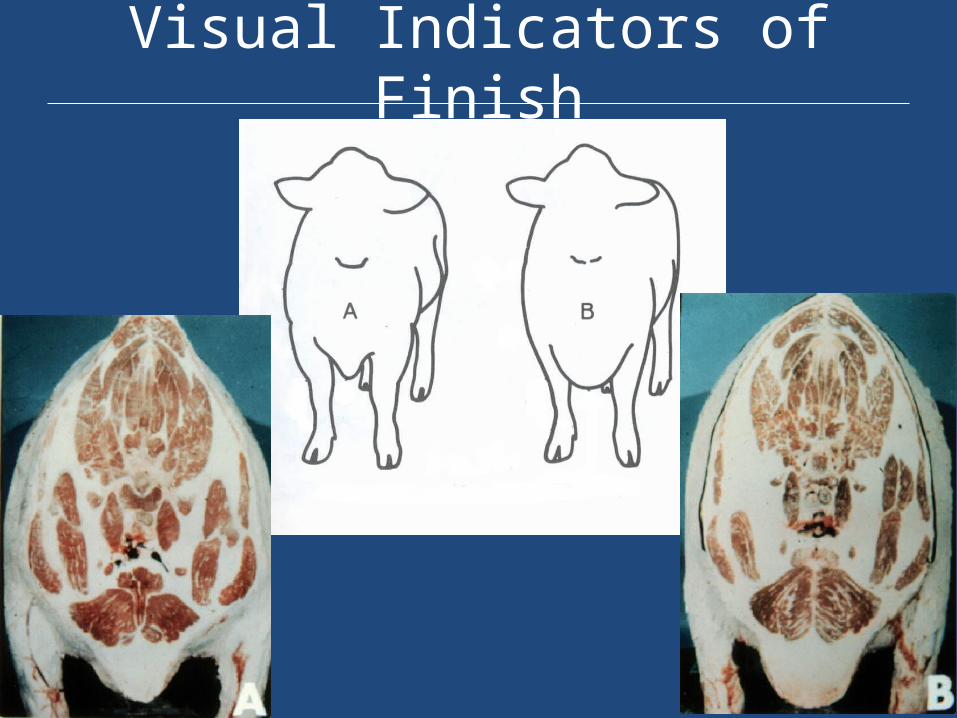
Visual Indicators of Finish
Visual Indicators of Finish

Visual Indicators of Finish

Visual Indicators of Finish
Visual Indicators of Finish
Visual Indicators of Finish
Visual Indicators of Finish
Visual Indicators of Finish
BF .70REA 13.5
YG 3.3
BF 1.50REA 10.6
YG 6.0

Visual Indicators of Finish
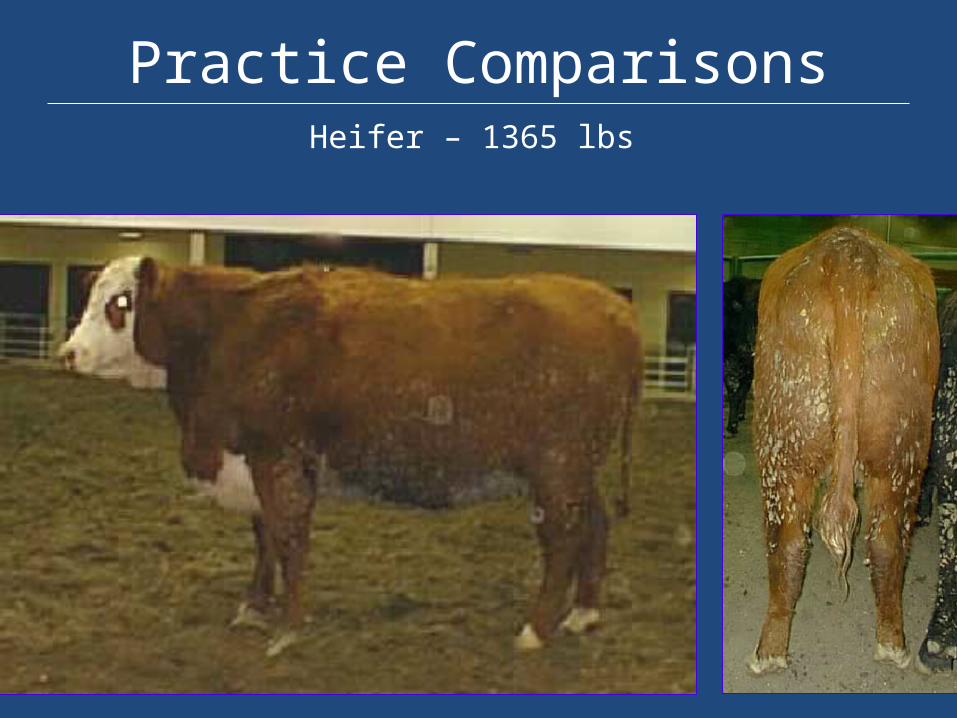
Practice ComparisonsHeifer – 1365 lbs
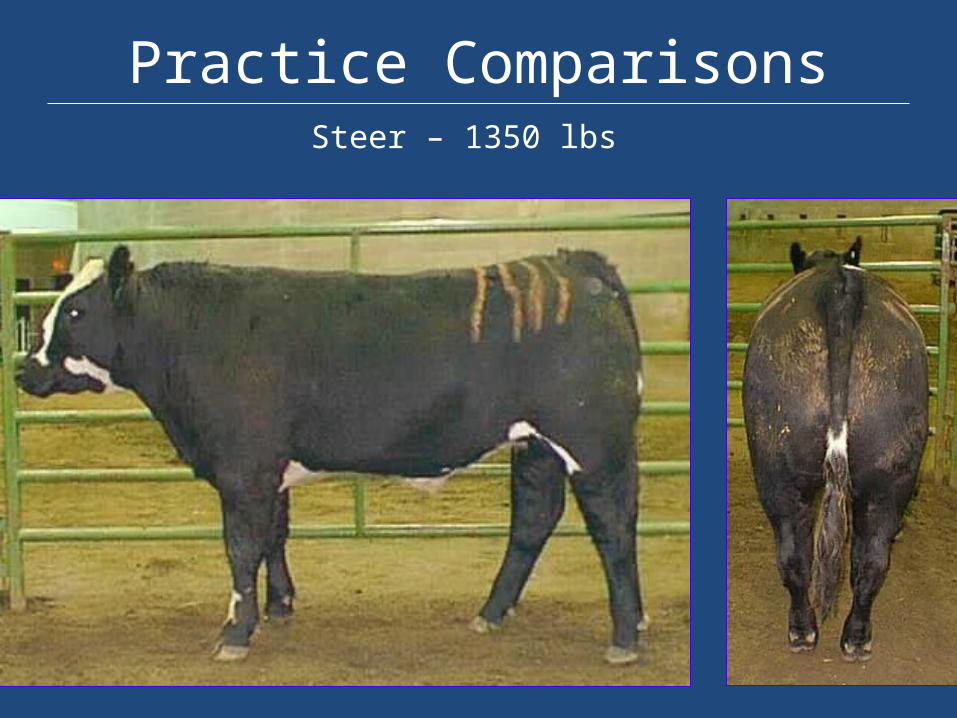
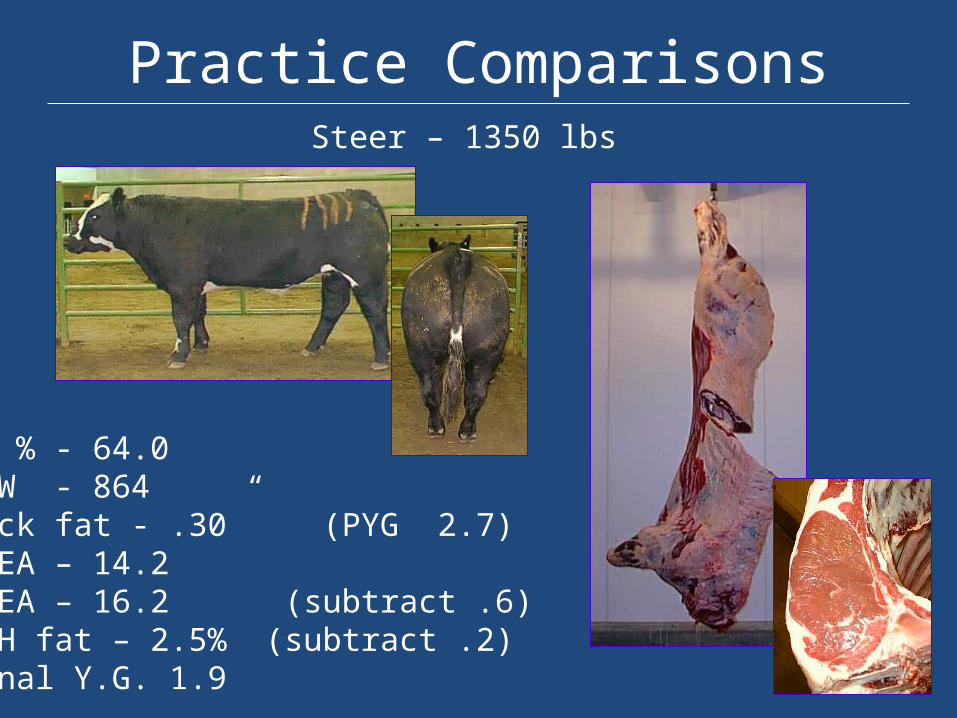
Practice ComparisonsSteer – 1350 lbs

Practice ComparisonsHeifer – 1365 lbs
DP % - 60.6HCW - 828Back fat - .90” (PYG 4.3)RREA – 13.7AREA - 10.8 (add .9)KPH fat – 3.5% (no adjustment)Final Y.G. 5.2
Practice ComparisonsSteer – 1350 lbs
DP % - 64.0HCW - 864Back fat - .30” (PYG 2.7)RREA – 14.2AREA – 16.2 (subtract .6)KPH fat – 2.5% (subtract .2)Final Y.G. 1.9
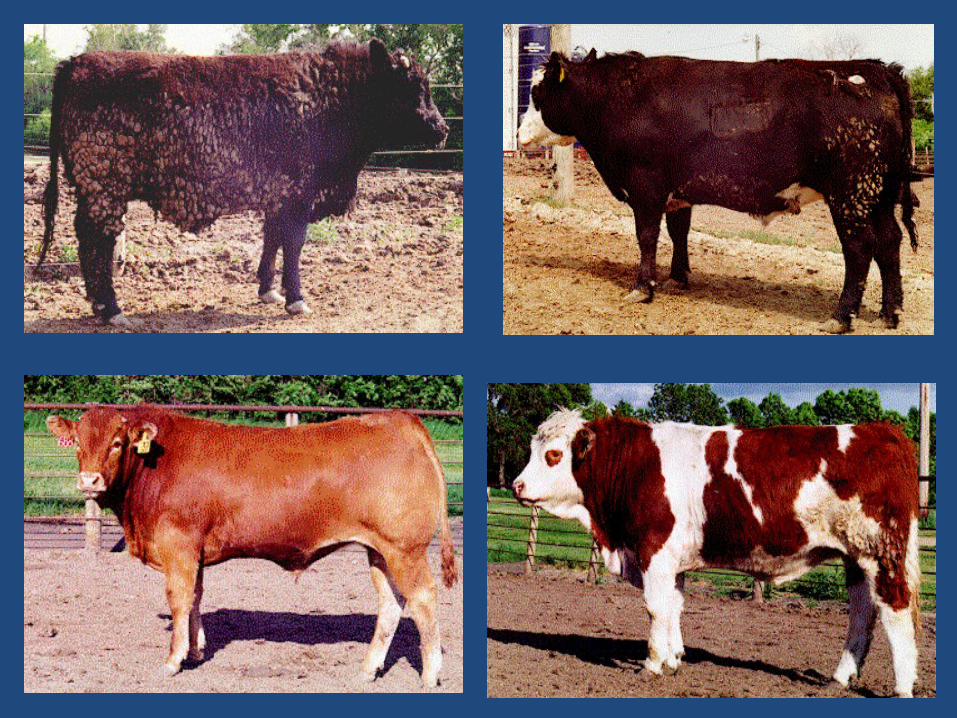
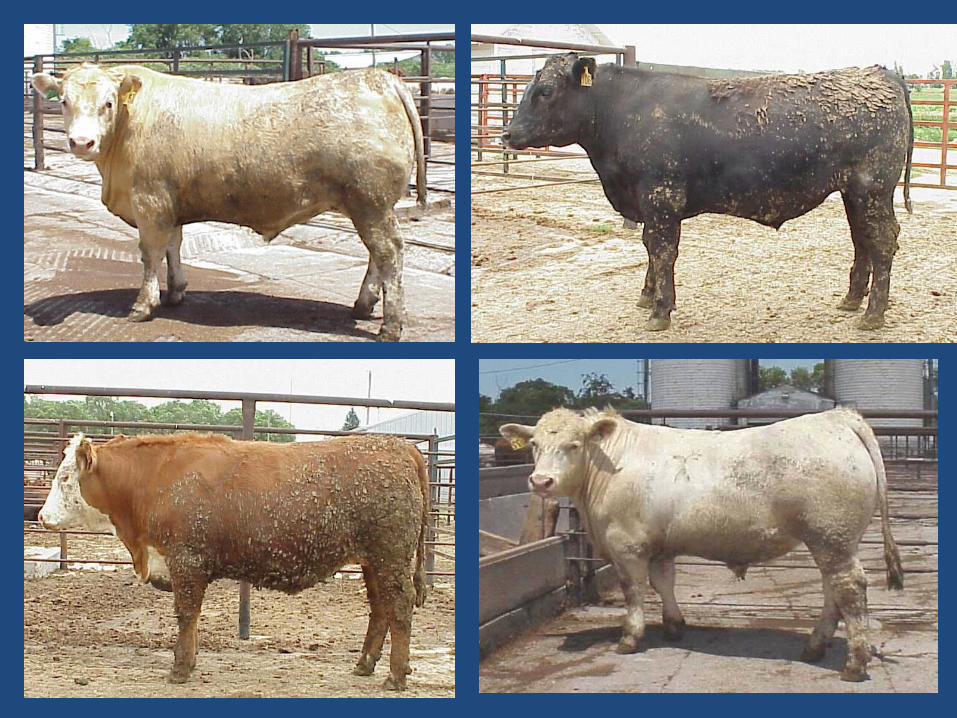
What is in a pen of cattle?
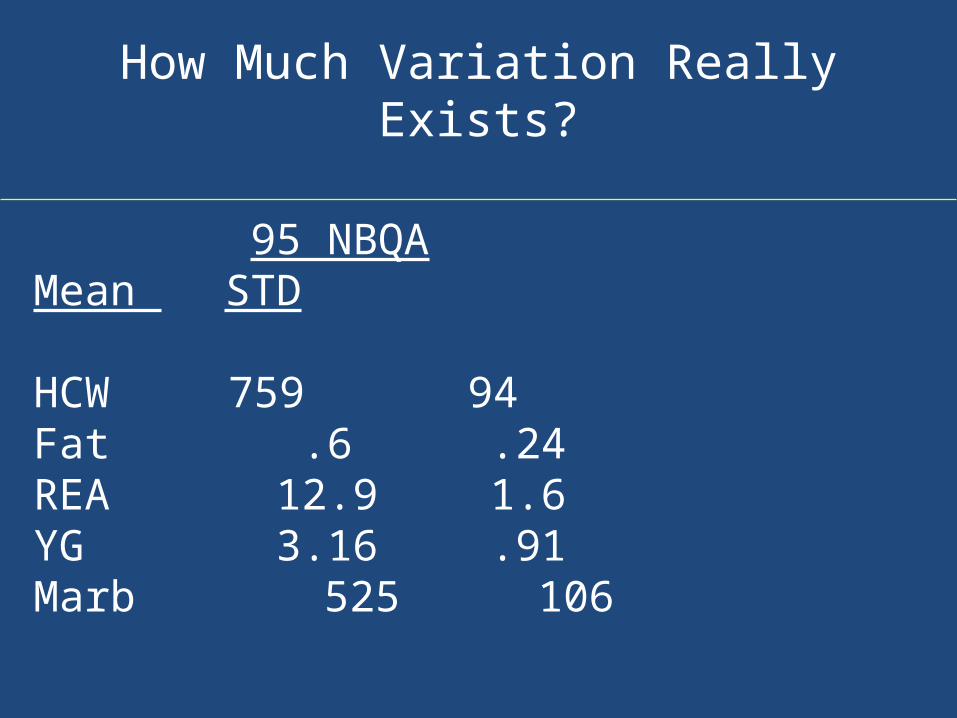
How Much Variation Really Exists?
95 NBQA Mean STD
HCW 759 94Fat .6 .24REA 12.9 1.6YG 3.16 .91Marb 525 106
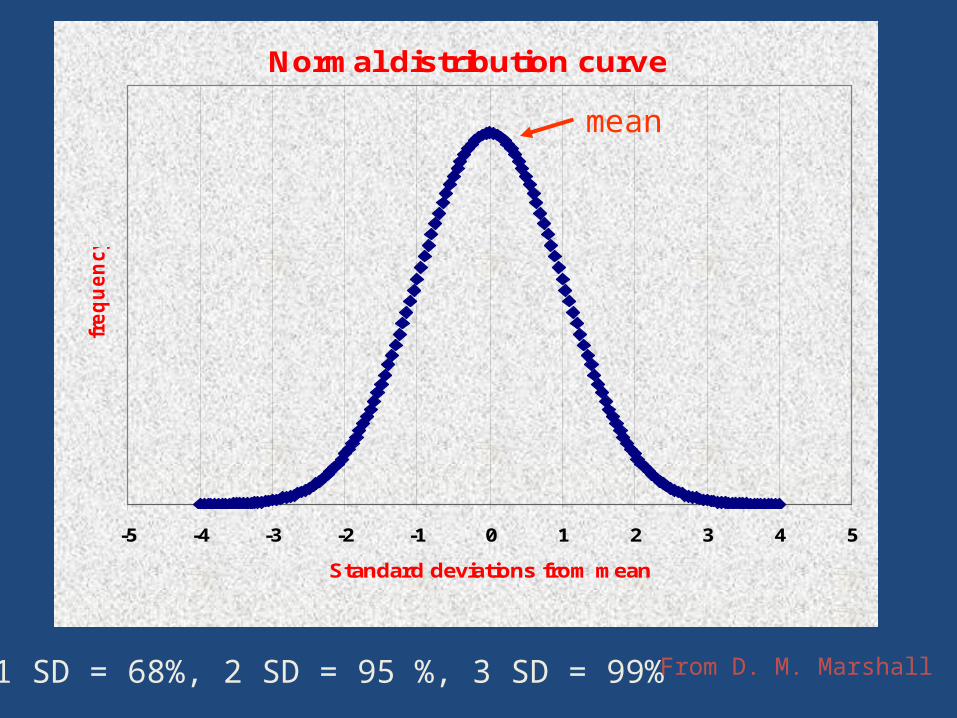
Normal distribution curve
-5 -4 -3 -2 -1 0 1 2 3 4 5
Standard deviations from mean
fre
qu
en
cy
1 SD = 68%, 2 SD = 95 %, 3 SD = 99%
mean
From D. M. Marshall


Frame Size
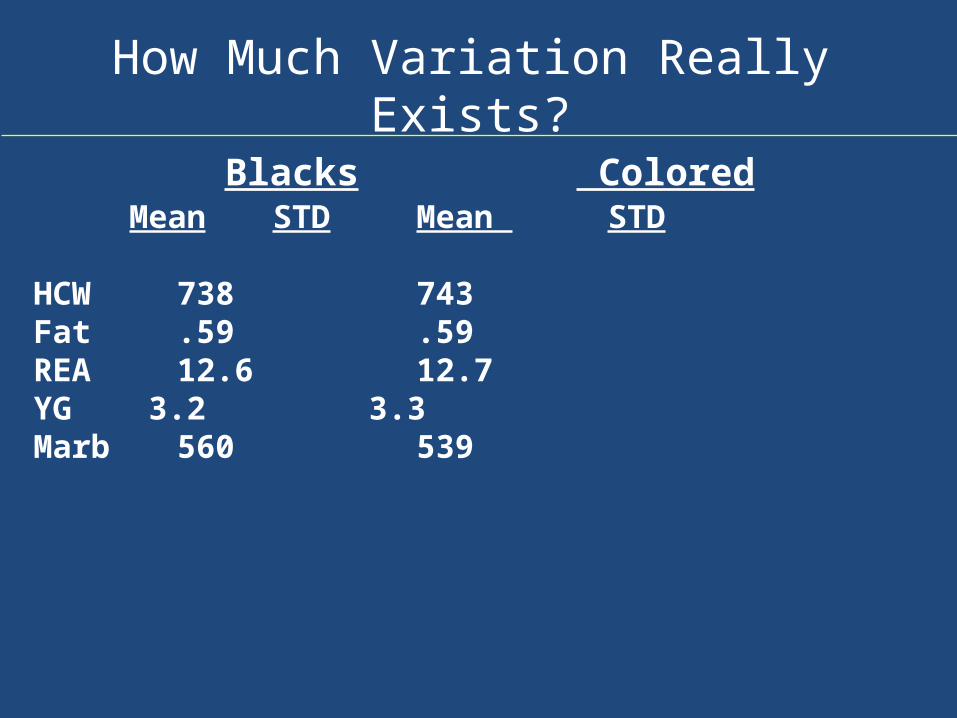
How Much Variation Really Exists?
Blacks ColoredMean STD Mean STD
HCW 738 743Fat .59 .59REA 12.6 12.7YG 3.2 3.3Marb 560 539
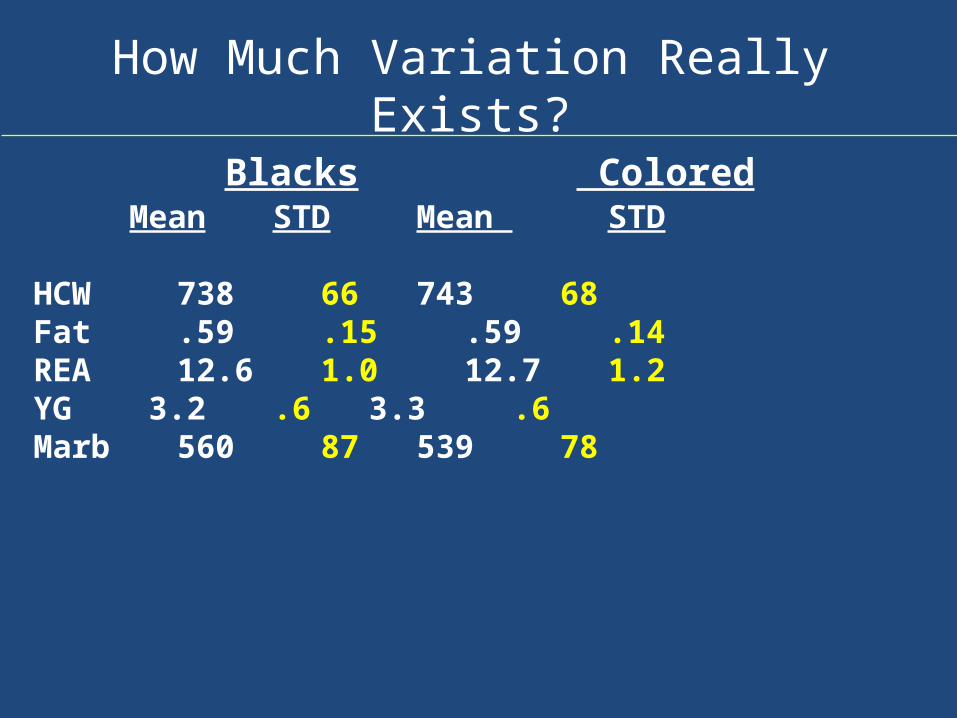
How Much Variation Really Exists?
Blacks ColoredMean STD Mean STD
HCW 738 66 743 68Fat .59 .15 .59 .14REA 12.6 1.0 12.7 1.2YG 3.2 .6 3.3 .6Marb 560 87 539 78
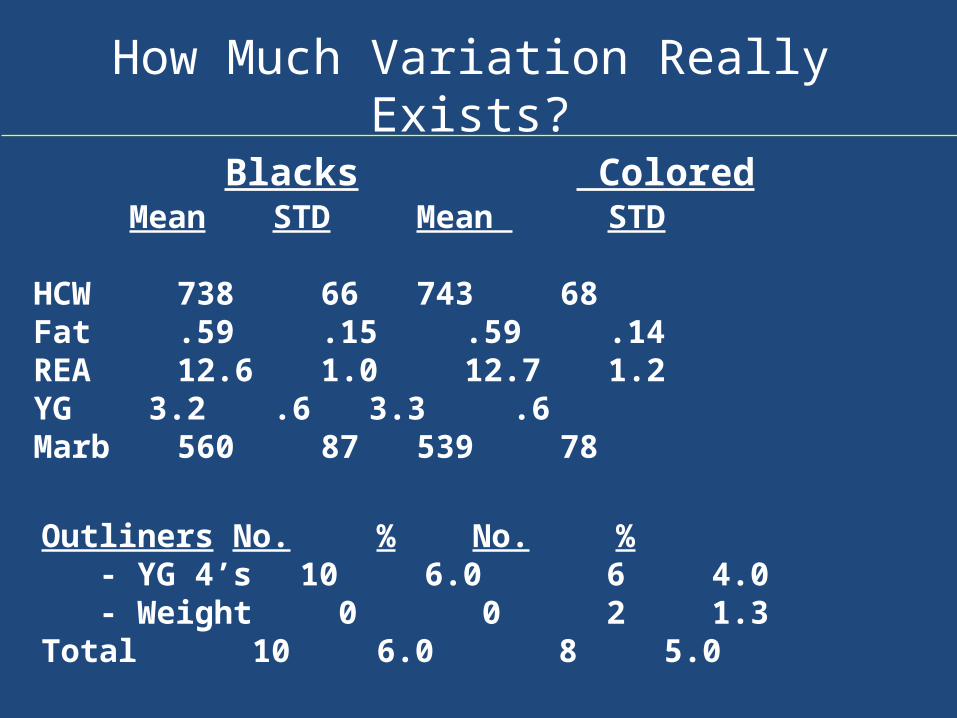
How Much Variation Really Exists?
Blacks ColoredMean STD Mean STD
HCW 738 66 743 68Fat .59 .15 .59 .14REA 12.6 1.0 12.7 1.2YG 3.2 .6 3.3 .6Marb 560 87 539 78
Outliners No. % No. % - YG 4’s 10 6.0 6 4.0 - Weight 0 0 2 1.3Total 10 6.0 8 5.0
Fitting Cattle to a Grid

Grid 1 Grid 2 P & DBase 112 117 112Prime +11.00 +3.00 5.5Premium Ch +10.00 - 2.58Choice - - -Select -7.00 -11.00 -8.25Standard -28.00 -30.00 -18.25YG 1 +6.50 +2.00 +2.42YG 2 +2.50 +3.00 +1.00YG 3 - - -YG 4 -12.00 -12.00 -15.67
YG 4 -11.00 -12.00
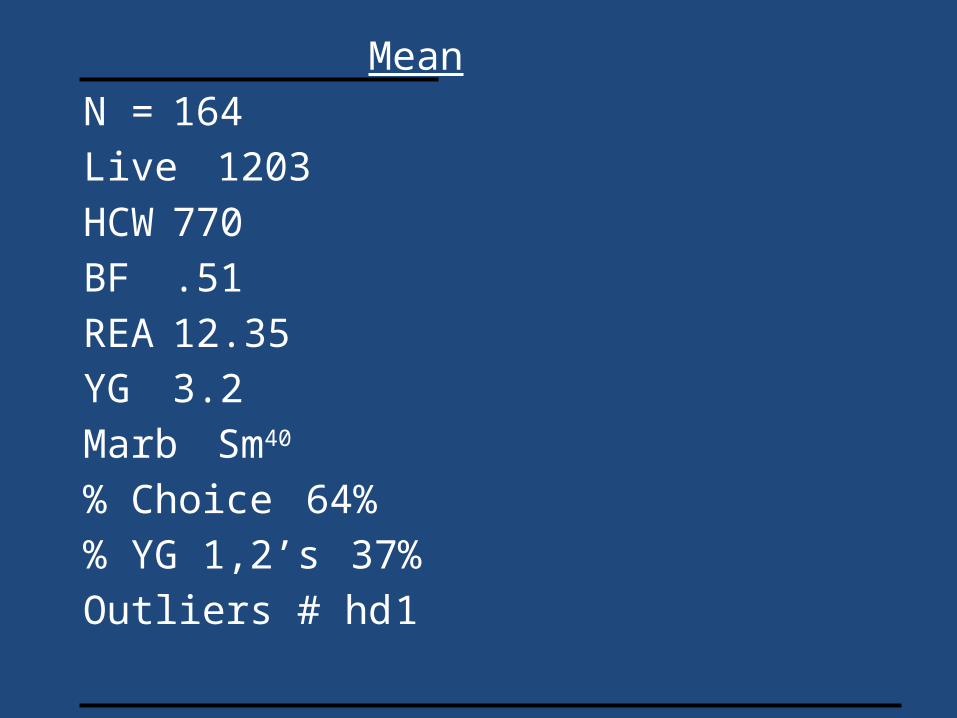
MeanN = 164Live 1203HCW 770BF .51REA 12.35YG 3.2MarbSm40
% Choice 64%% YG 1,2’s 37%Outliers # hd 1
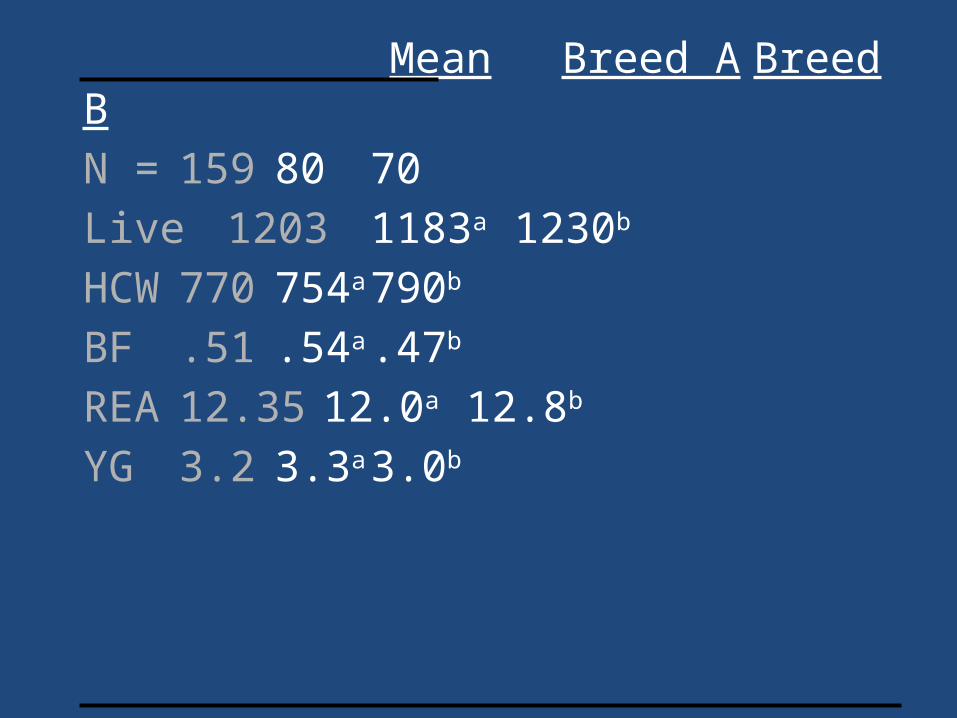
Mean Breed A Breed BN = 159 80 70Live 1203 1183a 1230b
HCW 770 754a 790b
BF .51 .54a .47b
REA 12.35 12.0a 12.8b
YG 3.2 3.3a 3.0b
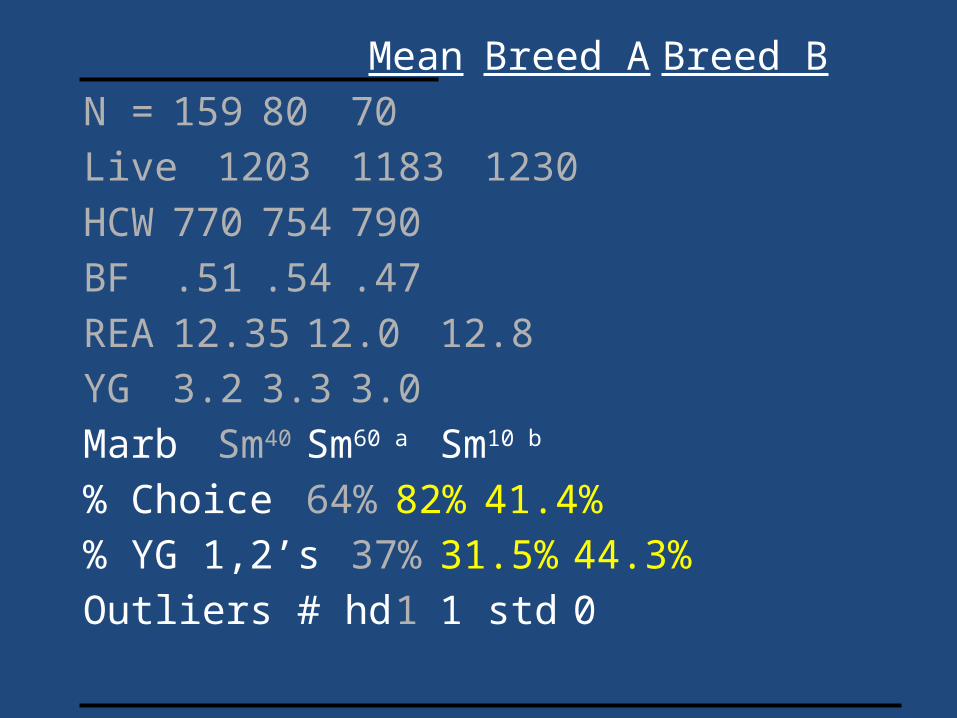
Mean Breed A Breed BN = 159 80 70Live 1203 1183 1230HCW 770 754 790BF .51 .54 .47REA 12.35 12.0 12.8YG 3.2 3.3 3.0MarbSm40 Sm60 a Sm10 b
% Choice 64% 82% 41.4%% YG 1,2’s 37% 31.5% 44.3%Outliers # hd 1 1 std 0

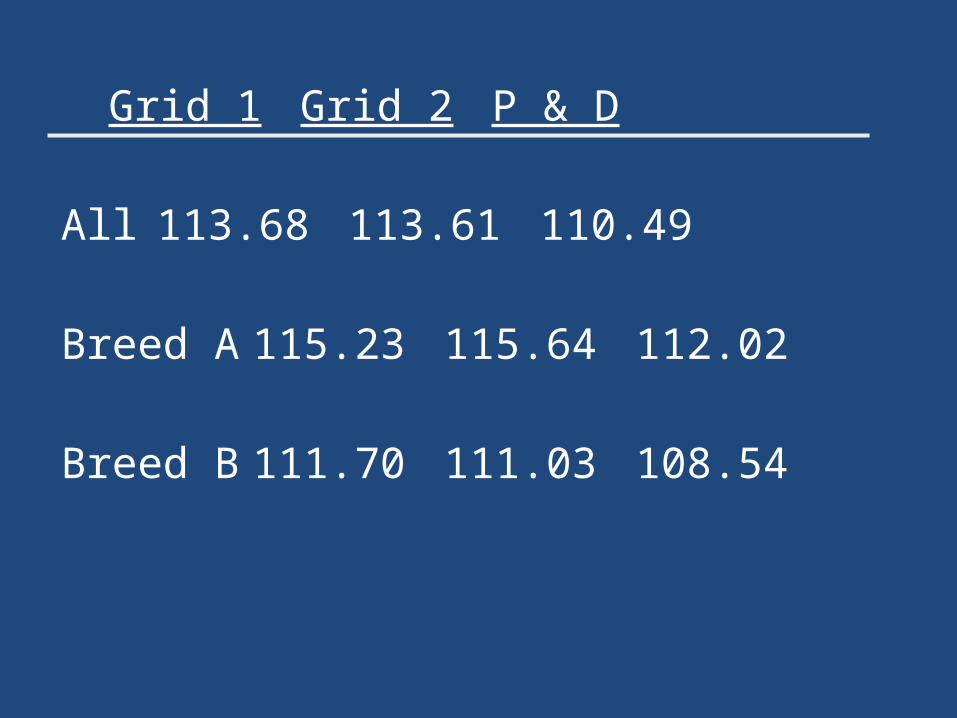
Grid 1 Grid 2 P & D
All 113.68 113.61 110.49
Grid 1 Grid 2 P & D
All 113.68 113.61 110.49
Breed A 115.23 115.64 112.02
Breed B 111.70 111.03 108.54
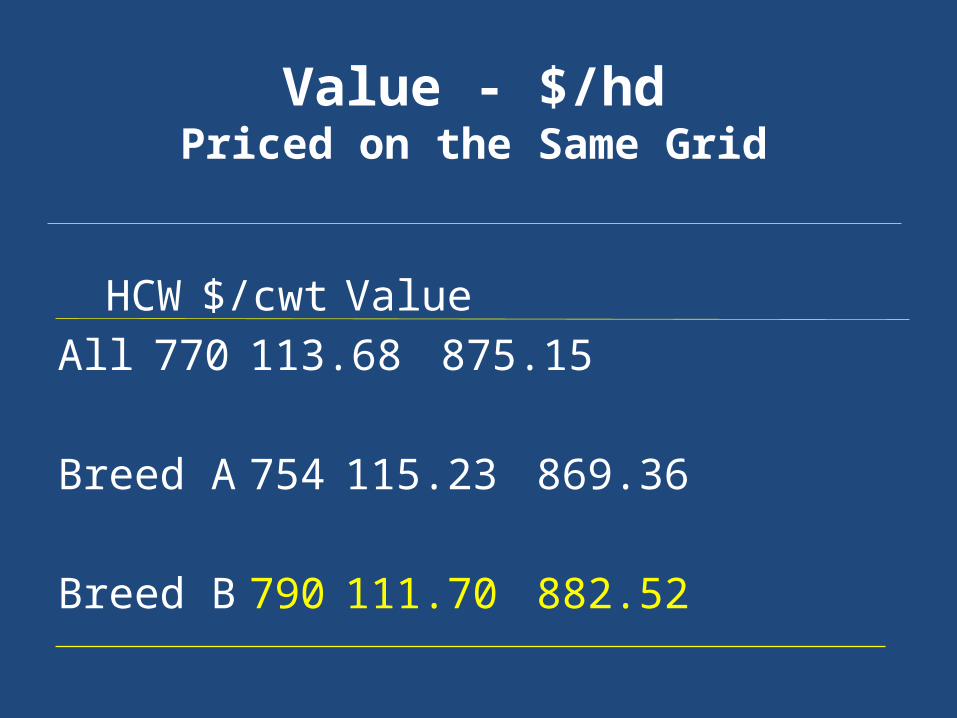
HCW $/cwt ValueAll 770 113.68 875.15
Breed A 754 115.23 869.36
Breed B 790 111.70 882.52
Value - $/hdPriced on the Same Grid

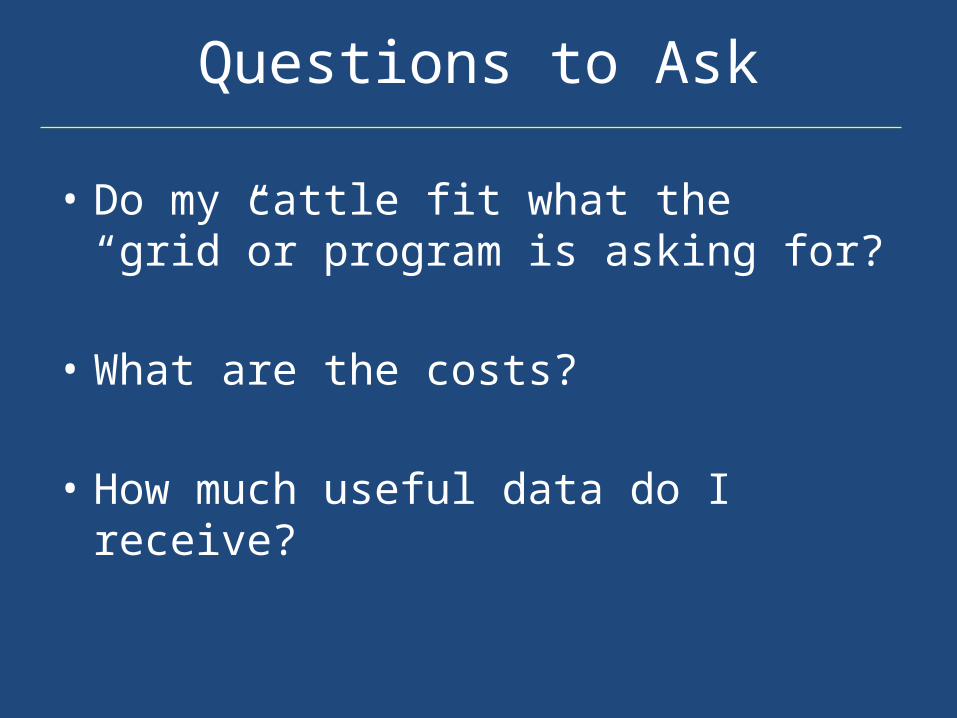
Questions to Ask
• Do my cattle fit what the “grid”or program is asking for?
• What are the costs?
• How much useful data do I receive?
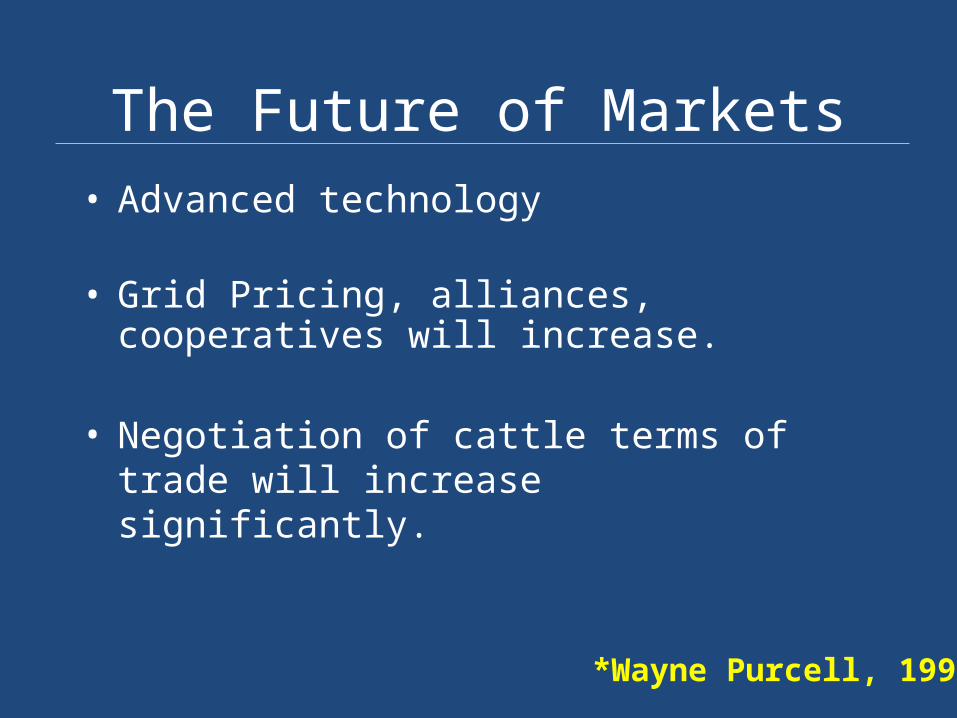
The Future of Markets• Advanced technology
• Grid Pricing, alliances, cooperatives will increase.
• Negotiation of cattle terms of trade will increase significantly.
*Wayne Purcell, 1997

The Future of Cattle Evaluation

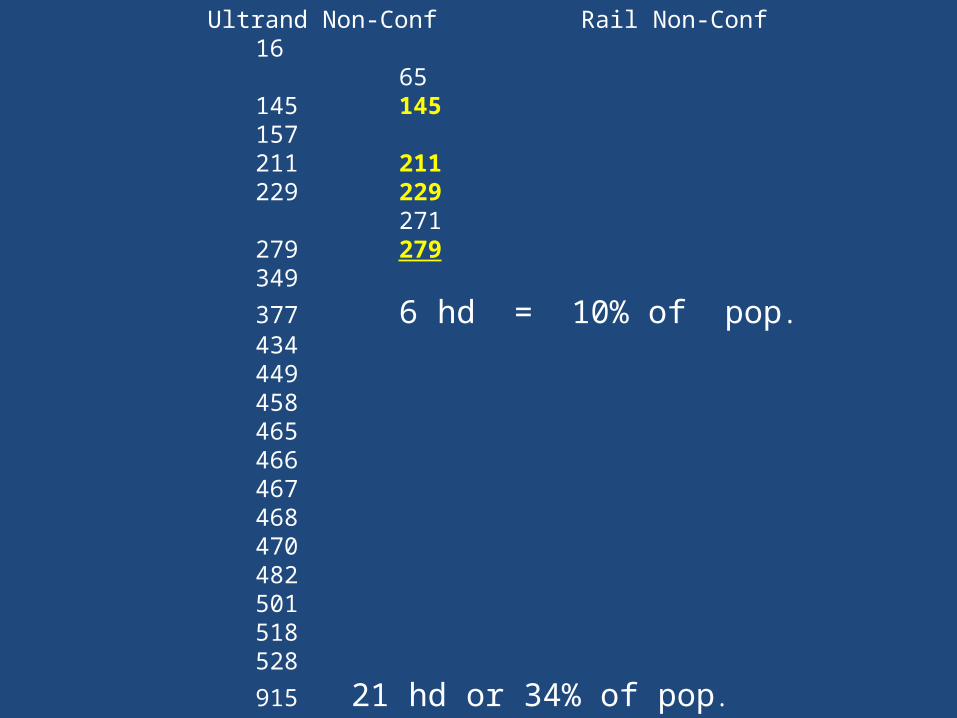
Ultrand Non-Conf Rail Non-Conf16
65145 145157211 211229 229
271279 279349
377 6 hd = 10% of pop.434449458465466467468470482501518528
915 21 hd or 34% of pop.
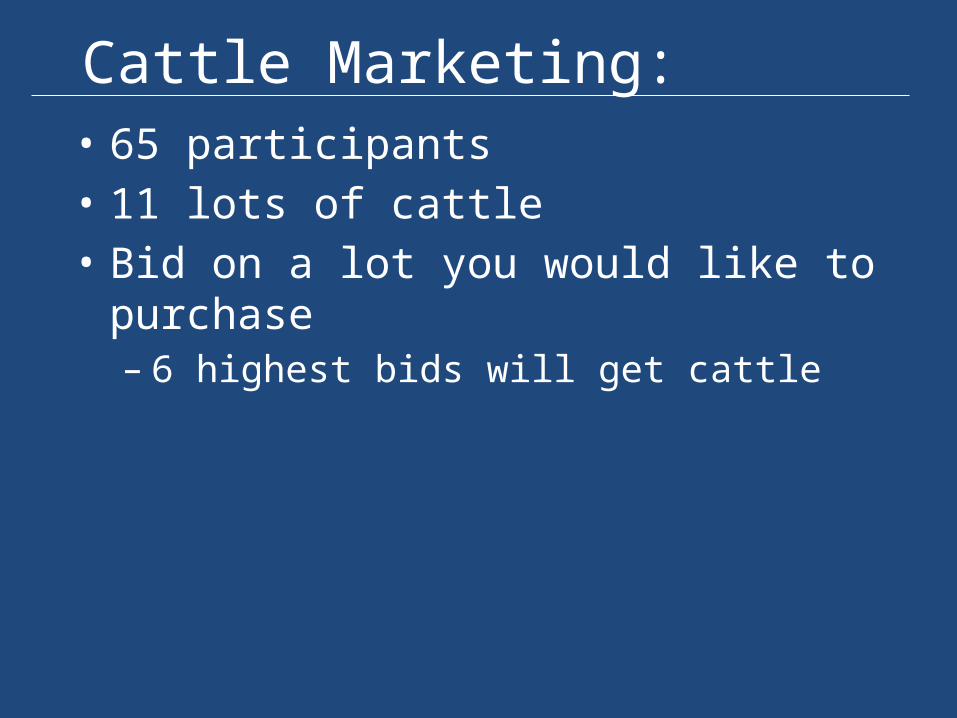
Cattle Marketing:• 65 participants• 11 lots of cattle• Bid on a lot you would like to purchase– 6 highest bids will get cattle
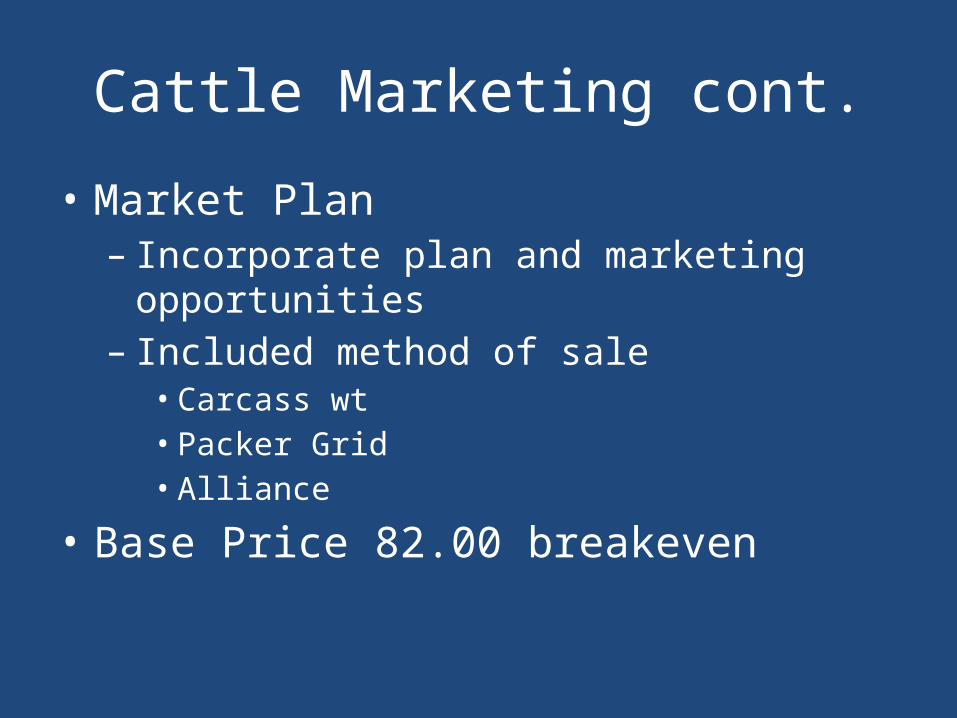
Cattle Marketing cont.
• Market Plan– Incorporate plan and marketing opportunities – Included method of sale• Carcass wt• Packer Grid• Alliance
• Base Price 82.00 breakeven

Cattle Marketing:1) Angus 2) Angus3) Herefords4) Black Baldies5) Limousin x Angus calfhood implanted6) Red Angus7) Red Angus x Continental cross cows8) Simmental x Red Angus cross cows9) Charolais x Angus10) Limousin sired ~ Non-implanted antibiotic free11) Crossbred 70% colored 30% blacks

Marketing Methods:Packer Grids (Tyson and Swift)1) Cutability based grid2) Quality (CAB type grid)3) Excel ~ Angus America
Black Angus Red Angus
4) Certified Hereford ~ Greater Omaha5) Laura’s Lean

Lot 1:Angus
Top carcass oriented AI bulls and sired cowsHistory – 85% choice 55% CAB, 10% YG4’sNon implantedMed – Large Frame

Lot 2:Angus
Angus bulls some carcass EPD’sNo HistoryNo ImplantsMed Frame
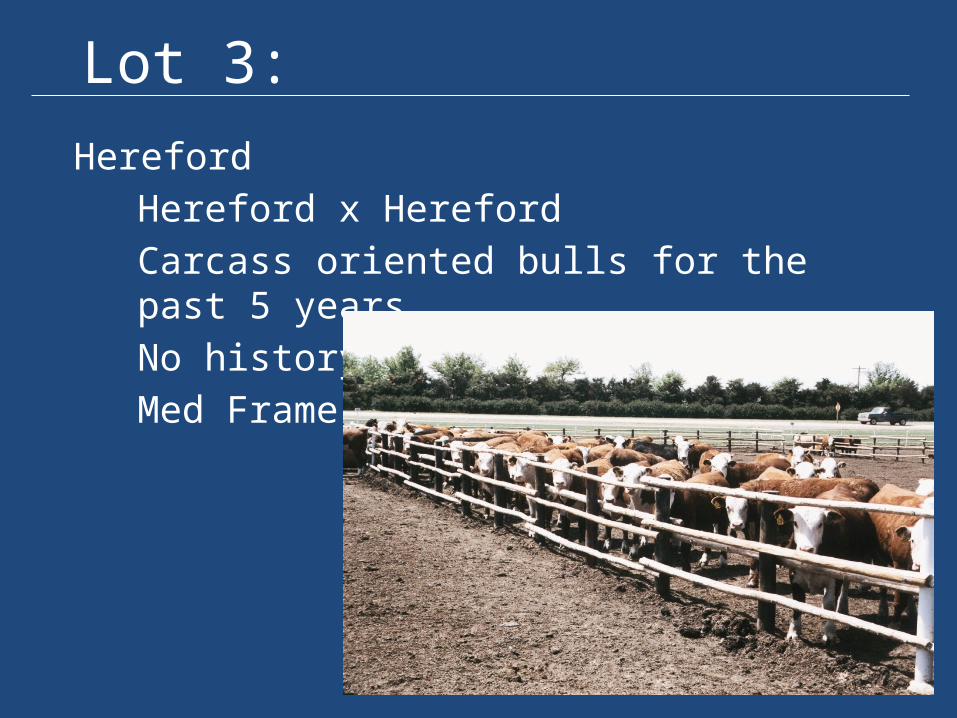
Lot 3:Hereford
Hereford x HerefordCarcass oriented bulls for the past 5 yearsNo historyMed Frame
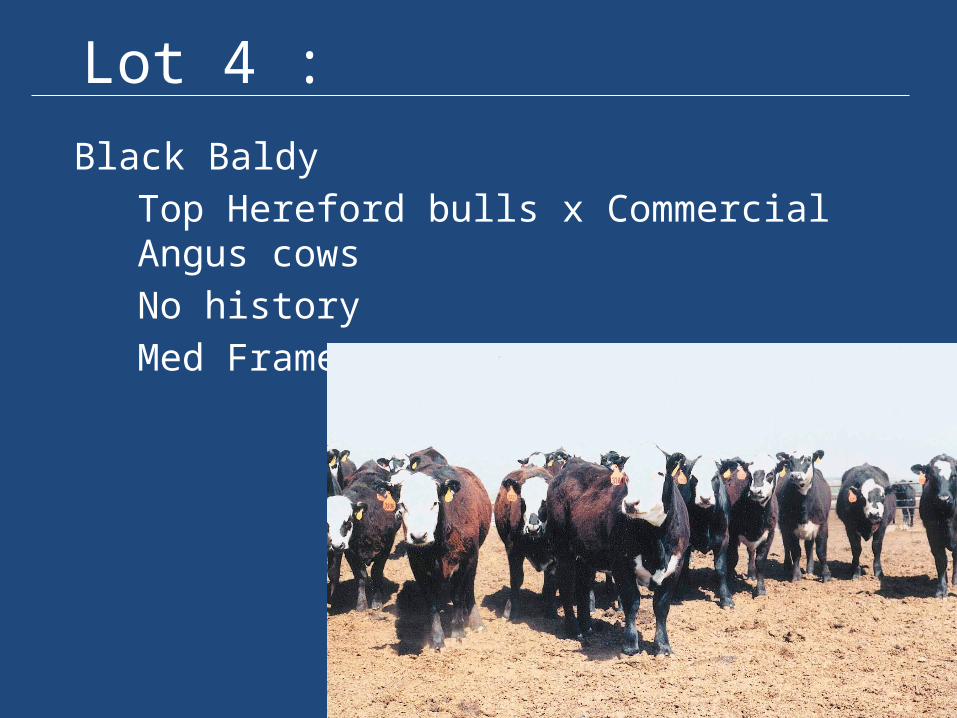
Lot 4 :Black Baldy
Top Hereford bulls x Commercial Angus cowsNo historyMed Frame
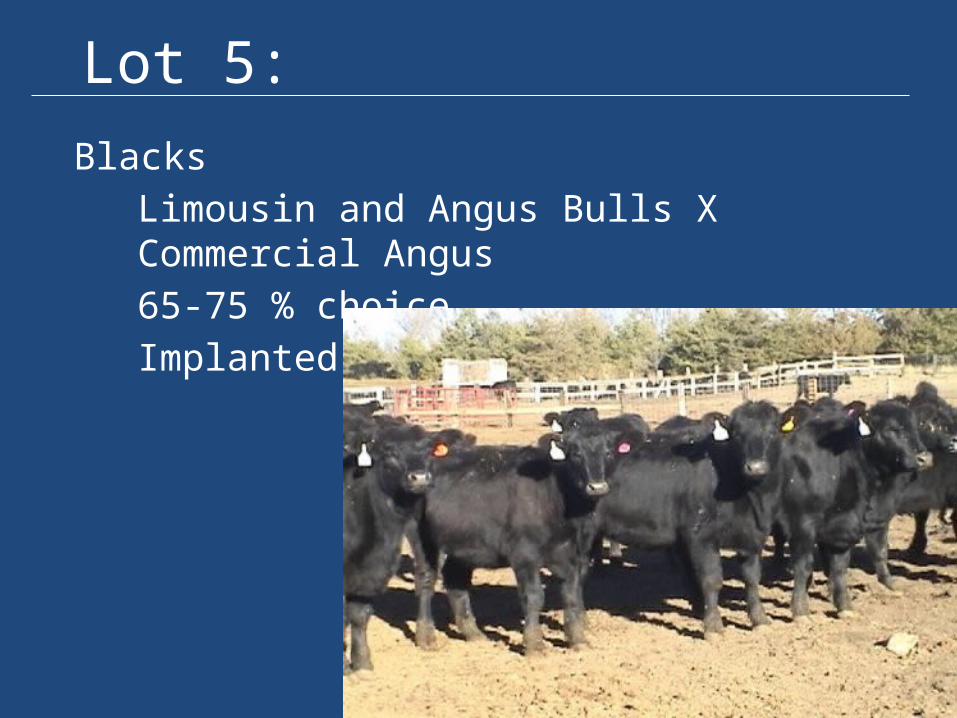
Lot 5:Blacks
Limousin and Angus Bulls X Commercial Angus65-75 % choiceImplanted
Lot 6 :Red Angus
Top Red Angus Genetics on selected cowsHistory 85 % choiceNon Implanted
Lot 7:
Red Angus siredNo history

Lot 8:Red Cross Calves
Simmental bulls X Red Angus cross cowsExcellent growth and production dataLittle carcass data but positiveImplanted
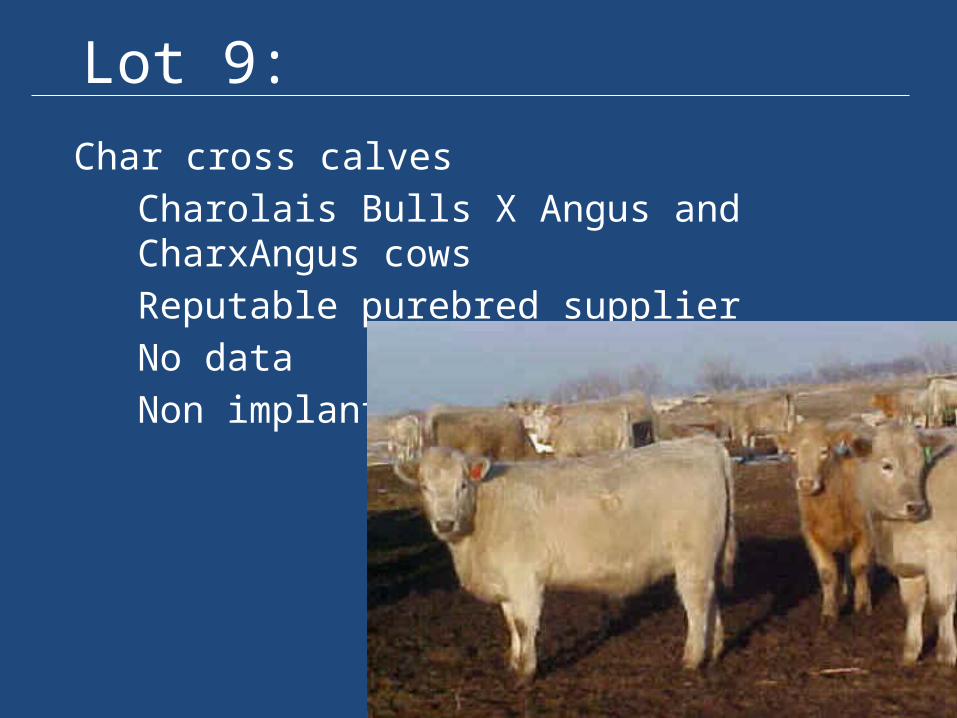
Lot 9:Char cross calves
Charolais Bulls X Angus and CharxAngus cowsReputable purebred supplierNo dataNon implanted
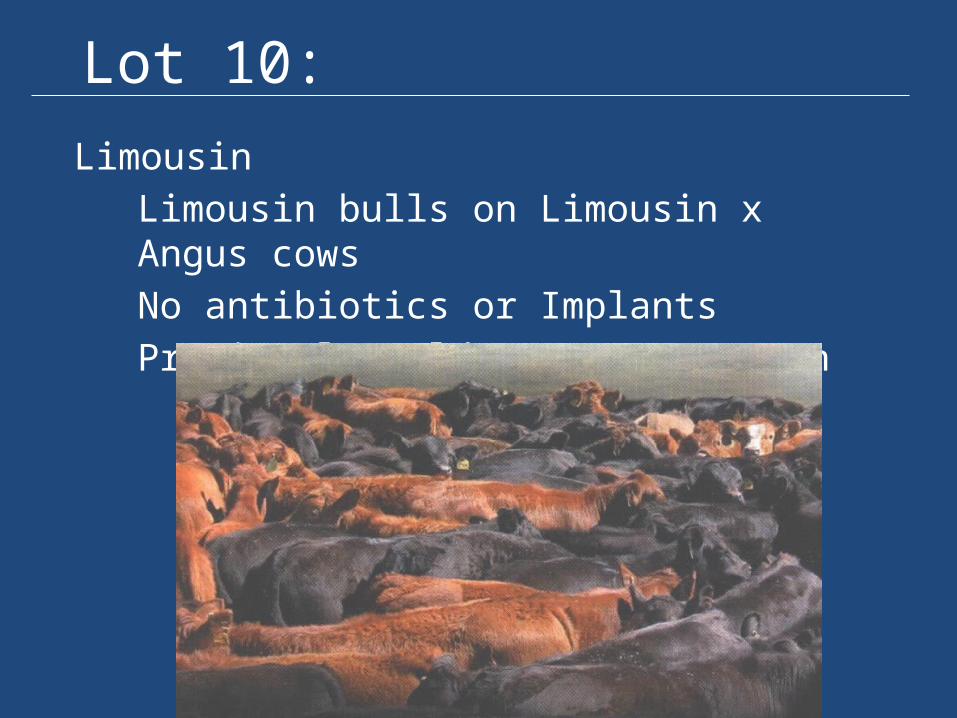
Lot 10:Limousin
Limousin bulls on Limousin x Angus cowsNo antibiotics or ImplantsPreviously sold to Laura’s Lean
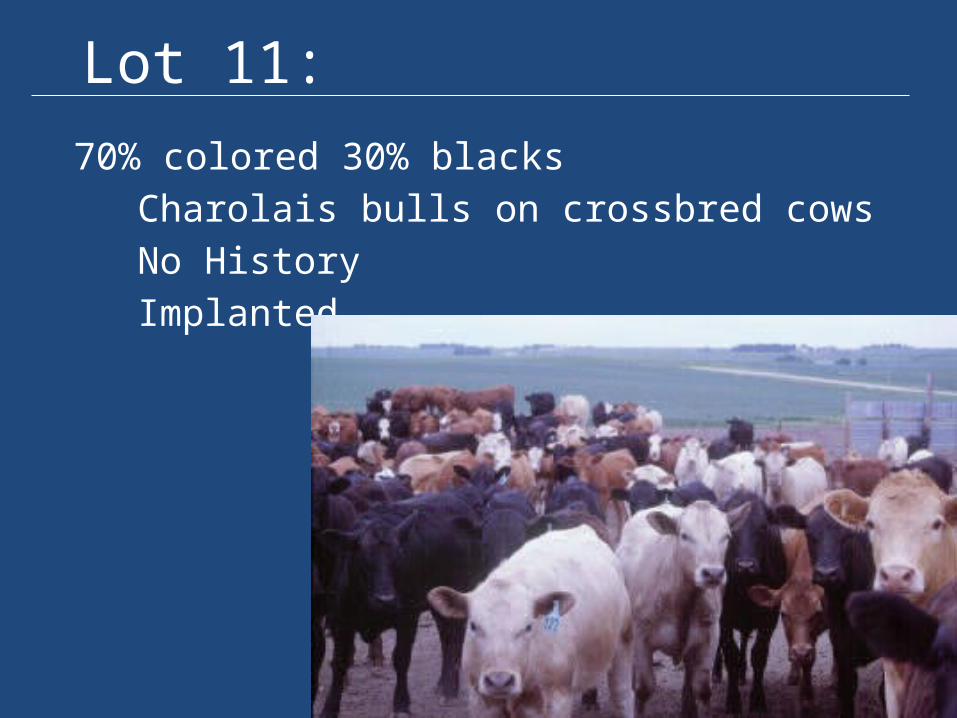
Lot 11:70% colored 30% blacks
Charolais bulls on crossbred cowsNo HistoryImplanted