Beaver Lake Watershed · Bob Morgan Beaver Water District, Beaver Watershed Alliance Ray Avery...
119
Beaver Lake Watershed Protection Strategy May 2012 Revision 2012 Revision Prepared By: Beaver Watershed Alliance 614 E. Emma Ave. Suite M438 Springdale, AR 72764 www.BeaverWatershedAlliance.org Originally Prepared for: Northwest Arkansas Council By: Tetra Tech 3200 Chapel Hill-Nelson Hwy, Suite 105 PO Box 14409 Research Triangle Park, NC 27709
Transcript of Beaver Lake Watershed · Bob Morgan Beaver Water District, Beaver Watershed Alliance Ray Avery...

Beaver Lake Watershed Protection Strategy May 2012 Revision 2012 Revision Prepared By:
Beaver Watershed Alliance
614 E. Emma Ave. Suite M438
Springdale, AR 72764
www.BeaverWatershedAlliance.org
Originally Prepared for:
Northwest Arkansas Council
By:
Tetra Tech
3200 Chapel Hill-Nelson Hwy, Suite 105
PO Box 14409
Research Triangle Park, NC 27709

Cover Page Photographs
Photograph Courtesy of Hawkins Aerial Photography – Movement of sediment south-to-north toward the dam in Beaver
Lake following Spring 2011 rains. Lost Bridge, with clear water, is to the north and Rocky Branch, with sediment-laden
water, lies to the south of County Road 920.
Photograph Courtesy of D. Neely – House on a karst limestone bluff above War Eagle Creek.
Photograph Courtesy of Beaver Water District – Brad Hufhines, a Beaver Water District lab technician, measures stream
flow in the White River tributary of Beaver Lake to determine the capacity of the stream to assimilate pollutants,
especially nutrients (BWD The Source Newsletter – Summer 2006).
Photograph Courtesy of Audubon Arkansas – Installation of a watershed kiosk at Riverside Park in West Fork, AR on
May 12, 2007 (BWD The Source Newsletter – Summer 2007).
Photograph Courtesy of Beaver Water District –War Eagle Appreciation Day participants (http://www.bwdh2o.org/war-
eagle-appreciation-day/).
ACKNOWLEDGEMENTS Many individuals contributed their time, energy, and expertise to the development of the Final
Report of the Beaver Lake Watershed Protection Strategy. Deserving special credit are members
of the Policy Advisory Group, the Technical Advisory Group, and the Northwest Arkansas
Council Board and staff.
Funding for the May 2012 revision was provided by the U.S. EPA and the Arkansas Natural
Resources Commission via the Clean Water Act, Section 319(h).
(Note: The Policy Advisory Group was initially a 23-member advisory body formed for the
development of the original watershed protection strategy. However, certain organizations and
agencies had different primary members serving over the course of the project. In addition, some
organizations had alternate members who served in the absence of their primary representatives.
The 2012 revision process included original Policy and Technical Advisory Group members
whenever possible, as well as new stakeholders in the watershed. The tables below list all Policy
Advisory Group and Technical Advisory Group participants.)
Policy Advisory Group Participants
Member Agency/Organization
Doug Timmons Association for Beaver Lake Environment
Tony Miltich Association for Beaver Lake Environment
Bob Morgan Beaver Water District, Beaver Watershed Alliance
Bob Caulk Fayetteville Natural Heritage Association, Beaver Watershed
Alliance
Gene Groseclos Cooper Communities, Beaver Watershed Alliance
Barbara Taylor Fayetteville Natural Heritage Association, Beaver Watershed
Alliance
Ed Clifford Bentonville Chamber of Commerce-Northwest Arkansas Council
Frank Winscott Benton County Justice of the Peace
Dan Douglas Benton County
Scott Borman Benton/Washington Regional Public Water Authority
Scott Bounds Benton/Washington Regional Public Water Authority
Richard Williams Carroll County Judge
George Phillips (observer) Carroll County
Mike Dodge Carroll Electric
Susan Thomas City of Fayetteville
John Coleman City of Fayetteville
Patsy Christie City of Springdale, Beaver Watershed Alliance
Beaver Lake Watershed Protection Strategy
May 2012 ii
Hunter Haynes Haynes Limited
Larry Garrett Huntsville Wastewater Treatment Plant
Clarence Carson Madison County Farm Bureau
Steven Ford Madison County USDA Conservation Officer
Don Day Northwest Arkansas Property Rights Association
Jeff Hawkins Northwest Arkansas Regional Planning Commission
Rob Smith Northwest Arkansas Council
Scott Van Laningham Northwest Arkansas Council
Craig Smith Prairie Creek Marina
Tom McAlister Rogers Water Utilities
Walter Turnbow Springdale Resident
Larry Beals Superior Industries
Tim Snell The Nature Conservancy
Kevin Igli Tyson Foods, Inc., Beaver Watershed Alliance
Trish Ouei University of Arkansas Benton County Extension Service, Beaver
Watershed Alliance
Katie Teague University of Arkansas Washington County Extension Service
Juliet Richey Washington County Planner, Beaver Watershed Alliance
Henry Griffith West Fork Environmental Protection Association
Jane Bryant West Fork Watershed Alliance
Mike Faupel University of Arkansas
Acknowledgements
May 2012 iii
Technical Advisory Group
Name Agency
Sarah Clem Arkansas Department of Environmental Quality
Jim Wise Arkansas Department of Environmental Quality
Robert Hart Arkansas Department of Health
Alan Fortenberry Beaver Water District
Bob Morgan Beaver Water District, Beaver Watershed Alliance
Ray Avery Beaver Water District
Billy Ammons CH2M-Hill, Beaver Watershed Alliance
Kent Thornton FTN Associates, Ltd.
Nicole Hardiman Northwest Arkansas Land Trust, Beaver Watershed Alliance
Brian Haggard University of Arkansas
Marty Matlock University of Arkansas
Ralph Davis University of Arkansas
Susan Bolyard United States Geological Survey
Reed Green United States Geological Survey
Northwest Arkansas Council
Mike Malone, Executive Director
Rob Smith, Communications and Policy Specialist
Beaver Watershed Alliance
Jason L. Kindall, Executive Director

(This page intentionally left blank.)
Contents
May 2012 v
Table of Contents List of Tables vi
List of Figures vii
1 Introduction 1
1.1 Why Are These Protection Measures Needed? ..............................................................................1
1.2 How Was the Lake Protection Strategy Developed? .....................................................................2
1.3 Development of the 2012 Revision ................................................................................................6
1.4 The EPA's 9 Elements for Watershed Management Plan Development ........................................6
2 Description of the Watershed .....................................................................................................9
2.1 Watershed Size, Location, and Natural Features ...........................................................................9
2.2 Land Use and Land Cover ........................................................................................................... 14
2.3 Existing and Future Loading to the Lake ..................................................................................... 16
2.4 Water Quality Targets .................................................................................................................. 21
2.5 Priority Watershed Issues ............................................................................................................ 25
3 Building Blocks and Gaps for Lake Protection .......................................................................27
3.1 Local Stormwater Regulation ...................................................................................................... 27
3.2 Nutrient Management Plans ......................................................................................................... 29
3.3 Wastewater Management ............................................................................................................. 31
4 Proposed Beaver Lake Watershed Protection Strategy ...........................................................34
4.1 Overview of the Beaver Lake Watershed Protection Strategy ..................................................... 34
4.2 Five Components of Protection Strategy ..................................................................................... 35
4.2.1 Component #1 – Beaver Lake Watershed Council…………………………………………..35
4.2.2 Component #2 – Core Best Management Practices………………………………………….36
4.2.3 Component #3 – Developer and Contractor Lake Protection Certification Program
(for all communities and developers willing to participate)………………………………....49
4.2.4 Component #4 – Education and Stewardship Program...........................................................52
4.2.5 Component #5 – Monitoring and Adaptive Management…………………………………...53
5 Implementation Summary ........................................................................................................60
5.1 Overall Prioritization of Subwatersheds ...................................................................................... 61
5.2 Implementation Timeline ............................................................................................................. 61
5.3 Adaptive Management ................................................................................................................. 62
References……. .............................................................................................................................72
Beaver Lake Watershed Protection Strategy
May 2012 vi
Appendices Appendix A. BMP Cost and Cost Effectiveness .................................................................... A-1
Appendix B. Information for TMDL Implementation Efforts in the West Fork and
Lower White River Reporting Subwatersheds .................................................B-1
Appendix C. Supplemental Information on Post-construction Stormwater Management .....C-1
Appendix D. Correlation of Beaver Lake Watershed Protection Strategy Components to EPA
9 Required Elements for Watershed Plans under Section 319 of the Federal
Clean Water Act ............................................................................................... D-1
List of Tables
Table 1-1. EPA 9 Element - Beaver Lake Watershed Protection Strategy Component
Correlation Quick Reference ................................................................................7
Table 2-1. Water Quality Monitored by USGS at Beaver Lake Station L3 .........................22
Table 4-1. Core Voluntary BMPs and Estimated Total Sediment and Phosphorus Load
Reduction (by 2055) ...........................................................................................47
Table 4-2. Predicted Lake Water Quality Indicators Under Existing Conditions and Future
Core BMPs ..........................................................................................................48
Table 4-3. How Well do the Core BMPs Meet Lake Water Quality Objectives? ................49
Table 4-4. Water Quality Monitoring Stations on the Beaver Lake Watershed ...................55
Table 5-1. Beaver Lake Watershed Protection Strategy Implementation Summary ............63
Table 5-2. Beaver Lake Watershed Protection Strategy Implementation Timeline .............69
Contents
May 2012 vii
List of Figures Figure 1-1. Guiding Principles .................................................................................................3
Figure 1-2. Overarching Goals .................................................................................................4
Figure 2-1. Beaver Lake Watershed Local Jurisdictions .......................................................10
Figure 2-2. Beaver Lake Subwatersheds ................................................................................11
Figure 2-3. Comparison of Existing and Planned Future Municipal Boundaries ..................13
Figure 2-4. Comparison of 2000 and Projected 2055 Population Densities ..........................14
Figure 2-5. Comparison of 2001 and Projected 2055 Imperviousness ..................................15
Figure 2-6. Comparison of Year 2001 and Year 2055 Projected Land Uses in the Beaver
Lake Watershed ..................................................................................................16
Figure 2-7. Comparison of Existing and Future Sediment Loading ......................................17
Figure 2-8. High, Moderate, and Low Priority Areas for Sediment Control .........................19
Figure 2-9. Comparison of Existing and Future Phosphorus Loading ...................................20
Figure 2-10. Comparison of Existing and Future Nitrogen Loading .......................................21
Figure 2-11. Lake Monitoring Stations for Targets and Benchmarks ......................................23
Figure 4-1. Priority Conservation Area ..................................................................................38
Figure 4-2. Riparian Reforestation and Restoration Priority .................................................42
Figure 4-3. Pasture Management Priority Areas ....................................................................43
Figure 4-4. Unpaved Road Improvement Priorities ...............................................................45
Figure 4-5. Stormwater BMP Retrofit Priority Areas ............................................................46
Figure 4-6. Priority Area for Lake Protection Certification Program – Planned
Municipal Area ...................................................................................................50

Beaver Lake Watershed Protection Strategy
May 2012 viii
(This page left intentionally blank.)
May 2012 1
Section 1
1 Introduction
1.1 WHY ARE THESE PROTECTION MEASURES NEEDED? Beaver Lake is the primary drinking water source for more than 350,000 Arkansans, and a major recreational destination for people interested in boating, fishing, swimming, and picnicking. As the principal water supply for the Northwest Arkansas region, the lake is recognized as a lifeline for current citizens and businesses, and for the projected growth of the region. People in Northwest Arkansas also enjoy the beauty of the lake – the large open water and surrounding hills. Beaver Lake is a key to the region’s quality of life. Clean water and quality of life are at the top of the list for businesses looking to start-up or relocate, and help sustain the region’s economic vitality.
A recent study (Kemper, 2008) by the University of Arkansas highlighted Beaver Lake’s economic contribution to the region: approximately 2.5 million visitors spend about $43 million annually in the region surrounding the lake, with about $24.5 million of that captured in the local economy. The spending generates 600 jobs and approximately $13 million in income for the region.
People appreciate that most areas of Beaver Lake are clean the majority of the year and meet the State’s water quality standards. However, the upper end of the lake is impacted by sediment and algae. This in turn affects drinking water quality, recreation, and aquatic habitat in the upper lake. For example, customers of the Beaver Water District regularly experience taste and odor problems in their water during September to October (and occasionally during other months of high algal production). Without responsible water quality protection measures, the projected growth and development in the watershed will likely worsen this and other problems.
Projected growth could also cause economic impacts. For example:
Under a do-nothing scenario1, there would be a 14 percent increase
in algae-feeding nutrients to the lake. The Beaver Water District conducted a study to evaluate different methods to control taste and odor problems and their associated costs related to excessive algae. The recommended alternative had a capital cost of $42.2 million and an annual operating and maintenance cost of $790,000. While the public may wish to invest in these upgrades just to address existing taste and odor problems, the need would increase substantially with increases in algae growth. Other water suppliers may also need to upgrade their facilities to address taste and odor
Beaver Lake is recognized as a lifeline for current citizens and businesses and for projected growth.
Most areas of the lake are clean the majority of the year, however the upper lake area is impacted by sediment and algae.
Beaver Lake Watershed Protection Strategy
May 2012 2
problems associated with increased nutrient loading and subsequent algae growth.
Doing nothing1 would result in a 21 percent increase in sediment
load to the lake. It would also contribute to further erosion of stream banks along the tributaries that feed into the lake, and increase loss of property. This would add to the list of “impaired streams” in the watershed, increasing stream restoration requirements and costs.
Neglecting water quality measures would also impact the lake’s local tourism and recreation industry including revenue, jobs, and income.
In an effort to proactively address the potential for problems and protect water quality, the Northwest Arkansas Council initiated the development of a Beaver Lake Watershed Protection Strategy.
1.2 HOW WAS THE PROTECTION STRATEGY
DEVELOPED? The Council contracted with Tetra Tech to develop the Protection Strategy. Tetra Tech worked closely with a 23-member Policy Advisory Group (PAG) representing diverse interests and a Technical Advisory Group (TAG) throughout the lake protection planning process (see Acknowledgements Pages for lists of members). The PAG represented a wide variety of stakeholder groups from the public and private sectors including local elected officials, farmers, developers, water providers, landowners, large industries, property rights advocates, conservation groups, chambers of commerce, lake marinas, and planners. Although PAG Members were encouraged to consider issues from a watershed-wide perspective, they were also asked to represent the issues and concerns of their constituencies in the four counties of the watershed, as well as water users outside the watershed. In addition, Tetra Tech held more than 10 focus group meetings throughout the four-county area with key constituencies to gain input and gather additional information for the PAG
to consider.
1 The data for both of these estimates were generated using SWAT modeling analyses.
The methodological description is given in the technical document titled “SWAT Model
Recalibrations”, with “do-nothing scenario” used synonymously with “2055 Scenario”
(document can be accessed at
http://www.beaverlakewatershedstrategy.com/index.php?option=com_content&view=arti
cle&id=46&Itemid=54). TetraTech, utilizing a modified modeling method, generated
land use/land cover (LULC) estimates for the year 2055 based on LULC data from 2006.
Sediment loading estimates were extrapolated utilizing the estimated LULC changes and
known/measured water quality parameters.
Without responsible protection measures, growth will worsen these problems.
To proactively address potential problems and protect water quality, the Northwest Arkansas Council initiated development of the Beaver Lake Watershed Protection
Strategy.
Section 1 – Introduction
May 2012 3
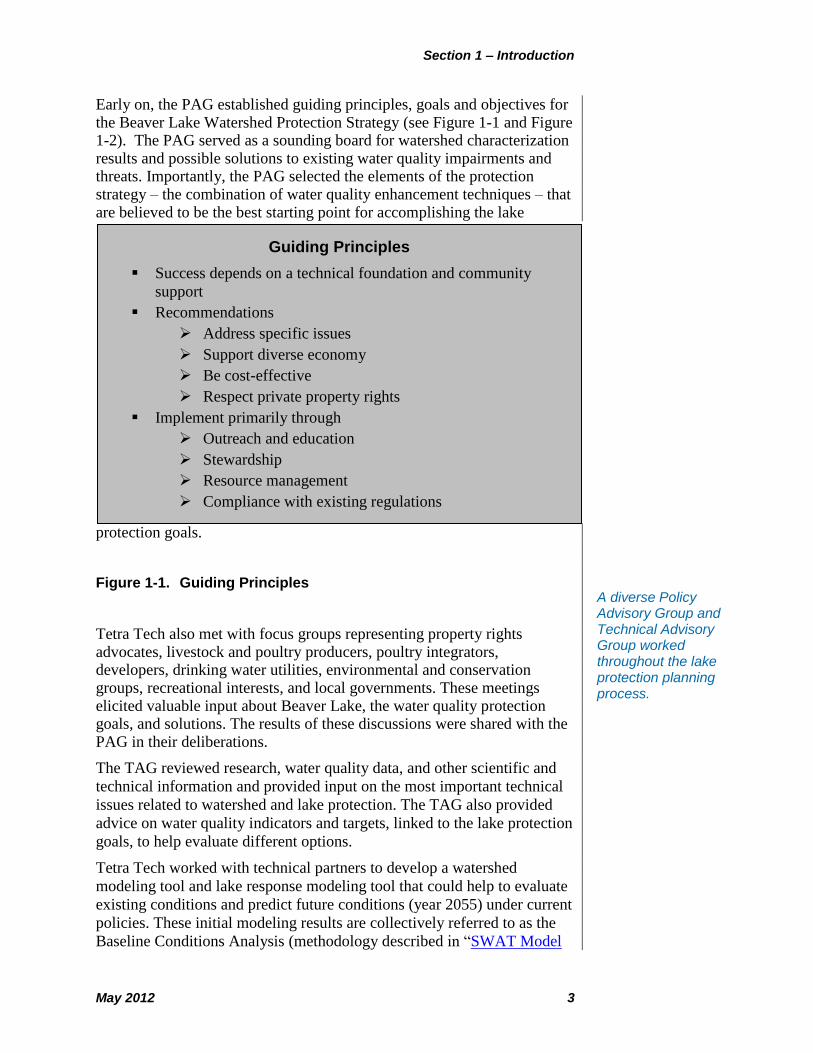
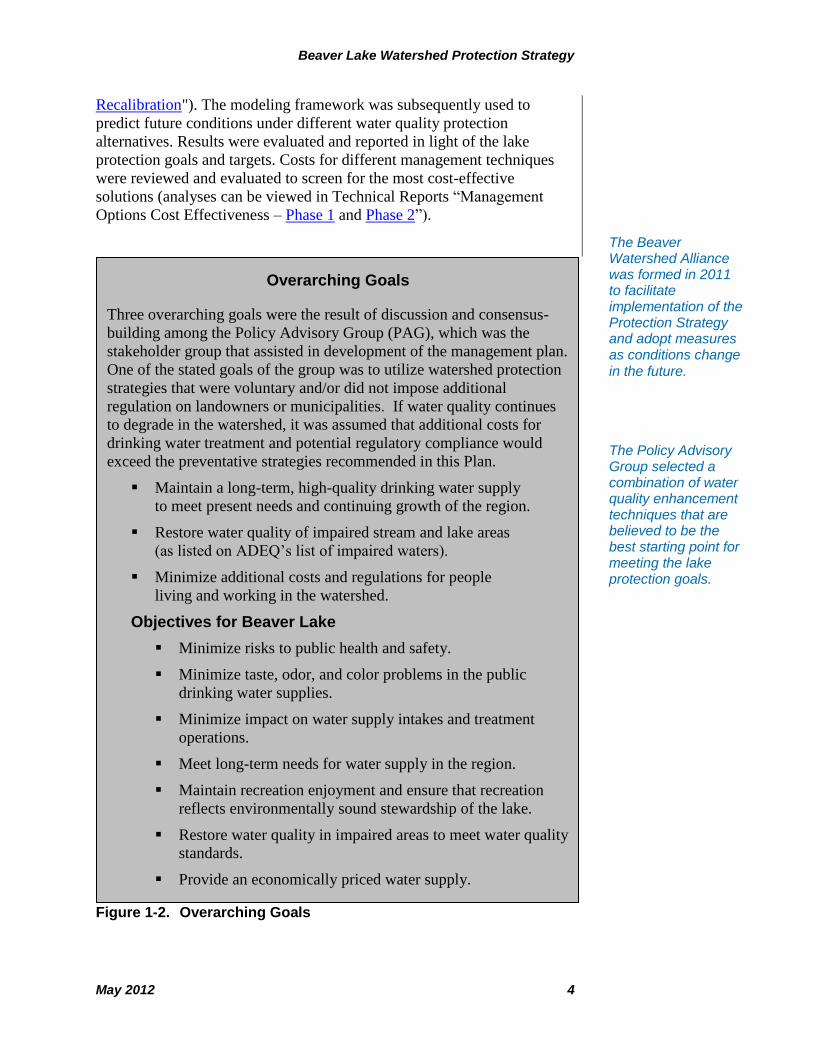
Early on, the PAG established guiding principles, goals and objectives for the Beaver Lake Watershed Protection Strategy (see Figure 1-1 and Figure 1-2). The PAG served as a sounding board for watershed characterization results and possible solutions to existing water quality impairments and threats. Importantly, the PAG selected the elements of the protection strategy – the combination of water quality enhancement techniques – that are believed to be the best starting point for accomplishing the lake
protection goals.
Figure 1-1. Guiding Principles
Tetra Tech also met with focus groups representing property rights advocates, livestock and poultry producers, poultry integrators, developers, drinking water utilities, environmental and conservation groups, recreational interests, and local governments. These meetings elicited valuable input about Beaver Lake, the water quality protection goals, and solutions. The results of these discussions were shared with the PAG in their deliberations.
The TAG reviewed research, water quality data, and other scientific and
technical information and provided input on the most important technical
issues related to watershed and lake protection. The TAG also provided
advice on water quality indicators and targets, linked to the lake protection
goals, to help evaluate different options.
Tetra Tech worked with technical partners to develop a watershed
modeling tool and lake response modeling tool that could help to evaluate
existing conditions and predict future conditions (year 2055) under current
policies. These initial modeling results are collectively referred to as the
Baseline Conditions Analysis (methodology described in “SWAT Model
A diverse Policy Advisory Group and Technical Advisory Group worked throughout the lake protection planning process.
Guiding Principles
Success depends on a technical foundation and community
support
Recommendations
Address specific issues
Support diverse economy
Be cost-effective
Respect private property rights
Implement primarily through
Outreach and education
Stewardship
Resource management
Compliance with existing regulations
Beaver Lake Watershed Protection Strategy
May 2012 4
Recalibration"). The modeling framework was subsequently used to
predict future conditions under different water quality protection
alternatives. Results were evaluated and reported in light of the lake
protection goals and targets. Costs for different management techniques
were reviewed and evaluated to screen for the most cost-effective
solutions (analyses can be viewed in Technical Reports “Management
Options Cost Effectiveness – Phase 1 and Phase 2”).
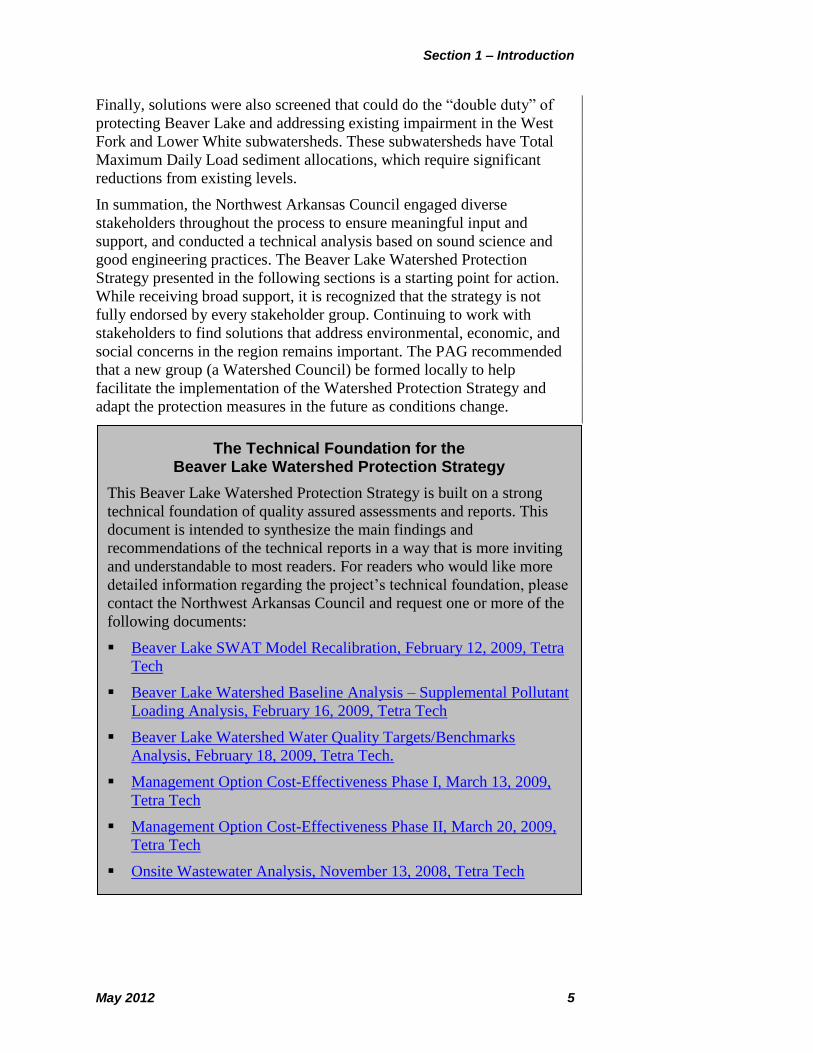
Figure 1-2. Overarching Goals
Overarching Goals
Three overarching goals were the result of discussion and consensus-
building among the Policy Advisory Group (PAG), which was the
stakeholder group that assisted in development of the management plan.
One of the stated goals of the group was to utilize watershed protection
strategies that were voluntary and/or did not impose additional
regulation on landowners or municipalities. If water quality continues
to degrade in the watershed, it was assumed that additional costs for
drinking water treatment and potential regulatory compliance would
exceed the preventative strategies recommended in this Plan.
Maintain a long-term, high-quality drinking water supply
to meet present needs and continuing growth of the region.
Restore water quality of impaired stream and lake areas
(as listed on ADEQ’s list of impaired waters).
Minimize additional costs and regulations for people
living and working in the watershed.
Objectives for Beaver Lake
Minimize risks to public health and safety.
Minimize taste, odor, and color problems in the public
drinking water supplies.
Minimize impact on water supply intakes and treatment
operations.
Meet long-term needs for water supply in the region.
Maintain recreation enjoyment and ensure that recreation
reflects environmentally sound stewardship of the lake.
Restore water quality in impaired areas to meet water quality
standards.
Provide an economically priced water supply.
Objectives for Impaired Streams
Restore water quality of impaired streams and rivers to meet
water quality standards.
Objectives for Unimpaired Streams
Provide general recommendations to protect and maintain
quality in unimpaired waters to address potential hydrology
and water quality impacts.
The Policy Advisory Group selected a combination of water quality enhancement techniques that are believed to be the best starting point for meeting the lake protection goals.
The Beaver Watershed Alliance was formed in 2011 to facilitate implementation of the Protection Strategy and adopt measures as conditions change
in the future.
Section 1 – Introduction
May 2012 5
Finally, solutions were also screened that could do the “double duty” of
protecting Beaver Lake and addressing existing impairment in the West
Fork and Lower White subwatersheds. These subwatersheds have Total
Maximum Daily Load sediment allocations, which require significant
reductions from existing levels.
In summation, the Northwest Arkansas Council engaged diverse
stakeholders throughout the process to ensure meaningful input and
support, and conducted a technical analysis based on sound science and
good engineering practices. The Beaver Lake Watershed Protection
Strategy presented in the following sections is a starting point for action.
While receiving broad support, it is recognized that the strategy is not
fully endorsed by every stakeholder group. Continuing to work with
stakeholders to find solutions that address environmental, economic, and
social concerns in the region remains important. The PAG recommended
that a new group (a Watershed Council) be formed locally to help
facilitate the implementation of the Watershed Protection Strategy and
adapt the protection measures in the future as conditions change.
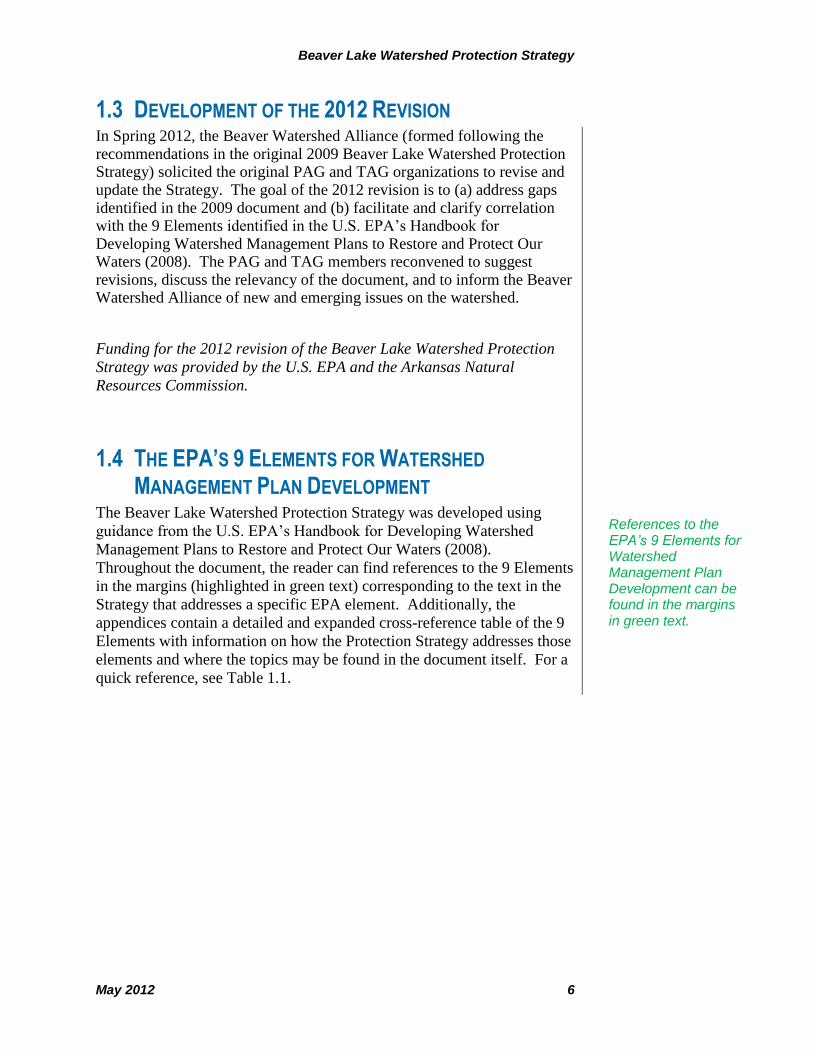
The Technical Foundation for the Beaver Lake Watershed Protection Strategy
This Beaver Lake Watershed Protection Strategy is built on a strong
technical foundation of quality assured assessments and reports. This
document is intended to synthesize the main findings and
recommendations of the technical reports in a way that is more inviting
and understandable to most readers. For readers who would like more
detailed information regarding the project’s technical foundation, please
contact the Northwest Arkansas Council and request one or more of the
following documents:
Beaver Lake SWAT Model Recalibration, February 12, 2009, Tetra
Tech
Beaver Lake Watershed Baseline Analysis – Supplemental Pollutant
Loading Analysis, February 16, 2009, Tetra Tech
Beaver Lake Watershed Water Quality Targets/Benchmarks
Analysis, February 18, 2009, Tetra Tech.
Management Option Cost-Effectiveness Phase I, March 13, 2009,
Tetra Tech
Management Option Cost-Effectiveness Phase II, March 20, 2009,
Tetra Tech
Onsite Wastewater Analysis, November 13, 2008, Tetra Tech
Beaver Lake Watershed Protection Strategy
May 2012 6
1.3 DEVELOPMENT OF THE 2012 REVISION In Spring 2012, the Beaver Watershed Alliance (formed following the recommendations in the original 2009 Beaver Lake Watershed Protection Strategy) solicited the original PAG and TAG organizations to revise and update the Strategy. The goal of the 2012 revision is to (a) address gaps identified in the 2009 document and (b) facilitate and clarify correlation with the 9 Elements identified in the U.S. EPA’s Handbook for Developing Watershed Management Plans to Restore and Protect Our Waters (2008). The PAG and TAG members reconvened to suggest revisions, discuss the relevancy of the document, and to inform the Beaver Watershed Alliance of new and emerging issues on the watershed.
Funding for the 2012 revision of the Beaver Lake Watershed Protection
Strategy was provided by the U.S. EPA and the Arkansas Natural
Resources Commission.
1.4 THE EPA’S 9 ELEMENTS FOR WATERSHED
MANAGEMENT PLAN DEVELOPMENT The Beaver Lake Watershed Protection Strategy was developed using
guidance from the U.S. EPA’s Handbook for Developing Watershed
Management Plans to Restore and Protect Our Waters (2008).
Throughout the document, the reader can find references to the 9 Elements
in the margins (highlighted in green text) corresponding to the text in the
Strategy that addresses a specific EPA element. Additionally, the
appendices contain a detailed and expanded cross-reference table of the 9
Elements with information on how the Protection Strategy addresses those
elements and where the topics may be found in the document itself. For a
quick reference, see Table 1.1.
References to the EPA’s 9 Elements for Watershed Management Plan Development can be found in the margins in green text.
Section 1 – Introduction
May 2012 7
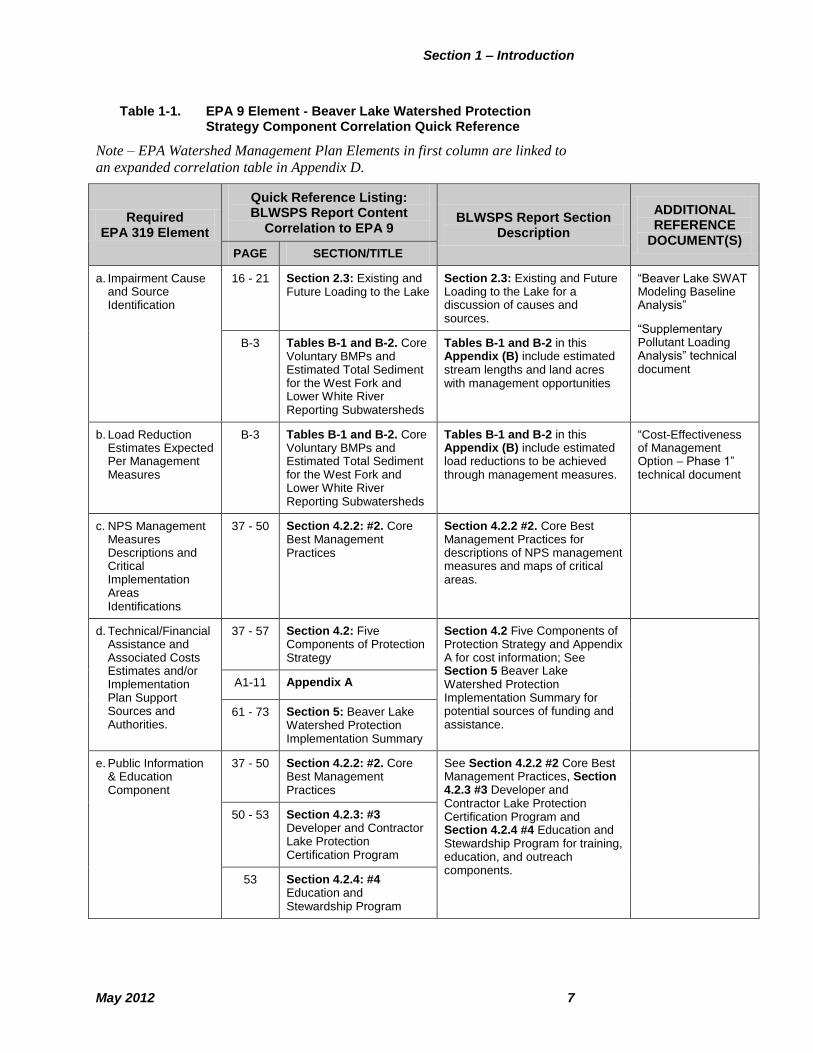
Table 1-1. EPA 9 Element - Beaver Lake Watershed Protection Strategy Component Correlation Quick Reference
Note – EPA Watershed Management Plan Elements in first column are linked to
an expanded correlation table in Appendix D.
Required EPA 319 Element
Quick Reference Listing: BLWSPS Report Content
Correlation to EPA 9 BLWSPS Report Section
Description
ADDITIONAL REFERENCE
DOCUMENT(S) PAGE SECTION/TITLE
a. Impairment Cause and Source Identification
16 - 21 Section 2.3: Existing and Future Loading to the Lake
Section 2.3: Existing and Future Loading to the Lake for a discussion of causes and sources.
“Beaver Lake SWAT Modeling Baseline Analysis”
“Supplementary Pollutant Loading Analysis” technical document
B-3 Tables B-1 and B-2. Core Voluntary BMPs and Estimated Total Sediment for the West Fork and Lower White River Reporting Subwatersheds
Tables B-1 and B-2 in this Appendix (B) include estimated stream lengths and land acres with management opportunities
b. Load Reduction Estimates Expected Per Management Measures
B-3 Tables B-1 and B-2. Core Voluntary BMPs and Estimated Total Sediment for the West Fork and Lower White River Reporting Subwatersheds
Tables B-1 and B-2 in this Appendix (B) include estimated load reductions to be achieved through management measures.
“Cost-Effectiveness of Management Option – Phase 1” technical document
c. NPS Management Measures Descriptions and Critical Implementation Areas Identifications
37 - 50 Section 4.2.2: #2. Core Best Management Practices
Section 4.2.2 #2. Core Best Management Practices for descriptions of NPS management measures and maps of critical areas.
d. Technical/Financial Assistance and Associated Costs Estimates and/or Implementation Plan Support Sources and Authorities.
37 - 57 Section 4.2: Five Components of Protection Strategy
Section 4.2 Five Components of Protection Strategy and Appendix A for cost information; See Section 5 Beaver Lake Watershed Protection Implementation Summary for potential sources of funding and assistance.
A1-11 Appendix A
61 - 73 Section 5: Beaver Lake Watershed Protection Implementation Summary
e. Public Information & Education Component
37 - 50 Section 4.2.2: #2. Core Best Management Practices
See Section 4.2.2 #2 Core Best Management Practices, Section 4.2.3 #3 Developer and Contractor Lake Protection Certification Program and Section 4.2.4 #4 Education and Stewardship Program for training, education, and outreach components.
50 - 53 Section 4.2.3: #3 Developer and Contractor Lake Protection Certification Program
53 Section 4.2.4: #4 Education and Stewardship Program
Beaver Lake Watershed Protection Strategy
May 2012 8
Required EPA 319 Element
Quick Reference Listing: BLWSPS Report Content
Correlation to EPA 9
BLWSPS Report Section Description
ADDITIONAL REFERENCE
DOCUMENT(S)
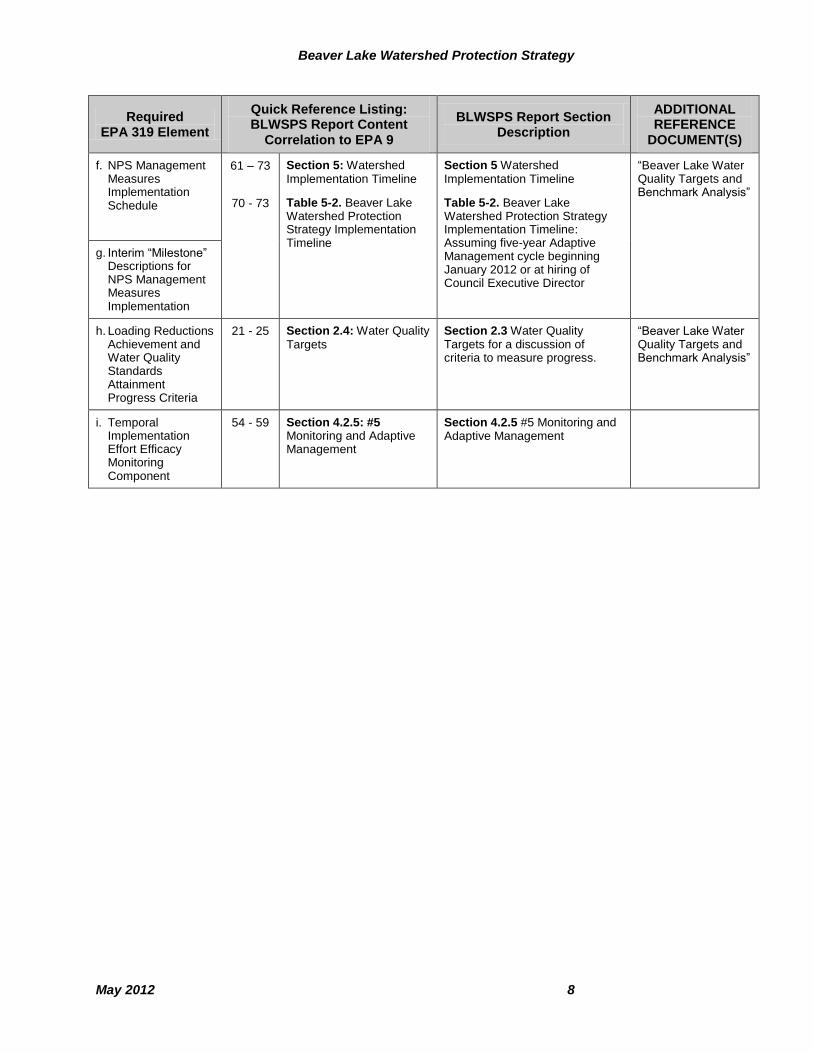
f. NPS Management Measures Implementation Schedule
61 – 73
70 - 73
Section 5: Watershed Implementation Timeline
Table 5-2. Beaver Lake Watershed Protection Strategy Implementation Timeline
Section 5 Watershed Implementation Timeline
Table 5-2. Beaver Lake Watershed Protection Strategy Implementation Timeline: Assuming five-year Adaptive Management cycle beginning January 2012 or at hiring of Council Executive Director
“Beaver Lake Water Quality Targets and Benchmark Analysis”
g. Interim “Milestone” Descriptions for NPS Management Measures Implementation
h. Loading Reductions Achievement and Water Quality Standards Attainment Progress Criteria
21 - 25 Section 2.4: Water Quality Targets
Section 2.3 Water Quality Targets for a discussion of criteria to measure progress.
“Beaver Lake Water Quality Targets and Benchmark Analysis”
i. Temporal Implementation Effort Efficacy Monitoring Component
54 - 59 Section 4.2.5: #5 Monitoring and Adaptive Management
Section 4.2.5 #5 Monitoring and Adaptive Management
May 2012 9
Section 2
2 Description of the Watershed
2.1 WATERSHED SIZE, LOCATION, AND NATURAL
FEATURES Beaver Lake is located in the Ozark Highlands of northwest Arkansas’s
Benton, Carroll, and Washington counties in the headwaters of the White
River. The U.S. Army Corps of Engineers constructed the multipurpose
reservoir in the mid-1960s for flood control, generation of hydroelectric
power, and public water supply. The Beaver Lake watershed is 1,192
square miles, and includes portions of Benton, Carroll, Washington, and
Madison counties and 17 incorporated municipalities or villages (see
Figure 2-1). A small fraction of the watershed lies in Crawford and
Franklin counties. As defined by the PAG, the watershed was defined as
only the tributaries/reservoir located upstream from the Beaver Lake Dam.
This management plan was analyzed at the 10-digit HUC scale, which
included 1101000101 (Headwaters - White River), 1101000102 (Middle
Fork – White River), 1101000103 (Lake Sequoyah – White River),
1101000104 (West Fork – White River), 1101000105 (Richland Creek),
1101000106 (War Eagle Creek), 1101000107 (Beaver Lake – White
River).
Beaver Lake Watershed Protection Strategy
May 2012 10
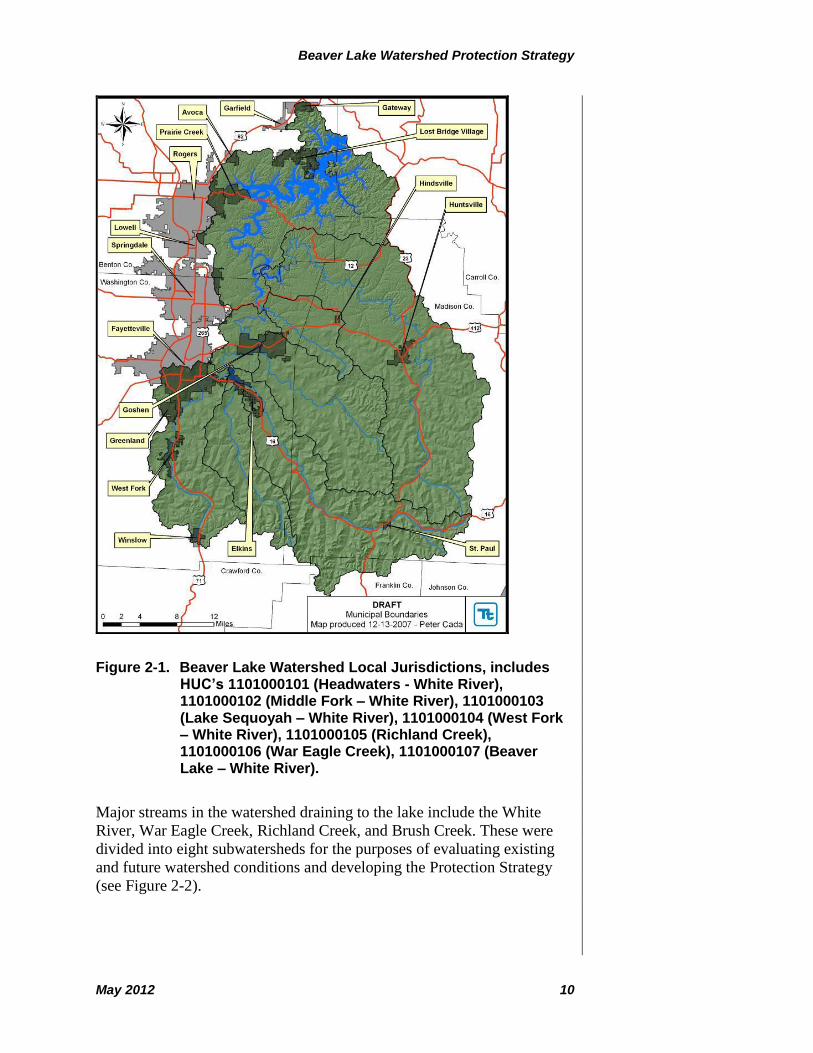
Figure 2-1. Beaver Lake Watershed Local Jurisdictions, includes HUC’s 1101000101 (Headwaters - White River), 1101000102 (Middle Fork – White River), 1101000103 (Lake Sequoyah – White River), 1101000104 (West Fork – White River), 1101000105 (Richland Creek), 1101000106 (War Eagle Creek), 1101000107 (Beaver Lake – White River).
Major streams in the watershed draining to the lake include the White
River, War Eagle Creek, Richland Creek, and Brush Creek. These were
divided into eight subwatersheds for the purposes of evaluating existing
and future watershed conditions and developing the Protection Strategy
(see Figure 2-2).
Section 2 – Description of the Watershed
May 2012 11
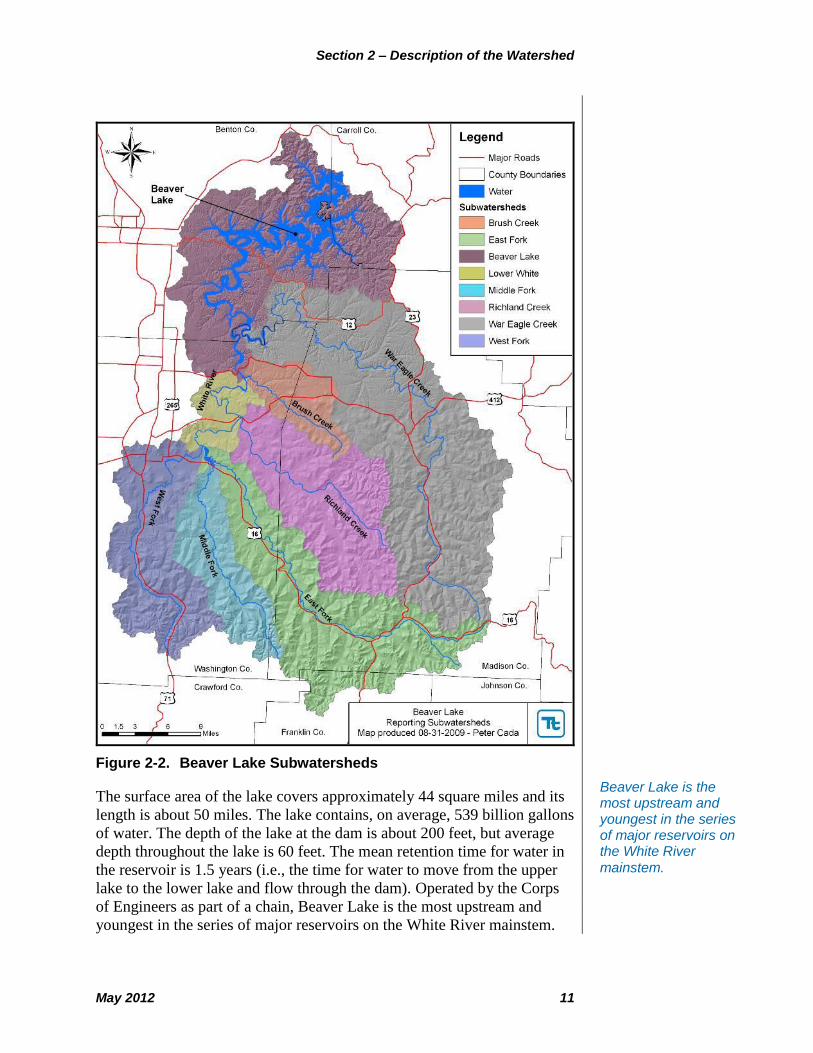
Figure 2-2. Beaver Lake Subwatersheds
The surface area of the lake covers approximately 44 square miles and its
length is about 50 miles. The lake contains, on average, 539 billion gallons
of water. The depth of the lake at the dam is about 200 feet, but average
depth throughout the lake is 60 feet. The mean retention time for water in
the reservoir is 1.5 years (i.e., the time for water to move from the upper
lake to the lower lake and flow through the dam). Operated by the Corps
of Engineers as part of a chain, Beaver Lake is the most upstream and
youngest in the series of major reservoirs on the White River mainstem.
Beaver Lake is the most upstream and youngest in the series of major reservoirs on the White River
mainstem.
Beaver Lake Watershed Protection Strategy
May 2012 12
Downstream from Beaver Lake are Table Rock Lake, Lake Taneycomo,
and Bull Shoals Lake.
One of the striking features of the watershed is its relatively steep
topography: 41 percent of the Beaver Lake subwatershed nearest the lake,
40 percent of the East Fork drainage area, and 29 percent of the Middle
Fork subwatershed are classified as having moderate to steep slopes (12
percent slope or higher). The soils in the watershed also can pose
challenges for new development. Over 45 percent of the watershed is
ranked moderate to severe in soil erosion hazard potential and over 78
percent of the watershed is considered very limited for conventional septic
system suitability. The presence of highly porous karst topography in the
watershed presents special challenges to water quality protection.
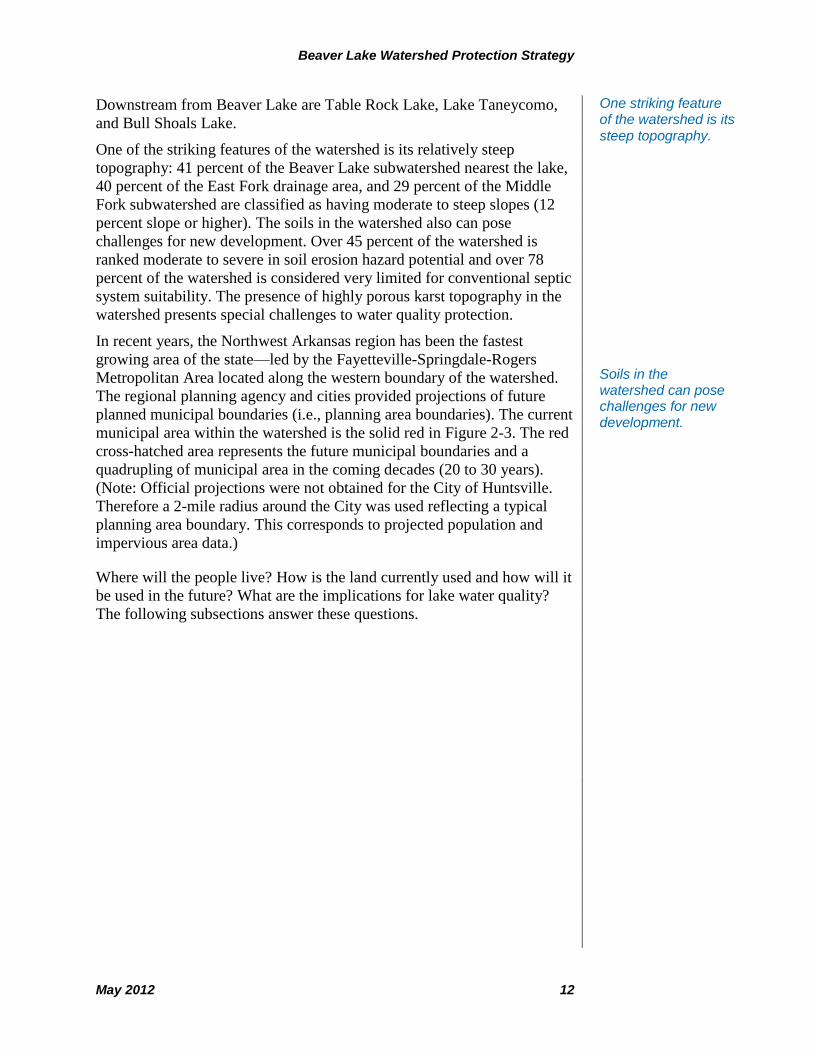
In recent years, the Northwest Arkansas region has been the fastest
growing area of the state—led by the Fayetteville-Springdale-Rogers
Metropolitan Area located along the western boundary of the watershed.
The regional planning agency and cities provided projections of future
planned municipal boundaries (i.e., planning area boundaries). The current
municipal area within the watershed is the solid red in Figure 2-3. The red
cross-hatched area represents the future municipal boundaries and a
quadrupling of municipal area in the coming decades (20 to 30 years).
(Note: Official projections were not obtained for the City of Huntsville.
Therefore a 2-mile radius around the City was used reflecting a typical
planning area boundary. This corresponds to projected population and
impervious area data.)
Where will the people live? How is the land currently used and how will it
be used in the future? What are the implications for lake water quality?
The following subsections answer these questions.
Soils in the watershed can pose challenges for new development.
One striking feature of the watershed is its
steep topography.
Section 2 – Description of the Watershed
May 2012 13
Figure 2-3. Comparison of Existing and Planned Future Municipal Boundaries
Planning projections show a quadrupling of existing municipal area in the coming decades.
In recent years, the Northwest Arkansas region has been the fastest growing area of the State.
Beaver Lake Watershed Protection Strategy
May 2012 14
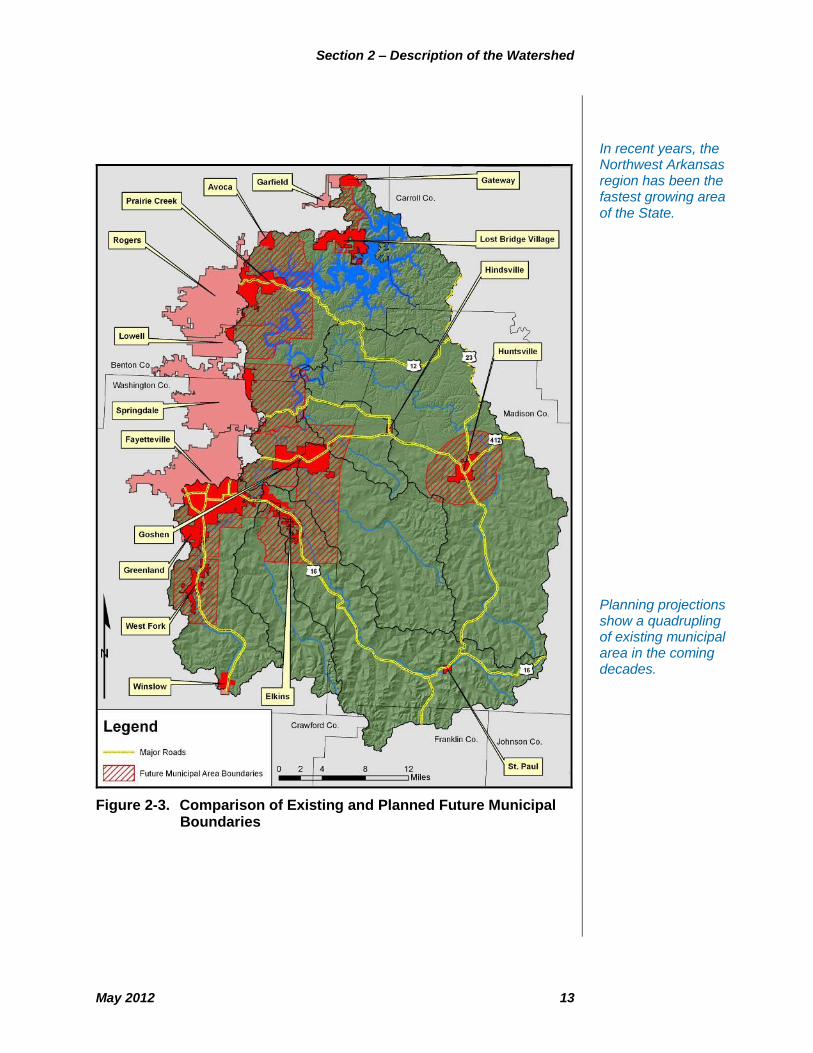
LAND USE AND LAND COVER Where do people live now in the watershed and where will new houses be
built in the future? Figure 2-4 compares population density in the year
2000 with projections for 2055 based on data from the Beaver Water
District. Population is expected to grow by more than 80 percent in the
coming decades, with the majority of people living in the planned
municipal areas and around Huntsville.
Figure 2-4. Comparison of 2000 and Projected 2055 Population Densities
Local planners provided information about the types of future
development expected in the watershed, based on existing land use plans
and trends. Existing land use/land cover conditions were also supplied by
the University of Arkansas’ CAST Department, and baseline population
statistics were from Census 2000. That information was used to estimate
the amount of future impervious area (e.g., rooftops, driveways, streets,
parking areas) in the watershed. Impervious areas are important because
they channel rainfall quickly into streams, causing bank erosion and
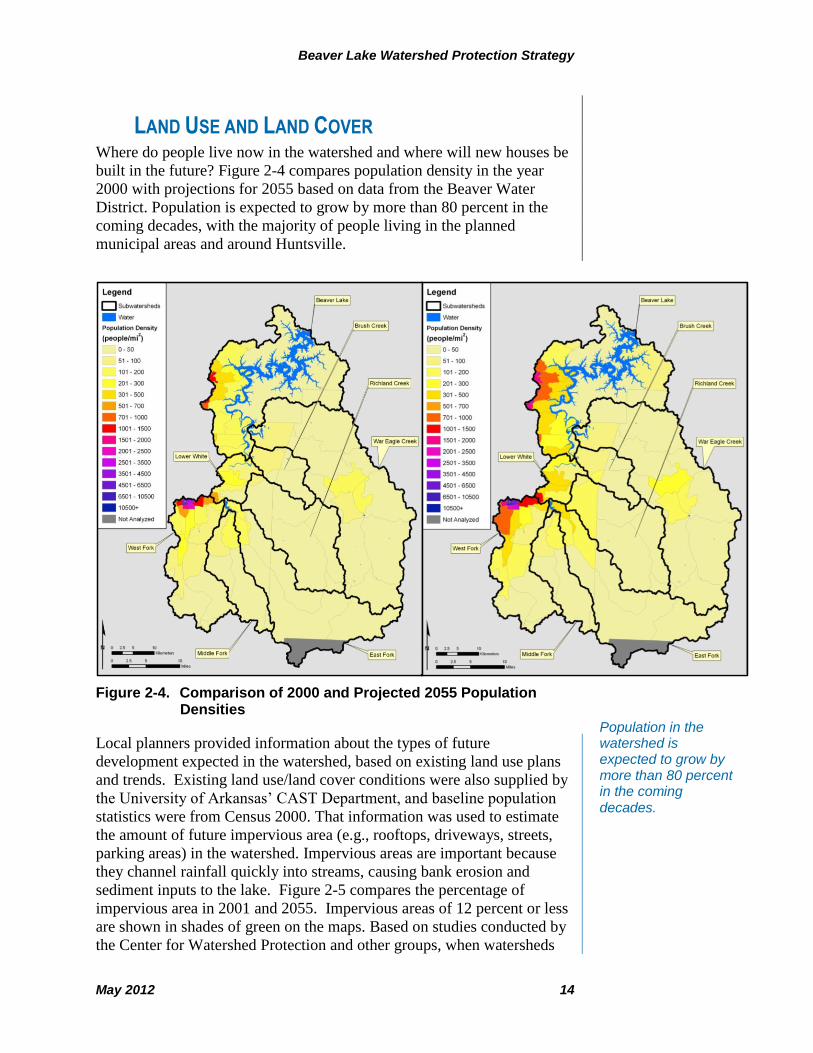
sediment inputs to the lake. Figure 2-5 compares the percentage of
impervious area in 2001 and 2055. Impervious areas of 12 percent or less
are shown in shades of green on the maps. Based on studies conducted by
the Center for Watershed Protection and other groups, when watersheds
Population in the watershed is expected to grow by more than 80 percent in the coming decades.
Section 2 – Description of the Watershed
May 2012 15
have greater than 10 percent impervious area most indicators of stream
water quality decline (Center for Watershed Protection, 2003). In some
watersheds, degradation begins with as little as 5 or 6 percent
imperviousness. Severe degradation is typically found in watersheds
approaching 25 to 30 percent imperviousness or greater (shown in the
orange, red, and purple tones). Figure 2-5 demonstrates that there is
expected to be a significant growth in this level of imperviousness in the
western portion of the watershed and the Huntsville area, coinciding with
the growth in the municipal planning areas.
Figure 2-5. Comparison of 2001 and Projected 2055 Imperviousness
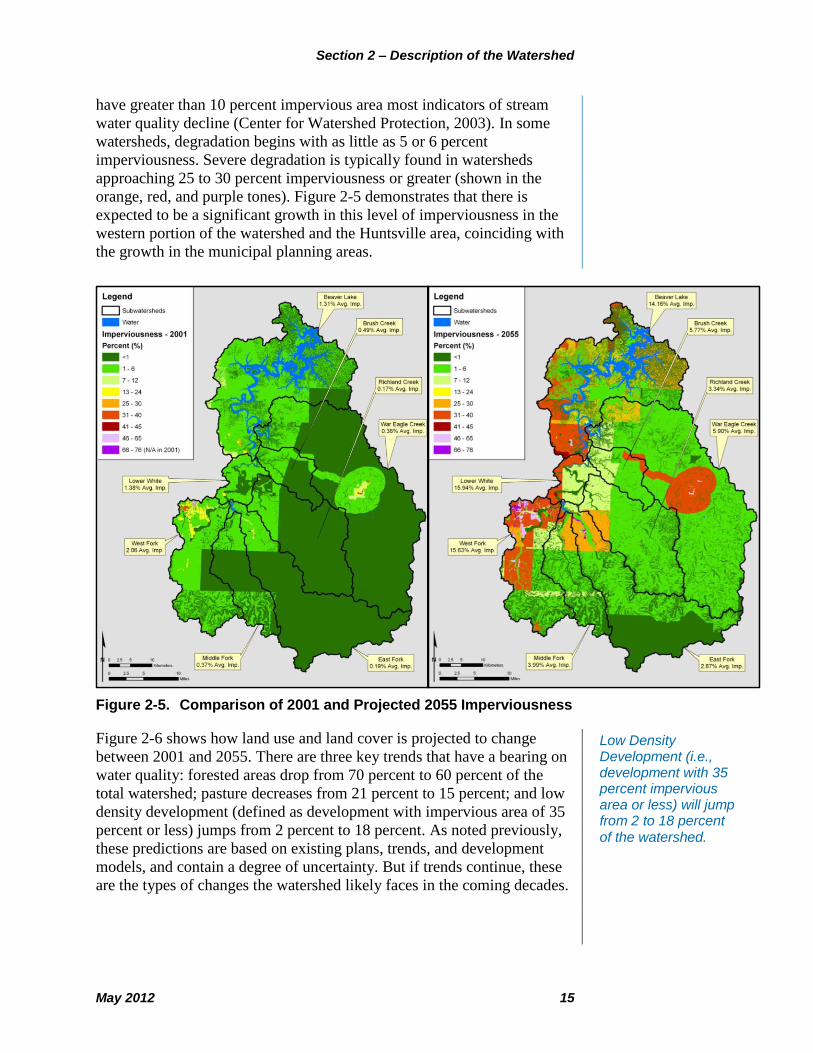
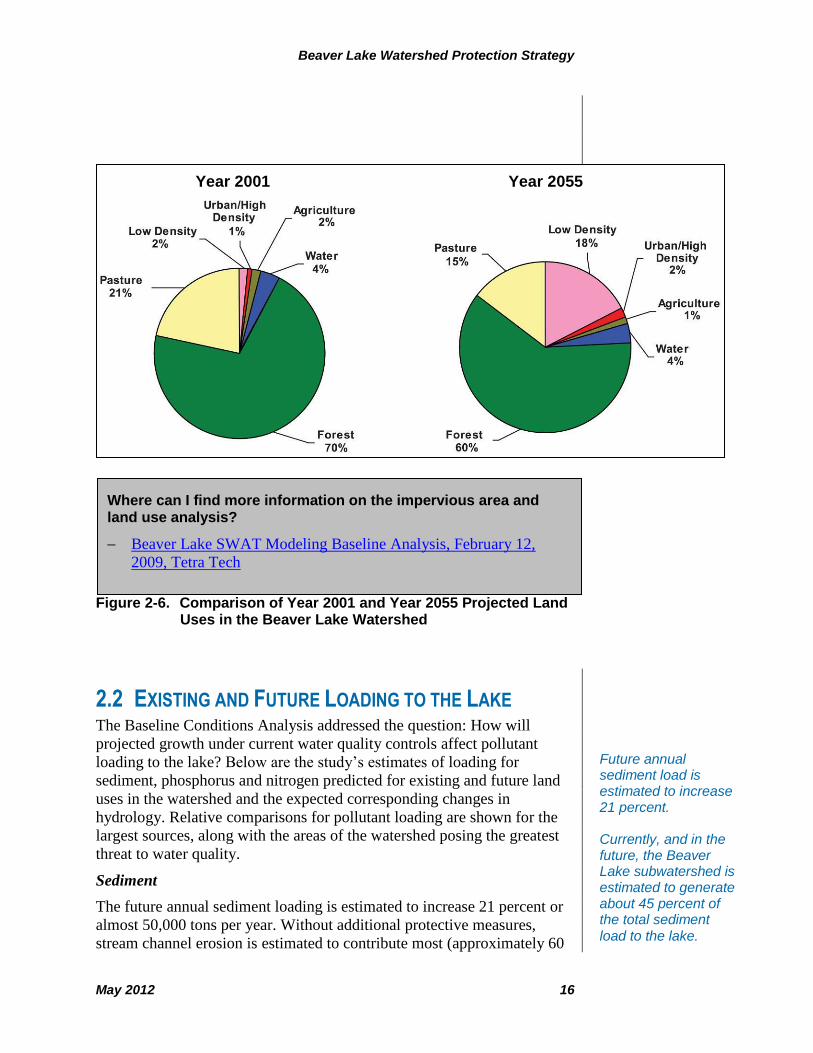
Figure 2-6 shows how land use and land cover is projected to change
between 2001 and 2055. There are three key trends that have a bearing on
water quality: forested areas drop from 70 percent to 60 percent of the
total watershed; pasture decreases from 21 percent to 15 percent; and low
density development (defined as development with impervious area of 35
percent or less) jumps from 2 percent to 18 percent. As noted previously,
these predictions are based on existing plans, trends, and development
models, and contain a degree of uncertainty. But if trends continue, these
are the types of changes the watershed likely faces in the coming decades.
Low Density Development (i.e., development with 35 percent impervious area or less) will jump from 2 to 18 percent
of the watershed.
Beaver Lake Watershed Protection Strategy
May 2012 16
Figure 2-6. Comparison of Year 2001 and Year 2055 Projected Land Uses in the Beaver Lake Watershed
2.2 EXISTING AND FUTURE LOADING TO THE LAKE The Baseline Conditions Analysis addressed the question: How will
projected growth under current water quality controls affect pollutant
loading to the lake? Below are the study’s estimates of loading for
sediment, phosphorus and nitrogen predicted for existing and future land
uses in the watershed and the expected corresponding changes in
hydrology. Relative comparisons for pollutant loading are shown for the
largest sources, along with the areas of the watershed posing the greatest
threat to water quality.
Sediment
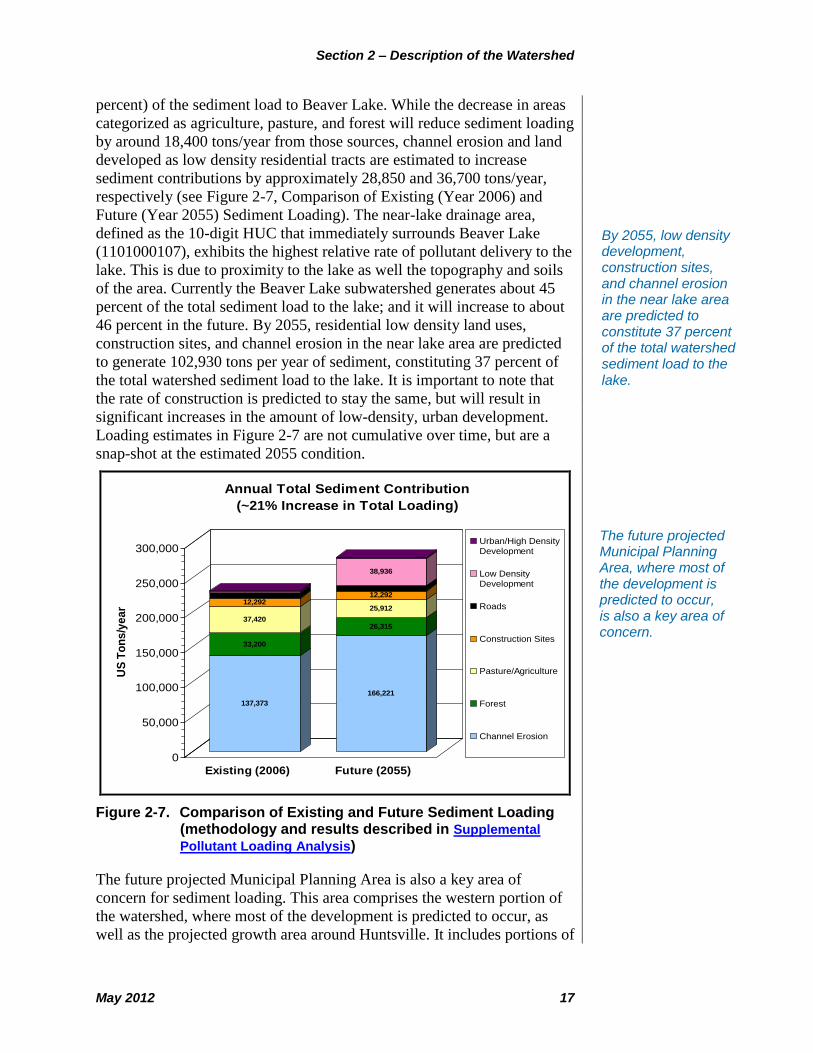
The future annual sediment loading is estimated to increase 21 percent or
almost 50,000 tons per year. Without additional protective measures,
stream channel erosion is estimated to contribute most (approximately 60
Year 2001 Year 2055
Future annual sediment load is estimated to increase 21 percent.
Currently, and in the future, the Beaver Lake subwatershed is estimated to generate about 45 percent of the total sediment
load to the lake.
Where can I find more information on the impervious area and land use analysis?
Beaver Lake SWAT Modeling Baseline Analysis, February 12,
2009, Tetra Tech
Section 2 – Description of the Watershed
May 2012 17
percent) of the sediment load to Beaver Lake. While the decrease in areas
categorized as agriculture, pasture, and forest will reduce sediment loading
by around 18,400 tons/year from those sources, channel erosion and land
developed as low density residential tracts are estimated to increase
sediment contributions by approximately 28,850 and 36,700 tons/year,
respectively (see Figure 2-7, Comparison of Existing (Year 2006) and
Future (Year 2055) Sediment Loading). The near-lake drainage area,
defined as the 10-digit HUC that immediately surrounds Beaver Lake
(1101000107), exhibits the highest relative rate of pollutant delivery to the
lake. This is due to proximity to the lake as well the topography and soils
of the area. Currently the Beaver Lake subwatershed generates about 45
percent of the total sediment load to the lake; and it will increase to about
46 percent in the future. By 2055, residential low density land uses,
construction sites, and channel erosion in the near lake area are predicted
to generate 102,930 tons per year of sediment, constituting 37 percent of
the total watershed sediment load to the lake. It is important to note that
the rate of construction is predicted to stay the same, but will result in
significant increases in the amount of low-density, urban development.
Loading estimates in Figure 2-7 are not cumulative over time, but are a
snap-shot at the estimated 2055 condition.
137,373
33,200
37,420
12,292
166,221
26,315
25,912
12,292
38,936
0
50,000
100,000
150,000
200,000
250,000
300,000
US
To
ns
/ye
ar
Existing (2006) Future (2055)
Annual Total Sediment Contribution
(~21% Increase in Total Loading)
Urban/High DensityDevelopment
Low DensityDevelopment
Roads
Construction Sites
Pasture/Agriculture
Forest
Channel Erosion
Figure 2-7. Comparison of Existing and Future Sediment Loading (methodology and results described in Supplemental
Pollutant Loading Analysis)
The future projected Municipal Planning Area is also a key area of
concern for sediment loading. This area comprises the western portion of
the watershed, where most of the development is predicted to occur, as
well as the projected growth area around Huntsville. It includes portions of
The future projected Municipal Planning Area, where most of the development is predicted to occur, is also a key area of concern.
By 2055, low density development, construction sites, and channel erosion in the near lake area are predicted to constitute 37 percent of the total watershed sediment load to the lake.
Beaver Lake Watershed Protection Strategy
May 2012 18
West Fork, Middle Fork, East Fork, Lower White, Richland Creek, War
Eagle, and the Beaver Lake subwatersheds. The Watershed Protection
Strategy aims to mitigate projected future increases in sediment loading to
the lake from these growth areas.
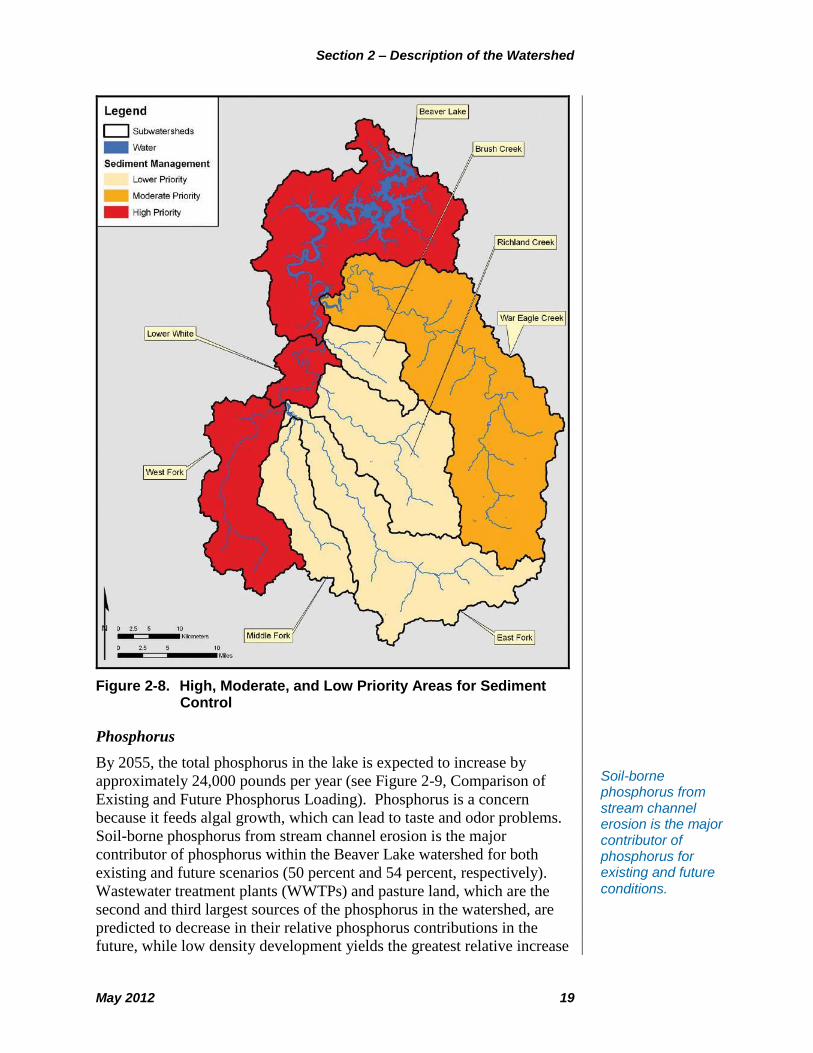
The West Fork and Lower White River subwatersheds also have Total
Maximum Daily Load (TMDL) sediment allocations requiring significant
reductions from existing levels (greater than 53 percent reduction for the
West Fork and greater than 32 percent reduction for the Lower White).
Multiple management practices will need to be applied throughout these
watersheds to address the projected increase in sediment loads, in addition
to the required TMDL decreases. Figure 2-8 shows the locations of the
subwatersheds that are lake protection priorities, because they are 303d-
listed, impaired subwatersheds. (Note: Appendix B lists the BMPs
recommended for West Fork and Lower White subwatersheds to support
TMDL reduction requirements. It also highlights how this Protection
Strategy meets the U.S. Environmental Protection Agency’s nine
minimum elements for watershed plans for impaired waters.)
Section 2 – Description of the Watershed
May 2012 19
Figure 2-8. High, Moderate, and Low Priority Areas for Sediment Control
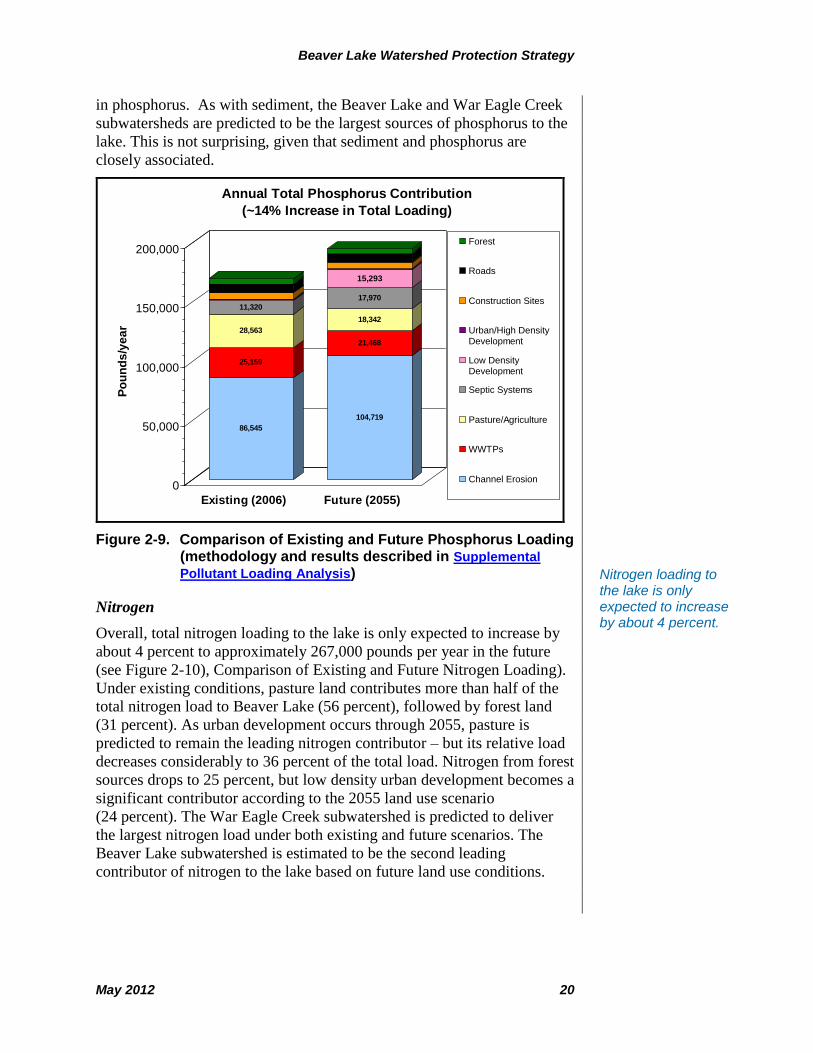
Phosphorus
By 2055, the total phosphorus in the lake is expected to increase by
approximately 24,000 pounds per year (see Figure 2-9, Comparison of
Existing and Future Phosphorus Loading). Phosphorus is a concern
because it feeds algal growth, which can lead to taste and odor problems.
Soil-borne phosphorus from stream channel erosion is the major
contributor of phosphorus within the Beaver Lake watershed for both
existing and future scenarios (50 percent and 54 percent, respectively).
Wastewater treatment plants (WWTPs) and pasture land, which are the
second and third largest sources of the phosphorus in the watershed, are
predicted to decrease in their relative phosphorus contributions in the
future, while low density development yields the greatest relative increase
Soil-borne phosphorus from stream channel erosion is the major contributor of phosphorus for existing and future
conditions.
Beaver Lake Watershed Protection Strategy
May 2012 20
in phosphorus. As with sediment, the Beaver Lake and War Eagle Creek
subwatersheds are predicted to be the largest sources of phosphorus to the
lake. This is not surprising, given that sediment and phosphorus are
closely associated.
86,545
25,159
28,563
11,320
104,719
21,468
18,342
17,970
15,293
0
50,000
100,000
150,000
200,000
Po
un
ds
/ye
ar
Existing (2006) Future (2055)
Annual Total Phosphorus Contribution
(~14% Increase in Total Loading)
Forest
Roads
Construction Sites
Urban/High DensityDevelopment
Low DensityDevelopment
Septic Systems
Pasture/Agriculture
WWTPs
Channel Erosion
Figure 2-9. Comparison of Existing and Future Phosphorus Loading (methodology and results described in Supplemental
Pollutant Loading Analysis)
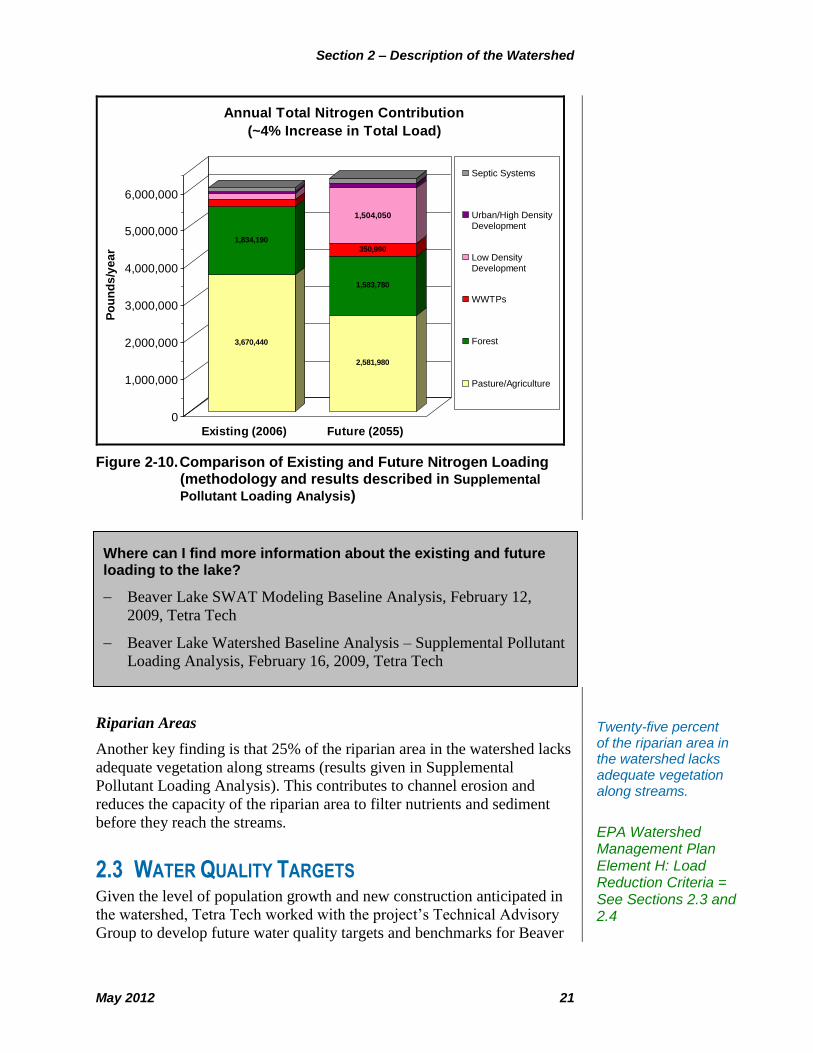
Nitrogen
Overall, total nitrogen loading to the lake is only expected to increase by
about 4 percent to approximately 267,000 pounds per year in the future
(see Figure 2-10), Comparison of Existing and Future Nitrogen Loading).
Under existing conditions, pasture land contributes more than half of the
total nitrogen load to Beaver Lake (56 percent), followed by forest land
(31 percent). As urban development occurs through 2055, pasture is
predicted to remain the leading nitrogen contributor – but its relative load
decreases considerably to 36 percent of the total load. Nitrogen from forest
sources drops to 25 percent, but low density urban development becomes a
significant contributor according to the 2055 land use scenario
(24 percent). The War Eagle Creek subwatershed is predicted to deliver
the largest nitrogen load under both existing and future scenarios. The
Beaver Lake subwatershed is estimated to be the second leading
contributor of nitrogen to the lake based on future land use conditions.
Nitrogen loading to the lake is only expected to increase by about 4 percent.
Section 2 – Description of the Watershed
May 2012 21
3,670,440
1,834,190
2,581,980
1,583,780
350,990
1,504,050
0
1,000,000
2,000,000
3,000,000
4,000,000
5,000,000
6,000,000
Po
un
ds
/ye
ar
Existing (2006) Future (2055)
Annual Total Nitrogen Contribution
(~4% Increase in Total Load)
Septic Systems
Urban/High DensityDevelopment
Low DensityDevelopment
WWTPs
Forest
Pasture/Agriculture
Figure 2-10. Comparison of Existing and Future Nitrogen Loading (methodology and results described in Supplemental
Pollutant Loading Analysis)
Riparian Areas
Another key finding is that 25% of the riparian area in the watershed lacks
adequate vegetation along streams (results given in Supplemental
Pollutant Loading Analysis). This contributes to channel erosion and
reduces the capacity of the riparian area to filter nutrients and sediment
before they reach the streams.
2.3 WATER QUALITY TARGETS Given the level of population growth and new construction anticipated in
the watershed, Tetra Tech worked with the project’s Technical Advisory
Group to develop future water quality targets and benchmarks for Beaver
Twenty-five percent of the riparian area in the watershed lacks adequate vegetation along streams.
Where can I find more information about the existing and future loading to the lake?
Beaver Lake SWAT Modeling Baseline Analysis, February 12,
2009, Tetra Tech
Beaver Lake Watershed Baseline Analysis – Supplemental Pollutant
Loading Analysis, February 16, 2009, Tetra Tech
EPA Watershed Management Plan Element H: Load Reduction Criteria = See Sections 2.3 and 2.4
Beaver Lake Watershed Protection Strategy
May 2012 22
Lake. A target is based on a current (or currently proposed) regulation or
standard, and a benchmark is a non-regulatory objective. Both are
quantitative – they can be measured. The benchmarks are proposed when
there are no regulatory targets, but certain conditions are desired in the
lake, or as a safety factor for a regulatory target’s minimum threshold.
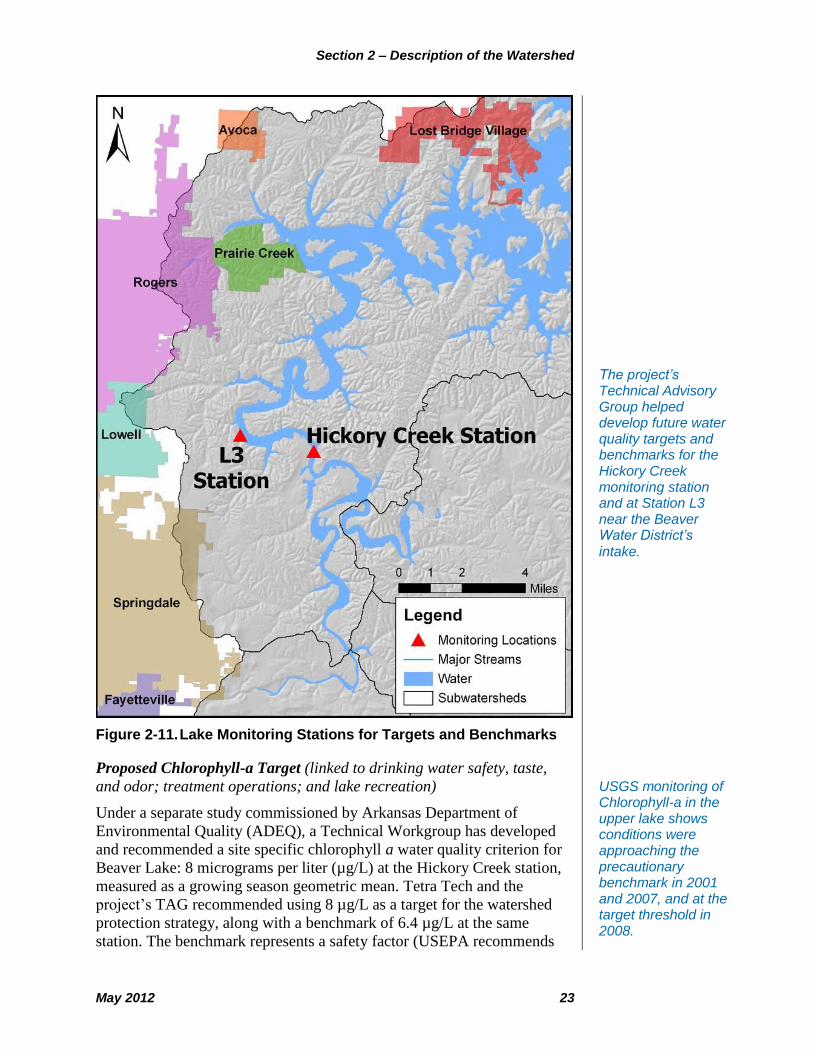
Two locations are proposed for meeting the water quality targets and
benchmarks: the Hickory Creek monitoring station and a monitoring
station L3 near Lowell and the Beaver Water District’s raw water intake
(Figure 2-11). The Hickory Creek station is at the confluence of the major
tributaries to Beaver Lake and the lake’s “plunge point,” where incoming
water from the White River moves below the existing pool of impounded
water in the lake. It is also upstream of the Beaver Water District intake.
The Hickory Creek station was chosen as an early warning indicator for
the rest of the lake. Also, if the Watershed Protection Strategy is protective
of conditions in the lake at Hickory Creek, it is expected to be protective
of the rest of the lake.
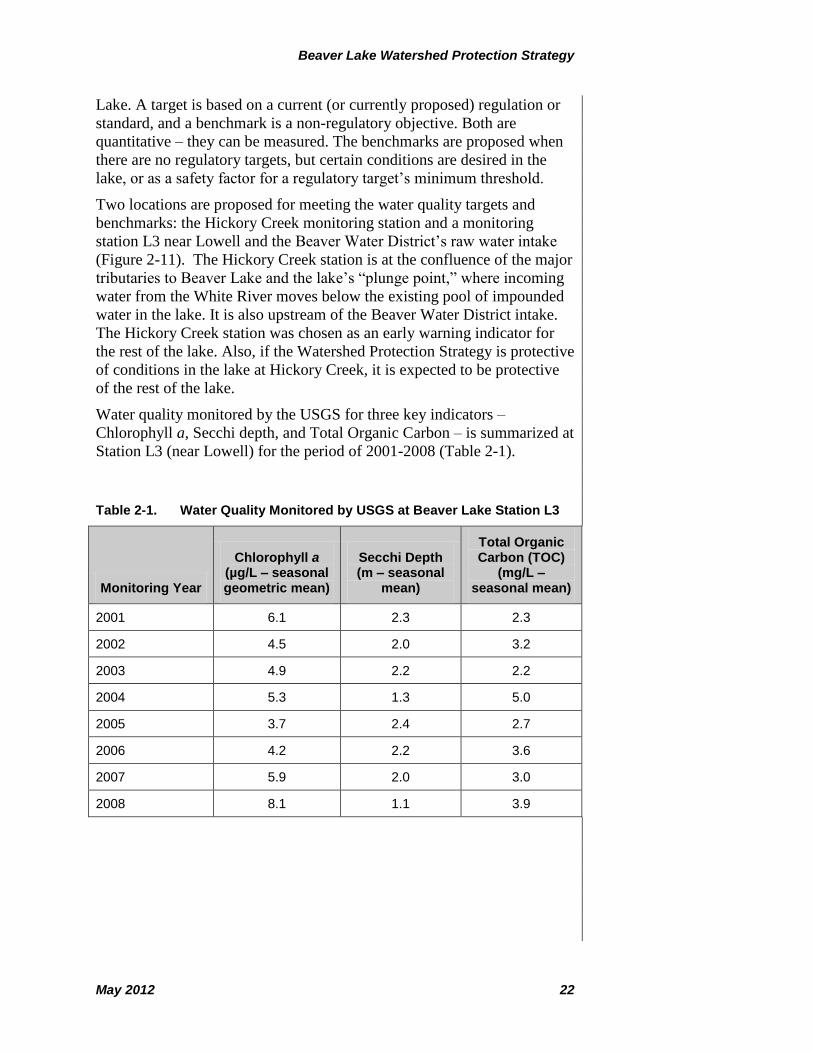
Water quality monitored by the USGS for three key indicators –
Chlorophyll a, Secchi depth, and Total Organic Carbon – is summarized at
Station L3 (near Lowell) for the period of 2001-2008 (Table 2-1).
Table 2-1. Water Quality Monitored by USGS at Beaver Lake Station L3
Monitoring Year
Chlorophyll a (µg/L – seasonal geometric mean)
Secchi Depth (m – seasonal
mean)
Total Organic Carbon (TOC)
(mg/L – seasonal mean)
2001 6.1 2.3 2.3
2002 4.5 2.0 3.2
2003 4.9 2.2 2.2
2004 5.3 1.3 5.0
2005 3.7 2.4 2.7
2006 4.2 2.2 3.6
2007 5.9 2.0 3.0
2008 8.1 1.1 3.9
Section 2 – Description of the Watershed
May 2012 23
Figure 2-11. Lake Monitoring Stations for Targets and Benchmarks
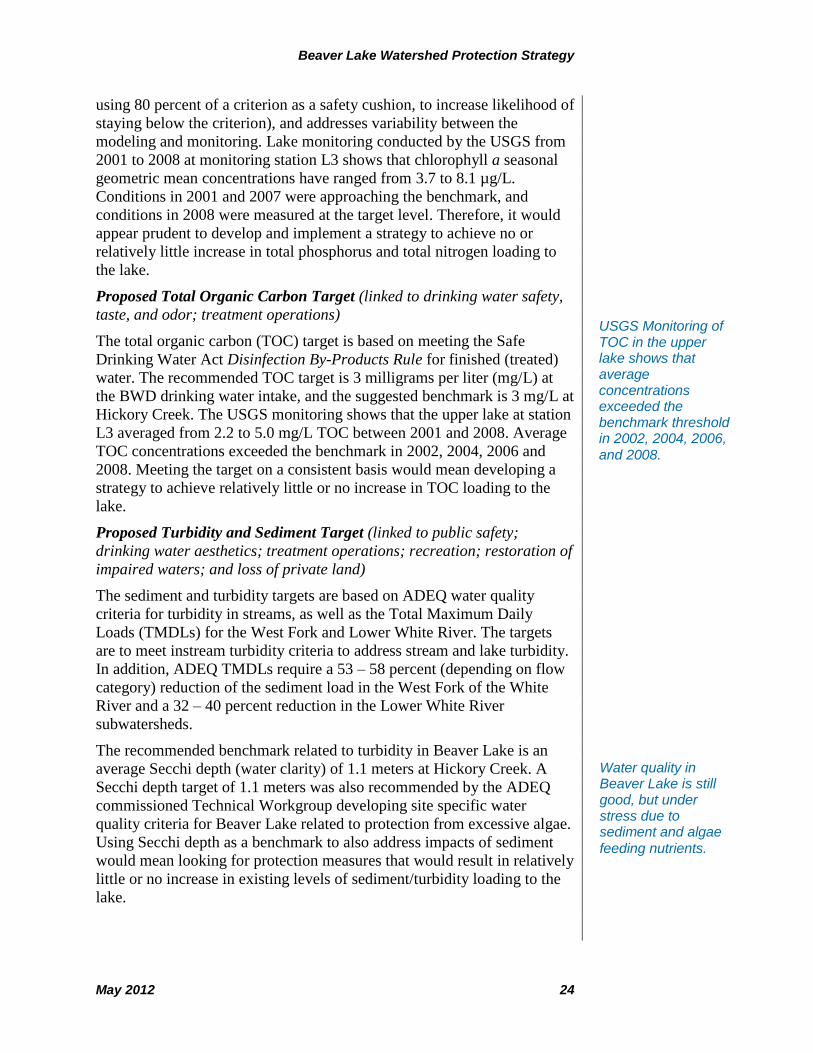
Proposed Chlorophyll-a Target (linked to drinking water safety, taste,
and odor; treatment operations; and lake recreation)
Under a separate study commissioned by Arkansas Department of
Environmental Quality (ADEQ), a Technical Workgroup has developed
and recommended a site specific chlorophyll a water quality criterion for
Beaver Lake: 8 micrograms per liter (µg/L) at the Hickory Creek station,
measured as a growing season geometric mean. Tetra Tech and the
project’s TAG recommended using 8 µg/L as a target for the watershed
protection strategy, along with a benchmark of 6.4 µg/L at the same
station. The benchmark represents a safety factor (USEPA recommends
The project’s Technical Advisory Group helped develop future water quality targets and benchmarks for the Hickory Creek monitoring station and at Station L3 near the Beaver Water District’s
intake.
USGS monitoring of Chlorophyll-a in the upper lake shows conditions were approaching the precautionary benchmark in 2001 and 2007, and at the target threshold in 2008.
Beaver Lake Watershed Protection Strategy
May 2012 24
using 80 percent of a criterion as a safety cushion, to increase likelihood of
staying below the criterion), and addresses variability between the
modeling and monitoring. Lake monitoring conducted by the USGS from
2001 to 2008 at monitoring station L3 shows that chlorophyll a seasonal
geometric mean concentrations have ranged from 3.7 to 8.1 µg/L.
Conditions in 2001 and 2007 were approaching the benchmark, and
conditions in 2008 were measured at the target level. Therefore, it would
appear prudent to develop and implement a strategy to achieve no or
relatively little increase in total phosphorus and total nitrogen loading to
the lake.
Proposed Total Organic Carbon Target (linked to drinking water safety,
taste, and odor; treatment operations)
The total organic carbon (TOC) target is based on meeting the Safe
Drinking Water Act Disinfection By-Products Rule for finished (treated)
water. The recommended TOC target is 3 milligrams per liter (mg/L) at
the BWD drinking water intake, and the suggested benchmark is 3 mg/L at
Hickory Creek. The USGS monitoring shows that the upper lake at station
L3 averaged from 2.2 to 5.0 mg/L TOC between 2001 and 2008. Average
TOC concentrations exceeded the benchmark in 2002, 2004, 2006 and
2008. Meeting the target on a consistent basis would mean developing a
strategy to achieve relatively little or no increase in TOC loading to the
lake.
Proposed Turbidity and Sediment Target (linked to public safety;
drinking water aesthetics; treatment operations; recreation; restoration of
impaired waters; and loss of private land)
The sediment and turbidity targets are based on ADEQ water quality
criteria for turbidity in streams, as well as the Total Maximum Daily
Loads (TMDLs) for the West Fork and Lower White River. The targets
are to meet instream turbidity criteria to address stream and lake turbidity.
In addition, ADEQ TMDLs require a 53 – 58 percent (depending on flow
category) reduction of the sediment load in the West Fork of the White
River and a 32 – 40 percent reduction in the Lower White River
subwatersheds.
The recommended benchmark related to turbidity in Beaver Lake is an
average Secchi depth (water clarity) of 1.1 meters at Hickory Creek. A
Secchi depth target of 1.1 meters was also recommended by the ADEQ
commissioned Technical Workgroup developing site specific water
quality criteria for Beaver Lake related to protection from excessive algae.
Using Secchi depth as a benchmark to also address impacts of sediment
would mean looking for protection measures that would result in relatively
little or no increase in existing levels of sediment/turbidity loading to the
lake.
Water quality in Beaver Lake is still good, but under stress due to sediment and algae
feeding nutrients.
USGS Monitoring of TOC in the upper lake shows that average concentrations exceeded the benchmark threshold in 2002, 2004, 2006,
and 2008.
Section 2 – Description of the Watershed
May 2012 25
2.4 PRIORITY WATERSHED ISSUES Water quality in Beaver Lake is still good, but under stress due to
increasing levels of sediment and algae-feeding nutrients. Although some
degradation in water quality has occurred, people in the region can act in
the coming decades to ensure high quality drinking and recreational
waters.
The Baseline Conditions Analysis indicates that sediment is the key
parameter of concern in the coming decades, both for lake water quality
and localized stream impacts. Lake protection actions taken to mitigate
sediment loading should also address much of the projected increase in
phosphorus. Through the study, Tetra Tech identified priority actions for
lake protection that maximize water quality benefits for the region:
Managing the quality and volume of runoff from new development
Target additional water quality protection measures for new
development in the Municipal Planning area with 12 percent or
greater imperviousness (e.g., 1-acre lots).
Managing construction site runoff Employ best management
practices to control sediment and pollutant runoff on construction
sites throughout the watershed.
Preserving and restoring vegetation in stream buffers and along
stream channels High priority opportunities are the Beaver Lake,
Lower White, and West Fork subwatersheds. Medium priority is in
the lower portion of Middle Fork, East Fork, Richland Creek,
Brush Creek, and War Eagle Creek due to their proximity to
Beaver Lake.
Enhancing pasture best management practices The priority
opportunities are the existing pasture lands in the Beaver Lake,
Lower White, and West Fork subwatersheds. Medium priority is
pasture land in War Eagle Creek.
Improving unpaved roads The high priority subwatershed is
Beaver Lake. Medium priority watersheds are West Fork, Lower
White, and War Eagle Creek.
Although some degradation in water quality has occurred, people in the region can act in the coming decades to ensure high quality drinking and recreational waters.
Where can I find more information about targets and benchmarks?
Beaver Lake Watershed Water Quality Targets/Benchmarks
Analysis, February 18, 2009, Tetra Tech
Beaver Lake Watershed Protection Strategy
May 2012 26
Emphasis on these priority actions assumes that key existing protection
programs will continue and be strengthened including local stormwater
regulation, nutrient management plans, and wastewater management with
particular emphasis on phosphorus reduction from the largest point source
discharges.
May 2012 27
Section 3
3 Building Blocks and Gaps for Lake Protection
A review of current regulations within the Beaver Lake watershed
revealed a number of potential building blocks – and some gaps – for the
Protection Strategy. Efforts to protect and improve water quality within
the watershed have been ongoing for years. This section highlights three
key water quality protection building blocks: local stormwater permits,
nutrient management plans, and wastewater management. Gaps in these
existing programs are also highlighted.
3.1 LOCAL STORMWATER REGULATION Stormwater discharges for large and medium size communities are
regulated by federal Clean Water Act rules for the National Pollutant
Discharge Elimination System (NPDES) permit program, but administered
and enforced by ADEQ. This program regulates all major discharges of
stormwater (i.e., polluted runoff from municipal areas) to surface waters.
The purpose of the NPDES permits is to reduce pollutants in stormwater
runoff from certain municipal separate storm sewer systems (MS4s),
construction sites, and industrial activities by requiring the development
and implementation of stormwater pollution prevention plans and
programs.
ADEQ has designated certain communities with MS4s as regulated
stormwater dischargers and has issued a general permit with stormwater
management conditions that all regulated MS4 communities were
supposed to meet by 2008, including:
Public education
Public involvement/participation
Illicit discharge detection and elimination
Construction site runoff control
Post-construction stormwater management
Pollution prevention/good housekeeping
In the Beaver Lake watershed, regulated MS4 communities include
portions of Benton County, Washington County, and Elkins, Fayetteville,
Greenland, Lowell, Prairie Creek, Rogers, Springdale, and the University
Efforts to protect and improve water quality have been ongoing
for years.
The purpose of the NPDES stormwater permits is to reduce pollutants in the stormwater runoff from certain municipal separate storm sewer systems (MS4s), construction sites, and industrial
activities.
Beaver Lake Watershed Protection Strategy
May 2012 28
of Arkansas. These MS4 communities have contracted with the University
of Arkansas Cooperative Extension Service to develop and administer a
Northwest Arkansas Regional Stormwater Education Program covering
Benton and Washington counties, or the “Fayetteville-Springdale-Rogers”
urbanized area. This program is designed to address the public education
and involvement requirements of the MS4 permits through development
of educational materials for the general public and schools (fact sheets,
brochures, and posters), conducting public outreach and youth education,
and hosting workshops and training events.
Based on a review of the latest annual reports from the MS4s, several of
the MS4s met the 2008 deadline for adopting a construction site runoff
control ordinance or plan and an ordinance or plan for controlling post-
construction runoff. Tetra Tech evaluated the stormwater programs in
place and found that they would need to be strengthened in order to meet
the lake protection goals. A number of the MS4s have not been able to
develop and enforce construction and post-construction requirements,
citing a lack of resources. There is an additional gap in the designation of
regulated MS4 areas. Regulated areas are based on the census survey
every 10 years and determined by population density. Densely populated
areas are called urbanized areas for the purposes of future stormwater
regulation. However, by the time the area has been designated as “urban,”
a significant amount of uncontrolled stormwater runoff has been generated
which would not be covered by the regulations. In these situations,
development designers do not incorporate appropriate stormwater best
management practices into their projects and the cities and counties are
forced to deal with stream channel erosion, water quality degradation, and
other consequences linked to rapid stormwater runoff, low rates of
infiltration and groundwater recharge, and a general absence of
stormwater pollution controls.
In terms of construction phase impacts, it is important to note that federal
stormwater regulations require that all construction sites disturbing more
than one acre, regardless of their location, must have sedimentation and
erosion controls. If this land disturbance falls outside of a designated MS4
community, the Arkansas Department of Environmental Quality is
required to administer and enforce the stormwater NPDES requirements
unless a local government voluntarily enacts an ordinance. However, the
state does not have adequate resources to enforce these requirements.
Several Beaver Lake Focus Groups commented on the relative absence of
enforcement of the construction phase stormwater rules.
Arkansas Highway and Transportation Department (AHTD) construction
projects and certain facilities and roadway drainage systems managed by
the AHTD must also comply with the federal and state stormwater
permitting and management regulations discussed in the previous sections.
Roads, ditches, and drainage facilities on public property managed by the
AHTD are considered to be MS4s under the stormwater permitting
Tetra Tech evaluated stormwater programs in place and found they would need to be strengthened to meet lake protection goals.
A number of MS4 communities have been unable to develop and enforce construction and post-construction requirements, citing a
lack of resources.
In terms of construction phase impacts, if land disturbance of more than one acre falls outside a MS4 jurisdiction, the state is required to enforce stormwater requirements.
Section 3 – Building Blocks and Gaps for Lake Protection
May 2012 29
program. AHTD construction activities with a disturbed area of one acre
or more and AHTD facilities (e.g., equipment and materials storage yards)
draining to other municipal separate storm sewer systems – such as those
owned and managed by cities and/or counties – are also regulated by the
ADEQ MS4 permit and the ADEQ Construction Stormwater General
permit. These permits require the reduction of stormwater impacts on
surface waters “to the maximum extent practicable,” through the following
enforceable permit requirements:
Development and implementation of an ordinance requiring
erosion and sedimentation controls with sanctions necessary to
ensure compliance.
Implementation of appropriate erosion and sediment control best
management practices.
Control of waste materials that may adversely impact water quality
such as building materials, truck washout, chemicals, litter, and
sanitary waste.
Site plan reviews that consider water quality impacts of project
activities.
Communication with the public.
Site inspections and enforcement of control measures.
The ADEQ Construction Stormwater General permit requires that
operators (i.e., property owners, general contractors, etc.) of construction
sites disturbing one acre or more develop and implement a Storm Water
Pollution Prevention Plan (SWPPP), which must be maintained until site
stabilization is complete. Projects disturbing more than five acres must
meet more stringent permit requirements.
Windshield surveys of the watershed indicate that the AHTD stormwater
program needs to be strengthened in the watershed along with ADEQ
enforcement. Poor erosion, sediment, and stormwater controls were
clearly visible at the majority of construction sites surveyed by Tetra Tech
staff during 2008-2009. Problems included failure to quickly seed and/or
mulch cleared areas, poor silt fence / sediment barrier installation and
maintenance, lack of sediment traps, poor or no inlet protection, poor
housekeeping practices, and no stabilization of ditches until late in the
construction process.
3.2 NUTRIENT MANAGEMENT PLANS The Beaver Lake watershed has been designated as a Nutrient Surplus
Area under Arkansas Acts 1059 and 1061 of 2003, as implemented by
Title XXII of the Arkansas Natural Resources Commission Rules
Governing the Arkansas Soil Nutrient and Poultry Litter Application and
Management Program, effective January 2006. The purpose of these rules
Beaver Lake watershed has been designated as a Nutrient Surplus
Area.
The AHTD stormwater program needs to be strengthened along with ADEQ enforcement.
Beaver Lake Watershed Protection Strategy
May 2012 30
is to maintain the benefits derived from the wise use of poultry litter and
other soil nutrients while avoiding undesirable effects from excess nutrient
applications on the waters of the State. Among other provisions, these
rules state that persons applying nutrients to soils or residential/ non-
residential land areas greater than 2.5 acres within a Nutrient Surplus Area
must comply with a nutrient management plan or poultry litter
management plan. Requirements for soil testing, record-keeping,
placement and timing of litter application, and other elements of nutrient
management plans are specified in the rules. Although the rules require the
maintenance of records for five years and require their availability for
inspection by Commission or Conservation District employees, there is no
opportunity for review by other agencies or by the public.
Specifically, Act 1061: An Act to Require Proper Application of Nutrients
and Utilization of Poultry Litter in Nutrient Surplus Areas requires that:
All nutrient applications on residential and nonresidential
development exceeding 2.5 acres in a Nutrient Surplus Area must
be done according to a Nutrient Management Plan.
Applications within a nutrient surplus area on residential lands of
2.5 acres or less shall be applied at a rate not to exceed a protective
rate (as defined in Title XXII).
Nutrients may be applied only by a certified nutrient applicator if
within nutrient surplus areas, except on residential lands of 2.5
acres or less.
The landowner is responsible for maintaining documentation of the
nutrient application in accordance with their plan.
Poultry feeding operations within a nutrient surplus area shall
develop and implement a poultry litter management plan
acceptable to Arkansas Natural Resources Commission (ANRC).
The poultry litter management planner shall by certified by ANRC
in planning.
Additional legislation supports Act 1061, including:
Act 1059: Arkansas Soil Nutrient Management Planner and
Applicator Certification Act, which requires the certification of
persons to properly develop nutrient management plans or to
properly supply soil nutrients and requires ANRC to develop and
implement a nutrient management education, training and
certification program.
Act 1060: An Act to Register Poultry Feeding Operations,
establishes annual registration with ANRC of poultry feeding
operations where more than 2,500 poultry are housed or
maintained.
The purpose of the nutrient management rules is to maintain the benefits derived from use of fertilizers and poultry litter while avoiding undesirable effects.
Although the rules require the maintenance of records for five years, there is no opportunity for review by other agencies or
by the public.
Section 3 – Building Blocks and Gaps for Lake Protection
May 2012 31
Nutrient management plans for poultry litter in the Beaver Lake watershed
are currently estimated using the Arkansas P index, which bases
application rates on crop nitrogen requirements when a site is in the low or
moderate risk category for phosphorous loading.
Interviews with resource agencies and poultry integrators indicated a high
level of compliance with the Nutrient Management Plan requirements.
Based on this, the watershed model assumed nutrient management plan
implementation now and decades into the future. Without such long-term
compliance, the lake protection goals would not be achieved. Thus, the
Beaver Lake Watershed Protection Strategy emphasizes the importance of
maintaining high compliance with Nutrient Management Plan
requirements.
3.3 WASTEWATER MANAGEMENT The Clean Water Act requires the control of wastewater discharges to
surface waters under the National Pollutant Discharge Elimination System
(NPDES) program. The Arkansas Department of Environmental Quality,
which has the delegated authority to administer the program, issues
permits to treated effluent dischargers with limitations on wastewater flow
and pollutants in order to protect surface water quality and the beneficial
uses of the water. These permits must be renewed every five years.
Dischargers must also obtain a permit from ADEQ to construct any waste
collection, treatment, or discharge facility to ensure that proper
engineering design is used. Dischargers are required to perform self
monitoring, and those records, along with periodic inspections and
monitoring by ADEQ, are used to determine compliance with permit
requirements. Enforcement measures, including fines and revoking
permits, are available to ADEQ when addressing noncompliance by
dischargers.
There are currently two major active NPDES permits to discharge
wastewater within the watershed (Fayetteville’s Noland Plant and
Huntsville’s Plant), and several minor effluent discharger permits near
Beaver Lake and West Fork. Much of the municipal wastewater is
generated along the far western boundary of the Beaver Lake drainage
area, in the cities of Fayetteville, Springdale, Lowell, Rogers, and Pea
Ridge, which lie south-to-north along US 71. These cities are served
mostly by the centralized Wastewater Treatment Plants (WWTPs) that
discharge to surface waters of the Beaver Lake and the Upper Illinois
watersheds, but adjacent subdivisions are increasingly served by smaller
clustered (decentralized) facilities that discharge to the soil. Outlying and
rural areas of the watershed are served mostly by individual or small
clustered systems with soil discharges. The Fayetteville WWTP and its
sewage collection system, which have likely been nutrient sources in years
past due to collection system overflows and other problems, have
completed major renovations which include construction of a new WWTP
Interviews with resource agencies and poultry integrators indicated a high level of compliance with nutrient management plan requirements. Based on this, the watershed model assumed nutrient management plan implementation now and decades into the future. Without such long-term compliance, the lake protection goals would not be achieved.
Beaver Lake Watershed Protection Strategy
May 2012 32
on the west side of Fayetteville. Since 1990, the City of Fayetteville’s
Noland WWTP has had a discharge permit limit of 1.0 mg/L for Total
Phosphorus for discharge to the White River. The watershed model
assumed that at least the same limit would be applied to future plant
upgrades and expansion at the Huntsville and West Fork plants. If this or
more protective limits are not used, then the lake protection goals will not
be met. Therefore, the Beaver Lake Watershed Protection Strategy highly
recommends continuance of the state regulation of phosphorus
concentration through effluent limitations for the larger wastewater
discharge permits. It is important to note that the City of Fayetteville and
the Beaver Water District have an Agreement for the Protection of the
Beaver Lake Watershed whereby Fayetteville agrees to maintain an
average TP discharge concentration of 0.5 mg/L year round and will not
exceed 93.4 pounds per day TP from July through October. In addition,
the City of Fayetteville has made commitments to reduce nonpoint source
loading of Total Phosphorus. The City of Fayetteville has taken a number
of major steps to implement the Agreement.
In addition to loads from WWTPs, malfunctioning individual residential
wastewater (septic) systems may be causing localized surface water
quality problems in some areas. Wastewater treatment systems
discharging to the soil can pose a threat to the White River, the lake, and
its tributaries in areas where high densities of older, heavily used systems
are located near surface streams or karst topography. Current rules specify
the types of legally acceptable tanks, infiltration system components, and
other devices, and provide for evaluation of the installation site, training
and licensing of service providers, and the management of systems that
serve multiple homes or other facilities. Individual home wastewater
treatment systems in Arkansas are regulated by the Arkansas Department
of Health (ADH) if they discharge to the soil on the system owner’s
property. Systems that discharge to the soil offsite, or to a surface
waterbody, or that discharge to soil onsite with flows greater than 5,000
gallons per day are regulated by the Arkansas Department of
Environmental Quality (ADEQ) under its NPDES discharge permit and
other programs. In general, ADH will approve individual home systems
with septic tanks and soil absorption fields if adequate space is available,
soils are suitable (i.e., acceptable percolation rate), and setbacks can be
met from groundwater tables, wells, public water supply intakes, streams,
lakes, ponds, property lines, etc. Drain fields are sized in accordance with
soil percolation rates: the slower the percolation rate, the larger the
required drain field.
Individual wastewater systems require regular maintenance, such as
pumping every 3 to 5 years, in order to function as designed. There are no
provisions for checking or reporting maintenance or malfunctioning
systems. A monitoring program can help detect elevated bacteria and trace
sources of problems. Such monitoring would be particularly important in
Beaver Lake’s coves and associated tributaries. An enhanced monitoring
Fayetteville’s Noland WWTP is undergoing major renovations. Since 1990 it has had a discharge permit limit of 1.0 mg/L for Total Phosphorus. The watershed model assumed that at least the same limit would be applied to future plant upgrades of Huntsville and West Fork. If this or more protective limits are not used, then the lake protection goal will not be met.
An enhanced monitoring program for individual onsite wastewater systems is recommended, along with enhanced landowner education regarding system maintenance.
Section 3 – Building Blocks and Gaps for Lake Protection
May 2012 33
program is recommended in this Protection Strategy as well as enhanced
landowner education regarding wastewater treatment and system
maintenance.
Summary
It is important to note that this Strategy does not recommend phosphorus
regulations that are more stringent than those of ADEQ. Of the
municipalities that are MS4 permittees, most have done well at
implementing the education component of the permitting requirements.
On the other hand, other requirements of the MS4 permits have been
implemented with less success. At all levels (cities, counties, and the
state), lack of resources was cited as a reason for the lack of enforcement
or conformation to MS4 requirements. The function of this strategy is to
highlight these gaps and suggest solutions, but it is the responsibility of
the municipality to conform to and enforce the requirements of their
respective permits.
There are several major building blocks for the Beaver Lake Watershed
Protection Strategy. ADEQ has issued stormwater permits for highly
populated urbanized areas in Washington and Benton counties. This
requires a local regulatory mechanism for erosion and sediment controls
and enforcement capability, and a program to address stormwater runoff
from new development and redevelopment after construction has been
completed. Local governments currently have a strong education program,
but for most there is a gap in regulation and enforcement. Also, the
ADEQ/state minimum requirements do not cover a significant amount of
development in urbanizing areas within the lake drainage area. For other
counties, ADEQ has construction site management requirements for
activities disturbing greater than one acre. Currently there is a significant
gap in ADEQ inspection and enforcement. Filling these gaps to carry out
the existing stormwater management regulations as intended is
recommended under the Beaver Lake Watershed Protection Strategy.
The State Nutrient Management Plan Requirements for development and
farmland appear to have a high rate of compliance according to
interviewees. Continued compliance is essential in meeting the lake
protection goals.
Protective phosphorus limits on municipal WWTPs are needed to meet the
lake protection goals. As the smaller WWTPs plants expand, it will be
critical for ADEQ to require at least the same protective limits as those
currently at the Noland Plant in order to meet the lake protection targets.
May 2012 34
Section 4
4 Proposed Beaver Lake Watershed Protection Strategy
The building blocks listed in the preceding section will serve as the
foundation for the Beaver Lake Watershed Protection Strategy described
below. Measures that address the gaps in watershed protection and further
enhance efforts to reduce nutrient and sediment inputs to the lake round
out the proposed approach. The elements of this Strategy represent the
level of effort required to improve the quality of impaired waters and
maintain water quality on unimpaired areas of the main body of the lake.
4.1 OVERVIEW OF THE BEAVER LAKE WATERSHED
PROTECTION STRATEGY The function of this plan is to identify gaps in enforcement of current
regulations.
Increase enforcement of existing federal, state, and local
requirements. This could be accomplished in two ways: 1) to
educate cities, counties and possibly the state on existing
enforcement gaps, and 2) be a method of local enforcement that
would utilize volunteer efforts to work with and educate
individuals who may be violating current regulations, ordinances
or laws.
Provide guidance and support for adoption of voluntary BMPs
Basic voluntary water quality protection BMPs
Guidance and incentives to go beyond core BMPs
Create a mechanism for implementing the Protection Strategy
Adapt management efforts when trigger points indicate that
changes are needed
The Beaver Lake Watershed Protection Strategy has five complementary
components:
Beaver Lake Watershed Council: A diverse group representing different
interests that would provide sustained leadership for lake protection,
including the facilitation of the implementation and adaption of the Beaver
Lake Watershed Protection Strategy.
The elements of this strategy represent the effort required to improve quality of impaired waters and maintain water quality on unimpaired areas of the lake.
Section 4 – Proposed Beaver Lake Watershed Protection Strategy
May 2012 35
Core Best Management Practice (BMPs): Voluntary BMPs that do
double duty of reducing sediment and phosphorus load to the lake and
help reduce current sediment loading in existing impaired streams.
Developer and Contractor Lake Protection Certification Program:
For local governments, site design engineers, developers, and contractors
willing to implement protective stormwater controls for new development
in the Municipal Planning Area and sign a Lake Protection Pledge.
Education and Stewardship Program: Community outreach to teach
property owners about lake protection efforts and how they can help.
Monitoring and Adaptive Management: To address uncertainty and
changing conditions and provide early warning signs for needed changes.
The following sections provide more details about these five components
as well as implementation actions for each.
4.2 FIVE COMPONENTS OF PROTECTION STRATEGY
4.2.1 Component #1 – Beaver Lake Watershed Council
Stewardship and protection of the Beaver Lake watershed depends on the
organized, collective, targeted efforts of citizens, businesses, property
owners, managers, non-governmental organizations (NGOs) and
governmental agencies. A Beaver Lake Watershed Council is
recommended as a way to establish and support a strong partnership
among those organizations which have significant authority or resources
for protecting the watershed. The purpose of the Beaver Lake Watershed
Council would be to provide sustained leadership, ensure that the
partnership is strong, coordinate protection practices, and allocate
resources necessary to implement Strategy recommendations as needed. In
the context of the Overarching Goal of minimizing regulations, the
Council’s function will be to implement educational and voluntary
programs. The Council would also ensure meaningful public participation
in the decision-making. Any changes in the functionality of the Council
will be at the discretion of the Board of Directors. A Watershed Council
Director should be hired to staff the Council and ensure implementation of
the measures needed to protect lake water quality.
Watershed management should be adaptive—a living process that
responds to changing conditions, needs, and information. Instituting a
Watershed Council establishes an approach that can adapt to changing
needs and will allow current and future issues to be addressed in ways that
are both environmentally sound and fiscally responsible. It is an approach
in which all stakeholders can pool and coordinate their technical and
financial resources to achieve the watershed management goals.
The Beaver Lake Watershed Council could be modeled on the region’s
existing Illinois River Watershed Partnership, and efforts of the two
The purpose of the Watershed Council would be to coordinate policy and resource allocations, provide sustained leadership, ensure that the partnership is strong, and adapt practices as needed.
EPA Watershed Management Plan Element C: NPS Management Measures descriptions and Critical Implementation Areas – See Section 4.2.2 #2.
Beaver Lake Watershed Protection Strategy
May 2012 36
groups could be coordinated as it makes sense from a policy and cost-
savings perspective. The Watershed Council would not have regulatory
authority. Rather, it would be a non-profit organization allowing interested
parties to work together, carry out mutually beneficial projects, track
progress, and make recommendations as needed. It is important to
recognize that expert organizations exist that would logically be partners
or leaders in specific BMP implementation; the Watershed Council would
actively identify and fill gaps in implementation or programming and
facilitate the execution of the Protection Strategy.
Potential costs: $200,000 for salary and annual operating expenses for a
Beaver Lake Watershed Council and Director, based on profit-and-loss
statements from other watershed partnership organizations.
Note: The recommendation of the formation of a watershed council
resulted in the development and launch of the Beaver Watershed Alliance
in 2011. Hereafter, the group will be referred to as the Beaver Watershed
Alliance (or, “the Watershed Alliance” where appropriate).
4.2.2 Component #2 – Core Best Management Practices
The Core Best Management Practices were screened and evaluated against
a large number of potential BMPs and determined to be the most cost-
effective in meeting the Goals and Objectives. The Core Voluntary Best
Management Practices hinge on a voluntary and targeted land
conservation program. They also include improved construction site
management, riparian buffer and bank restoration, pasture BMPs, buffer
preservation, unpaved road improvements, and stormwater BMP retrofits
in developed areas. A number of these voluntary BMPs do “double duty”
in reducing sediment and phosphorus loads to the lake and helping to
mitigate current sediment loading in the existing impaired streams (West
Fork of the White River and Lower White River subwatersheds). Below
are descriptions of the core BMPs and where in the watershed it is most
important to gain participation from land owners and local governments.
Land Conservation
The voluntary land conservation program involves conservation easements
or conservation agreements. Easements can be achieved through donation
or purchase, a voluntary carbon credit program, and/or a voluntary
Transfer of Development Rights program. Currently, there are federal and
state tax incentives for donating conservation easements on land that meet
necessary criteria. Conservation agreements are for a shorter period of
time (e.g., 20 years) rather than easements which typically last in
perpetuity. There are a number of federal and state programs, particularly
agriculture and wildlife programs that provide incentives and financing to
purchase easements and enter into conservation agreements.
The City of Fayetteville is exploring development of a Transfer of
Developments Rights (TDR) program that could be a model for voluntary
The land conservation program involves conservation easements or conservation agreements achieved through donation or purchase, a voluntary carbon credit program, a voluntary Transfer of Development Rights program, or other
voluntary measures.
EPA Watershed Management Plan Element D: Estimates of Technical/Financial Costs of Implementation – See also Appendix A.
Section 4 – Proposed Beaver Lake Watershed Protection Strategy
May 2012 37
land preservation in the watershed. In a TDR program, areas in the
watershed are identified where less development is desired (called
development rights “sending areas”) and areas where more intense
development is appropriate (called development rights “receiving areas”).
On a market driven, voluntary basis, property owners in the receiving area
pay property owners in the sending area for development rights, and
transfer those development rights to parcels in the receiving area. The
landowner in the sending area can continue to live on and enjoy the use of
his or her property, but there can be no additional development on the
property in the future beyond that associated with the current use.
A carbon credit program is another way to provide incentives for
establishing conservation easements in the watershed. In this program,
businesses that need or desire to become more carbon neutral could
establish conservation easements on land in the Beaver Lake watershed. A
program would need to be established to determine which land should be
targeted (e.g., riparian buffer areas, highly erodible lands) and the amount
of carbon credit available per acre of conservation easement.
The Environmental Quality Incentives Program (EQIP) and the
Conservation Reserve Enhancement Program (CREP) provide incentives
and funding for entering into conservation agreements. EQIP is
administered by the Natural Resources Conservation Service (NRCS) and
CREP is administered by the Farm Service Agency.
In both the conservation easement and conservation agreement programs,
there are financial incentives and rewards for businesses and landowners
to establish conservation areas. Easements or agreements would prohibit
development or any disturbance of vegetation within the easement area
while providing the landowner continued use of the property. For
conservation easements, successful land conservation will also require
stewardship funds set aside for maintaining the easement in perpetuity and
covering any legal expenses after the easement has been purchased. Figure
4-1 shows that those lands closest to the lake, in the Beaver Lake
subwatershed, have the highest priority for land conservation. Lands in
the Lower White and West Fork subwatersheds are also high priority due
to TMDL requirements.
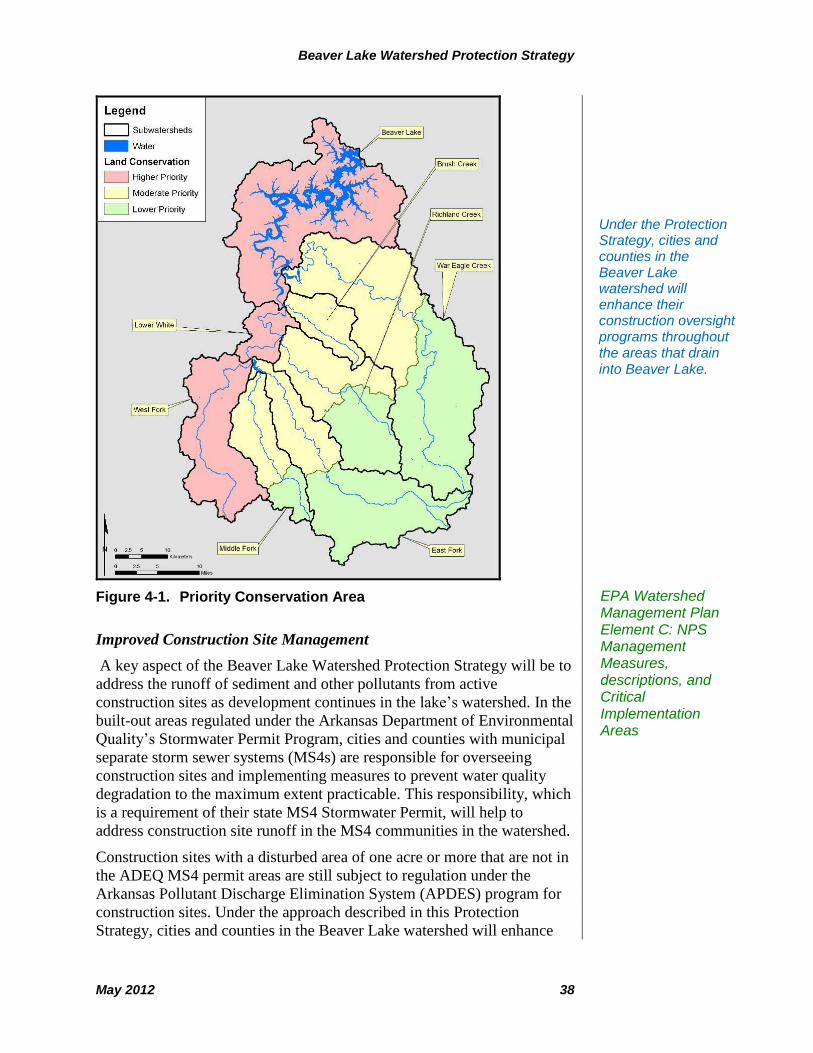
Beaver Lake Watershed Protection Strategy
May 2012 38
Figure 4-1. Priority Conservation Area
Improved Construction Site Management
A key aspect of the Beaver Lake Watershed Protection Strategy will be to
address the runoff of sediment and other pollutants from active
construction sites as development continues in the lake’s watershed. In the
built-out areas regulated under the Arkansas Department of Environmental
Quality’s Stormwater Permit Program, cities and counties with municipal
separate storm sewer systems (MS4s) are responsible for overseeing
construction sites and implementing measures to prevent water quality
degradation to the maximum extent practicable. This responsibility, which
is a requirement of their state MS4 Stormwater Permit, will help to
address construction site runoff in the MS4 communities in the watershed.
Construction sites with a disturbed area of one acre or more that are not in
the ADEQ MS4 permit areas are still subject to regulation under the
Arkansas Pollutant Discharge Elimination System (APDES) program for
construction sites. Under the approach described in this Protection
Strategy, cities and counties in the Beaver Lake watershed will enhance
Under the Protection Strategy, cities and counties in the Beaver Lake watershed will enhance their construction oversight programs throughout the areas that drain into Beaver Lake.
EPA Watershed Management Plan Element C: NPS Management Measures, descriptions, and Critical Implementation Areas
Section 4 – Proposed Beaver Lake Watershed Protection Strategy
May 2012 39
their construction oversight programs throughout the areas that drain into
Beaver Lake, to protect long-term drinking water quality and aquatic life.
Cities and counties will adopt a consistent set of enhanced measures in
their jurisdictions and directly enforce them in their MS4 permit areas. At
the option of the local governments, polluting construction sites not in the
MS4 area may be subject to city or county enforcement or referred to
ADEQ in the event of violations of construction site permit rules. ADEQ
has been advised of this approach, and has noted that construction site
operators have a number of responsibilities regarding their operations. The
following text from the ADEQ statewide permit for construction sites was
provided by ADEQ in response to questions about enforcement of erosion,
sediment, and stormwater requirements:
“Responsibilities of the Operator. Permittees with operational
control are responsible for compliance with all applicable terms
and conditions of this permit as it relates to their activities on the
construction site, including protection of endangered species and
implementation of BMPs and other controls required by the
Stormwater Pollution Prevention Plan (SWPPP). Receipt of this
general permit does not relieve any operator of the responsibility to
comply with any other applicable federal, state or local
statute, ordinance or regulation.”
ADEQ also confirmed that local ordinances may go beyond the state’s
minimum requirements pursuant to protection of Beaver Lake and local
stream conditions. The Protection Strategy recommends implementing a
program that goes beyond the minimum state standards in two ways:
(1) First, the Strategy recommends that all local governments in the
watershed have a local enforcement program, to the extent
feasible, even in the non-urbanized area where there is currently
state jurisdiction. It is assumed that local governments are
enforcing their current regulations to the greatest extent possible,
but (some) are not in compliance with the NPDES requirements. It
is important to note that enforcement has been an issue for some
municipalities, citing a lack of resources and manpower. Where
local governments outside the MS4 area cannot take on
enforcement, it is recommended that problem sites be identified
and referred to the ADEQ for follow-up and possible enforcement.
A voluntary construction site monitoring program could help to
support local governments in this effort.
(2) Second, the Strategy recommends more protective controls than
those found in the minimum state requirements. The recommended
controls include silt fencing with other controls and sediment
basins for all sites that will disturb five acres or more during the
construction period, with project phasing and rapid stabilization of
bare areas at final grade (i.e., no more than 33 percent of the site
bare at any time and stabilization within 10 days of reaching final
The Arkansas Department of Environmental Quality has confirmed that local ordinances may go beyond the State’s minimum requirements pursuant to protection of Beaver Lake and local stream conditions.
Beaver Lake Watershed Protection Strategy
May 2012 40
grade). Disturbed areas inactive for 14 days would also be
stabilized with mulch until grading resumes.
A Construction Site Compliance Assistance Program should be developed
that would target all jurisdictions in the Beaver Lake watershed, both MS4
and non-MS4 communities. There are several non-profit watershed
partnerships that have instituted similar types of programs. For example,
the Upper Chattahoochee River Keepers have the “Get the Dirt Out”
program (http://geththedirtout.org), which educated developers and
contractors across Georgia on permit requirements and assisted these
business owners with compliance issues. The function of the proposed
program is to identify gaps between current regulations and on-the-ground
practices. The Beaver Lake Watershed Council would own the program
and recruit volunteer inspectors. Development and implementation of the
Program would include the following:
Develop inspection protocols and a BMP manual that can be used
by local staff and contractors.
Develop a “Compliance Assistance Inspection Program,” and
recruit and train volunteer retired engineers and/or others
experienced in construction site runoff controls. The volunteer
inspectors would inspect construction sites, evaluate the BMPs,
report to the contractor any site deficiencies, and provide
consultation on how to address the deficiencies.
The volunteer inspectors acting on behalf of the MS4s should be
authorized to conduct inspections of regulated construction sites in
the MS4 jurisdiction. Refusal to allow entry of the inspector may
constitute grounds for issuance of a warning, a stop work order or
monetary fine. The volunteers would supplement the work of
existing county and municipal staff.
Inspections will be conducted under a “compliance assistance
inspection” protocol, whereby the inspector identifies conditions
that do not comply with construction site stormwater regulations,
provides consultation and recommendations regarding compliance
approaches, and conducts re-inspections several days later to
determine whether or not noncompliant conditions have been
addressed. Failure to correct noncompliant conditions may result in
a referral to the MS4 and ADEQ for enforcement action, such as a
fine or stop work order. The main goal of this program, however,
is to be completely transparent in working with developers,
contractors, and businesses.
Inspections will focus on permit documents – stormwater pollution
prevention plan, ADEQ notice of permit coverage, inspection
reports, local grading/other permits; and a field inspection –
drainage system controls (ditches, traps, ponds, etc.), protection
measures for slopes and bare areas, and housekeeping controls
A Construction Site Compliance Assistance Program should be developed that would target all jurisdictions in the Beaver Lake
watershed.
Volunteer inspectors would inspect construction sites, evaluate the BMPs, report to the contractors any deficiencies, and provide consultation on how to address
them.
Section 4 – Proposed Beaver Lake Watershed Protection Strategy
May 2012 41
(rock pad exit, concrete washout, materials storage, fueling areas,
etc.).
Volunteer inspector training would be consistent and coordinated.
This training would build on the existing UA education/training
program. The inspector training session would last two days.
Successful completion of the training would allow the trainee to be
added to the list of Certified Volunteer Inspectors. Continuing
education would also be provided. The Compliance Assistance
Program Administrator would keep the list of certified volunteers
up-to-date. The Program Administrator or the local staff could
assign the inspectors to sites that need inspections, depending on
program inspection implementation in each jurisdiction.
A Voluntary Contractor Certification Program. Training would be
available to familiarize design engineers and contractors with how
to prepare the stormwater pollution prevention plans, how to
select/install/maintain the controls, how to conduct their
inspections, and how to comply with the permit program. In order
to get a high participation rate with contractors, it is recommended
that the training sessions be held in the winter months, with an 8-
hour training event broken into two 4-hour sessions. Incentives for
participation could include allowing contractors to advertise as
“Certified,” working with suppliers of erosion control products to
provide discounts to Certified Contractors, and publicly
recognizing certified design engineers and contractors and their
outstanding projects.
Draw from the experience of Wal-Mart and the City of Hot
Springs, which have existing successful certification programs.
Riparian Buffer and Bank Restoration
Streambank restoration, as considered in this Protection Strategy,
involves the conversion of eroded vertical banks to gradually sloping
banks, which are then stabilized and vegetated. Streambank restoration is
needed to significantly reduce bank and channel erosion rates along
streams without bank vegetation; vegetation restoration will also be
required to maintain the stability of the restored banks. Restoration of
vegetation will also provide nutrient and sediment removal from upland
runoff. The vegetation restoration is termed “riparian buffer restoration”
because vegetation would be restored in riparian areas (land near streams)
that provide a protective buffer for streambanks and water quality. Priority
areas for riparian buffer and bank restoration are shown in Figure 4-2. The
streams colored red currently have impacted buffers. Impacted buffers are
defined as having less than 30 percent vegetation (such as trees and wild
shrubs) along the stream (Roy, 2005). The streams closest to the lake and
existing impaired streams have the highest priority for restoration because
Streambank restoration involves the conversion of eroded vertical banks to gradually sloping banks, which are then stabilized and vegetated.
Training would be available to familiarize design engineers and contractors with how to comply with construction site
requirements.
EPA Watershed Management Plan Element E: Education and Information Component
EPA Watershed Management Plan Element C: NPS Management Measures, Descriptions, and Critical Implementaion Areas
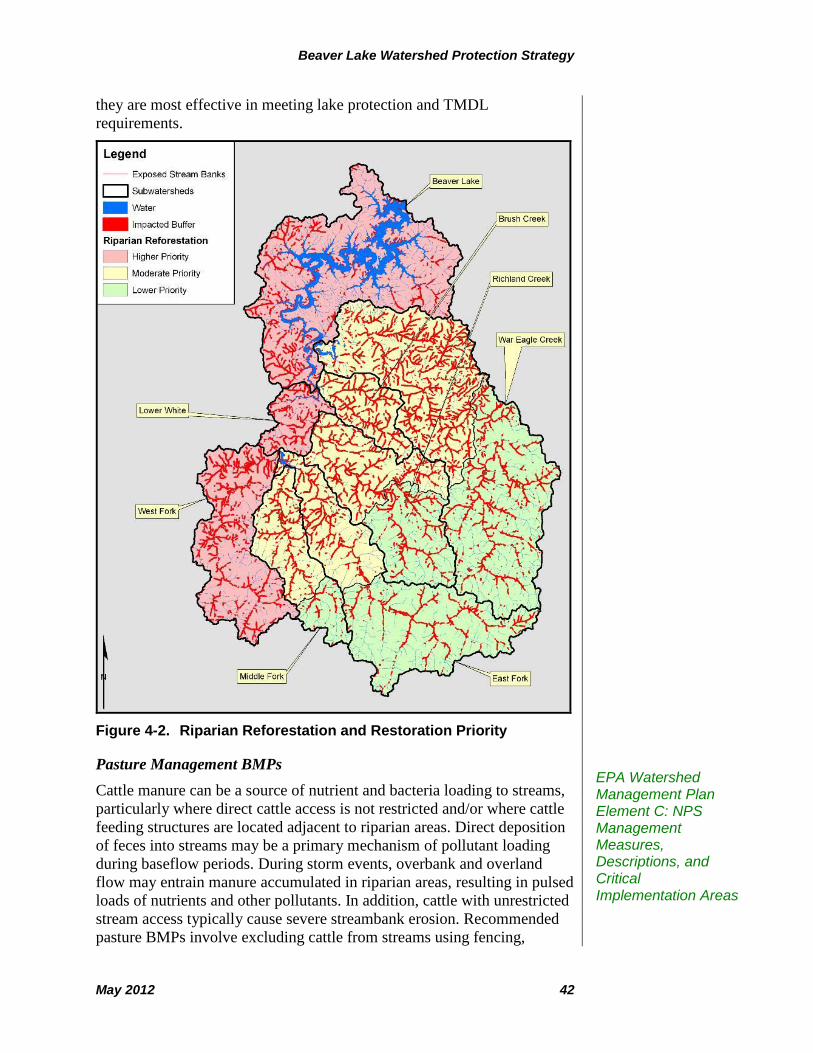
Beaver Lake Watershed Protection Strategy
May 2012 42
they are most effective in meeting lake protection and TMDL
requirements.
Figure 4-2. Riparian Reforestation and Restoration Priority
Pasture Management BMPs
Cattle manure can be a source of nutrient and bacteria loading to streams,
particularly where direct cattle access is not restricted and/or where cattle
feeding structures are located adjacent to riparian areas. Direct deposition
of feces into streams may be a primary mechanism of pollutant loading
during baseflow periods. During storm events, overbank and overland
flow may entrain manure accumulated in riparian areas, resulting in pulsed
loads of nutrients and other pollutants. In addition, cattle with unrestricted
stream access typically cause severe streambank erosion. Recommended
pasture BMPs involve excluding cattle from streams using fencing,
EPA Watershed Management Plan Element C: NPS Management Measures, Descriptions, and Critical Implementation Areas
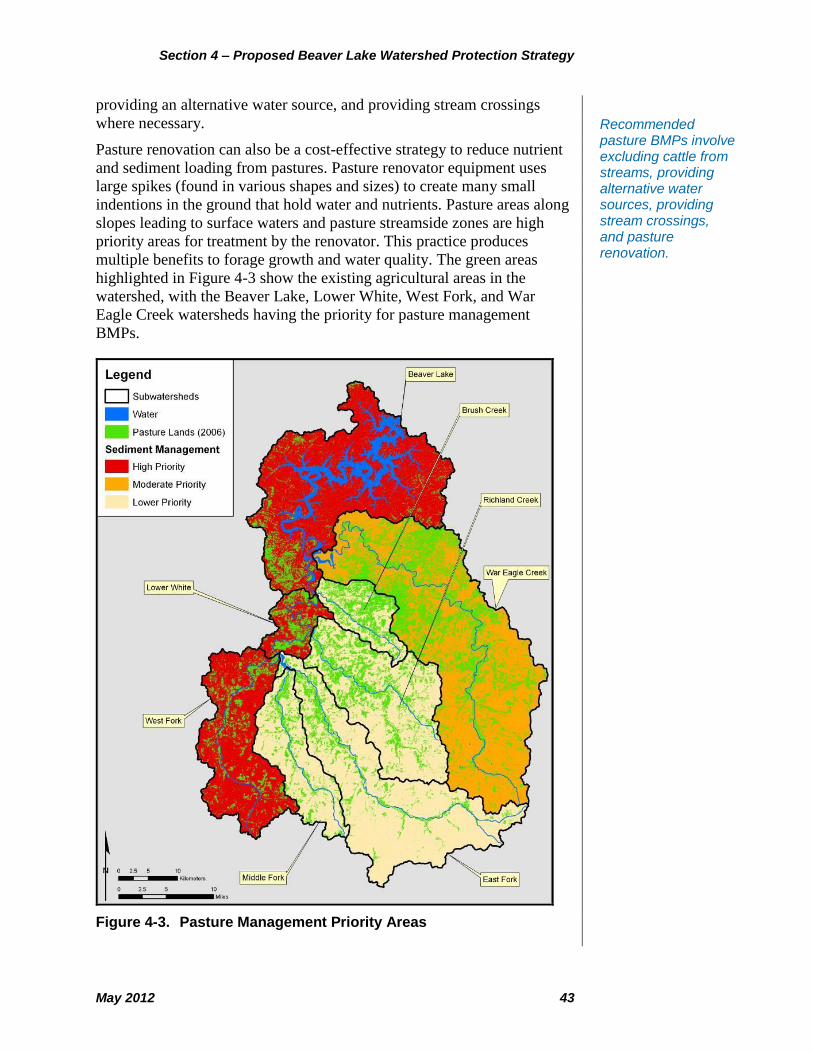
Section 4 – Proposed Beaver Lake Watershed Protection Strategy
May 2012 43
providing an alternative water source, and providing stream crossings
where necessary.
Pasture renovation can also be a cost-effective strategy to reduce nutrient
and sediment loading from pastures. Pasture renovator equipment uses
large spikes (found in various shapes and sizes) to create many small
indentions in the ground that hold water and nutrients. Pasture areas along
slopes leading to surface waters and pasture streamside zones are high
priority areas for treatment by the renovator. This practice produces
multiple benefits to forage growth and water quality. The green areas
highlighted in Figure 4-3 show the existing agricultural areas in the
watershed, with the Beaver Lake, Lower White, West Fork, and War
Eagle Creek watersheds having the priority for pasture management
BMPs.
Figure 4-3. Pasture Management Priority Areas
Recommended pasture BMPs involve excluding cattle from streams, providing alternative water sources, providing stream crossings, and pasture renovation.
Beaver Lake Watershed Protection Strategy
May 2012 44
Buffer Preservation
Like riparian buffer restoration, preservation of existing riparian buffers
will help maintain the existing stability of streambanks and provide
pollutant removal from upland runoff. The preservation of riparian buffers
involves voluntary protection and/or the purchase of a conservation
easement/agreement, which prohibits development or any disturbance of
vegetation in the riparian area, while providing the landowner continued
use of the property. Successful preservation may also require stewardship
funds set aside for maintaining the easement in perpetuity and covering
any legal expenses after the easement has been purchased. The priority
areas for buffer preservation are the same as those for land conservation
(Figure 4-1).
Unpaved Road Improvements
Studies nationally and in Arkansas have documented that roads can be a
major source of sediment and associated pollutant loading through both
direct and indirect means. Unstabilized roadside ditches are often a
significant source of sediment load. In addition, unpaved roads are a major
direct source of sediment loading including fine sediment that leads to
elevated turbidity in Beaver Lake and its tributary streams. Traffic
continuously grinds the bed material of unpaved roads, resulting in a
source of fine sediment that may be washed off or eroded by storms.
Paving the road surface reduces direct erosion, but can still result in large
sediment loads as runoff from paved roads generates high energy flows
that can erode road margins and ditches.
The Beaver Lake Watershed Protection Strategy recommends several
types of improvements to unpaved roads. These include wing ditches and
turnouts that direct runoff from the road into undisturbed (vegetated)
areas, hydroseeding ditches, and stabilizing stream crossings. Culverts
should also be installed at regular intervals that pass drainage from
adjacent land underneath roads and reduce stormwater flow passing across
road surfaces. The black lines in Figure 4-4 indicate unpaved roads in the
watershed, with the Beaver Lake, Lower White and West Fork
subwatersheds having the highest priority for road improvements. Beaver
Lake subwatershed is critical to reducing existing loading to the lake.
Improvements in the Lower White and West Fork are important to helping
meet TMDL requirements.
Preservation of riparian buffers involves the voluntary protection and/or purchase of conservation easements, which prohibits development or disturbance of vegetation on a property along the
stream.
The Protection Strategy recommends several types of improvements to unpaved roads: wing ditches and turnouts, hydroseeding ditches, and stabilizing stream
crossings.
EPA Watershed Management Plan Element C: NPS Management Measures, Descriptions, and Critical Implementation Areas
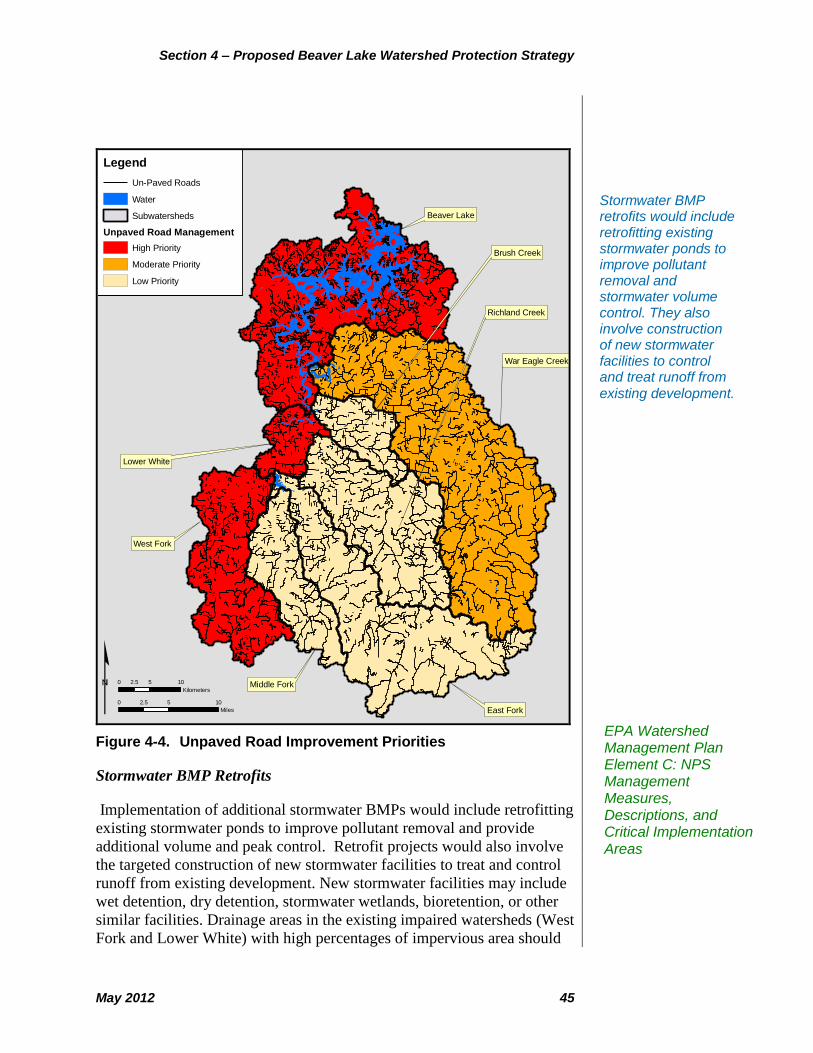
Section 4 – Proposed Beaver Lake Watershed Protection Strategy
May 2012 45
War Eagle Creek
Beaver Lake
East Fork
Richland Creek
West Fork
Middle Fork
Brush Creek
Lower White
TSS Loading Estimates from Roads - Beaver Lake Watershed
NAD_1983_UTM_Zone_15NMap produced 10-30-2008 - P. Cada
0 5 102.5
Miles
0 5 102.5
Kilometers
Legend
Un-Paved Roads
Water
Subwatersheds
Unpaved Road Management
High Priority
Moderate Priority
Low Priority
Figure 4-4. Unpaved Road Improvement Priorities
Stormwater BMP Retrofits
Implementation of additional stormwater BMPs would include retrofitting
existing stormwater ponds to improve pollutant removal and provide
additional volume and peak control. Retrofit projects would also involve
the targeted construction of new stormwater facilities to treat and control
runoff from existing development. New stormwater facilities may include
wet detention, dry detention, stormwater wetlands, bioretention, or other
similar facilities. Drainage areas in the existing impaired watersheds (West
Fork and Lower White) with high percentages of impervious area should
Stormwater BMP retrofits would include retrofitting existing stormwater ponds to improve pollutant removal and stormwater volume control. They also involve construction of new stormwater facilities to control and treat runoff from
existing development.
EPA Watershed Management Plan Element C: NPS Management Measures, Descriptions, and Critical Implementation Areas
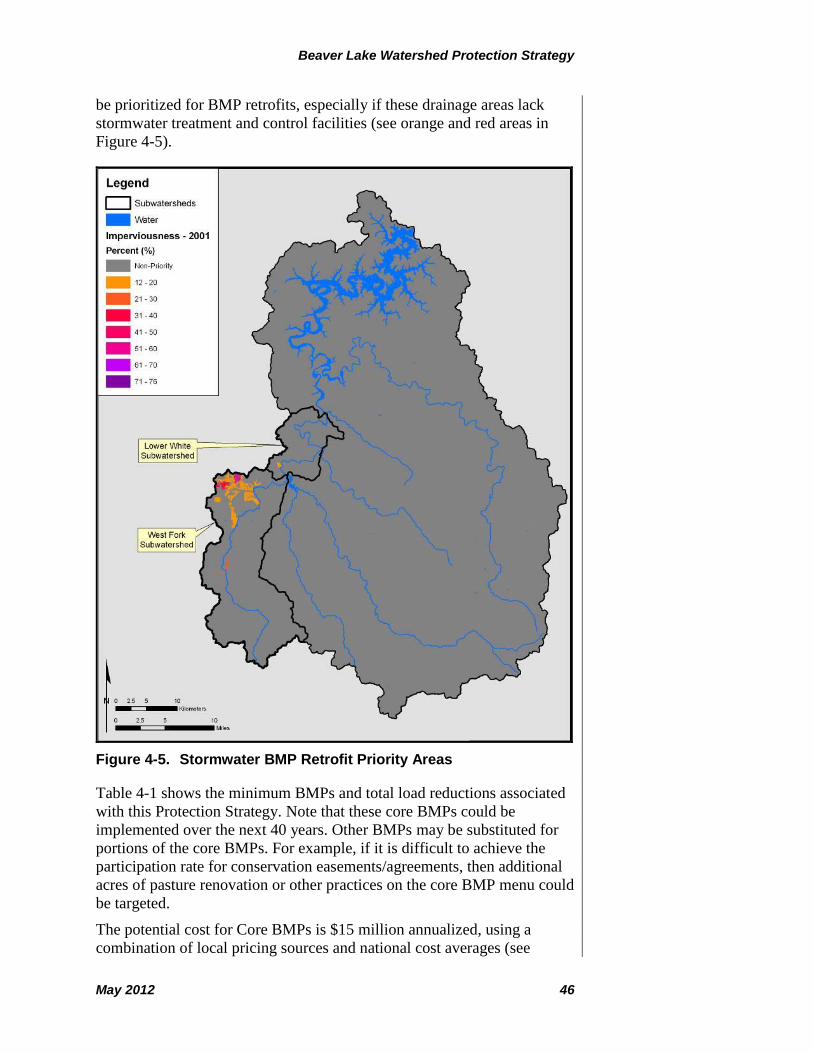
Beaver Lake Watershed Protection Strategy
May 2012 46
be prioritized for BMP retrofits, especially if these drainage areas lack
stormwater treatment and control facilities (see orange and red areas in
Figure 4-5).
Figure 4-5. Stormwater BMP Retrofit Priority Areas
Table 4-1 shows the minimum BMPs and total load reductions associated
with this Protection Strategy. Note that these core BMPs could be
implemented over the next 40 years. Other BMPs may be substituted for
portions of the core BMPs. For example, if it is difficult to achieve the
participation rate for conservation easements/agreements, then additional
acres of pasture renovation or other practices on the core BMP menu could
be targeted.
The potential cost for Core BMPs is $15 million annualized, using a
combination of local pricing sources and national cost averages (see
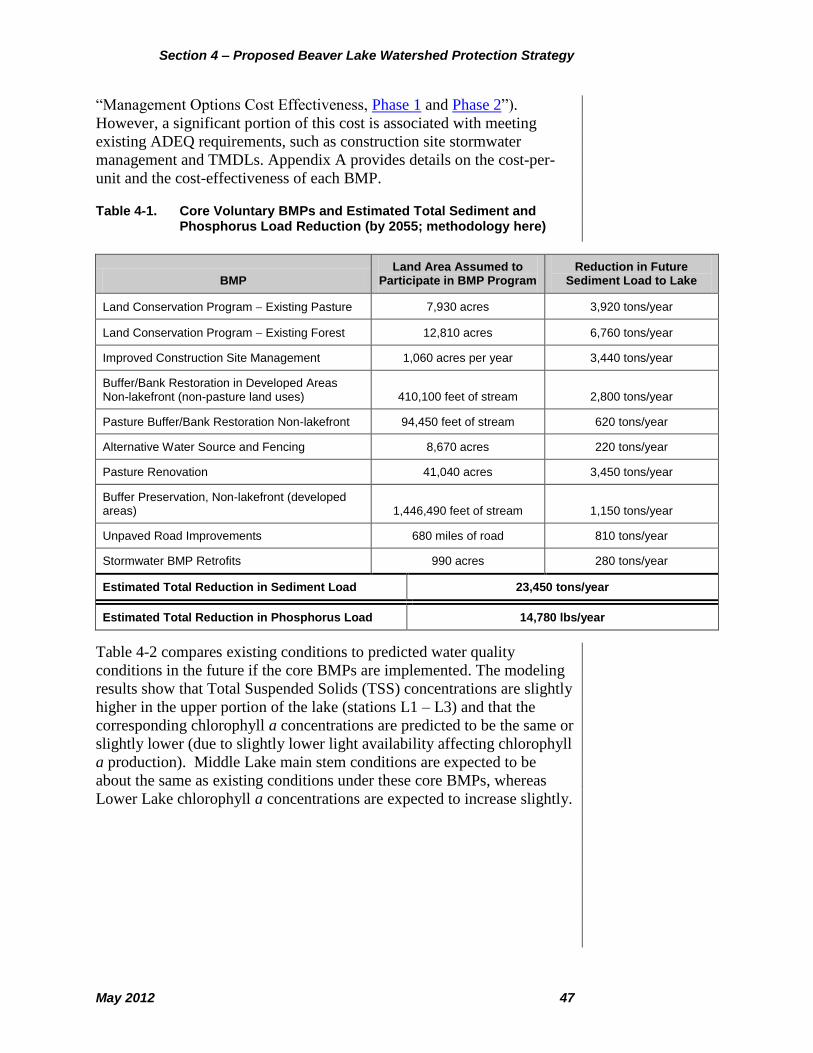
Section 4 – Proposed Beaver Lake Watershed Protection Strategy
May 2012 47
“Management Options Cost Effectiveness, Phase 1 and Phase 2”).
However, a significant portion of this cost is associated with meeting
existing ADEQ requirements, such as construction site stormwater
management and TMDLs. Appendix A provides details on the cost-per-
unit and the cost-effectiveness of each BMP.
Table 4-1. Core Voluntary BMPs and Estimated Total Sediment and Phosphorus Load Reduction (by 2055; methodology here)
BMP Land Area Assumed to
Participate in BMP Program Reduction in Future
Sediment Load to Lake
Land Conservation Program Existing Pasture 7,930 acres 3,920 tons/year
Land Conservation Program Existing Forest 12,810 acres 6,760 tons/year
Improved Construction Site Management 1,060 acres per year 3,440 tons/year
Buffer/Bank Restoration in Developed Areas Non-lakefront (non-pasture land uses) 410,100 feet of stream 2,800 tons/year
Pasture Buffer/Bank Restoration Non-lakefront 94,450 feet of stream 620 tons/year
Alternative Water Source and Fencing 8,670 acres 220 tons/year
Pasture Renovation 41,040 acres 3,450 tons/year
Buffer Preservation, Non-lakefront (developed areas) 1,446,490 feet of stream 1,150 tons/year
Unpaved Road Improvements 680 miles of road 810 tons/year
Stormwater BMP Retrofits 990 acres 280 tons/year
Estimated Total Reduction in Sediment Load 23,450 tons/year
Estimated Total Reduction in Phosphorus Load 14,780 lbs/year
Table 4-2 compares existing conditions to predicted water quality
conditions in the future if the core BMPs are implemented. The modeling
results show that Total Suspended Solids (TSS) concentrations are slightly
higher in the upper portion of the lake (stations L1 – L3) and that the
corresponding chlorophyll a concentrations are predicted to be the same or
slightly lower (due to slightly lower light availability affecting chlorophyll
a production). Middle Lake main stem conditions are expected to be
about the same as existing conditions under these core BMPs, whereas
Lower Lake chlorophyll a concentrations are expected to increase slightly.
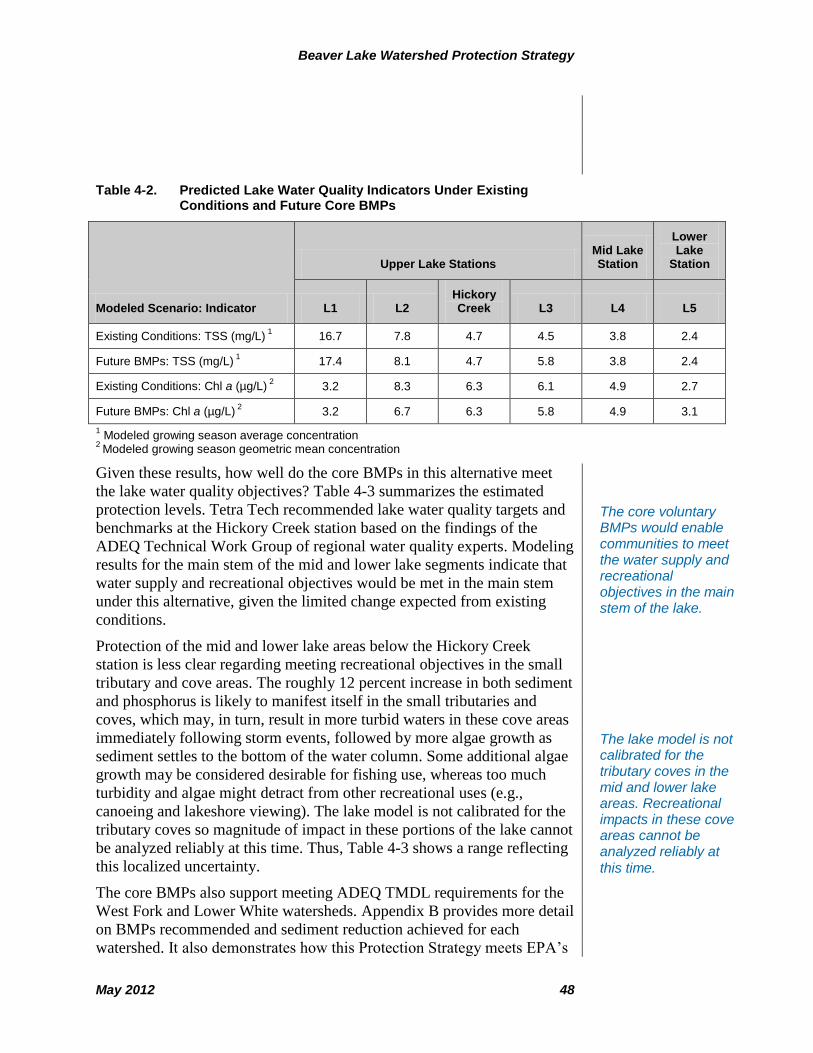
Beaver Lake Watershed Protection Strategy
May 2012 48
Table 4-2. Predicted Lake Water Quality Indicators Under Existing Conditions and Future Core BMPs
Modeled Scenario: Indicator
Upper Lake Stations Mid Lake Station
Lower Lake
Station
L1 L2 Hickory Creek L3 L4 L5
Existing Conditions: TSS (mg/L) 1 16.7 7.8 4.7 4.5 3.8 2.4
Future BMPs: TSS (mg/L) 1 17.4 8.1 4.7 5.8 3.8 2.4
Existing Conditions: Chl a (µg/L) 2 3.2 8.3 6.3 6.1 4.9 2.7
Future BMPs: Chl a (µg/L) 2 3.2 6.7 6.3 5.8 4.9 3.1
1 Modeled growing season average concentration
2 Modeled growing season geometric mean concentration
Given these results, how well do the core BMPs in this alternative meet
the lake water quality objectives? Table 4-3 summarizes the estimated
protection levels. Tetra Tech recommended lake water quality targets and
benchmarks at the Hickory Creek station based on the findings of the
ADEQ Technical Work Group of regional water quality experts. Modeling
results for the main stem of the mid and lower lake segments indicate that
water supply and recreational objectives would be met in the main stem
under this alternative, given the limited change expected from existing
conditions.
Protection of the mid and lower lake areas below the Hickory Creek
station is less clear regarding meeting recreational objectives in the small
tributary and cove areas. The roughly 12 percent increase in both sediment
and phosphorus is likely to manifest itself in the small tributaries and
coves, which may, in turn, result in more turbid waters in these cove areas
immediately following storm events, followed by more algae growth as
sediment settles to the bottom of the water column. Some additional algae
growth may be considered desirable for fishing use, whereas too much
turbidity and algae might detract from other recreational uses (e.g.,
canoeing and lakeshore viewing). The lake model is not calibrated for the
tributary coves so magnitude of impact in these portions of the lake cannot
be analyzed reliably at this time. Thus, Table 4-3 shows a range reflecting
this localized uncertainty.
The core BMPs also support meeting ADEQ TMDL requirements for the
West Fork and Lower White watersheds. Appendix B provides more detail
on BMPs recommended and sediment reduction achieved for each
watershed. It also demonstrates how this Protection Strategy meets EPA’s
The core voluntary BMPs would enable communities to meet the water supply and recreational objectives in the main stem of the lake.
The lake model is not calibrated for the tributary coves in the mid and lower lake areas. Recreational impacts in these cove areas cannot be analyzed reliably at
this time.
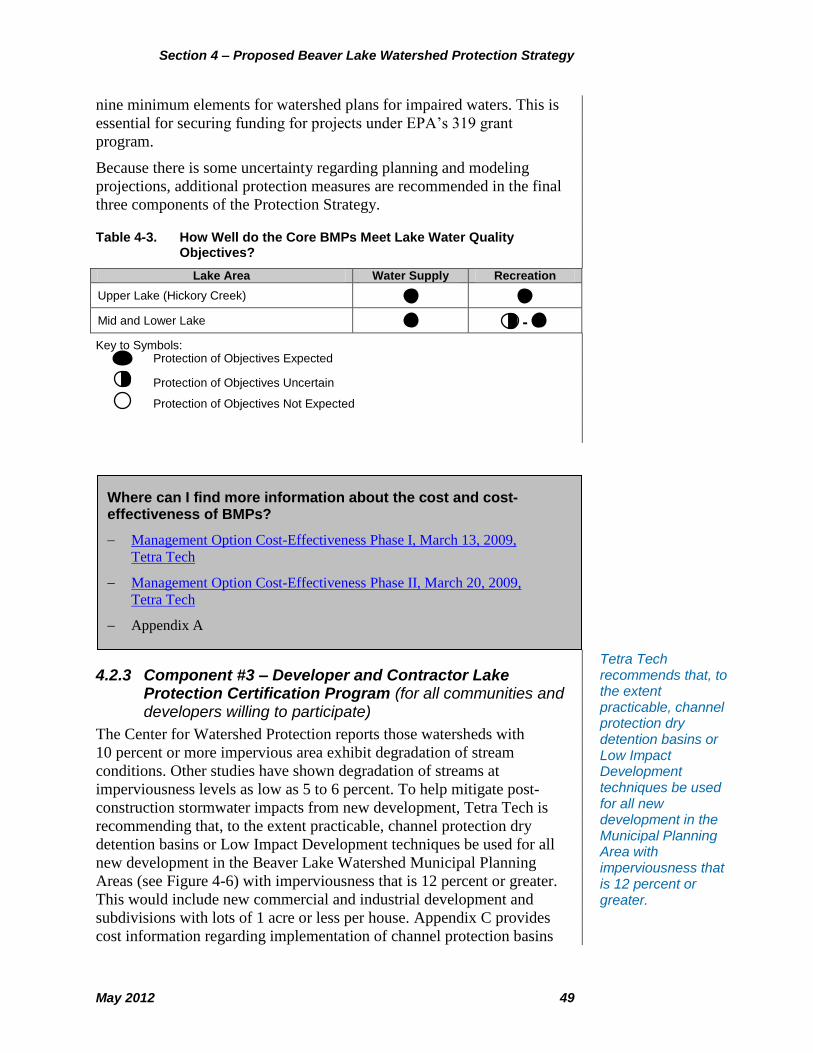
Section 4 – Proposed Beaver Lake Watershed Protection Strategy
May 2012 49
nine minimum elements for watershed plans for impaired waters. This is
essential for securing funding for projects under EPA’s 319 grant
program.
Because there is some uncertainty regarding planning and modeling
projections, additional protection measures are recommended in the final
three components of the Protection Strategy.
Table 4-3. How Well do the Core BMPs Meet Lake Water Quality Objectives?
Lake Area Water Supply Recreation
Upper Lake (Hickory Creek) " "
Mid and Lower Lake " ³ - "
Key to Symbols: Protection of Objectives Expected
³ Protection of Objectives Uncertain
Protection of Objectives Not Expected
4.2.3 Component #3 – Developer and Contractor Lake Protection Certification Program (for all communities and developers willing to participate)
The Center for Watershed Protection reports those watersheds with
10 percent or more impervious area exhibit degradation of stream
conditions. Other studies have shown degradation of streams at
imperviousness levels as low as 5 to 6 percent. To help mitigate post-
construction stormwater impacts from new development, Tetra Tech is
recommending that, to the extent practicable, channel protection dry
detention basins or Low Impact Development techniques be used for all
new development in the Beaver Lake Watershed Municipal Planning
Areas (see Figure 4-6) with imperviousness that is 12 percent or greater.
This would include new commercial and industrial development and
subdivisions with lots of 1 acre or less per house. Appendix C provides
cost information regarding implementation of channel protection basins
Tetra Tech recommends that, to the extent practicable, channel protection dry detention basins or Low Impact Development techniques be used for all new development in the Municipal Planning Area with imperviousness that is 12 percent or greater.
Where can I find more information about the cost and cost-effectiveness of BMPs?
Management Option Cost-Effectiveness Phase I, March 13, 2009,
Tetra Tech
Management Option Cost-Effectiveness Phase II, March 20, 2009,
Tetra Tech
Appendix A
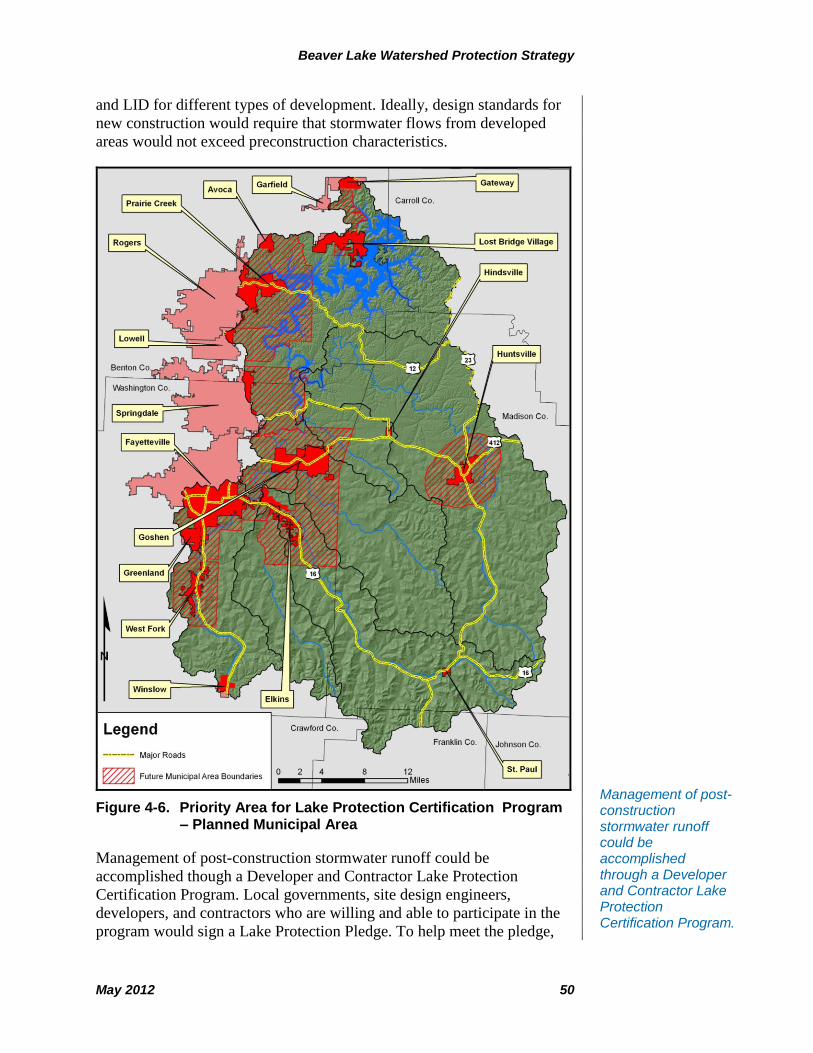
Beaver Lake Watershed Protection Strategy
May 2012 50
and LID for different types of development. Ideally, design standards for
new construction would require that stormwater flows from developed
areas would not exceed preconstruction characteristics.
Figure 4-6. Priority Area for Lake Protection Certification Program – Planned Municipal Area
Management of post-construction stormwater runoff could be
accomplished though a Developer and Contractor Lake Protection
Certification Program. Local governments, site design engineers,
developers, and contractors who are willing and able to participate in the
program would sign a Lake Protection Pledge. To help meet the pledge,
Management of post-construction stormwater runoff could be accomplished through a Developer and Contractor Lake Protection Certification Program.
Section 4 – Proposed Beaver Lake Watershed Protection Strategy
May 2012 51
the Beaver Lake Watershed Council and University of Arkansas-
Fayetteville (UA-Fayetteville) could implement a Stormwater Compliance
Assistance Program, which is educational in nature and includes a
volunteer-driven outreach effort. Similar to the Construction Site
Management Compliance Assistance Program described above, the
components of the Post-Construction Stormwater Compliance Assistance
Program would include:
Development of site design standards, inspection protocols, and a
channel protection/LID BMP manual that can be used by local
staff, developers, and contractors. The site design standards would
seek to eliminate or minimize increases in stormwater flow and
pollutant runoff from newly developed and redeveloped sites.
Note that UA-Fayetteville has received a grant to develop a LID
Manual for NW Arkansas.
Training local staff in participating local governments on how to
review plans for new development and redevelopment in order to
calculate stormwater flow and projected pollutant runoff from the
site.
Development of a “Compliance Assistance Inspection Program,”
recruiting and training volunteer retired engineers. The volunteer
engineers would inspect installation of channel protection dry
detention basins and LID BMPs and report to the contractor any
site deficiencies. The volunteer engineers would also conduct
routine inspections of channel protection basins and LID BMPs to
ensure long-term maintenance. The volunteers would supplement
the work of existing staff.
BMP installation inspections will be conducted under a
“compliance assistance inspection” protocol, whereby the
inspector identifies conditions that do not comply with the BMP
manual or the site permit, provides consultation and
recommendations regarding compliance approaches, and conducts
re-inspections to determine whether or not noncompliant
conditions have been addressed. Prolonged failure to correct
noncompliant conditions may result in decertification in the Lake
Protection Certification Program for the developer and/or
contractor.
Routine post-construction BMP inspections would also be
conducted under a compliance assistance inspection protocol,
whereby the volunteer inspector checks for routine maintenance
and proper functioning of the BMP, provides recommendations to
the homeowners’ association or other responsible BMP
owner/operator, and conducts re-inspections to determine whether
noncompliant conditions have been addressed. Prolonged failure to
Local governments, site design engineers, developers, and contractors who are willing and able to participate would sign a Lake Protection
Pledge.
EPA Watershed Management Plan Element E: Education and Information Component.
Beaver Lake Watershed Protection Strategy
May 2012 52
correct noncompliant conditions may result in a referral to
participating local government.
Volunteer Inspector training would be consistent and coordinated.
This training would build on the existing UA-Fayetteville
education/training program and be coordinated through the
University and Beaver Lake Watershed Council. The training
session would last two days. Successful completion of the training
would allow the trainee to be added to the list of Certified
Volunteer Inspectors. Continuing education would also be
provided. The Compliance Assistance Program administrator
would keep the list of certified volunteers up-to-date. The Program
Administrator or the local staff could assign the inspectors to sites
that need inspections.
Develop a Voluntary Contractor Certification Program. Training
would be available to familiarize design engineers and contractors
with how to select/design/install/maintain channel protection and
LID BMPs. It is recommended that the sessions be held in the
winter months, with an 8-hour training event broken into two
4-hours sessions. To provide incentives to participate, the Program
would allow contractors to advertise as “Lake Protection
Certified,” work with suppliers of BMP construction products to
provide discounts to Certified Contractors, and publicly recognize
certified design engineers and contractors and their outstanding
projects. One example of a program that recognizes outstanding
development projects is the Lower Cape Fear Stewardship
Development program in North Carolina, which awards two levels
of recognition for development projects that protect water quality
and other natural resources (www.stewardshipdev.com).
It is estimated that a regional Developer and Contractor Lake Protection
Certification Program would have a startup cost of approximately $66,000
and recurring annual cost of approximately $35,000.
4.2.4 Component #4 – Education and Stewardship Program
Building on existing educational programs, an outreach program should be
established to educate landowners about the lake protection efforts and
how they can participate. This should include reaching out to landowners
and businesses in the priority watersheds for land conservation, buffer/
bank restoration, buffer preservation, and pasture BMPs. The message
should stress that “doing it for the lake” also protects your local streams,
and helps maintain a high quality of life for the region. Other messages
might include “Protect Your Private Property – Keep Your Land Out of
the Lake!” and “White River ♥s Green Buffers.”
In addition, there are “good housekeeping” practices that should be
encouraged for all homeowners including proper fertilizing of lawns,
Building on existing education programs, an outreach program should be established to educate landowners about lake protection efforts and how they can participate.
EPA Watershed Management Plan Element E: Education and Information Component – See Section 4.2.4 #4.
Section 4 – Proposed Beaver Lake Watershed Protection Strategy
May 2012 53
maintenance of septic systems (and use of enhanced onsite wastewater
systems for new development), and maintaining vegetation along streams.
4.2.5 Component #5 – Monitoring and Adaptive Management
The Beaver Lake Watershed Protection Strategy was developed based on
historical monitoring data for the watershed and lake, projections of future
development through the year 2055, and modeling that predicted the
watershed processes and lake responses to that new development. While
monitoring data provide information on current conditions, we cannot
monitor future conditions in advance of when they occur – for prediction
of future conditions we rely on models. There is uncertainty in all long-
range growth projections and in modeling, and conditions change: new
water quality protection technologies will emerge, climate conditions may
change, and lake water quality may improve or decline. Historical and
ongoing monitoring efforts provide critical information in characterizing
the current stressors and impacts within the Beaver Lake watershed.
However, additional monitoring and assessment efforts are needed to
protect Beaver Lake’s water supply and recreation in the coming decades.
This Strategy recommends an annual formulation and evaluation of
programs at the organizational level for the Watershed Alliance and
participating stakeholder organizations, along with a five-year cycle of
adaptive management as Strategy implementation occurs. Monitoring can
occur either continuously or at the end of a management cycle, depending
on resources and funding.
It is important a long-term monitoring program exists to provide a
technical foundation for an adaptive management process. As a part of the
iterative adaptive management approach, Tetra Tech recommends several
types of additional monitoring to serve as early warning indicators:
Water Quality Monitoring. Are water quality targets being met at
the Hickory Creek station? Monitoring should be conducted at the
Hickory Creek station, which was chosen by the Technical
Workgroup as an early warning indicator site for the Beaver Water
District water supply and the rest of the lake. In addition, studies
have determined that there is potential for significant loading of
sediment and phosphorus from the Beaver Lake subwatershed
downstream from the Hickory Creek station, which could pose
threats to recreational uses and water supplies in the mid and lower
lake areas.
As of Spring 2012, there are 46 monitoring stations located
throughout the watershed (Table 4-4); while these stations do not
all monitor every parameter necessary to detect changes in water
quality with program implementation, the list collectively
Additional monitoring and assessment efforts are needed to protect Beaver Lake’s water supply and recreation in the coming decades.
There is uncertainty in all long-range growth projections and in modeling. Also, conditions change.
EPA Watershed Management Plan Element I: Monitoring of Implementation Efforts and Their Efficacy

Beaver Lake Watershed Protection Strategy
May 2012 54
represents a level of monitoring that may be helpful in evaluating
program and BMP impact.
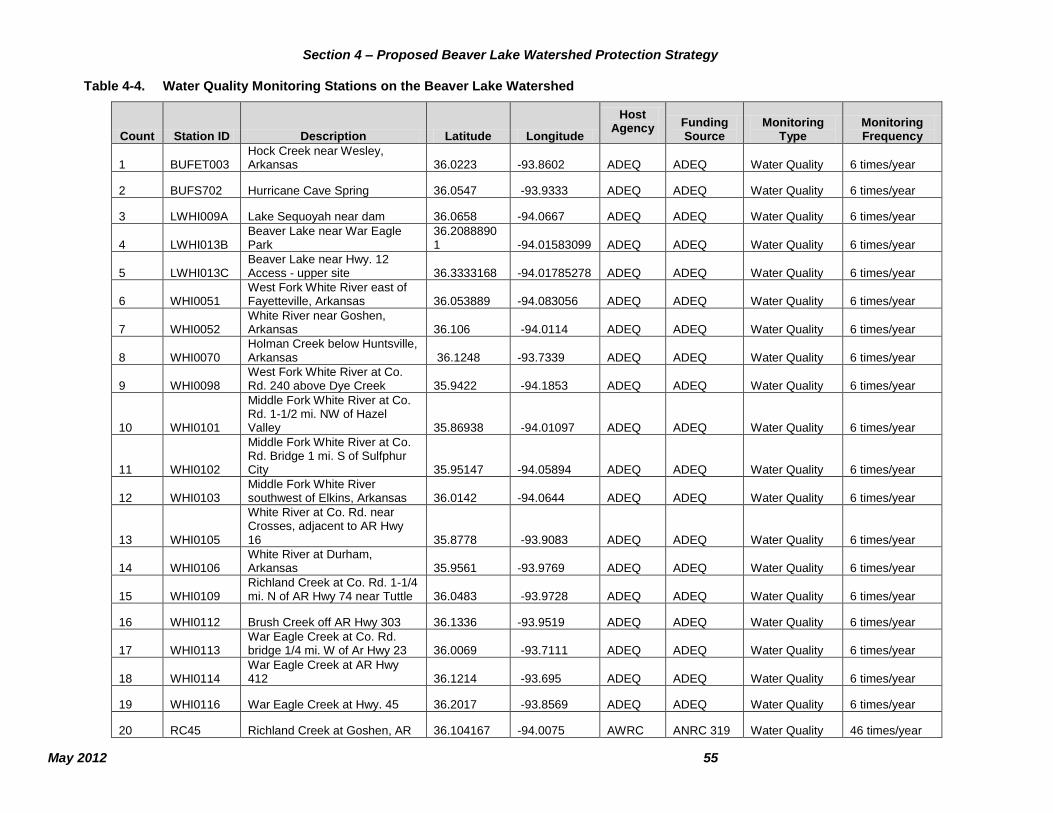
Section 4 – Proposed Beaver Lake Watershed Protection Strategy
May 2012 55
Table 4-4. Water Quality Monitoring Stations on the Beaver Lake Watershed
Count Station ID Description Latitude Longitude
Host Agency Funding
Source Monitoring
Type Monitoring Frequency
1 BUFET003 Hock Creek near Wesley, Arkansas 36.0223 -93.8602 ADEQ ADEQ Water Quality 6 times/year
2 BUFS702 Hurricane Cave Spring 36.0547 -93.9333 ADEQ ADEQ Water Quality 6 times/year
3 LWHI009A Lake Sequoyah near dam 36.0658 -94.0667 ADEQ ADEQ Water Quality 6 times/year
4 LWHI013B Beaver Lake near War Eagle Park
36.20888901 -94.01583099 ADEQ ADEQ Water Quality 6 times/year
5 LWHI013C Beaver Lake near Hwy. 12 Access - upper site 36.3333168 -94.01785278 ADEQ ADEQ Water Quality 6 times/year
6 WHI0051 West Fork White River east of Fayetteville, Arkansas 36.053889 -94.083056 ADEQ ADEQ Water Quality 6 times/year
7 WHI0052 White River near Goshen, Arkansas 36.106 -94.0114 ADEQ ADEQ Water Quality 6 times/year
8 WHI0070 Holman Creek below Huntsville, Arkansas 36.1248 -93.7339 ADEQ ADEQ Water Quality 6 times/year
9 WHI0098 West Fork White River at Co. Rd. 240 above Dye Creek 35.9422 -94.1853 ADEQ ADEQ Water Quality 6 times/year
10 WHI0101
Middle Fork White River at Co. Rd. 1-1/2 mi. NW of Hazel Valley 35.86938 -94.01097 ADEQ ADEQ Water Quality 6 times/year
11 WHI0102
Middle Fork White River at Co. Rd. Bridge 1 mi. S of Sulfphur City 35.95147 -94.05894 ADEQ ADEQ Water Quality 6 times/year
12 WHI0103 Middle Fork White River southwest of Elkins, Arkansas 36.0142 -94.0644 ADEQ ADEQ Water Quality 6 times/year
13 WHI0105
White River at Co. Rd. near Crosses, adjacent to AR Hwy 16 35.8778 -93.9083 ADEQ ADEQ Water Quality 6 times/year
14 WHI0106 White River at Durham, Arkansas 35.9561 -93.9769 ADEQ ADEQ Water Quality 6 times/year
15 WHI0109 Richland Creek at Co. Rd. 1-1/4 mi. N of AR Hwy 74 near Tuttle 36.0483 -93.9728 ADEQ ADEQ Water Quality 6 times/year
16 WHI0112 Brush Creek off AR Hwy 303 36.1336 -93.9519 ADEQ ADEQ Water Quality 6 times/year
17 WHI0113 War Eagle Creek at Co. Rd. bridge 1/4 mi. W of Ar Hwy 23 36.0069 -93.7111 ADEQ ADEQ Water Quality 6 times/year
18 WHI0114 War Eagle Creek at AR Hwy 412 36.1214 -93.695 ADEQ ADEQ Water Quality 6 times/year
19 WHI0116 War Eagle Creek at Hwy. 45 36.2017 -93.8569 ADEQ ADEQ Water Quality 6 times/year
20 RC45 Richland Creek at Goshen, AR 36.104167 -94.0075 AWRC ANRC 319 Water Quality 46 times/year
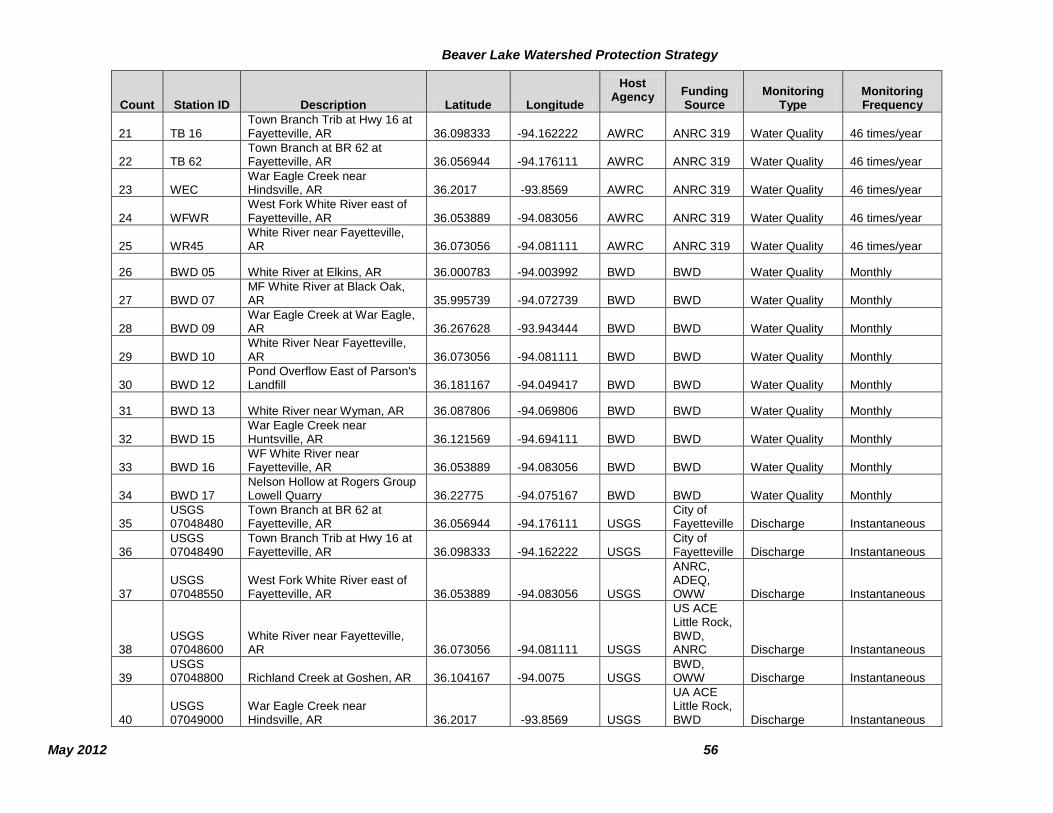
Beaver Lake Watershed Protection Strategy
May 2012 56
Count Station ID Description Latitude Longitude
Host Agency Funding
Source Monitoring
Type Monitoring Frequency
21 TB 16 Town Branch Trib at Hwy 16 at Fayetteville, AR 36.098333 -94.162222 AWRC ANRC 319 Water Quality 46 times/year
22 TB 62 Town Branch at BR 62 at Fayetteville, AR 36.056944 -94.176111 AWRC ANRC 319 Water Quality 46 times/year
23 WEC War Eagle Creek near Hindsville, AR 36.2017 -93.8569 AWRC ANRC 319 Water Quality 46 times/year
24 WFWR West Fork White River east of Fayetteville, AR 36.053889 -94.083056 AWRC ANRC 319 Water Quality 46 times/year
25 WR45 White River near Fayetteville, AR 36.073056 -94.081111 AWRC ANRC 319 Water Quality 46 times/year
26 BWD 05 White River at Elkins, AR 36.000783 -94.003992 BWD BWD Water Quality Monthly
27 BWD 07 MF White River at Black Oak, AR 35.995739 -94.072739 BWD BWD Water Quality Monthly
28 BWD 09 War Eagle Creek at War Eagle, AR 36.267628 -93.943444 BWD BWD Water Quality Monthly
29 BWD 10 White River Near Fayetteville, AR 36.073056 -94.081111 BWD BWD Water Quality Monthly
30 BWD 12 Pond Overflow East of Parson's Landfill 36.181167 -94.049417 BWD BWD Water Quality Monthly
31 BWD 13 White River near Wyman, AR 36.087806 -94.069806 BWD BWD Water Quality Monthly
32 BWD 15 War Eagle Creek near Huntsville, AR 36.121569 -94.694111 BWD BWD Water Quality Monthly
33 BWD 16 WF White River near Fayetteville, AR 36.053889 -94.083056 BWD BWD Water Quality Monthly
34 BWD 17 Nelson Hollow at Rogers Group Lowell Quarry 36.22775 -94.075167 BWD BWD Water Quality Monthly
35 USGS 07048480
Town Branch at BR 62 at Fayetteville, AR 36.056944 -94.176111 USGS
City of Fayetteville Discharge Instantaneous
36 USGS 07048490
Town Branch Trib at Hwy 16 at Fayetteville, AR 36.098333 -94.162222 USGS
City of Fayetteville Discharge Instantaneous
37 USGS 07048550
West Fork White River east of Fayetteville, AR 36.053889 -94.083056 USGS
ANRC, ADEQ, OWW Discharge Instantaneous
38 USGS 07048600
White River near Fayetteville, AR 36.073056 -94.081111 USGS
US ACE Little Rock, BWD, ANRC Discharge Instantaneous
39 USGS 07048800 Richland Creek at Goshen, AR 36.104167 -94.0075 USGS
BWD, OWW Discharge Instantaneous
40 USGS 07049000
War Eagle Creek near Hindsville, AR 36.2017 -93.8569 USGS
UA ACE Little Rock, BWD Discharge Instantaneous
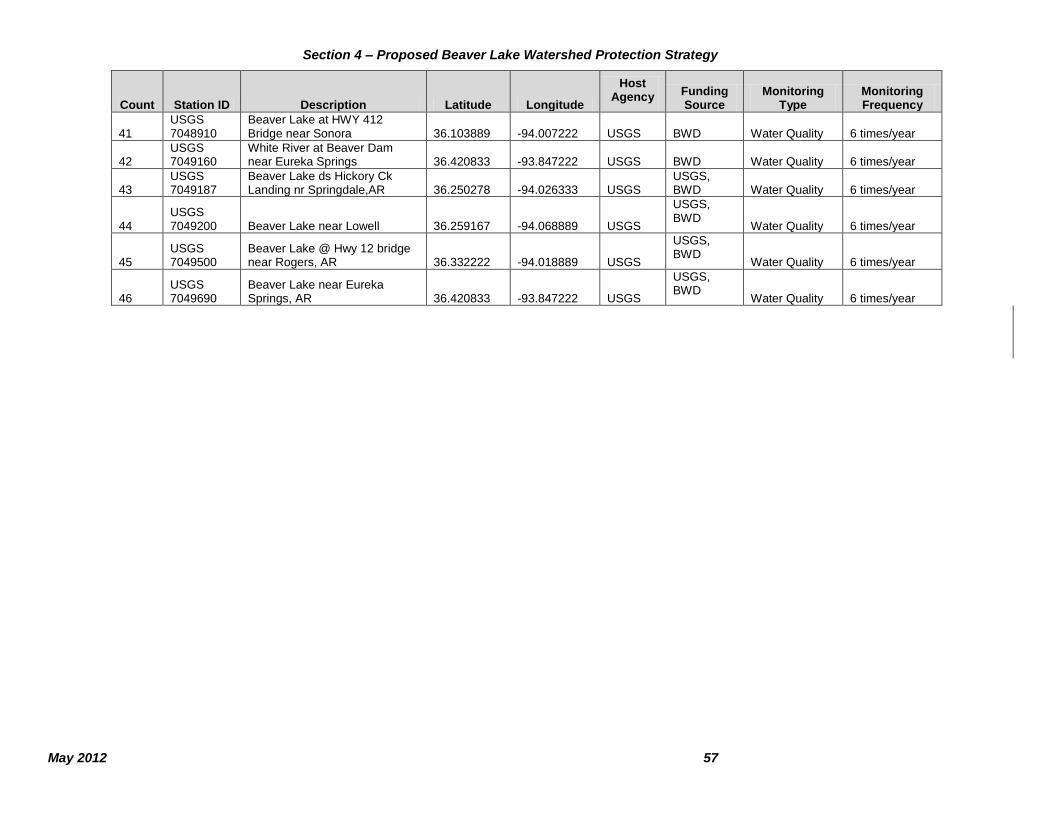
Section 4 – Proposed Beaver Lake Watershed Protection Strategy
May 2012 57
Count Station ID Description Latitude Longitude
Host Agency Funding
Source Monitoring
Type Monitoring Frequency
41 USGS 7048910
Beaver Lake at HWY 412 Bridge near Sonora 36.103889 -94.007222 USGS BWD Water Quality 6 times/year
42 USGS 7049160
White River at Beaver Dam near Eureka Springs 36.420833 -93.847222 USGS BWD Water Quality 6 times/year
43 USGS 7049187
Beaver Lake ds Hickory Ck Landing nr Springdale,AR 36.250278 -94.026333 USGS
USGS, BWD Water Quality 6 times/year
44 USGS 7049200 Beaver Lake near Lowell 36.259167 -94.068889 USGS
USGS, BWD
Water Quality 6 times/year
45 USGS 7049500
Beaver Lake @ Hwy 12 bridge near Rogers, AR 36.332222 -94.018889 USGS
USGS, BWD
Water Quality 6 times/year
46 USGS 7049690
Beaver Lake near Eureka Springs, AR 36.420833 -93.847222 USGS
USGS, BWD
Water Quality 6 times/year
Beaver Lake Watershed Protection Strategy
May 2012 58
A group of experts should be organized to identify other
appropriate monitoring locations, review data on a regular basis,
and develop recommended criteria (as needed to go beyond that
recommended at the Hickory Creek and L3 stations). The group’s
responsibilities would include the determination of appropriate
water quality “triggers” for the mid and lower portions of the lake
(to go along with the benchmarks and targets already
recommended for the upper lake) that would stimulate
implementation of an adapted protection strategy, which could
include enhanced oversight of development projects, advanced
wastewater treatment, and focused promotion of lake-friendly lawn
and property management practices.
It should be noted that in 2008, the Arkansas Department of
Environmental Quality listed the White River, segment 11010001-
27, and the War Eagle Creek, segment 11010001-34, as not
supporting the drinking water supply designated use because of
Beryllium (ADEQ, 2008 Integrated Water Quality Monitoring and
Assessment Report). The White River was previously listed for the
same pollutant in 2004 and 2006. The War Eagle Creek had been
previously listed in 2006. At the time, the source of the Beryllium
was not known. Starting with the 2010, and continuing into the
2012 draft 305(b) report, Beryllium was no longer identified as a
source of impairment for any stream segments tributary to Beaver
Lake. The State continues to monitor stream segments for
Beryllium. Should segments in the Beaver Lake watershed re-
appear on future section 305(b) reports, a management plan for
that pollutant will be developed.
Observational monitoring. Are there increasing frequencies of
algae blooms, sediment plumes, and/or beach closings in the upper
lake and lower lake cove areas? If so, monitoring personnel would
track upstream to identify sources of the problem. Are stream
channels widening and deepening in urbanizing areas and are
sediment islands forming instream? This information would also
be fed into the Watershed Council to determine if the current
protection strategy needs to be adapted.
Programmatic Monitoring for Core BMPs. Are core BMP and
other voluntary participation programs working as anticipated? Are
landowners participating in conservation and stewardship
programs at levels anticipated in the Beaver Lake Watershed
Protection Strategy? Are developers and local governments
participating at a high rate in the Beaver Lake protection efforts,
installing stormwater and channel protection controls on
construction sites and new development areas?
EPA Watershed Management Plan Element I: Monitoring of Implementation Efforts and Their Efficacy
Section 4 – Proposed Beaver Lake Watershed Protection Strategy
May 2012 59
These early warning indicators, used together, would indicate when the
lake’s protection targets are not being met and voluntary efforts are not
sufficient, and determine when the Protection Strategy needs to be
adjusted. These efforts would be part of the Council’s adaptive process for
management of the watershed.
Citizen- and volunteer-level programs may play an increasing role in
water quality monitoring. For example, Beaver Lake Secchi Day, which is
organized by the Beaver Water District, provides invaluable turbidity data
on the lake. It is both an important monitoring tool and community
engagement effort. Furthermore, in 2012 a voluntary citizen science based
monitoring program will launch that will increase the extent and frequency
of water quality monitoring in the Beaver Lake Watershed. This program,
called StreamSmart, was developed by the Beaver Water District,
Audubon Arkansas, and the Arkansas Water Resources Center (AWRC).
The steering committee also includes the newly formed Beaver Watershed
Alliance. The goal of the program is to eventually gather seasonal data on
water quality at an additional 30 locations throughout the watershed.
Citizen volunteers will undergo training and then collect data at
predetermined monitoring sites. Data and samples will be analyzed by the
AWRC. Quality assurance protocols include data quality verification
through random duplicate sampling by the AWRC staff.
Early warning indicators would indicate when the lake’s protection targets are not being met and voluntary efforts are not sufficient, and determine when the Protection Strategy
needs to be adjusted.
May 2012 60
Section 5
5 Implementation Summary
The Protection Strategy is not a new law or regulation. It depends on
enforcing existing regulations and/or voluntary actions hinging on good
stewardship.
5.1 OVERALL PRIORITIZATION OF SUBWATERSHEDS Subwatershed prioritization for sediment, nutrients, and recommended
BMPs has been described above in the Protection Strategy. While it is
clear that partnering organizations will ultimately determine which
subwatersheds they will focus on to meet their own organizational goals,
some overall prioritization of watersheds for work must be established.
The following represents the overall cumulative ranking of subwatersheds
per recommended contaminant and BMP:
1. West Fork and Lower White River subwatersheds
2. Beaver Lake subwatershed
3. War Eagle Creek subwatershed
4. Brush Creek, East Fork, Middle Fork, and Richland Creek
subwatershed
It should be recognized that directing programs and projects along this
overall suggested prioritization should not preclude any organization from
seizing opportunities that may arise (due to funding, emerging needs, or
otherwise).
5.2 IMPLEMENTATION TIMELINE The timeline suggested for implementation of components of this strategy
include short-term (i.e., ~2 year), mid-term (~5-8 year), and longer-term or
ongoing actions. Implementation of the 5 key components of the
Protection Strategy constitute the short-term actions: (1) development of
the Beaver Watershed Alliance; (2) implementation of key best
management practices; (3) creation of a Developer and Contractor Lake
Protection Certification Program; (4) initiation of an educational and
stewardship program; and (5) establishing a monitoring and adaptive
There is much work to do and success will depend on many agencies, community leaders, and
landowners.
EPA Watershed Management Plan Element F & I: NPS Management Measures Implementation Schedule and Milestones – See also Table 5-2.
Section 5 – Implementation Summary
May 2012 61
management program. The formation of and onboarding of staff for the
Beaver Watershed Alliance would be an appropriate beginning milestone
for short-term actions, though this watershed group certainly is not the
only organization that should implement the Protection Strategy.
Mid-term actions will be the further development, refinement, and
operation/maintenance of the 5 key components. Long-term actions will
be the ongoing operation/maintenance of the key components and related
programs as described above, and will also include new programs and
actions, such as monitoring and adapting the stragy.
Table 5-1 provides a snapshot of the key actions recommended in the
Protection Strategy, the potential funding and assistance, who needs to
take the lead, and other groups responsible for implementation. As can be
seen, there is much work to do and success will depend on many agencies,
community leaders, and landowners. Table 5-2 provides an estimated
timeline or schedule for taking action, with shorter-term priority actions
denoted. Implementation capability will depend on many factors,
including available funding and resources and other community priorities
requiring attention. In this regard, this section should be viewed as a
starting point and a guide to help the Beaver Lake Watershed Alliance and
others implementing the Strategy. Estimated timelines are not absolute,
rather based on best available information.
5.3 ADAPTIVE MANAGEMENT Because priorities can and will shift as new data are acquired and new
water quality issues emerge, the Watershed Alliance and partnering
organizations will utilize an adaptive management approach, where the
goals of the organization and programming will be assessed every five
years, approximately. Annual or biannual workplans and program agendas
should be developed and evaluated organizationally. For example, for
each project or program implemented, the Alliance’s staff and Board of
Directors will need to determine success criteria in terms of community
involvement and water quality improvement, and adjust programmatic
goals and focus in the shorter terms. The Beaver Watershed Alliance has
adopted the Protection Strategy and is committed to ongoing review and
updating of the document to ensure long-term relevancy. On a 5-year
basis, the Policy and Technical Advisory Groups should reconvene to
examine and discuss new trends in water quality and to identify emerging
issues on the watershed in order to evaluate and revise the Protection
Strategy. Furthermore, as opportunity or need arises, the Protection
Strategy should be amended through notification and engagement of
Annual work plans should be developed organizationally, and the Watershed Council and its partners will periodically review the key actions and timeline and update them when new information is available and success is achieved.
Implementation capability will depend on many factors, including available funding and resources, and other community priorities
requiring attention.
Beaver Lake Watershed Protection Strategy
May 2012 62
stakeholders and program partners. In summary, this is a living document
that provides a starting point for the long-term protection of Beaver Lake
and the restoration of the West Fork and Lower White rivers. It is
anticipated that the Watershed Council and its partners will review the key
actions and timeline and revise them as new information is available,
experience is gained, and success is achieved.
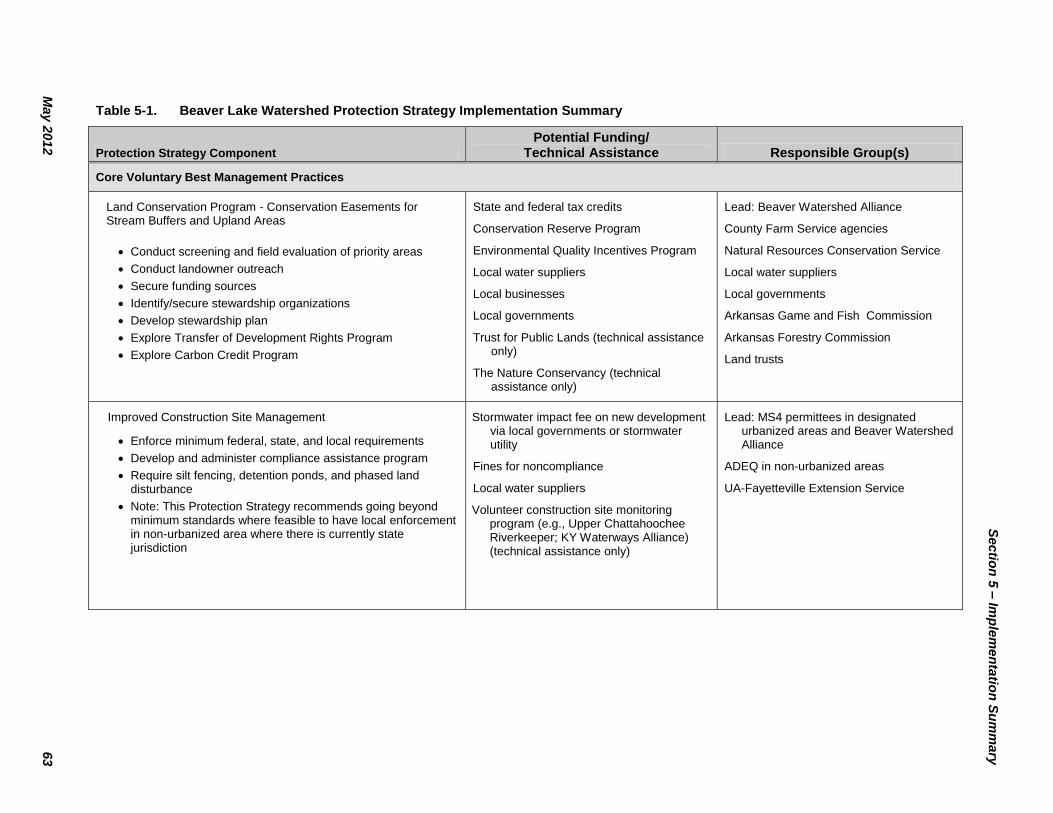
Sectio
n 5
– Im
ple
men
tatio
n S
um
mary
sh
ed
Pro
tectio
n S
trate
gy
May 2
01
2
63
Table 5-1. Beaver Lake Watershed Protection Strategy Implementation Summary
Protection Strategy Component
Potential Funding/ Technical Assistance Responsible Group(s)
Core Voluntary Best Management Practices
Land Conservation Program - Conservation Easements for Stream Buffers and Upland Areas
Conduct screening and field evaluation of priority areas
Conduct landowner outreach
Secure funding sources
Identify/secure stewardship organizations
Develop stewardship plan
Explore Transfer of Development Rights Program
Explore Carbon Credit Program
State and federal tax credits
Conservation Reserve Program
Environmental Quality Incentives Program
Local water suppliers
Local businesses
Local governments
Trust for Public Lands (technical assistance only)
The Nature Conservancy (technical assistance only)
Lead: Beaver Watershed Alliance
County Farm Service agencies
Natural Resources Conservation Service
Local water suppliers
Local governments
Arkansas Game and Fish Commission
Arkansas Forestry Commission
Land trusts
Improved Construction Site Management
Enforce minimum federal, state, and local requirements
Develop and administer compliance assistance program
Require silt fencing, detention ponds, and phased land disturbance
Note: This Protection Strategy recommends going beyond minimum standards where feasible to have local enforcement in non-urbanized area where there is currently state jurisdiction
Stormwater impact fee on new development via local governments or stormwater utility
Fines for noncompliance
Local water suppliers
Volunteer construction site monitoring program (e.g., Upper Chattahoochee Riverkeeper; KY Waterways Alliance) (technical assistance only)
Lead: MS4 permittees in designated urbanized areas and Beaver Watershed Alliance
ADEQ in non-urbanized areas
UA-Fayetteville Extension Service
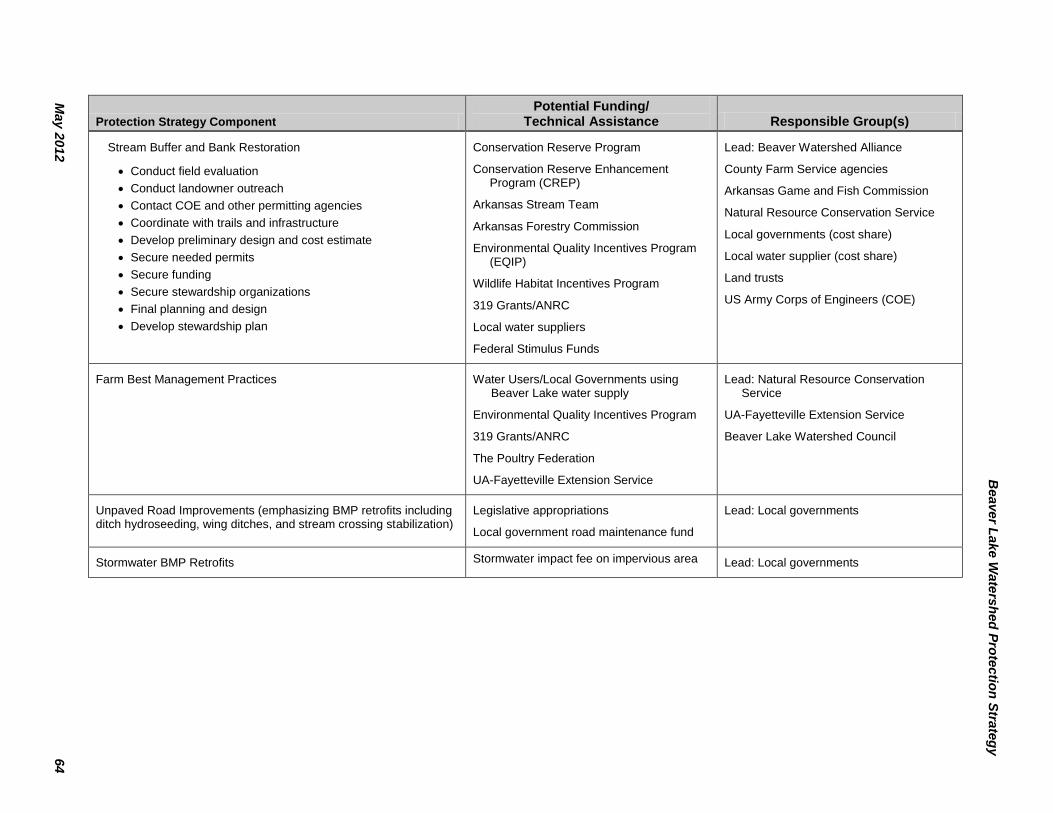
B B
eave
r La
ke W
ate
rsh
ed
Pro
tectio
n S
trate
gy
May 2
01
2
64
Protection Strategy Component
Potential Funding/ Technical Assistance Responsible Group(s)
Stream Buffer and Bank Restoration
Conduct field evaluation
Conduct landowner outreach
Contact COE and other permitting agencies
Coordinate with trails and infrastructure
Develop preliminary design and cost estimate
Secure needed permits
Secure funding
Secure stewardship organizations
Final planning and design
Develop stewardship plan
Conservation Reserve Program
Conservation Reserve Enhancement Program (CREP)
Arkansas Stream Team
Arkansas Forestry Commission
Environmental Quality Incentives Program (EQIP)
Wildlife Habitat Incentives Program
319 Grants/ANRC
Local water suppliers
Federal Stimulus Funds
Lead: Beaver Watershed Alliance
County Farm Service agencies
Arkansas Game and Fish Commission
Natural Resource Conservation Service
Local governments (cost share)
Local water supplier (cost share)
Land trusts
US Army Corps of Engineers (COE)
Farm Best Management Practices Water Users/Local Governments using Beaver Lake water supply
Environmental Quality Incentives Program
319 Grants/ANRC
The Poultry Federation
UA-Fayetteville Extension Service
Lead: Natural Resource Conservation Service
UA-Fayetteville Extension Service
Beaver Lake Watershed Council
Unpaved Road Improvements (emphasizing BMP retrofits including ditch hydroseeding, wing ditches, and stream crossing stabilization)
Legislative appropriations
Local government road maintenance fund
Lead: Local governments
Stormwater BMP Retrofits Stormwater impact fee on impervious area Lead: Local governments
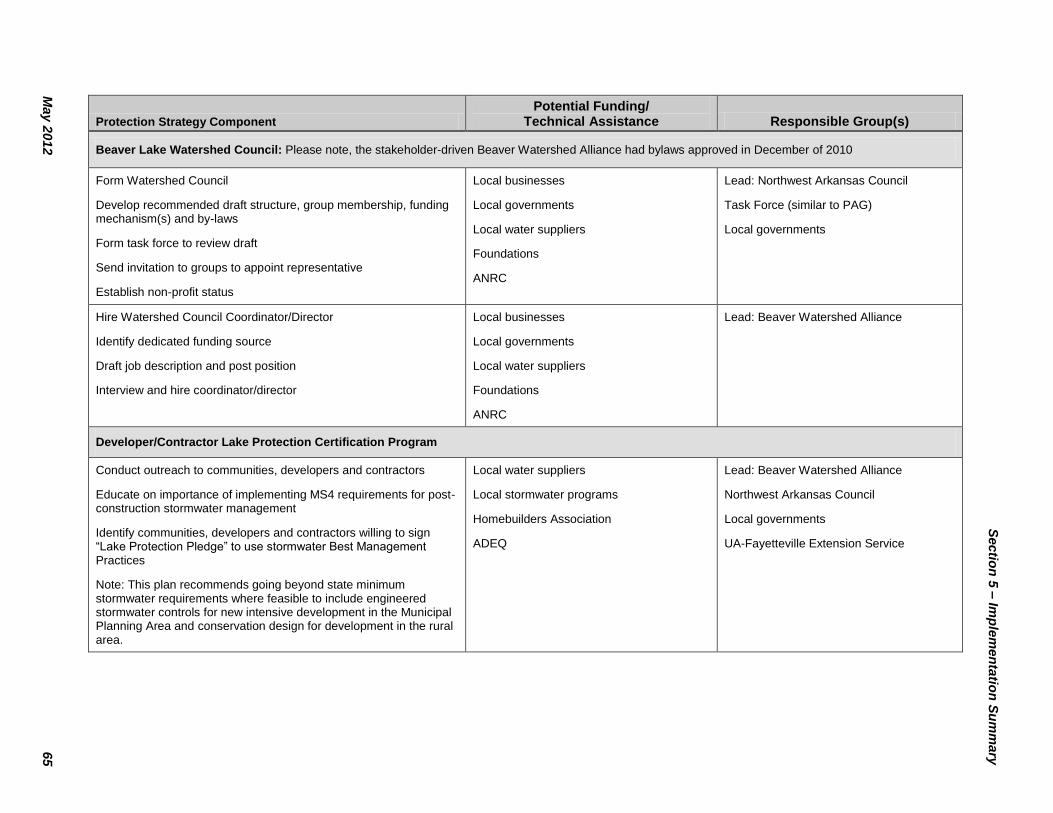
Sectio
n 5
– Im
ple
men
tatio
n S
um
mary
sh
ed
Pro
tectio
n S
trate
gy
May 2
01
2
65
Protection Strategy Component
Potential Funding/ Technical Assistance Responsible Group(s)
Beaver Lake Watershed Council: Please note, the stakeholder-driven Beaver Watershed Alliance had bylaws approved in December of 2010
Form Watershed Council
Develop recommended draft structure, group membership, funding mechanism(s) and by-laws
Form task force to review draft
Send invitation to groups to appoint representative
Establish non-profit status
Local businesses
Local governments
Local water suppliers
Foundations
ANRC
Lead: Northwest Arkansas Council
Task Force (similar to PAG)
Local governments
Hire Watershed Council Coordinator/Director
Identify dedicated funding source
Draft job description and post position
Interview and hire coordinator/director
Local businesses
Local governments
Local water suppliers
Foundations
ANRC
Lead: Beaver Watershed Alliance
Developer/Contractor Lake Protection Certification Program
Conduct outreach to communities, developers and contractors
Educate on importance of implementing MS4 requirements for post-construction stormwater management
Identify communities, developers and contractors willing to sign “Lake Protection Pledge” to use stormwater Best Management Practices
Note: This plan recommends going beyond state minimum stormwater requirements where feasible to include engineered stormwater controls for new intensive development in the Municipal Planning Area and conservation design for development in the rural area.
Local water suppliers
Local stormwater programs
Homebuilders Association
ADEQ
Lead: Beaver Watershed Alliance
Northwest Arkansas Council
Local governments
UA-Fayetteville Extension Service
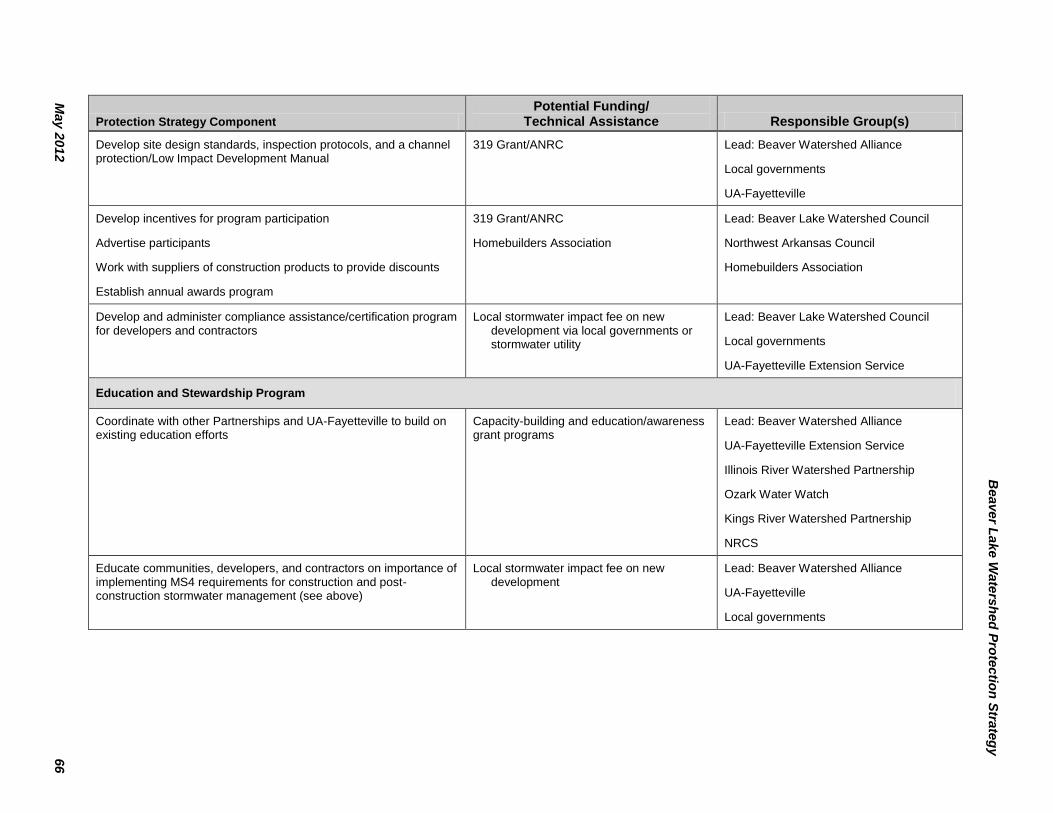
B B
eave
r La
ke W
ate
rsh
ed
Pro
tectio
n S
trate
gy
May 2
01
2
66
Protection Strategy Component
Potential Funding/ Technical Assistance Responsible Group(s)
Develop site design standards, inspection protocols, and a channel protection/Low Impact Development Manual
319 Grant/ANRC Lead: Beaver Watershed Alliance
Local governments
UA-Fayetteville
Develop incentives for program participation
Advertise participants
Work with suppliers of construction products to provide discounts
Establish annual awards program
319 Grant/ANRC
Homebuilders Association
Lead: Beaver Lake Watershed Council
Northwest Arkansas Council
Homebuilders Association
Develop and administer compliance assistance/certification program for developers and contractors
Local stormwater impact fee on new development via local governments or stormwater utility
Lead: Beaver Lake Watershed Council
Local governments
UA-Fayetteville Extension Service
Education and Stewardship Program
Coordinate with other Partnerships and UA-Fayetteville to build on existing education efforts
Capacity-building and education/awareness grant programs
Lead: Beaver Watershed Alliance
UA-Fayetteville Extension Service
Illinois River Watershed Partnership
Ozark Water Watch
Kings River Watershed Partnership
NRCS
Educate communities, developers, and contractors on importance of implementing MS4 requirements for construction and post-construction stormwater management (see above)
Local stormwater impact fee on new development
Lead: Beaver Watershed Alliance
UA-Fayetteville
Local governments
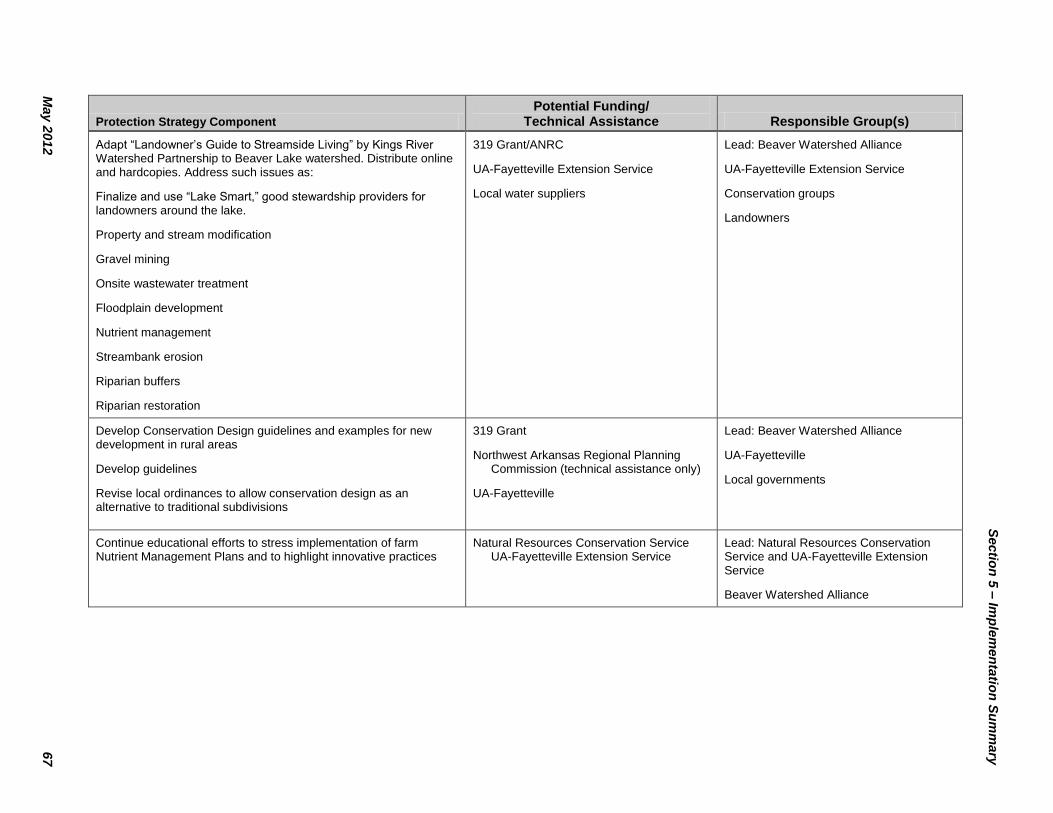
Sectio
n 5
– Im
ple
men
tatio
n S
um
mary
sh
ed
Pro
tectio
n S
trate
gy
May 2
01
2
67
Protection Strategy Component
Potential Funding/ Technical Assistance Responsible Group(s)
Adapt “Landowner’s Guide to Streamside Living” by Kings River Watershed Partnership to Beaver Lake watershed. Distribute online and hardcopies. Address such issues as:
Finalize and use “Lake Smart,” good stewardship providers for landowners around the lake.
Property and stream modification
Gravel mining
Onsite wastewater treatment
Floodplain development
Nutrient management
Streambank erosion
Riparian buffers
Riparian restoration
319 Grant/ANRC
UA-Fayetteville Extension Service
Local water suppliers
Lead: Beaver Watershed Alliance
UA-Fayetteville Extension Service
Conservation groups
Landowners
Develop Conservation Design guidelines and examples for new development in rural areas
Develop guidelines
Revise local ordinances to allow conservation design as an alternative to traditional subdivisions
319 Grant
Northwest Arkansas Regional Planning Commission (technical assistance only)
UA-Fayetteville
Lead: Beaver Watershed Alliance
UA-Fayetteville
Local governments
Continue educational efforts to stress implementation of farm Nutrient Management Plans and to highlight innovative practices
Natural Resources Conservation Service UA-Fayetteville Extension Service
Lead: Natural Resources Conservation Service and UA-Fayetteville Extension Service
Beaver Watershed Alliance
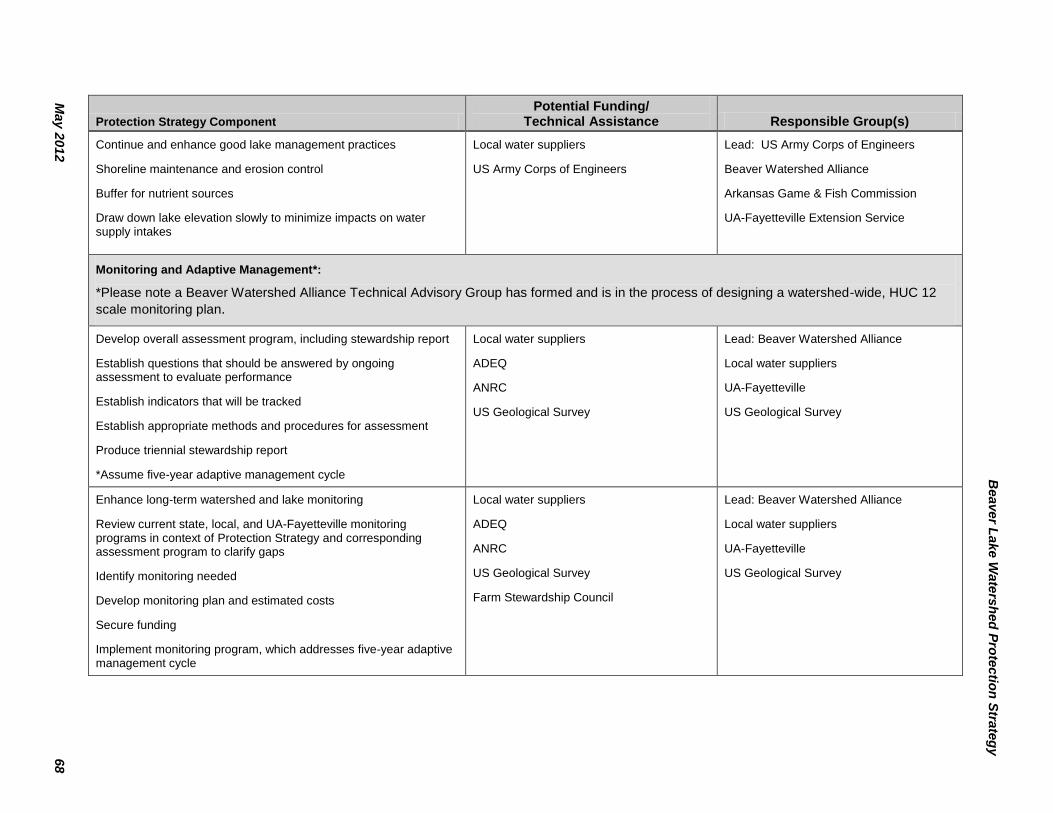
B B
eave
r La
ke W
ate
rsh
ed
Pro
tectio
n S
trate
gy
May 2
01
2
68
Protection Strategy Component
Potential Funding/ Technical Assistance Responsible Group(s)
Continue and enhance good lake management practices
Shoreline maintenance and erosion control
Buffer for nutrient sources
Draw down lake elevation slowly to minimize impacts on water supply intakes
Local water suppliers
US Army Corps of Engineers
Lead: US Army Corps of Engineers
Beaver Watershed Alliance
Arkansas Game & Fish Commission
UA-Fayetteville Extension Service
Monitoring and Adaptive Management*:
*Please note a Beaver Watershed Alliance Technical Advisory Group has formed and is in the process of designing a watershed-wide, HUC 12
scale monitoring plan.
Develop overall assessment program, including stewardship report
Establish questions that should be answered by ongoing assessment to evaluate performance
Establish indicators that will be tracked
Establish appropriate methods and procedures for assessment
Produce triennial stewardship report
*Assume five-year adaptive management cycle
Local water suppliers
ADEQ
ANRC
US Geological Survey
Lead: Beaver Watershed Alliance
Local water suppliers
UA-Fayetteville
US Geological Survey
Enhance long-term watershed and lake monitoring
Review current state, local, and UA-Fayetteville monitoring programs in context of Protection Strategy and corresponding assessment program to clarify gaps
Identify monitoring needed
Develop monitoring plan and estimated costs
Secure funding
Implement monitoring program, which addresses five-year adaptive management cycle
Local water suppliers
ADEQ
ANRC
US Geological Survey
Farm Stewardship Council
Lead: Beaver Watershed Alliance
Local water suppliers
UA-Fayetteville
US Geological Survey
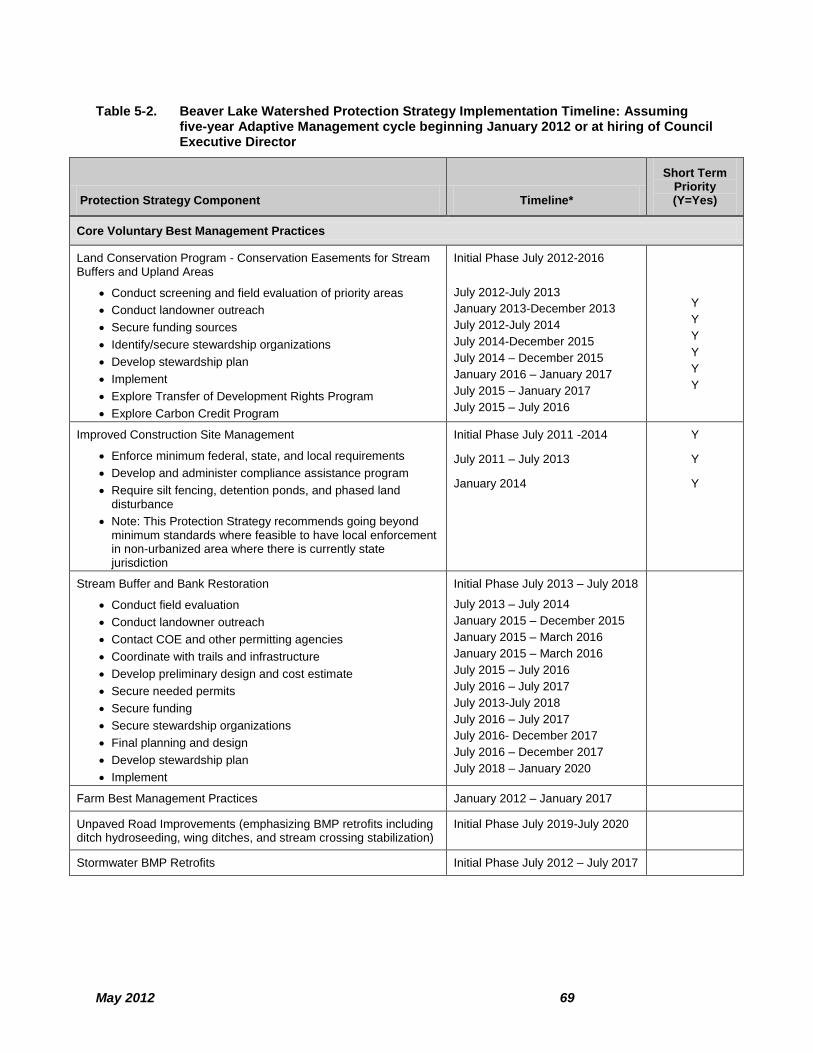
May 2012 69
Table 5-2. Beaver Lake Watershed Protection Strategy Implementation Timeline: Assuming five-year Adaptive Management cycle beginning January 2012 or at hiring of Council Executive Director
Protection Strategy Component Timeline*
Short Term Priority (Y=Yes)
Core Voluntary Best Management Practices
Land Conservation Program - Conservation Easements for Stream Buffers and Upland Areas
Conduct screening and field evaluation of priority areas
Conduct landowner outreach
Secure funding sources
Identify/secure stewardship organizations
Develop stewardship plan
Implement
Explore Transfer of Development Rights Program
Explore Carbon Credit Program
Initial Phase July 2012-2016
July 2012-July 2013
January 2013-December 2013
July 2012-July 2014
July 2014-December 2015
July 2014 – December 2015
January 2016 – January 2017
July 2015 – January 2017
July 2015 – July 2016
Y
Y
Y
Y
Y
Y
Improved Construction Site Management
Enforce minimum federal, state, and local requirements
Develop and administer compliance assistance program
Require silt fencing, detention ponds, and phased land disturbance
Note: This Protection Strategy recommends going beyond minimum standards where feasible to have local enforcement in non-urbanized area where there is currently state jurisdiction
Initial Phase July 2011 -2014
July 2011 – July 2013
January 2014
Y
Y
Y
Stream Buffer and Bank Restoration
Conduct field evaluation
Conduct landowner outreach
Contact COE and other permitting agencies
Coordinate with trails and infrastructure
Develop preliminary design and cost estimate
Secure needed permits
Secure funding
Secure stewardship organizations
Final planning and design
Develop stewardship plan
Implement
Initial Phase July 2013 – July 2018
July 2013 – July 2014
January 2015 – December 2015
January 2015 – March 2016
January 2015 – March 2016
July 2015 – July 2016
July 2016 – July 2017
July 2013-July 2018
July 2016 – July 2017
July 2016- December 2017
July 2016 – December 2017
July 2018 – January 2020
Farm Best Management Practices January 2012 – January 2017
Unpaved Road Improvements (emphasizing BMP retrofits including ditch hydroseeding, wing ditches, and stream crossing stabilization)
Initial Phase July 2019-July 2020
Stormwater BMP Retrofits Initial Phase July 2012 – July 2017
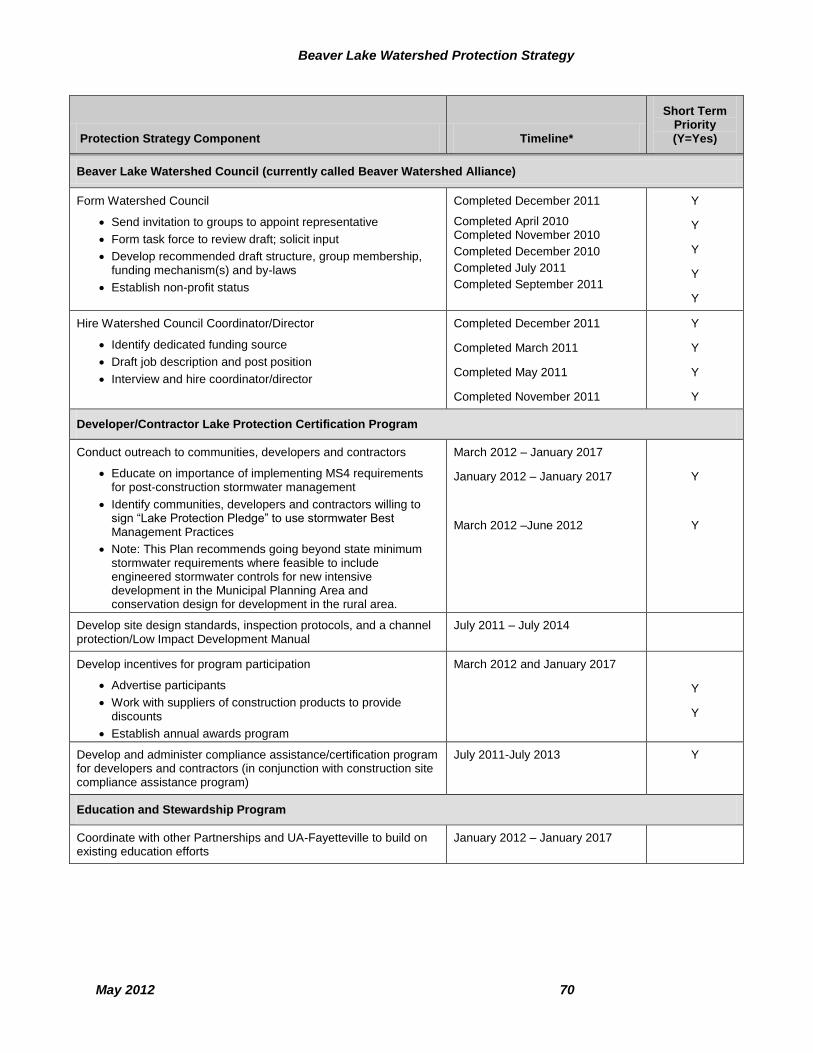
Beaver Lake Watershed Protection Strategy
May 2012 70
B B
eave
r La
ke W
ate
rsh
ed
Pro
tectio
n S
trate
gy
Protection Strategy Component Timeline*
Short Term Priority (Y=Yes)
Beaver Lake Watershed Council (currently called Beaver Watershed Alliance)
Form Watershed Council
Send invitation to groups to appoint representative
Form task force to review draft; solicit input
Develop recommended draft structure, group membership, funding mechanism(s) and by-laws
Establish non-profit status
Completed December 2011
Completed April 2010 Completed November 2010
Completed December 2010
Completed July 2011
Completed September 2011
Y
Y
Y
Y
Y
Hire Watershed Council Coordinator/Director
Identify dedicated funding source
Draft job description and post position
Interview and hire coordinator/director
Completed December 2011
Completed March 2011
Completed May 2011
Completed November 2011
Y
Y
Y
Y
Developer/Contractor Lake Protection Certification Program
Conduct outreach to communities, developers and contractors
Educate on importance of implementing MS4 requirements for post-construction stormwater management
Identify communities, developers and contractors willing to sign “Lake Protection Pledge” to use stormwater Best Management Practices
Note: This Plan recommends going beyond state minimum stormwater requirements where feasible to include engineered stormwater controls for new intensive development in the Municipal Planning Area and conservation design for development in the rural area.
March 2012 – January 2017
January 2012 – January 2017
March 2012 –June 2012
Y
Y
Develop site design standards, inspection protocols, and a channel protection/Low Impact Development Manual
July 2011 – July 2014
Develop incentives for program participation
Advertise participants
Work with suppliers of construction products to provide discounts
Establish annual awards program
March 2012 and January 2017
Y
Y
Develop and administer compliance assistance/certification program for developers and contractors (in conjunction with construction site compliance assistance program)
July 2011-July 2013 Y
Education and Stewardship Program
Coordinate with other Partnerships and UA-Fayetteville to build on existing education efforts
January 2012 – January 2017

May 2012 71
Protection Strategy Component Timeline*
Short Term Priority (Y=Yes)
Educate communities, developers, and contractors on importance of implementing MS4 requirements for construction and post-construction stormwater management (see above)
January 2012 – January 2017
Education and Stewardship Program (con’t.)
Adapt “Landowner’s Guide to Streamside Living” by Kings River Watershed Partnership to Beaver Lake watershed. Distribute online and hardcopies. Address such issues as:
Property and stream modification
Gravel mining
Onsite wastewater treatment
Floodplain development
Nutrient management
Streambank erosion
Riparian buffers
Riparian restoration
July 2012 – December 2012
Develop Conservation Design guidelines and examples for new development in rural areas
Develop guidelines
Revise local ordinances to allow conservation design as an alternative to traditional subdivisions
July 2014- July 2017
Continue educational efforts to stress implementation of Nutrient Management Plans and to highlight innovative practices
January 2012 – January 2017 Y
Continue and enhance good lake management practices
Shoreline maintenance and erosion control
Buffer for nutrient sources
Draw down lake elevation slowly to minimize impacts on water supply intakes
January 2012 – January 2017
Monitoring and Adaptive Management
Develop overall assessment program, including stewardship report
Establish questions that should be answered by ongoing assessment to evaluate performance
Establish indicators that will be tracked
Establish appropriate methods and procedures for assessment
Produce triennial stewardship report
Initial Phase March 2012- July 2014
March 2012 – July 2013
March 2012 – July 2013
January 2013 – July 2013
July 2013-July 2014
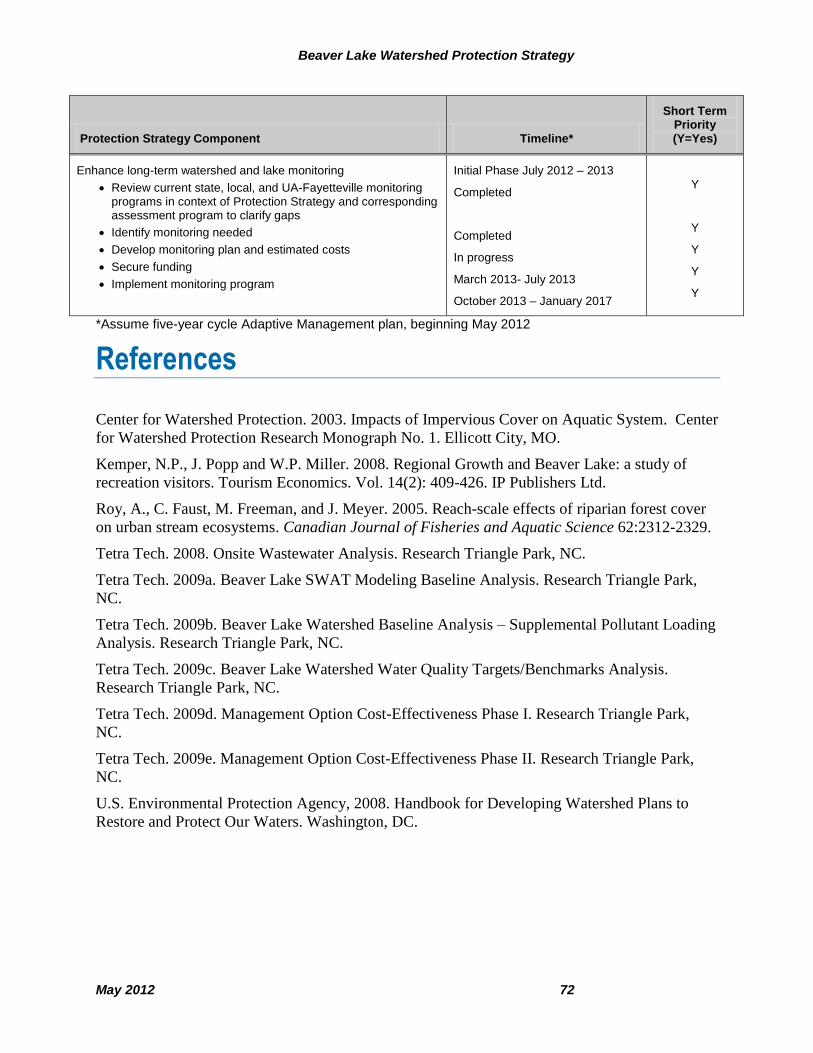
Beaver Lake Watershed Protection Strategy
May 2012 72
B B
eave
r La
ke W
ate
rsh
ed
Pro
tectio
n S
trate
gy
Protection Strategy Component Timeline*
Short Term Priority (Y=Yes)
Enhance long-term watershed and lake monitoring
Review current state, local, and UA-Fayetteville monitoring programs in context of Protection Strategy and corresponding assessment program to clarify gaps
Identify monitoring needed
Develop monitoring plan and estimated costs
Secure funding
Implement monitoring program
Initial Phase July 2012 – 2013
Completed
Completed
In progress
March 2013- July 2013
October 2013 – January 2017
Y
Y
Y
Y
Y
*Assume five-year cycle Adaptive Management plan, beginning May 2012
References
Center for Watershed Protection. 2003. Impacts of Impervious Cover on Aquatic System. Center
for Watershed Protection Research Monograph No. 1. Ellicott City, MO.
Kemper, N.P., J. Popp and W.P. Miller. 2008. Regional Growth and Beaver Lake: a study of
recreation visitors. Tourism Economics. Vol. 14(2): 409-426. IP Publishers Ltd.
Roy, A., C. Faust, M. Freeman, and J. Meyer. 2005. Reach-scale effects of riparian forest cover
on urban stream ecosystems. Canadian Journal of Fisheries and Aquatic Science 62:2312-2329.
Tetra Tech. 2008. Onsite Wastewater Analysis. Research Triangle Park, NC.
Tetra Tech. 2009a. Beaver Lake SWAT Modeling Baseline Analysis. Research Triangle Park,
NC.
Tetra Tech. 2009b. Beaver Lake Watershed Baseline Analysis – Supplemental Pollutant Loading
Analysis. Research Triangle Park, NC.
Tetra Tech. 2009c. Beaver Lake Watershed Water Quality Targets/Benchmarks Analysis.
Research Triangle Park, NC.
Tetra Tech. 2009d. Management Option Cost-Effectiveness Phase I. Research Triangle Park,
NC.
Tetra Tech. 2009e. Management Option Cost-Effectiveness Phase II. Research Triangle Park,
NC.
U.S. Environmental Protection Agency, 2008. Handbook for Developing Watershed Plans to
Restore and Protect Our Waters. Washington, DC.

May 2012 73
(This page left intentionally blank.)

September 2009 A-1
Appendix A. BMP Cost and Cost Effectiveness
EPA Watershed Management Plan Element D: Estimates of Technical/Financial Costs of Implementations – See Table A-1-9

Beaver Lake Watershed Protection Strategy
May 2012 A-2
B B
eave
r La
ke W
ate
rsh
ed
Pro
tectio
n S
trate
gy
(This page left intentionally blank.)
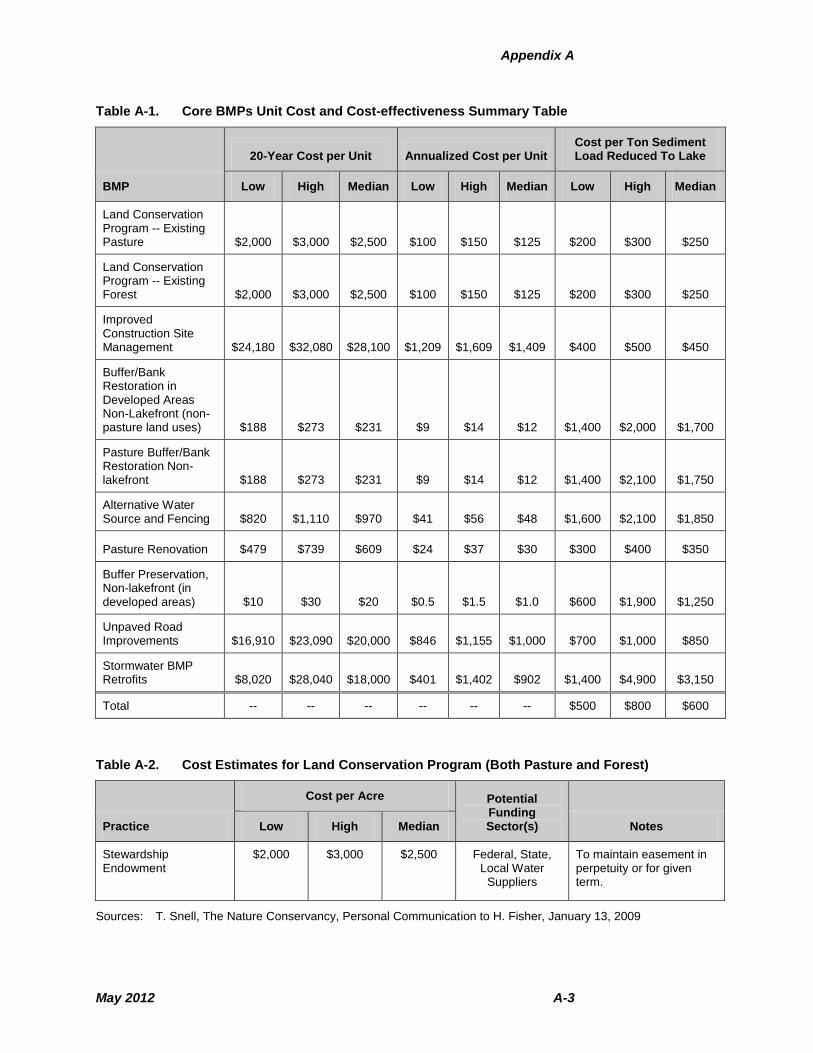
Appendix A
May 2012 A-3
Table A-1. Core BMPs Unit Cost and Cost-effectiveness Summary Table
BMP
20-Year Cost per Unit Annualized Cost per Unit Cost per Ton Sediment Load Reduced To Lake
Low High Median Low High Median Low High Median
Land Conservation Program -- Existing Pasture $2,000 $3,000 $2,500 $100 $150 $125 $200 $300 $250
Land Conservation Program -- Existing Forest $2,000 $3,000 $2,500 $100 $150 $125 $200 $300 $250
Improved Construction Site Management $24,180 $32,080 $28,100 $1,209 $1,609 $1,409 $400 $500 $450
Buffer/Bank Restoration in Developed Areas Non-Lakefront (non-pasture land uses) $188 $273 $231 $9 $14 $12 $1,400 $2,000 $1,700
Pasture Buffer/Bank Restoration Non-lakefront $188 $273 $231 $9 $14 $12 $1,400 $2,100 $1,750
Alternative Water Source and Fencing $820 $1,110 $970 $41 $56 $48 $1,600 $2,100 $1,850
Pasture Renovation $479 $739 $609 $24 $37 $30 $300 $400 $350
Buffer Preservation, Non-lakefront (in developed areas) $10 $30 $20 $0.5 $1.5 $1.0 $600 $1,900 $1,250
Unpaved Road Improvements $16,910 $23,090 $20,000 $846 $1,155 $1,000 $700 $1,000 $850
Stormwater BMP Retrofits $8,020 $28,040 $18,000 $401 $1,402 $902 $1,400 $4,900 $3,150
Total -- -- -- -- -- -- $500 $800 $600
Table A-2. Cost Estimates for Land Conservation Program (Both Pasture and Forest)
Practice
Cost per Acre Potential Funding Sector(s) Notes Low High Median
Stewardship Endowment
$2,000 $3,000 $2,500 Federal, State, Local Water
Suppliers
To maintain easement in perpetuity or for given term.
Sources: T. Snell, The Nature Conservancy, Personal Communication to H. Fisher, January 13, 2009
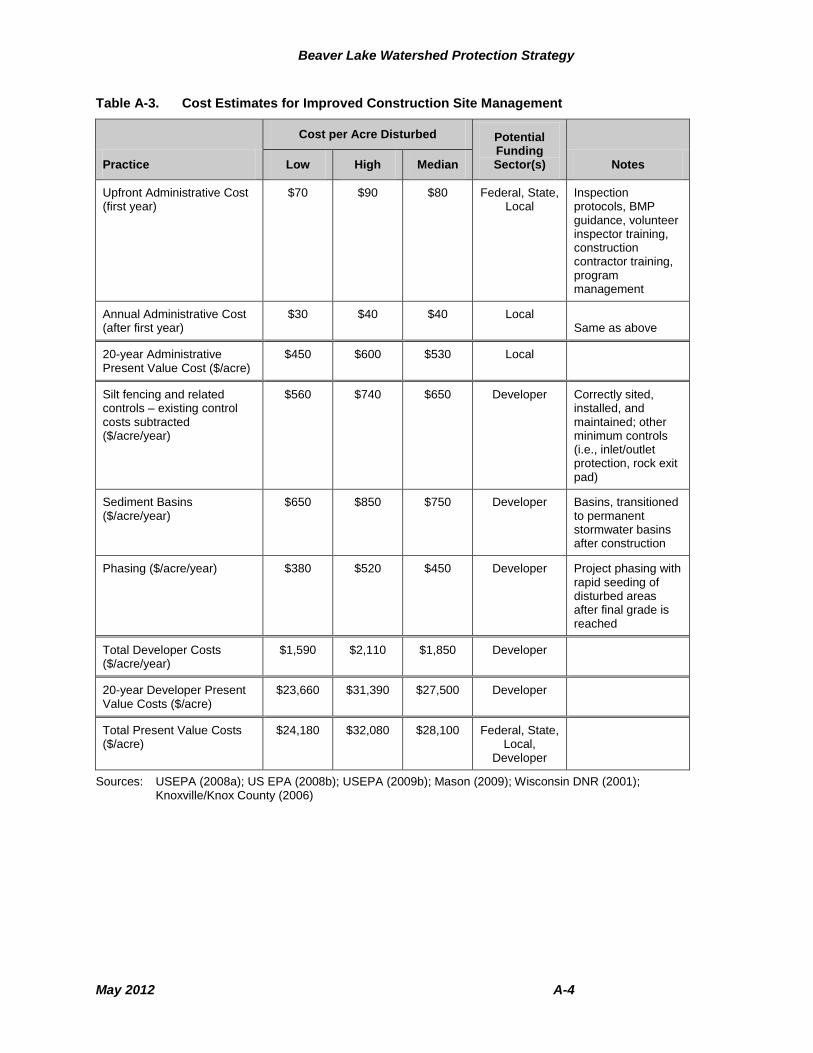
Beaver Lake Watershed Protection Strategy
May 2012 A-4
B B
eave
r La
ke W
ate
rsh
ed
Pro
tectio
n S
trate
gy
Table A-3. Cost Estimates for Improved Construction Site Management
Practice
Cost per Acre Disturbed Potential Funding Sector(s) Notes Low High Median
Upfront Administrative Cost (first year)
$70 $90 $80 Federal, State, Local
Inspection protocols, BMP guidance, volunteer inspector training, construction contractor training, program management
Annual Administrative Cost (after first year)
$30 $40 $40 Local Same as above
20-year Administrative Present Value Cost ($/acre)
$450 $600 $530 Local
Silt fencing and related controls – existing control costs subtracted ($/acre/year)
$560 $740 $650 Developer Correctly sited, installed, and maintained; other minimum controls (i.e., inlet/outlet protection, rock exit pad)
Sediment Basins ($/acre/year)
$650 $850 $750 Developer Basins, transitioned to permanent stormwater basins after construction
Phasing ($/acre/year) $380 $520 $450 Developer Project phasing with rapid seeding of disturbed areas after final grade is reached
Total Developer Costs ($/acre/year)
$1,590 $2,110 $1,850 Developer
20-year Developer Present Value Costs ($/acre)
$23,660 $31,390 $27,500 Developer
Total Present Value Costs ($/acre)
$24,180 $32,080 $28,100 Federal, State, Local,
Developer
Sources: USEPA (2008a); US EPA (2008b); USEPA (2009b); Mason (2009); Wisconsin DNR (2001); Knoxville/Knox County (2006)

Appendix A
May 2012 A-5
Table A-4. Buffer and Bank Restoration Cost Estimates (Both Pasture and Non-Pasture)
Practice
Cost per Foot Potential Funding Sector(s) Notes Low High Median
Upfront cost of streambank and buffer restoration
$160 $220 $190 Federal, state, local water suppliers
50-ft buffer, both sides of stream
Upfront cost of conservation easement, lakefront
$29 $78 $54 Federal, state, local water suppliers
Property is on or within view of Beaver Lake
Upfront cost of conservation easement, non-lakefront
$5 $23 $14 Federal, state, local water suppliers
Property is not within view of Beaver Lake
Monitoring Endowment
$18 $23 $21 Federal, state, local water suppliers
Monitoring should occur annually during the first five years following restoration
Stewardship Endowment
$5 $7 $6 Federal, state, local water suppliers
To maintain easement in perpetuity
Total Upfront Cost, lakefront
$212 $328 $270 Federal, state, local water suppliers
Total Upfront Cost, non-lakefront
$188 $273 $231 Federal, state, local water suppliers
Sources: AFC (2008), Faucette Real Estate (2009); NCEEP (2004);
David Evans, Arkansas Game and Fish Commission, Region 1 Stream Team, personal communication to H. Fisher, January and February 2009;
T. Heisel, Ozark Regional Land Trust, Inc., Personal Communication to H. Fisher, October 13, 2008;
T. Snell, The Nature Conservancy, Personal Communication to H. Fisher, January 13, 2009.
Table A-5. Cost Estimates for Pasture Alternative Water Source and Fencing
Practice
Cost per Acre Potential Funding Sector(s) Notes Low High Median
Paddock Fencing $30 $40 $35 Federal, State,
Farmer
2 strand electric fencing, including fencing, energizer, and gate
Water Development $480 $650 $565 Federal, State,
Farmer
Well, pump, wellhead protection, piping, gravel pad, geotextile, tank and trough system
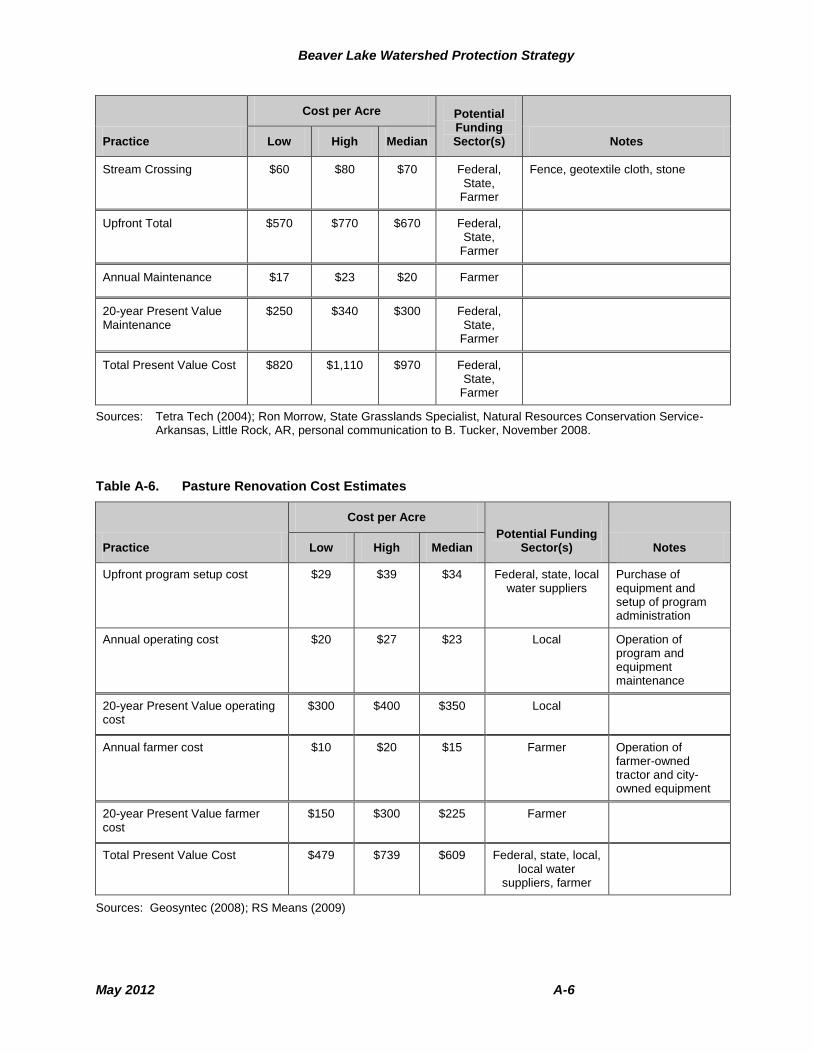
Beaver Lake Watershed Protection Strategy
May 2012 A-6
B B
eave
r La
ke W
ate
rsh
ed
Pro
tectio
n S
trate
gy
Practice
Cost per Acre Potential Funding Sector(s) Notes Low High Median
Stream Crossing $60 $80 $70 Federal, State,
Farmer
Fence, geotextile cloth, stone
Upfront Total $570 $770 $670 Federal, State,
Farmer
Annual Maintenance $17 $23 $20 Farmer
20-year Present Value Maintenance
$250 $340 $300 Federal, State,
Farmer
Total Present Value Cost $820 $1,110 $970 Federal, State,
Farmer
Sources: Tetra Tech (2004); Ron Morrow, State Grasslands Specialist, Natural Resources Conservation Service-Arkansas, Little Rock, AR, personal communication to B. Tucker, November 2008.
Table A-6. Pasture Renovation Cost Estimates
Practice
Cost per Acre
Potential Funding Sector(s) Notes Low High Median
Upfront program setup cost $29 $39 $34 Federal, state, local water suppliers
Purchase of equipment and setup of program administration
Annual operating cost $20 $27 $23 Local Operation of program and equipment maintenance
20-year Present Value operating cost
$300 $400 $350 Local
Annual farmer cost $10 $20 $15 Farmer Operation of farmer-owned tractor and city-owned equipment
20-year Present Value farmer cost
$150 $300 $225 Farmer
Total Present Value Cost $479 $739 $609 Federal, state, local, local water
suppliers, farmer
Sources: Geosyntec (2008); RS Means (2009)
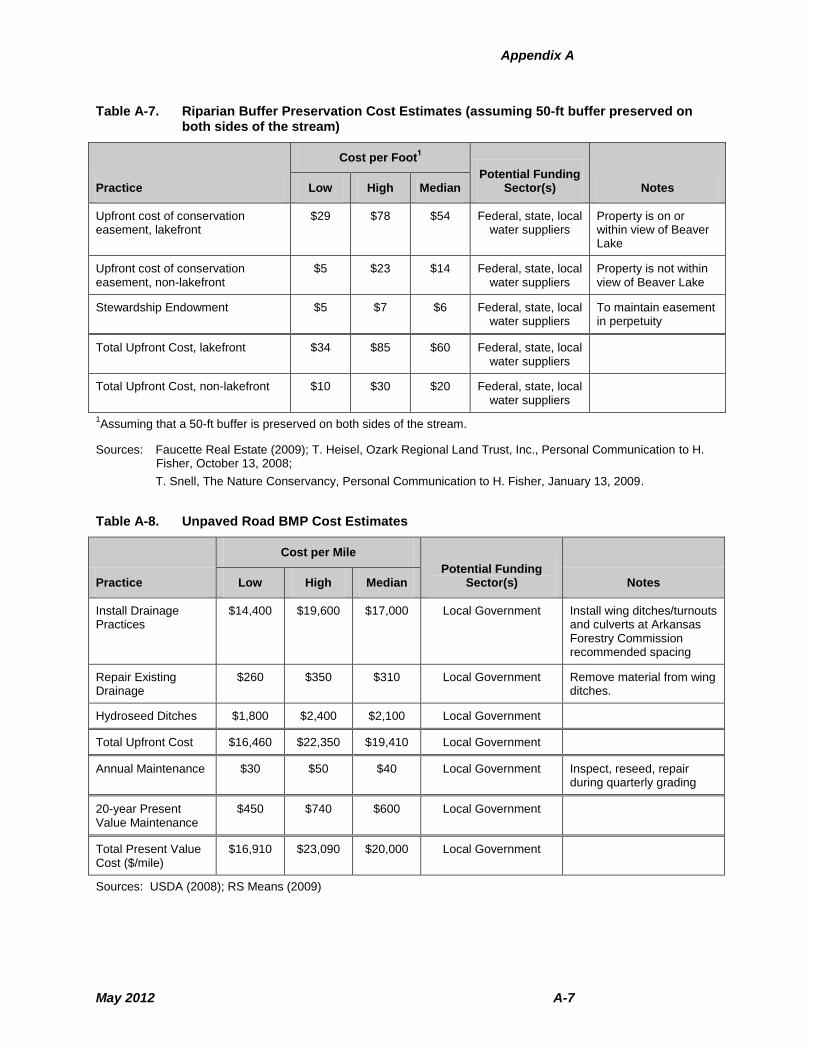
Appendix A
May 2012 A-7
Table A-7. Riparian Buffer Preservation Cost Estimates (assuming 50-ft buffer preserved on both sides of the stream)
Practice
Cost per Foot1
Potential Funding Sector(s) Notes Low High Median
Upfront cost of conservation easement, lakefront
$29 $78 $54 Federal, state, local water suppliers
Property is on or within view of Beaver Lake
Upfront cost of conservation easement, non-lakefront
$5 $23 $14 Federal, state, local water suppliers
Property is not within view of Beaver Lake
Stewardship Endowment $5 $7 $6 Federal, state, local water suppliers
To maintain easement in perpetuity
Total Upfront Cost, lakefront $34 $85 $60 Federal, state, local water suppliers
Total Upfront Cost, non-lakefront $10 $30 $20 Federal, state, local water suppliers
1Assuming that a 50-ft buffer is preserved on both sides of the stream.
Sources: Faucette Real Estate (2009); T. Heisel, Ozark Regional Land Trust, Inc., Personal Communication to H. Fisher, October 13, 2008;
T. Snell, The Nature Conservancy, Personal Communication to H. Fisher, January 13, 2009.
Table A-8. Unpaved Road BMP Cost Estimates
Practice
Cost per Mile
Potential Funding Sector(s) Notes Low High Median
Install Drainage Practices
$14,400 $19,600 $17,000 Local Government Install wing ditches/turnouts and culverts at Arkansas Forestry Commission recommended spacing
Repair Existing Drainage
$260 $350 $310 Local Government Remove material from wing ditches.
Hydroseed Ditches $1,800 $2,400 $2,100 Local Government
Total Upfront Cost $16,460 $22,350 $19,410 Local Government
Annual Maintenance $30 $50 $40 Local Government Inspect, reseed, repair during quarterly grading
20-year Present Value Maintenance
$450 $740 $600 Local Government
Total Present Value Cost ($/mile)
$16,910 $23,090 $20,000 Local Government
Sources: USDA (2008); RS Means (2009)
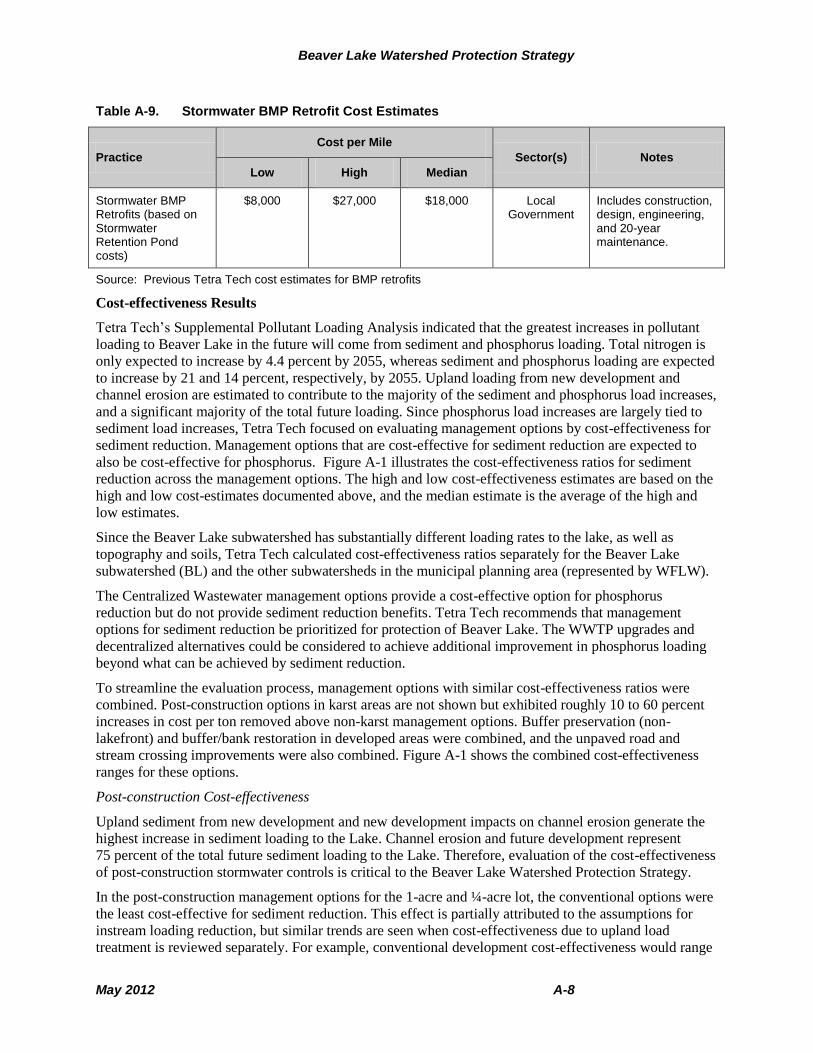
Beaver Lake Watershed Protection Strategy
May 2012 A-8
B B
eave
r La
ke W
ate
rsh
ed
Pro
tectio
n S
trate
gy
Table A-9. Stormwater BMP Retrofit Cost Estimates
Practice
Cost per Mile
Sector(s) Notes
Low High Median
Stormwater BMP Retrofits (based on Stormwater Retention Pond costs)
$8,000 $27,000 $18,000 Local Government
Includes construction, design, engineering, and 20-year maintenance.
Source: Previous Tetra Tech cost estimates for BMP retrofits
Cost-effectiveness Results
Tetra Tech’s Supplemental Pollutant Loading Analysis indicated that the greatest increases in pollutant
loading to Beaver Lake in the future will come from sediment and phosphorus loading. Total nitrogen is
only expected to increase by 4.4 percent by 2055, whereas sediment and phosphorus loading are expected
to increase by 21 and 14 percent, respectively, by 2055. Upland loading from new development and
channel erosion are estimated to contribute to the majority of the sediment and phosphorus load increases,
and a significant majority of the total future loading. Since phosphorus load increases are largely tied to
sediment load increases, Tetra Tech focused on evaluating management options by cost-effectiveness for
sediment reduction. Management options that are cost-effective for sediment reduction are expected to
also be cost-effective for phosphorus. Figure A-1 illustrates the cost-effectiveness ratios for sediment
reduction across the management options. The high and low cost-effectiveness estimates are based on the
high and low cost-estimates documented above, and the median estimate is the average of the high and
low estimates.
Since the Beaver Lake subwatershed has substantially different loading rates to the lake, as well as
topography and soils, Tetra Tech calculated cost-effectiveness ratios separately for the Beaver Lake
subwatershed (BL) and the other subwatersheds in the municipal planning area (represented by WFLW).
The Centralized Wastewater management options provide a cost-effective option for phosphorus
reduction but do not provide sediment reduction benefits. Tetra Tech recommends that management
options for sediment reduction be prioritized for protection of Beaver Lake. The WWTP upgrades and
decentralized alternatives could be considered to achieve additional improvement in phosphorus loading
beyond what can be achieved by sediment reduction.
To streamline the evaluation process, management options with similar cost-effectiveness ratios were
combined. Post-construction options in karst areas are not shown but exhibited roughly 10 to 60 percent
increases in cost per ton removed above non-karst management options. Buffer preservation (non-
lakefront) and buffer/bank restoration in developed areas were combined, and the unpaved road and
stream crossing improvements were also combined. Figure A-1 shows the combined cost-effectiveness
ranges for these options.
Post-construction Cost-effectiveness
Upland sediment from new development and new development impacts on channel erosion generate the
highest increase in sediment loading to the Lake. Channel erosion and future development represent
75 percent of the total future sediment loading to the Lake. Therefore, evaluation of the cost-effectiveness
of post-construction stormwater controls is critical to the Beaver Lake Watershed Protection Strategy.
In the post-construction management options for the 1-acre and ¼-acre lot, the conventional options were
the least cost-effective for sediment reduction. This effect is partially attributed to the assumptions for
instream loading reduction, but similar trends are seen when cost-effectiveness due to upland load
treatment is reviewed separately. For example, conventional development cost-effectiveness would range
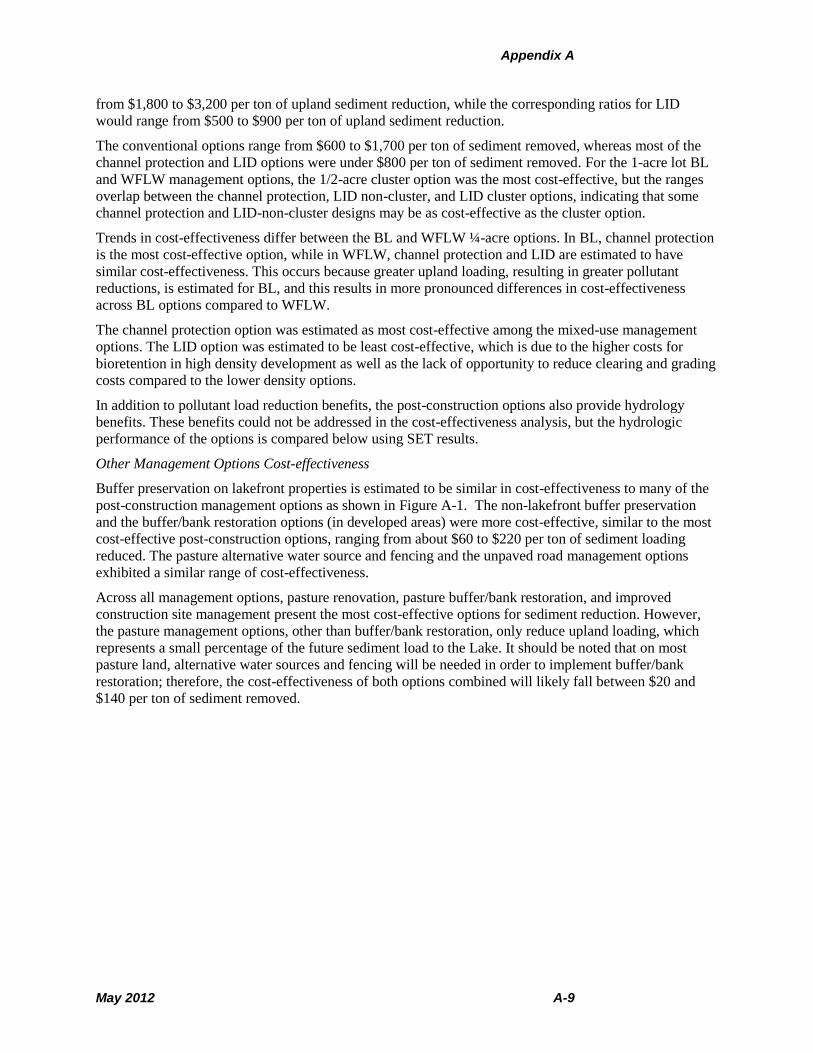
Appendix A
May 2012 A-9
from $1,800 to $3,200 per ton of upland sediment reduction, while the corresponding ratios for LID
would range from $500 to $900 per ton of upland sediment reduction.
The conventional options range from $600 to $1,700 per ton of sediment removed, whereas most of the
channel protection and LID options were under $800 per ton of sediment removed. For the 1-acre lot BL
and WFLW management options, the 1/2-acre cluster option was the most cost-effective, but the ranges
overlap between the channel protection, LID non-cluster, and LID cluster options, indicating that some
channel protection and LID-non-cluster designs may be as cost-effective as the cluster option.
Trends in cost-effectiveness differ between the BL and WFLW ¼-acre options. In BL, channel protection
is the most cost-effective option, while in WFLW, channel protection and LID are estimated to have
similar cost-effectiveness. This occurs because greater upland loading, resulting in greater pollutant
reductions, is estimated for BL, and this results in more pronounced differences in cost-effectiveness
across BL options compared to WFLW.
The channel protection option was estimated as most cost-effective among the mixed-use management
options. The LID option was estimated to be least cost-effective, which is due to the higher costs for
bioretention in high density development as well as the lack of opportunity to reduce clearing and grading
costs compared to the lower density options.
In addition to pollutant load reduction benefits, the post-construction options also provide hydrology
benefits. These benefits could not be addressed in the cost-effectiveness analysis, but the hydrologic
performance of the options is compared below using SET results.
Other Management Options Cost-effectiveness
Buffer preservation on lakefront properties is estimated to be similar in cost-effectiveness to many of the
post-construction management options as shown in Figure A-1. The non-lakefront buffer preservation
and the buffer/bank restoration options (in developed areas) were more cost-effective, similar to the most
cost-effective post-construction options, ranging from about $60 to $220 per ton of sediment loading
reduced. The pasture alternative water source and fencing and the unpaved road management options
exhibited a similar range of cost-effectiveness.
Across all management options, pasture renovation, pasture buffer/bank restoration, and improved
construction site management present the most cost-effective options for sediment reduction. However,
the pasture management options, other than buffer/bank restoration, only reduce upland loading, which
represents a small percentage of the future sediment load to the Lake. It should be noted that on most
pasture land, alternative water sources and fencing will be needed in order to implement buffer/bank
restoration; therefore, the cost-effectiveness of both options combined will likely fall between $20 and
$140 per ton of sediment removed.
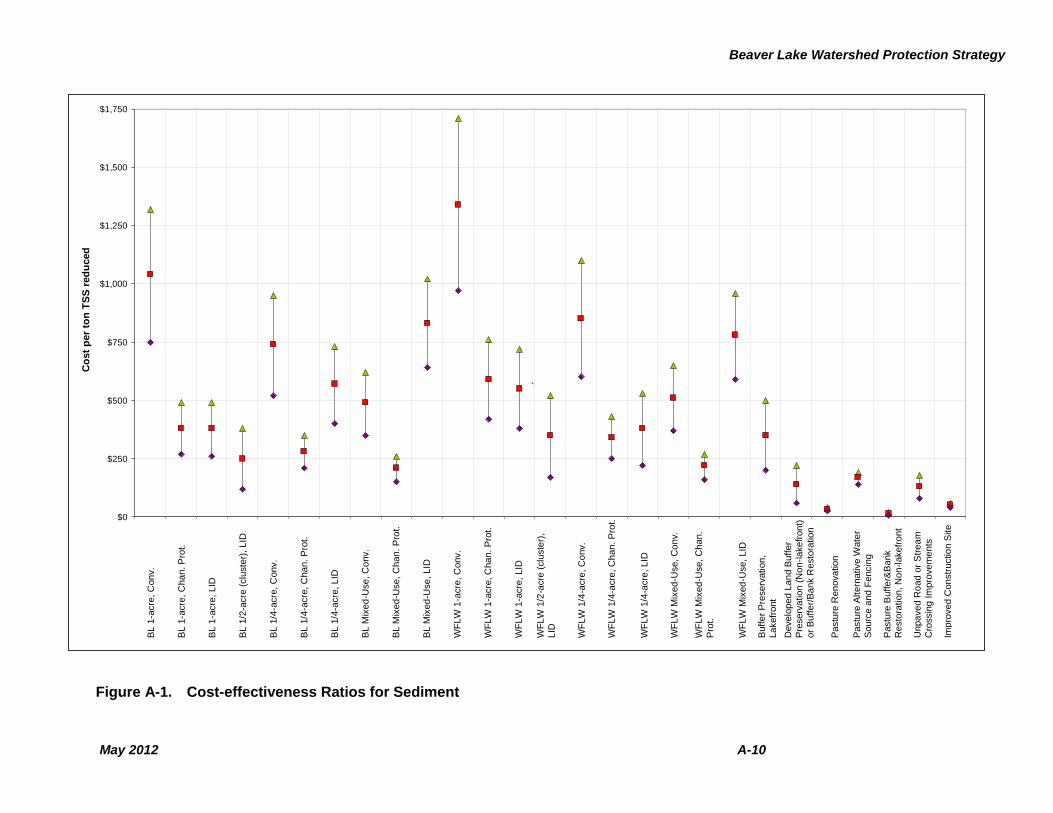
Beaver Lake Watershed Protection Strategy
May 2012 A-10
Figure A-1. Cost-effectiveness Ratios for Sediment
$0
$250
$500
$750
$1,000
$1,250
$1,500
$1,750
BL 1
-acre
, C
onv.
BL 1
-acre
, C
han. P
rot.
BL 1
-acre
, LID
BL 1
/2-a
cre
(clu
ste
r), LID
BL 1
/4-a
cre
, C
onv.
BL 1
/4-a
cre
, C
han. P
rot.
BL 1
/4-a
cre
, LID
BL M
ixed-U
se, C
onv.
BL M
ixed-U
se, C
han. P
rot.
BL M
ixed-U
se, LID
WF
LW
1-a
cre
, C
onv.
WF
LW
1-a
cre
, C
han. P
rot.
WF
LW
1-a
cre
, LID
WF
LW
1/2
-acre
(clu
ste
r), LID
WF
LW
1/4
-acre
, C
onv.
WF
LW
1/4
-acre
, C
han. P
rot.
WF
LW
1/4
-acre
, LID
WF
LW
Mix
ed-U
se, C
onv.
WF
LW
Mix
ed-U
se, C
han. P
rot.
WF
LW
Mix
ed-U
se, LID
Buffer
Pre
serv
atio
n, Lakefr
ont
Develo
ped L
and B
uffer
Pre
serv
atio
n (
Non-lakefr
ont)
or
Buffer/
Bank R
esto
ratio
n (
Lakefr
ont or
Non-L
akefr
ont)
Pastu
re R
enovatio
n
Pastu
re A
ltern
ativ
e W
ate
r S
ourc
e a
nd F
encin
g
Pastu
re B
uffer&
Bank R
esto
ratio
n, N
on-lakefr
ont
Unpaved R
oad Im
pro
vem
ents
or
Unpaved R
oad S
tream
Cro
ssin
g Im
pro
vem
ents
Impro
ved C
onstr
uctio
n S
ite M
anagem
ent
Co
st
per
ton
TS
S r
ed
uced
`
BL 1
-acre
, C
on
v.
BL 1
-acre
, C
ha
n. P
rot.
BL 1
-acre
, LID
BL 1
/2-a
cre
(clu
ste
r), L
ID
BL 1
/4-a
cre
, C
onv.
BL 1
/4-a
cre
, C
han
. P
rot.
BL 1
/4-a
cre
, L
ID
BL M
ixed
-Use
, C
onv.
BL M
ixed
-Use
, C
han.
Pro
t.
BL M
ixed
-Use
, LID
WF
LW
1-a
cre
, C
onv.
WF
LW
1-a
cre
, C
ha
n. P
rot.
WF
LW
1-a
cre
, LID
WF
LW
1/2
-acre
(clu
ste
r),
LID
WF
LW
1/4
-acre
, C
onv.
WF
LW
1/4
-acre
, C
han
. P
rot.
WF
LW
1/4
-acre
, LID
WF
LW
Mix
ed
-Use,
Co
nv.
WF
LW
Mix
ed
-Use,
Ch
an.
Pro
t.
WF
LW
Mix
ed
-Use,
LID
Buffe
r P
rese
rvation
,
Lakefr
ont
Develo
pe
d L
an
d B
uffe
r
Pre
se
rva
tion
(N
on
-lakefr
ont)
or
Bu
ffe
r/B
ank R
esto
ration
Pastu
re R
en
ova
tion
Pastu
re A
ltern
ative W
ate
r
Sourc
e a
nd
Fencin
g
Pastu
re B
uffe
r&B
ank
Resto
ration
, N
on
-lakefr
ont
Unpa
ve
d R
oad o
r S
tre
am
Cro
ssin
g I
mpro
ve
me
nts
Imp
roved C
on
str
uctio
n S
ite
Man
ag
em
en
t
Appendix A
May 2012 A-11
References
AFC. 2008. Arkansas Forestry Commission Tree Seedlings. Arkansas Forestry Commission
Baucum Nursery. Accessed January 2009.
http://www.forestry.state.ar.us/seedlingsales_new.htm
Faucette Real Estate. 2009. Coldwell Banker Faucette Real Estate Search. Accessed February
2009. http://www.cbfaucette.com/
Geosyntec. 2008. DRAFT-City of Fayetteville Nutrient Reduction Plan. Prepared for City of
Fayetteville, Arkansas. December 2008.
Knoxville/Knox County Water Quality Forum. 2006. Beaver Creek Watershed Restoration Plan.
Web document accessed January 14, 2009. http://web.knoxnews.com/pdf/1223beavercreek.pdf
Mason, James. 2009. Personal communication with owner of Horticultural Management Inc.,
January 19, 2009.
NCEEP. 2004. Annual Report 2003-2004. North Carolina Ecosystem Enhancement Program,
North Carolina Department of Environment and Natural Resources. Accessed February 2009.
http://www.nceep.net/news/annualreport/2004/AR04FINAL.pdf
R.S. Means. 2009. Means Site Work and Landscape Cost Data. Robert Snow Means
Company, Inc., Kingston, Massachusetts.
Tetra Tech. 2004. Upper Yadkin River Basin Targeting of Management Report March 2004.
Prepared by Tetra Tech, Inc. Prepared for the North Carolina Ecosystem Enhancement Program.
Accessed February 2009.
http://www.nceep.net/services/lwps/W_Kerr_Scott/Upper_Yadkin_Targeting_3-31-
04_FINAL.pdf
USDA. 2008. Field Office Technical Guides: Section 1, 2008 Payment Schedule Cost Data.
US Department of Agriculture, Natural Resources Conservation Service. Accessed January
2008. http://efotg.nrcs.usda.gov/efotg_locator.aspx?map=AR
USEPA. 2008a. Development Document for Proposed Effluent Guidelines and Standards for
the Construction & Development Category. Web document accessed January 16, 2009.
http://www.epa.gov/waterscience/guide/construction/proposed/proposed-tdd_1-20081121.pdf
USEPA. 2009b. Construction Site Stormwater Runoff Control. National Pollutant Discharge
Elimination System, Office of Wastewater Management, US Environmental Protection Agency.
Accessed February 2009.
http://cfpub.epa.gov/npdes/stormwater/menuofbmps/index.cfm?action=min_measure&min_meas
ure_id=4
USEPA. 2008b. Environmental Impact and Benefits Assessment for Proposed Effluent
Guidelines and Standards for the Construction and Development Category. Web document
accessed January 16, 2009.
http://www.epa.gov/waterscience/guide/construction/proposed/proposed-env-20081120.pdf
Wisconsin Department of Natural Resources. 2001. Fiscal Estimate Worksheet for the Non-
agricultural Performance Standards: Summary of Costs and Cost Allocation; 1. NR 151.11,
Construction Site Performance Standard. Web document accessed January 15, 2009.
http://www.dnr.state.wi.us/Runoff/pdf/rules/NR151_fiscal_estimate_appendix2.pdf

Beaver Lake Watershed Protection Strategy
May 2012 A-12
(This page left intentionally blank.)
May 2012 B-1
Appendix B. Information for TMDL Implementation Efforts in the West Fork and Lower
White River Reporting Subwatersheds
EPA Watershed Management Plan Element A: Identification of Impairment Cause and Source – See Tables B-1 and B-2
EPA Watershed Management Plane Element B: Load reduction estimates expected per management measure – See Tables B-1 and B-2

Beaver Lake Watershed Protection Strategy
May 2012 B-2
(This page left intentionally blank.)
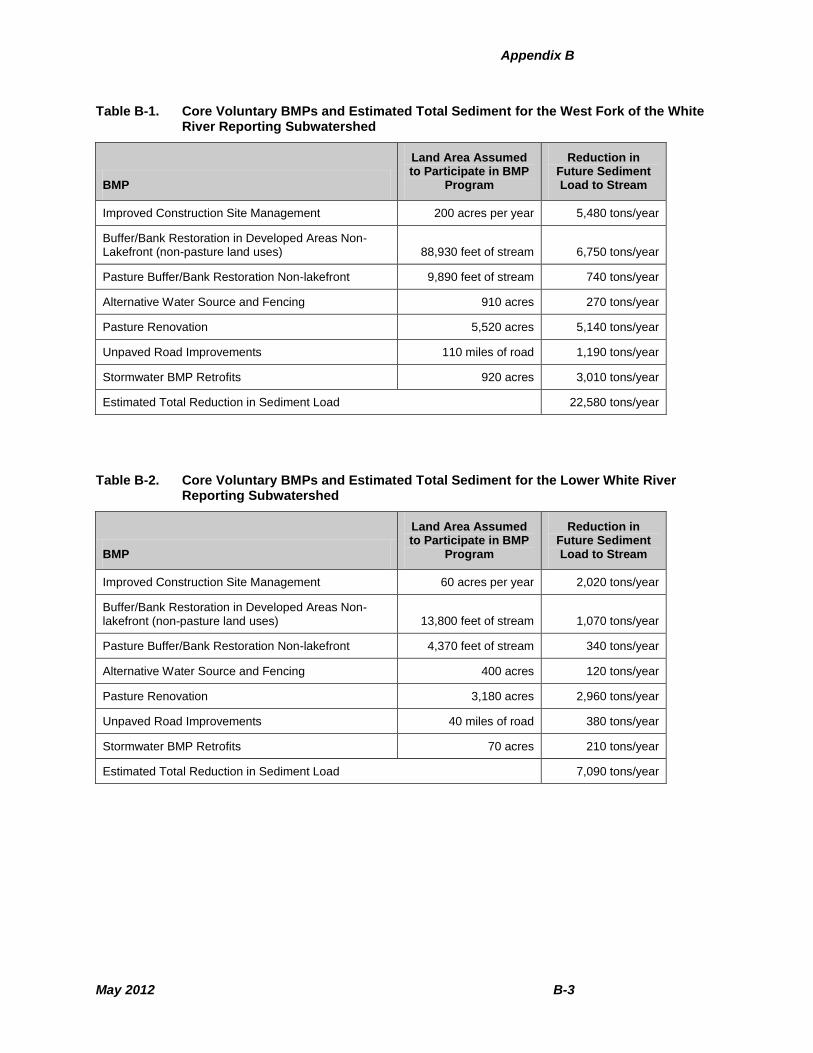
Appendix B
May 2012 B-3
Table B-1. Core Voluntary BMPs and Estimated Total Sediment for the West Fork of the White River Reporting Subwatershed
BMP
Land Area Assumed to Participate in BMP
Program
Reduction in Future Sediment Load to Stream
Improved Construction Site Management 200 acres per year 5,480 tons/year
Buffer/Bank Restoration in Developed Areas Non-Lakefront (non-pasture land uses) 88,930 feet of stream 6,750 tons/year
Pasture Buffer/Bank Restoration Non-lakefront 9,890 feet of stream 740 tons/year
Alternative Water Source and Fencing 910 acres 270 tons/year
Pasture Renovation 5,520 acres 5,140 tons/year
Unpaved Road Improvements 110 miles of road 1,190 tons/year
Stormwater BMP Retrofits 920 acres 3,010 tons/year
Estimated Total Reduction in Sediment Load 22,580 tons/year
Table B-2. Core Voluntary BMPs and Estimated Total Sediment for the Lower White River Reporting Subwatershed
BMP
Land Area Assumed to Participate in BMP
Program
Reduction in Future Sediment Load to Stream
Improved Construction Site Management 60 acres per year 2,020 tons/year
Buffer/Bank Restoration in Developed Areas Non-lakefront (non-pasture land uses) 13,800 feet of stream 1,070 tons/year
Pasture Buffer/Bank Restoration Non-lakefront 4,370 feet of stream 340 tons/year
Alternative Water Source and Fencing 400 acres 120 tons/year
Pasture Renovation 3,180 acres 2,960 tons/year
Unpaved Road Improvements 40 miles of road 380 tons/year
Stormwater BMP Retrofits 70 acres 210 tons/year
Estimated Total Reduction in Sediment Load 7,090 tons/year


Beaver Lake Watershed Protection Strategy
May 2012 B-4
(This page intentionally left blank.)


May 2012 C-1
Appendix C. Supplemental Information on Post-construction
Stormwater Management

Beaver Lake Watershed Protection Strategy
May 2012 C-2
(This page left intentionally blank.)
Appendix C
May 2012 C-3
Post-construction stormwater management can reduce loading from roofs, streets, lawns, and
other developed land uses as well as reduce stormwater flow and volume that degrades
downstream channels. Three approaches to stormwater management were considered:
conventional, channel protection, and low impact development (LID). In the conventional
option, Tetra Tech assumes that communities and developers in the watershed using stormwater
BMPs in the future will employ conventional dry detention basins for flood control and design
those basins using the City of Fayetteville’s current stormwater regulations, which specify that
post-development flow rate not exceed pre-development flow rates for the 2-yr, 10-yr, 25-yr, 50-
yr, and 100-yr 24-hour storm events. The channel protection option uses extended dry detention
basins both to meet the flood control goals of the conventional option and to greatly reduce
degradation of channels downstream of the development. The LID option uses infiltration
practices, rainwater harvesting techniques, impervious surface reduction, land preservation, and
extended dry detention basins to meet the goals of the preceding options and achieve additional
pollutant load reduction and annual hydrology benefits. Appropriate LID techniques were
selected based on development density and through consultation with local engineers.
Why is channel protection important, and why does it have its own option? Stream channel
erosion has been identified as one of the largest contributors to sediment delivery to Beaver Lake
under the future development option and also would result in degraded integrity of stream
biology. Development – even at relatively low densities – changes the flow regime of streams.
Disturbance of land cover and addition of impervious surfaces increases runoff volume and
decreases the amount of time that it takes for runoff to reach streams. Simply reducing peak flow
to pre-development levels for flood control is not sufficient to protect streams in areas
experiencing development. Instead, flows are reduced but are released from detention basins for
an extended period of time. When many peak-matching detention basins are present in a
watershed, their combined discharge leads to a large increase in the duration of midbank and
bankfull channel forming flows, which typically occur across a range of small storm events (e.g.,
0.5-year storm events to 3-year storm events). For example, MacCrae (1997) found that in a
21 km2 urbanizing watershed with stormwater control facilities, the frequency of midbank flows
increased by more than four times, while the bankfull cross-sectional area increased by a factor
of three. With proper basin sizing and outlet design, a detention basin’s stage-discharge
relationship can be optimized to minimize changes to channel forming flows. An additional
benefit of a basin designed specifically to reduce downstream channel erosion is that these basins
typically achieve much greater pollutant removal than a basin designed for flood control. The
channel protection option was designed to test the influence of an enhanced basin design on cost,
pollutant removal, and mitigation of downstream channel erosion.
The LID option incorporates the enhanced basin design, but in addition uses LID practices to
enhance pollutant removal and improve annual water balance. Development often alters the way
rainfall is partitioned between runoff, infiltration, and evapotranspiration; urbanizing areas often
experience higher stream flashiness paired with lower baseflow, all of which contributes to
impaired stream aquatic communities. LID practices work together to restore much of the lost
infiltration and evapotranspiration.
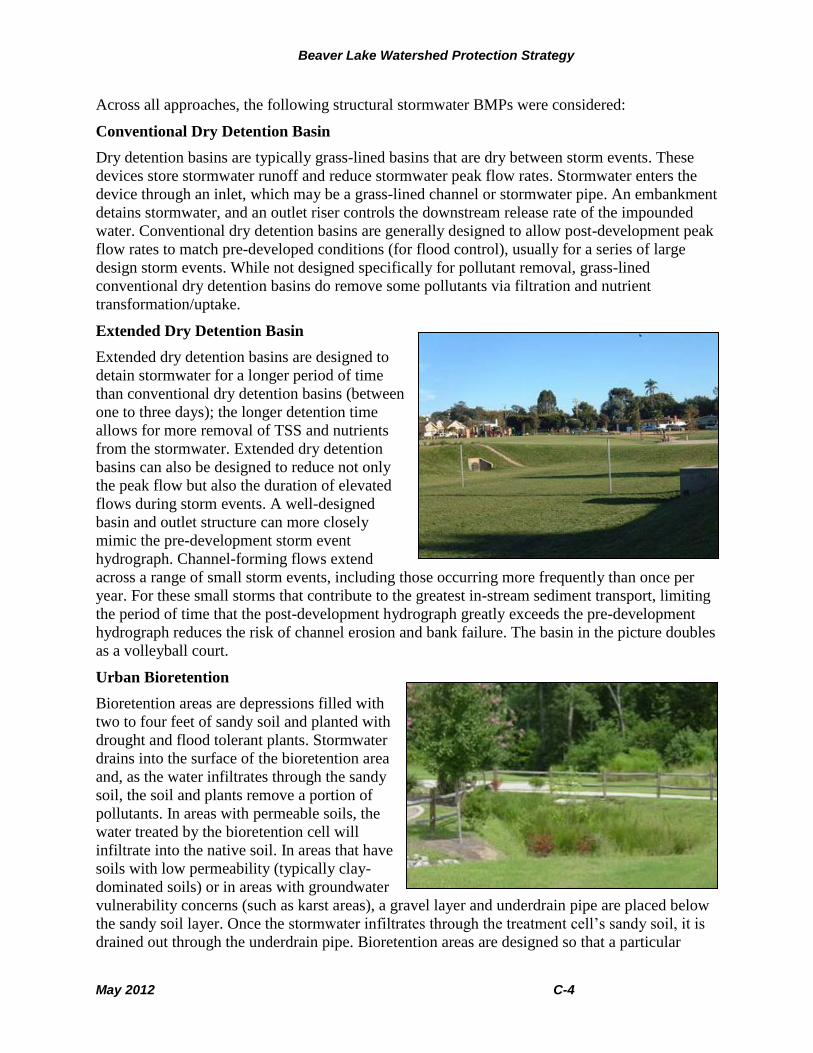
Beaver Lake Watershed Protection Strategy
May 2012 C-4
Across all approaches, the following structural stormwater BMPs were considered:
Conventional Dry Detention Basin
Dry detention basins are typically grass-lined basins that are dry between storm events. These
devices store stormwater runoff and reduce stormwater peak flow rates. Stormwater enters the
device through an inlet, which may be a grass-lined channel or stormwater pipe. An embankment
detains stormwater, and an outlet riser controls the downstream release rate of the impounded
water. Conventional dry detention basins are generally designed to allow post-development peak
flow rates to match pre-developed conditions (for flood control), usually for a series of large
design storm events. While not designed specifically for pollutant removal, grass-lined
conventional dry detention basins do remove some pollutants via filtration and nutrient
transformation/uptake.
Extended Dry Detention Basin
Extended dry detention basins are designed to
detain stormwater for a longer period of time
than conventional dry detention basins (between
one to three days); the longer detention time
allows for more removal of TSS and nutrients
from the stormwater. Extended dry detention
basins can also be designed to reduce not only
the peak flow but also the duration of elevated
flows during storm events. A well-designed
basin and outlet structure can more closely
mimic the pre-development storm event
hydrograph. Channel-forming flows extend
across a range of small storm events, including those occurring more frequently than once per
year. For these small storms that contribute to the greatest in-stream sediment transport, limiting
the period of time that the post-development hydrograph greatly exceeds the pre-development
hydrograph reduces the risk of channel erosion and bank failure. The basin in the picture doubles
as a volleyball court.
Urban Bioretention
Bioretention areas are depressions filled with
two to four feet of sandy soil and planted with
drought and flood tolerant plants. Stormwater
drains into the surface of the bioretention area
and, as the water infiltrates through the sandy
soil, the soil and plants remove a portion of
pollutants. In areas with permeable soils, the
water treated by the bioretention cell will
infiltrate into the native soil. In areas that have
soils with low permeability (typically clay-
dominated soils) or in areas with groundwater
vulnerability concerns (such as karst areas), a gravel layer and underdrain pipe are placed below
the sandy soil layer. Once the stormwater infiltrates through the treatment cell’s sandy soil, it is
drained out through the underdrain pipe. Bioretention areas are designed so that a particular
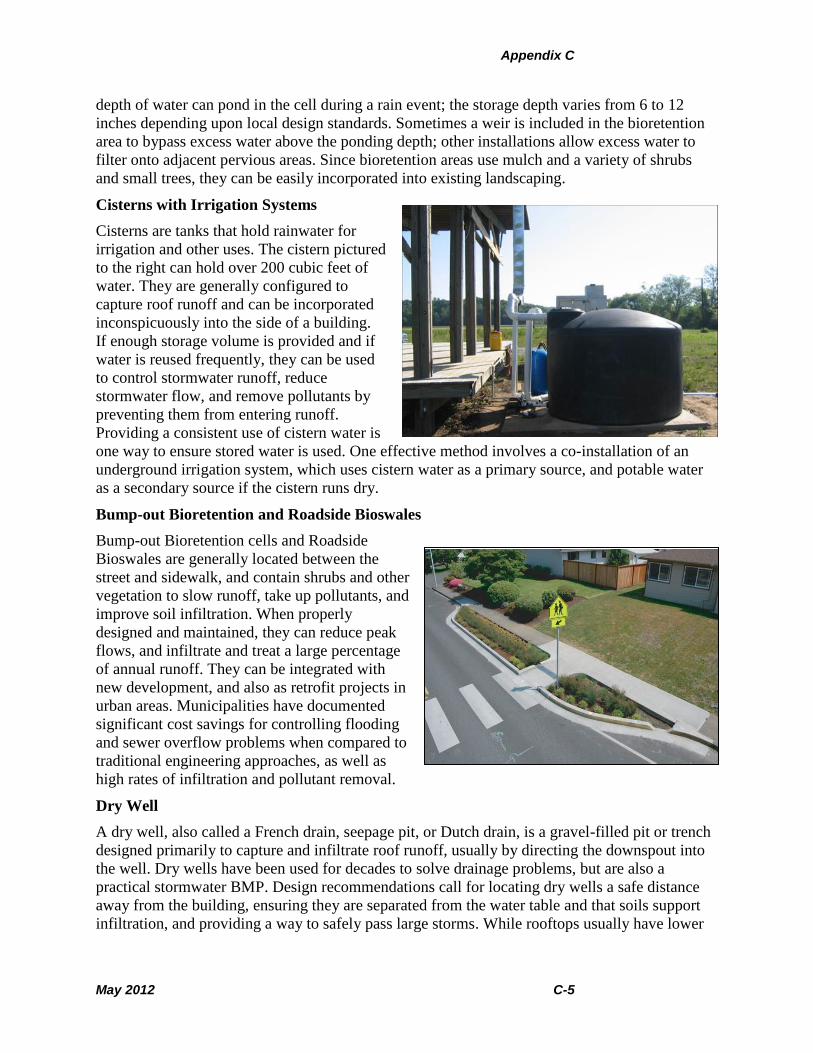
Appendix C
May 2012 C-5
depth of water can pond in the cell during a rain event; the storage depth varies from 6 to 12
inches depending upon local design standards. Sometimes a weir is included in the bioretention
area to bypass excess water above the ponding depth; other installations allow excess water to
filter onto adjacent pervious areas. Since bioretention areas use mulch and a variety of shrubs
and small trees, they can be easily incorporated into existing landscaping.
Cisterns with Irrigation Systems
Cisterns are tanks that hold rainwater for
irrigation and other uses. The cistern pictured
to the right can hold over 200 cubic feet of
water. They are generally configured to
capture roof runoff and can be incorporated
inconspicuously into the side of a building.
If enough storage volume is provided and if
water is reused frequently, they can be used
to control stormwater runoff, reduce
stormwater flow, and remove pollutants by
preventing them from entering runoff.
Providing a consistent use of cistern water is
one way to ensure stored water is used. One effective method involves a co-installation of an
underground irrigation system, which uses cistern water as a primary source, and potable water
as a secondary source if the cistern runs dry.
Bump-out Bioretention and Roadside Bioswales
Bump-out Bioretention cells and Roadside
Bioswales are generally located between the
street and sidewalk, and contain shrubs and other
vegetation to slow runoff, take up pollutants, and
improve soil infiltration. When properly
designed and maintained, they can reduce peak
flows, and infiltrate and treat a large percentage
of annual runoff. They can be integrated with
new development, and also as retrofit projects in
urban areas. Municipalities have documented
significant cost savings for controlling flooding
and sewer overflow problems when compared to
traditional engineering approaches, as well as
high rates of infiltration and pollutant removal.
Dry Well
A dry well, also called a French drain, seepage pit, or Dutch drain, is a gravel-filled pit or trench
designed primarily to capture and infiltrate roof runoff, usually by directing the downspout into
the well. Dry wells have been used for decades to solve drainage problems, but are also a
practical stormwater BMP. Design recommendations call for locating dry wells a safe distance
away from the building, ensuring they are separated from the water table and that soils support
infiltration, and providing a way to safely pass large storms. While rooftops usually have lower
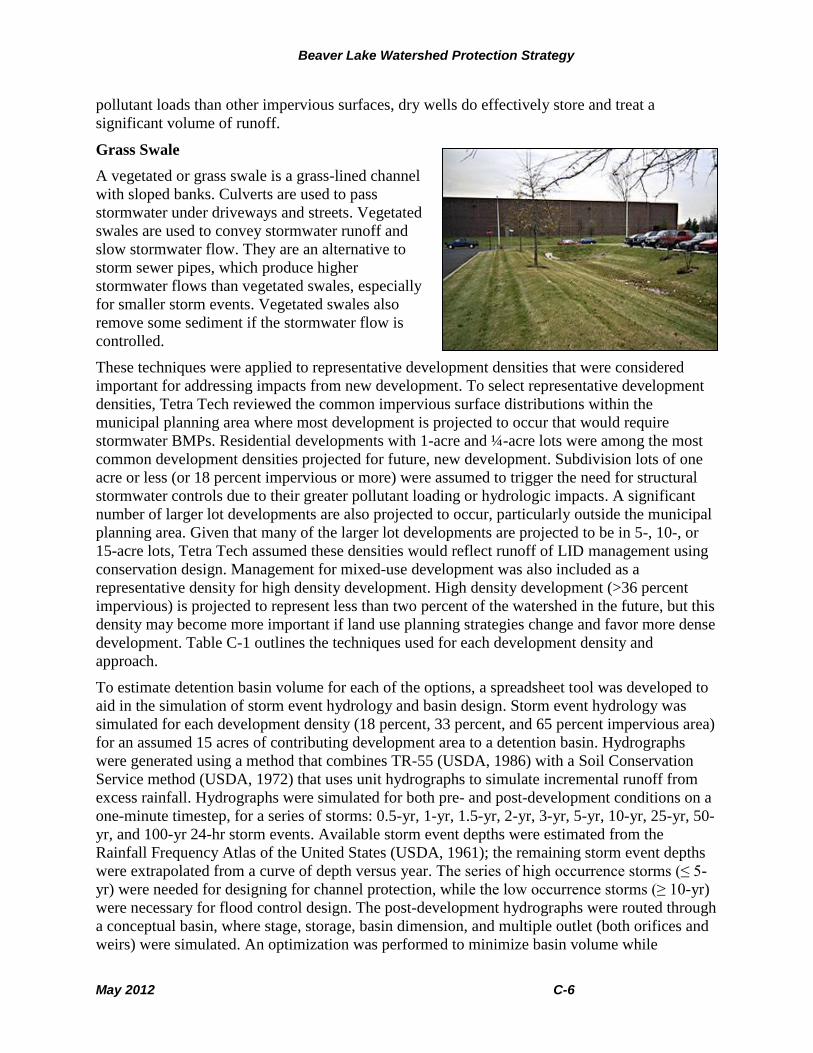
Beaver Lake Watershed Protection Strategy
May 2012 C-6
pollutant loads than other impervious surfaces, dry wells do effectively store and treat a
significant volume of runoff.
Grass Swale
A vegetated or grass swale is a grass-lined channel
with sloped banks. Culverts are used to pass
stormwater under driveways and streets. Vegetated
swales are used to convey stormwater runoff and
slow stormwater flow. They are an alternative to
storm sewer pipes, which produce higher
stormwater flows than vegetated swales, especially
for smaller storm events. Vegetated swales also
remove some sediment if the stormwater flow is
controlled.
These techniques were applied to representative development densities that were considered
important for addressing impacts from new development. To select representative development
densities, Tetra Tech reviewed the common impervious surface distributions within the
municipal planning area where most development is projected to occur that would require
stormwater BMPs. Residential developments with 1-acre and ¼-acre lots were among the most
common development densities projected for future, new development. Subdivision lots of one
acre or less (or 18 percent impervious or more) were assumed to trigger the need for structural
stormwater controls due to their greater pollutant loading or hydrologic impacts. A significant
number of larger lot developments are also projected to occur, particularly outside the municipal
planning area. Given that many of the larger lot developments are projected to be in 5-, 10-, or
15-acre lots, Tetra Tech assumed these densities would reflect runoff of LID management using
conservation design. Management for mixed-use development was also included as a
representative density for high density development. High density development (>36 percent
impervious) is projected to represent less than two percent of the watershed in the future, but this
density may become more important if land use planning strategies change and favor more dense
development. Table C-1 outlines the techniques used for each development density and
approach.
To estimate detention basin volume for each of the options, a spreadsheet tool was developed to
aid in the simulation of storm event hydrology and basin design. Storm event hydrology was
simulated for each development density (18 percent, 33 percent, and 65 percent impervious area)
for an assumed 15 acres of contributing development area to a detention basin. Hydrographs
were generated using a method that combines TR-55 (USDA, 1986) with a Soil Conservation
Service method (USDA, 1972) that uses unit hydrographs to simulate incremental runoff from
excess rainfall. Hydrographs were simulated for both pre- and post-development conditions on a
one-minute timestep, for a series of storms: 0.5-yr, 1-yr, 1.5-yr, 2-yr, 3-yr, 5-yr, 10-yr, 25-yr, 50-
yr, and 100-yr 24-hr storm events. Available storm event depths were estimated from the
Rainfall Frequency Atlas of the United States (USDA, 1961); the remaining storm event depths
were extrapolated from a curve of depth versus year. The series of high occurrence storms (≤ 5-
yr) were needed for designing for channel protection, while the low occurrence storms (≥ 10-yr)
were necessary for flood control design. The post-development hydrographs were routed through
a conceptual basin, where stage, storage, basin dimension, and multiple outlet (both orifices and
weirs) were simulated. An optimization was performed to minimize basin volume while
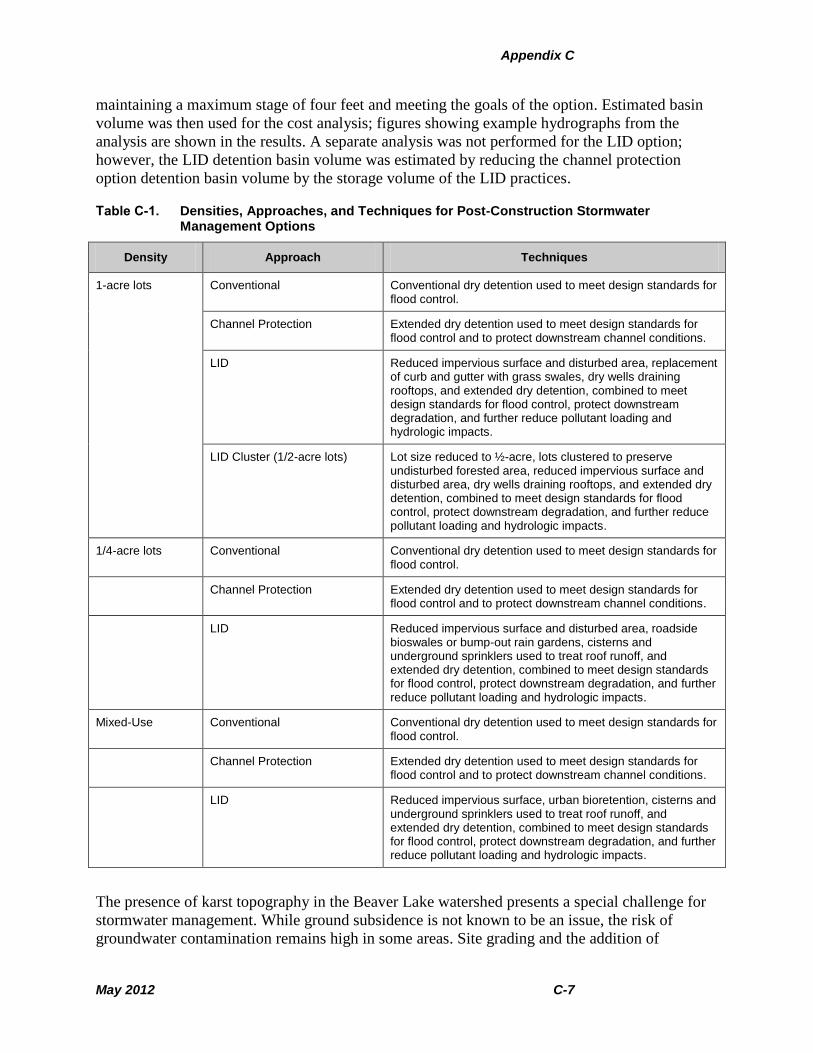
Appendix C
May 2012 C-7
maintaining a maximum stage of four feet and meeting the goals of the option. Estimated basin
volume was then used for the cost analysis; figures showing example hydrographs from the
analysis are shown in the results. A separate analysis was not performed for the LID option;
however, the LID detention basin volume was estimated by reducing the channel protection
option detention basin volume by the storage volume of the LID practices.
Table C-1. Densities, Approaches, and Techniques for Post-Construction Stormwater Management Options
Density Approach Techniques
1-acre lots Conventional Conventional dry detention used to meet design standards for flood control.
Channel Protection Extended dry detention used to meet design standards for flood control and to protect downstream channel conditions.
LID Reduced impervious surface and disturbed area, replacement of curb and gutter with grass swales, dry wells draining rooftops, and extended dry detention, combined to meet design standards for flood control, protect downstream degradation, and further reduce pollutant loading and hydrologic impacts.
LID Cluster (1/2-acre lots) Lot size reduced to ½-acre, lots clustered to preserve undisturbed forested area, reduced impervious surface and disturbed area, dry wells draining rooftops, and extended dry detention, combined to meet design standards for flood control, protect downstream degradation, and further reduce pollutant loading and hydrologic impacts.
1/4-acre lots Conventional Conventional dry detention used to meet design standards for flood control.
Channel Protection Extended dry detention used to meet design standards for flood control and to protect downstream channel conditions.
LID Reduced impervious surface and disturbed area, roadside bioswales or bump-out rain gardens, cisterns and underground sprinklers used to treat roof runoff, and extended dry detention, combined to meet design standards for flood control, protect downstream degradation, and further reduce pollutant loading and hydrologic impacts.
Mixed-Use Conventional Conventional dry detention used to meet design standards for flood control.
Channel Protection Extended dry detention used to meet design standards for flood control and to protect downstream channel conditions.
LID Reduced impervious surface, urban bioretention, cisterns and underground sprinklers used to treat roof runoff, and extended dry detention, combined to meet design standards for flood control, protect downstream degradation, and further reduce pollutant loading and hydrologic impacts.
The presence of karst topography in the Beaver Lake watershed presents a special challenge for
stormwater management. While ground subsidence is not known to be an issue, the risk of
groundwater contamination remains high in some areas. Site grading and the addition of
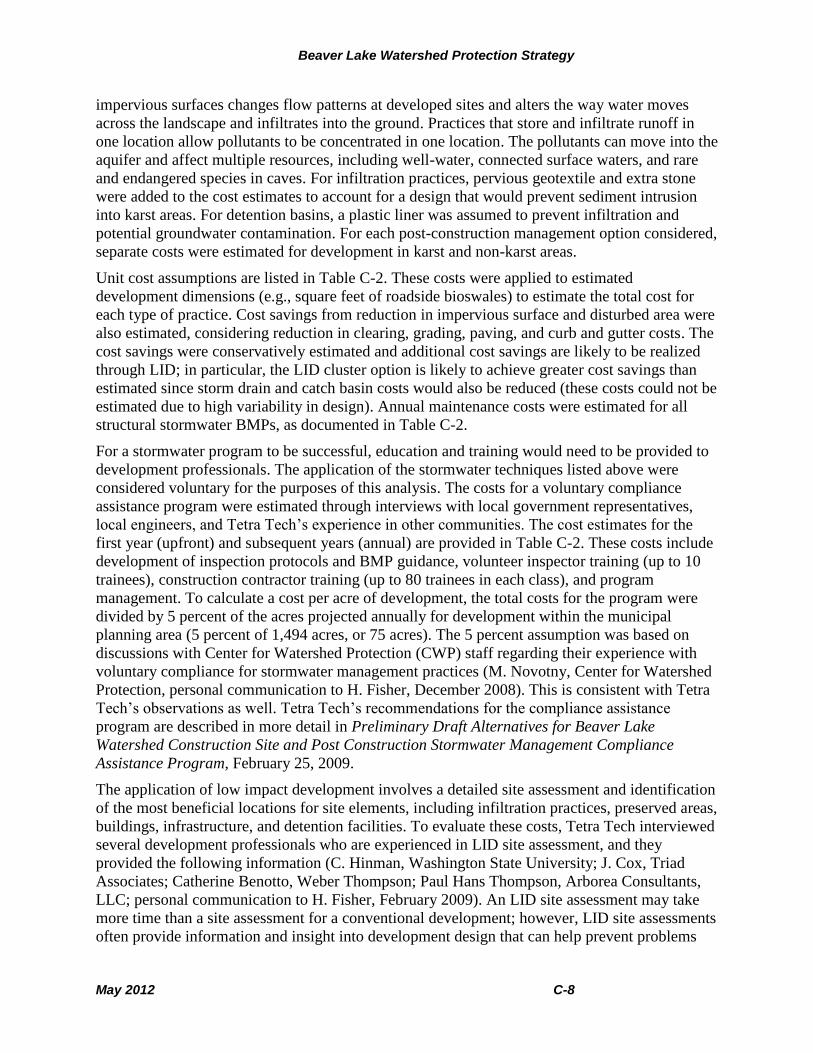
Beaver Lake Watershed Protection Strategy
May 2012 C-8
impervious surfaces changes flow patterns at developed sites and alters the way water moves
across the landscape and infiltrates into the ground. Practices that store and infiltrate runoff in
one location allow pollutants to be concentrated in one location. The pollutants can move into the
aquifer and affect multiple resources, including well-water, connected surface waters, and rare
and endangered species in caves. For infiltration practices, pervious geotextile and extra stone
were added to the cost estimates to account for a design that would prevent sediment intrusion
into karst areas. For detention basins, a plastic liner was assumed to prevent infiltration and
potential groundwater contamination. For each post-construction management option considered,
separate costs were estimated for development in karst and non-karst areas.
Unit cost assumptions are listed in Table C-2. These costs were applied to estimated
development dimensions (e.g., square feet of roadside bioswales) to estimate the total cost for
each type of practice. Cost savings from reduction in impervious surface and disturbed area were
also estimated, considering reduction in clearing, grading, paving, and curb and gutter costs. The
cost savings were conservatively estimated and additional cost savings are likely to be realized
through LID; in particular, the LID cluster option is likely to achieve greater cost savings than
estimated since storm drain and catch basin costs would also be reduced (these costs could not be
estimated due to high variability in design). Annual maintenance costs were estimated for all
structural stormwater BMPs, as documented in Table C-2.
For a stormwater program to be successful, education and training would need to be provided to
development professionals. The application of the stormwater techniques listed above were
considered voluntary for the purposes of this analysis. The costs for a voluntary compliance
assistance program were estimated through interviews with local government representatives,
local engineers, and Tetra Tech’s experience in other communities. The cost estimates for the
first year (upfront) and subsequent years (annual) are provided in Table C-2. These costs include
development of inspection protocols and BMP guidance, volunteer inspector training (up to 10
trainees), construction contractor training (up to 80 trainees in each class), and program
management. To calculate a cost per acre of development, the total costs for the program were
divided by 5 percent of the acres projected annually for development within the municipal
planning area (5 percent of 1,494 acres, or 75 acres). The 5 percent assumption was based on
discussions with Center for Watershed Protection (CWP) staff regarding their experience with
voluntary compliance for stormwater management practices (M. Novotny, Center for Watershed
Protection, personal communication to H. Fisher, December 2008). This is consistent with Tetra
Tech’s observations as well. Tetra Tech’s recommendations for the compliance assistance
program are described in more detail in Preliminary Draft Alternatives for Beaver Lake
Watershed Construction Site and Post Construction Stormwater Management Compliance
Assistance Program, February 25, 2009.
The application of low impact development involves a detailed site assessment and identification
of the most beneficial locations for site elements, including infiltration practices, preserved areas,
buildings, infrastructure, and detention facilities. To evaluate these costs, Tetra Tech interviewed
several development professionals who are experienced in LID site assessment, and they
provided the following information (C. Hinman, Washington State University; J. Cox, Triad
Associates; Catherine Benotto, Weber Thompson; Paul Hans Thompson, Arborea Consultants,
LLC; personal communication to H. Fisher, February 2009). An LID site assessment may take
more time than a site assessment for a conventional development; however, LID site assessments
often provide information and insight into development design that can help prevent problems
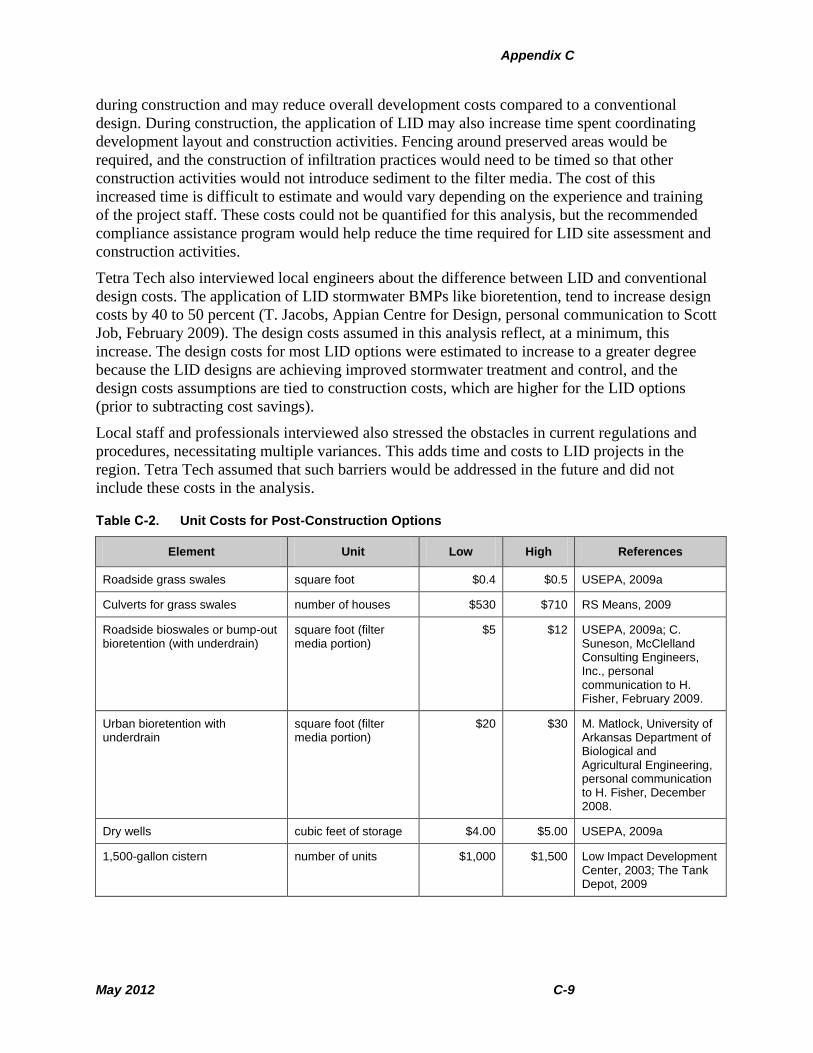
Appendix C
May 2012 C-9
during construction and may reduce overall development costs compared to a conventional
design. During construction, the application of LID may also increase time spent coordinating
development layout and construction activities. Fencing around preserved areas would be
required, and the construction of infiltration practices would need to be timed so that other
construction activities would not introduce sediment to the filter media. The cost of this
increased time is difficult to estimate and would vary depending on the experience and training
of the project staff. These costs could not be quantified for this analysis, but the recommended
compliance assistance program would help reduce the time required for LID site assessment and
construction activities.
Tetra Tech also interviewed local engineers about the difference between LID and conventional
design costs. The application of LID stormwater BMPs like bioretention, tend to increase design
costs by 40 to 50 percent (T. Jacobs, Appian Centre for Design, personal communication to Scott
Job, February 2009). The design costs assumed in this analysis reflect, at a minimum, this
increase. The design costs for most LID options were estimated to increase to a greater degree
because the LID designs are achieving improved stormwater treatment and control, and the
design costs assumptions are tied to construction costs, which are higher for the LID options
(prior to subtracting cost savings).
Local staff and professionals interviewed also stressed the obstacles in current regulations and
procedures, necessitating multiple variances. This adds time and costs to LID projects in the
region. Tetra Tech assumed that such barriers would be addressed in the future and did not
include these costs in the analysis.
Table C-2. Unit Costs for Post-Construction Options
Element Unit Low High References
Roadside grass swales square foot $0.4 $0.5 USEPA, 2009a
Culverts for grass swales number of houses $530 $710 RS Means, 2009
Roadside bioswales or bump-out bioretention (with underdrain)
square foot (filter media portion)
$5 $12 USEPA, 2009a; C. Suneson, McClelland Consulting Engineers, Inc., personal communication to H. Fisher, February 2009.
Urban bioretention with underdrain
square foot (filter media portion)
$20 $30 M. Matlock, University of Arkansas Department of Biological and Agricultural Engineering, personal communication to H. Fisher, December 2008.
Dry wells cubic feet of storage $4.00 $5.00 USEPA, 2009a
1,500-gallon cistern number of units $1,000 $1,500 Low Impact Development Center, 2003; The Tank Depot, 2009
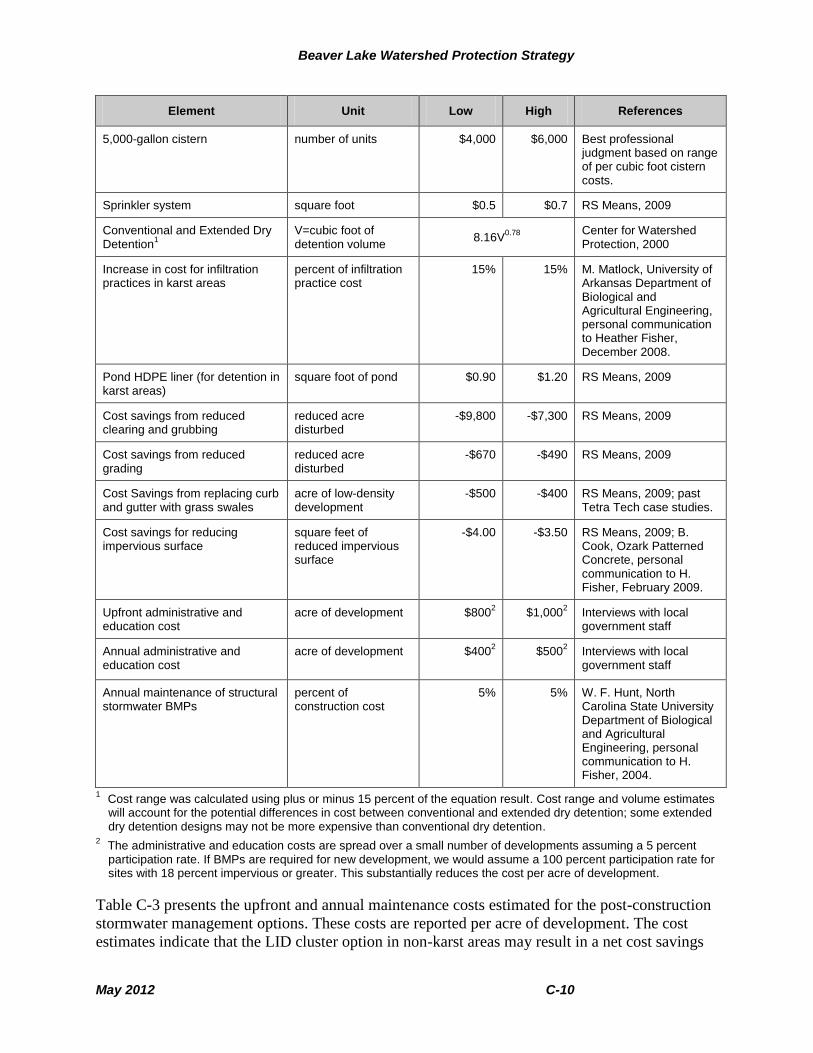
Beaver Lake Watershed Protection Strategy
May 2012 C-10
Element Unit Low High References
5,000-gallon cistern number of units $4,000 $6,000 Best professional judgment based on range of per cubic foot cistern costs.
Sprinkler system square foot $0.5 $0.7 RS Means, 2009
Conventional and Extended Dry Detention
1
V=cubic foot of detention volume
8.16V0.78
Center for Watershed Protection, 2000
Increase in cost for infiltration practices in karst areas
percent of infiltration practice cost
15% 15% M. Matlock, University of Arkansas Department of Biological and Agricultural Engineering, personal communication to Heather Fisher, December 2008.
Pond HDPE liner (for detention in karst areas)
square foot of pond $0.90 $1.20 RS Means, 2009
Cost savings from reduced clearing and grubbing
reduced acre disturbed
-$9,800 -$7,300 RS Means, 2009
Cost savings from reduced grading
reduced acre disturbed
-$670 -$490 RS Means, 2009
Cost Savings from replacing curb and gutter with grass swales
acre of low-density development
-$500 -$400 RS Means, 2009; past Tetra Tech case studies.
Cost savings for reducing impervious surface
square feet of reduced impervious surface
-$4.00 -$3.50 RS Means, 2009; B. Cook, Ozark Patterned Concrete, personal communication to H. Fisher, February 2009.
Upfront administrative and education cost
acre of development $8002 $1,000
2 Interviews with local
government staff
Annual administrative and education cost
acre of development $4002 $500
2 Interviews with local
government staff
Annual maintenance of structural stormwater BMPs
percent of construction cost
5% 5% W. F. Hunt, North Carolina State University Department of Biological and Agricultural Engineering, personal communication to H. Fisher, 2004.
1 Cost range was calculated using plus or minus 15 percent of the equation result. Cost range and volume estimates will account for the potential differences in cost between conventional and extended dry detention; some extended dry detention designs may not be more expensive than conventional dry detention.
2 The administrative and education costs are spread over a small number of developments assuming a 5 percent participation rate. If BMPs are required for new development, we would assume a 100 percent participation rate for sites with 18 percent impervious or greater. This substantially reduces the cost per acre of development.
Table C-3 presents the upfront and annual maintenance costs estimated for the post-construction
stormwater management options. These costs are reported per acre of development. The cost
estimates indicate that the LID cluster option in non-karst areas may result in a net cost savings
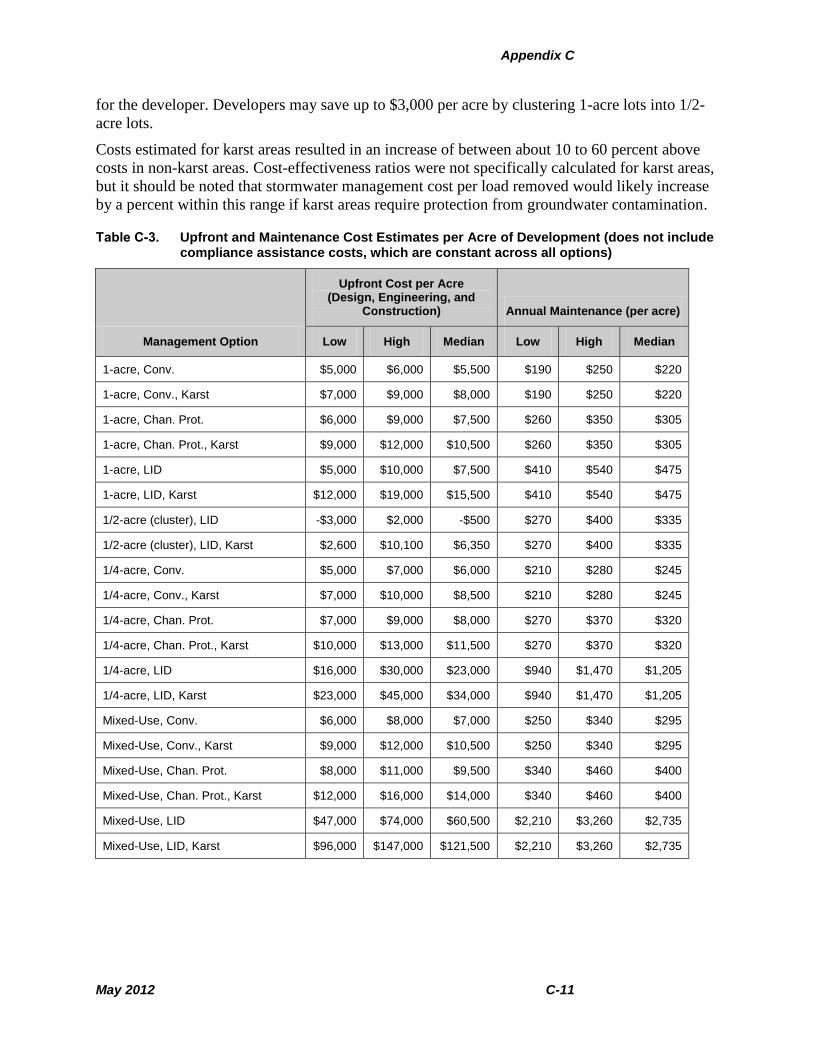
Appendix C
May 2012 C-11
for the developer. Developers may save up to $3,000 per acre by clustering 1-acre lots into 1/2-
acre lots.
Costs estimated for karst areas resulted in an increase of between about 10 to 60 percent above
costs in non-karst areas. Cost-effectiveness ratios were not specifically calculated for karst areas,
but it should be noted that stormwater management cost per load removed would likely increase
by a percent within this range if karst areas require protection from groundwater contamination.
Table C-3. Upfront and Maintenance Cost Estimates per Acre of Development (does not include compliance assistance costs, which are constant across all options)
Management Option
Upfront Cost per Acre (Design, Engineering, and
Construction) Annual Maintenance (per acre)
Low High Median Low High Median
1-acre, Conv. $5,000 $6,000 $5,500 $190 $250 $220
1-acre, Conv., Karst $7,000 $9,000 $8,000 $190 $250 $220
1-acre, Chan. Prot. $6,000 $9,000 $7,500 $260 $350 $305
1-acre, Chan. Prot., Karst $9,000 $12,000 $10,500 $260 $350 $305
1-acre, LID $5,000 $10,000 $7,500 $410 $540 $475
1-acre, LID, Karst $12,000 $19,000 $15,500 $410 $540 $475
1/2-acre (cluster), LID -$3,000 $2,000 -$500 $270 $400 $335
1/2-acre (cluster), LID, Karst $2,600 $10,100 $6,350 $270 $400 $335
1/4-acre, Conv. $5,000 $7,000 $6,000 $210 $280 $245
1/4-acre, Conv., Karst $7,000 $10,000 $8,500 $210 $280 $245
1/4-acre, Chan. Prot. $7,000 $9,000 $8,000 $270 $370 $320
1/4-acre, Chan. Prot., Karst $10,000 $13,000 $11,500 $270 $370 $320
1/4-acre, LID $16,000 $30,000 $23,000 $940 $1,470 $1,205
1/4-acre, LID, Karst $23,000 $45,000 $34,000 $940 $1,470 $1,205
Mixed-Use, Conv. $6,000 $8,000 $7,000 $250 $340 $295
Mixed-Use, Conv., Karst $9,000 $12,000 $10,500 $250 $340 $295
Mixed-Use, Chan. Prot. $8,000 $11,000 $9,500 $340 $460 $400
Mixed-Use, Chan. Prot., Karst $12,000 $16,000 $14,000 $340 $460 $400
Mixed-Use, LID $47,000 $74,000 $60,500 $2,210 $3,260 $2,735
Mixed-Use, LID, Karst $96,000 $147,000 $121,500 $2,210 $3,260 $2,735
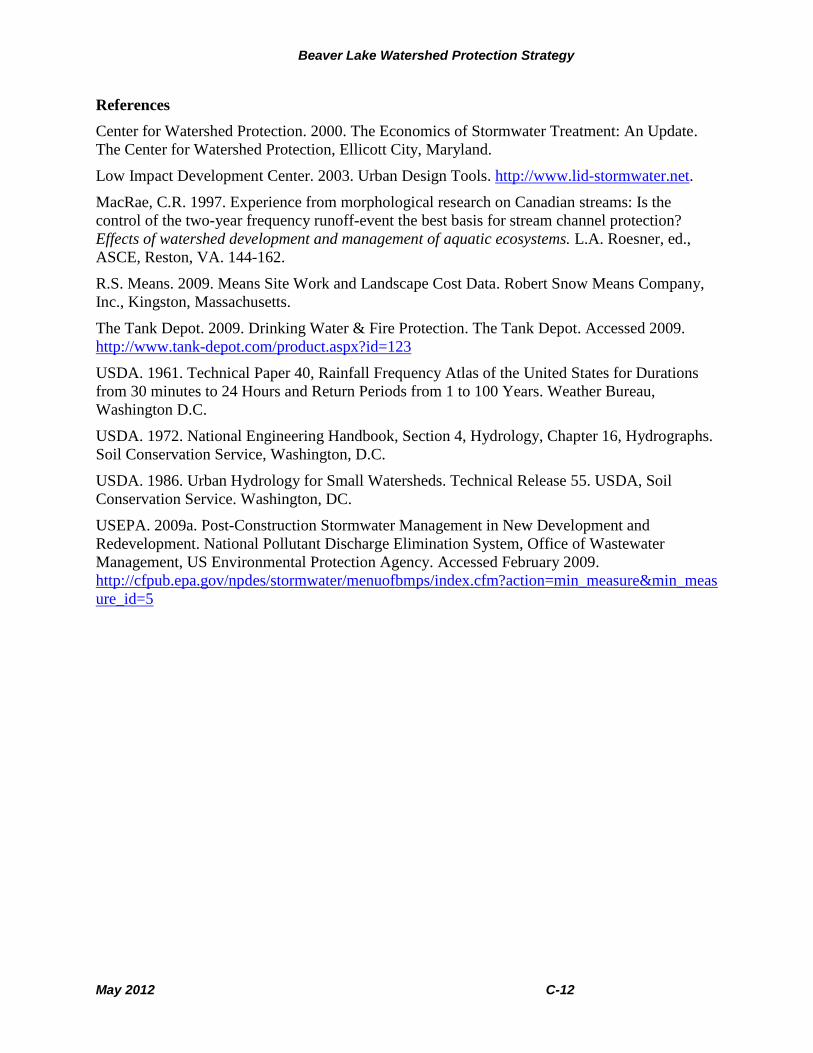
Beaver Lake Watershed Protection Strategy
May 2012 C-12
References
Center for Watershed Protection. 2000. The Economics of Stormwater Treatment: An Update.
The Center for Watershed Protection, Ellicott City, Maryland.
Low Impact Development Center. 2003. Urban Design Tools. http://www.lid-stormwater.net.
MacRae, C.R. 1997. Experience from morphological research on Canadian streams: Is the
control of the two-year frequency runoff-event the best basis for stream channel protection?
Effects of watershed development and management of aquatic ecosystems. L.A. Roesner, ed.,
ASCE, Reston, VA. 144-162.
R.S. Means. 2009. Means Site Work and Landscape Cost Data. Robert Snow Means Company,
Inc., Kingston, Massachusetts.
The Tank Depot. 2009. Drinking Water & Fire Protection. The Tank Depot. Accessed 2009.
http://www.tank-depot.com/product.aspx?id=123
USDA. 1961. Technical Paper 40, Rainfall Frequency Atlas of the United States for Durations
from 30 minutes to 24 Hours and Return Periods from 1 to 100 Years. Weather Bureau,
Washington D.C.
USDA. 1972. National Engineering Handbook, Section 4, Hydrology, Chapter 16, Hydrographs.
Soil Conservation Service, Washington, D.C.
USDA. 1986. Urban Hydrology for Small Watersheds. Technical Release 55. USDA, Soil
Conservation Service. Washington, DC.
USEPA. 2009a. Post-Construction Stormwater Management in New Development and
Redevelopment. National Pollutant Discharge Elimination System, Office of Wastewater
Management, US Environmental Protection Agency. Accessed February 2009.
http://cfpub.epa.gov/npdes/stormwater/menuofbmps/index.cfm?action=min_measure&min_meas
ure_id=5
May 2012 D-1
Appendix D. Correlation of Beaver Lake Watershed Protection Strategy Components to EPA 9
Required Elements for Watershed Plans under Section 319 of the Federal Clean Water Act

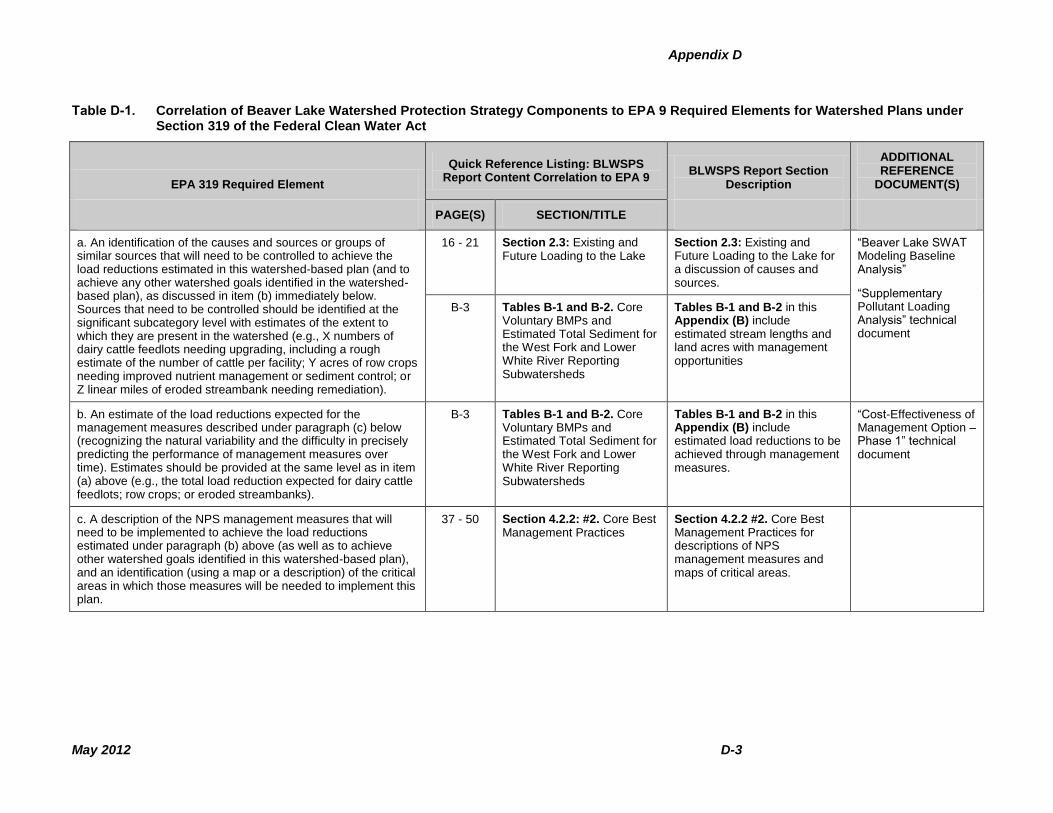
Appendix D
May 2012 D-3
Table D-1. Correlation of Beaver Lake Watershed Protection Strategy Components to EPA 9 Required Elements for Watershed Plans under Section 319 of the Federal Clean Water Act
EPA 319 Required Element
Quick Reference Listing: BLWSPS Report Content Correlation to EPA 9
BLWSPS Report Section Description
ADDITIONAL REFERENCE
DOCUMENT(S)
PAGE(S) SECTION/TITLE
a. An identification of the causes and sources or groups of similar sources that will need to be controlled to achieve the load reductions estimated in this watershed-based plan (and to achieve any other watershed goals identified in the watershed-based plan), as discussed in item (b) immediately below. Sources that need to be controlled should be identified at the significant subcategory level with estimates of the extent to which they are present in the watershed (e.g., X numbers of dairy cattle feedlots needing upgrading, including a rough estimate of the number of cattle per facility; Y acres of row crops needing improved nutrient management or sediment control; or Z linear miles of eroded streambank needing remediation).
16 - 21 Section 2.3: Existing and Future Loading to the Lake
Section 2.3: Existing and Future Loading to the Lake for a discussion of causes and sources.
“Beaver Lake SWAT Modeling Baseline Analysis”
“Supplementary Pollutant Loading Analysis” technical document
B-3 Tables B-1 and B-2. Core Voluntary BMPs and Estimated Total Sediment for the West Fork and Lower White River Reporting Subwatersheds
Tables B-1 and B-2 in this Appendix (B) include estimated stream lengths and land acres with management opportunities
b. An estimate of the load reductions expected for the management measures described under paragraph (c) below (recognizing the natural variability and the difficulty in precisely predicting the performance of management measures over time). Estimates should be provided at the same level as in item (a) above (e.g., the total load reduction expected for dairy cattle feedlots; row crops; or eroded streambanks).
B-3 Tables B-1 and B-2. Core Voluntary BMPs and Estimated Total Sediment for the West Fork and Lower White River Reporting Subwatersheds
Tables B-1 and B-2 in this Appendix (B) include estimated load reductions to be achieved through management measures.
“Cost-Effectiveness of Management Option – Phase 1” technical document
c. A description of the NPS management measures that will need to be implemented to achieve the load reductions estimated under paragraph (b) above (as well as to achieve other watershed goals identified in this watershed-based plan), and an identification (using a map or a description) of the critical areas in which those measures will be needed to implement this plan.
37 - 50 Section 4.2.2: #2. Core Best Management Practices
Section 4.2.2 #2. Core Best Management Practices for descriptions of NPS management measures and maps of critical areas.
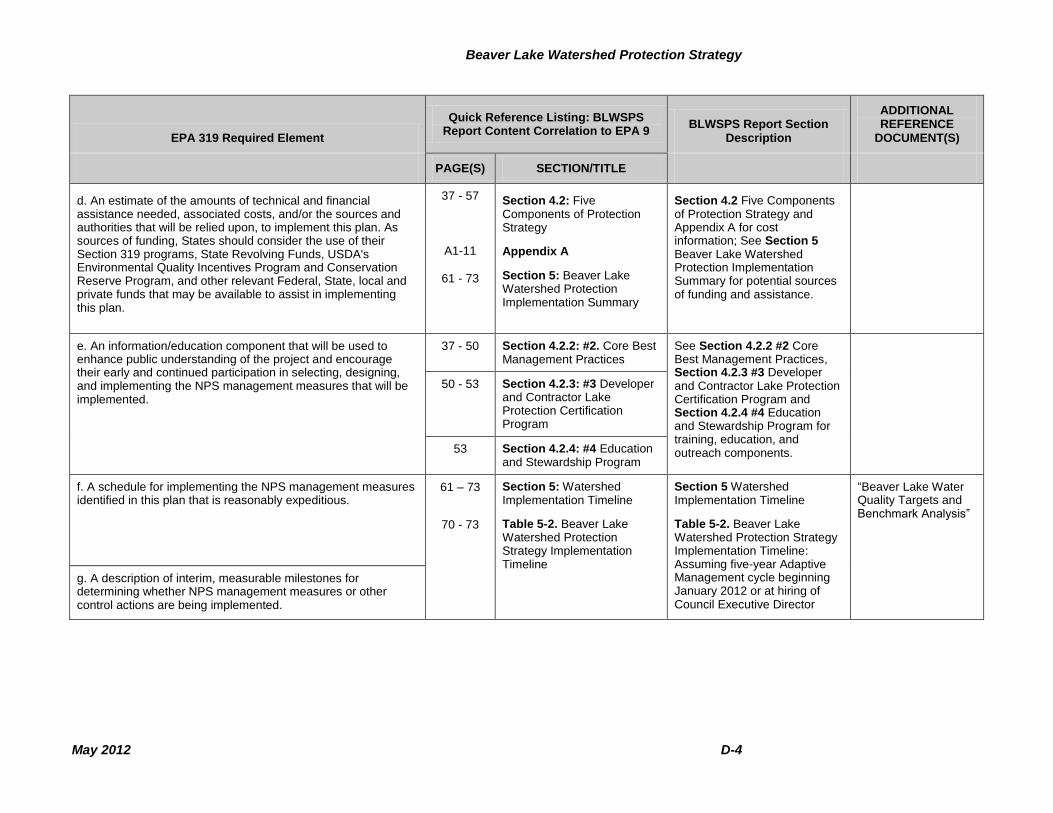
Beaver Lake Watershed Protection Strategy
May 2012 D-4
EPA 319 Required Element
Quick Reference Listing: BLWSPS Report Content Correlation to EPA 9
BLWSPS Report Section Description
ADDITIONAL REFERENCE
DOCUMENT(S)
PAGE(S) SECTION/TITLE
d. An estimate of the amounts of technical and financial assistance needed, associated costs, and/or the sources and authorities that will be relied upon, to implement this plan. As sources of funding, States should consider the use of their Section 319 programs, State Revolving Funds, USDA's Environmental Quality Incentives Program and Conservation Reserve Program, and other relevant Federal, State, local and private funds that may be available to assist in implementing this plan.
37 - 57
A1-11
61 - 73
Section 4.2: Five Components of Protection Strategy
Appendix A
Section 5: Beaver Lake Watershed Protection Implementation Summary
Section 4.2 Five Components of Protection Strategy and Appendix A for cost information; See Section 5 Beaver Lake Watershed Protection Implementation Summary for potential sources of funding and assistance.
e. An information/education component that will be used to enhance public understanding of the project and encourage their early and continued participation in selecting, designing, and implementing the NPS management measures that will be implemented.
37 - 50 Section 4.2.2: #2. Core Best Management Practices
See Section 4.2.2 #2 Core Best Management Practices, Section 4.2.3 #3 Developer and Contractor Lake Protection Certification Program and Section 4.2.4 #4 Education and Stewardship Program for training, education, and outreach components.
50 - 53 Section 4.2.3: #3 Developer and Contractor Lake Protection Certification Program
53 Section 4.2.4: #4 Education and Stewardship Program
f. A schedule for implementing the NPS management measures identified in this plan that is reasonably expeditious.
61 – 73
70 - 73
Section 5: Watershed Implementation Timeline
Table 5-2. Beaver Lake Watershed Protection Strategy Implementation Timeline
Section 5 Watershed Implementation Timeline
Table 5-2. Beaver Lake Watershed Protection Strategy Implementation Timeline: Assuming five-year Adaptive Management cycle beginning January 2012 or at hiring of Council Executive Director
“Beaver Lake Water Quality Targets and Benchmark Analysis”
g. A description of interim, measurable milestones for determining whether NPS management measures or other control actions are being implemented.
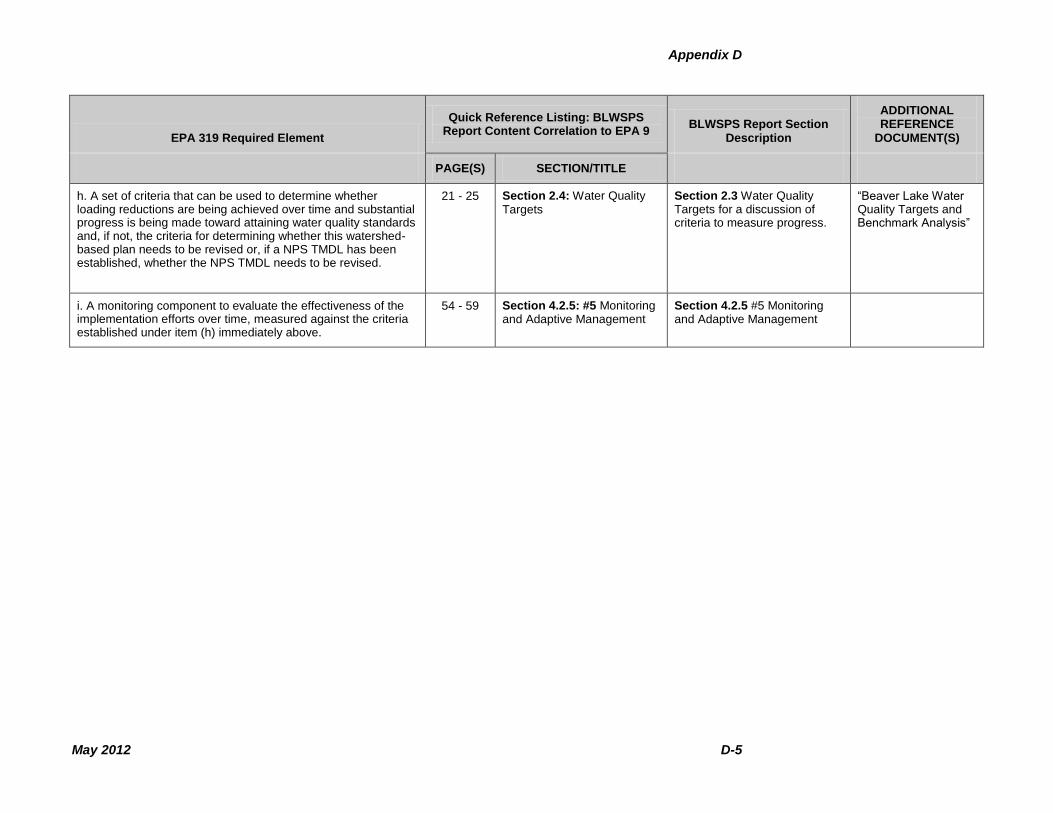
Appendix D
May 2012 D-5
EPA 319 Required Element
Quick Reference Listing: BLWSPS Report Content Correlation to EPA 9
BLWSPS Report Section Description
ADDITIONAL REFERENCE
DOCUMENT(S)
PAGE(S) SECTION/TITLE
h. A set of criteria that can be used to determine whether loading reductions are being achieved over time and substantial progress is being made toward attaining water quality standards and, if not, the criteria for determining whether this watershed-based plan needs to be revised or, if a NPS TMDL has been established, whether the NPS TMDL needs to be revised.
21 - 25 Section 2.4: Water Quality Targets
Section 2.3 Water Quality Targets for a discussion of criteria to measure progress.
“Beaver Lake Water Quality Targets and Benchmark Analysis”
i. A monitoring component to evaluate the effectiveness of the implementation efforts over time, measured against the criteria established under item (h) immediately above.
54 - 59 Section 4.2.5: #5 Monitoring and Adaptive Management
Section 4.2.5 #5 Monitoring and Adaptive Management