Beauty, Gender and Stereotypes: Evidence from Laboratory...
32
Beauty, Gender and Stereotypes: Evidence from Laboratory Experiments James Andreoni University of California - San Diego La Jolla, CA 92093 Ragan Petrie Georgia State University Atlanta, GA 30303 November 2006 Abstract The existence of a beauty premium in the labor market and the male- female wage gap suggests that appearance can matter in the real world. We explore beauty and gender in a public goods experiment and nd similar e/ects. We nd a beauty premium, even though beautiful people contribute, on average, no more or less than others. The beauty premium, however, disappears when we provide information on individual contributions, and becomes a beauty penalty. Players seem to expect beautiful people to be more cooperative. Relative to these expectations, they appear more selsh, which in turn results in less cooperation by others. These appear to be clear examples of stereotyping. We also nd a substantial benet to being male, especially with information. This is primarily due to men being better leaders. Men tend to make large contributions, and people follow their example and give more in later rounds. We are grateful to Terence Burnham, Marco Castillo, Rachel Croson, Daniel Hamermesh, and Bart Lipman for helpful comments. We also thank the National Science Foundation for nancial support.
Transcript of Beauty, Gender and Stereotypes: Evidence from Laboratory...
Beauty, Gender and Stereotypes:Evidence from Laboratory Experiments
James AndreoniUniversity of California - San Diego
La Jolla, CA 92093
Ragan Petrie�
Georgia State UniversityAtlanta, GA 30303
November 2006
Abstract
The existence of a beauty premium in the labor market and the male-female wage gap suggests that appearance can matter in the real world. Weexplore beauty and gender in a public goods experiment and �nd similare¤ects. We �nd a beauty premium, even though beautiful people contribute,on average, no more or less than others. The beauty premium, however,disappears when we provide information on individual contributions, andbecomes a beauty penalty. Players seem to expect beautiful people to bemore cooperative. Relative to these expectations, they appear more sel�sh,which in turn results in less cooperation by others. These appear to beclear examples of stereotyping. We also �nd a substantial bene�t to beingmale, especially with information. This is primarily due to men being better�leaders.�Men tend to make large contributions, and people follow theirexample and give more in later rounds.
�We are grateful to Terence Burnham, Marco Castillo, Rachel Croson, Daniel Hamermesh,and Bart Lipman for helpful comments. We also thank the National Science Foundation for�nancial support.
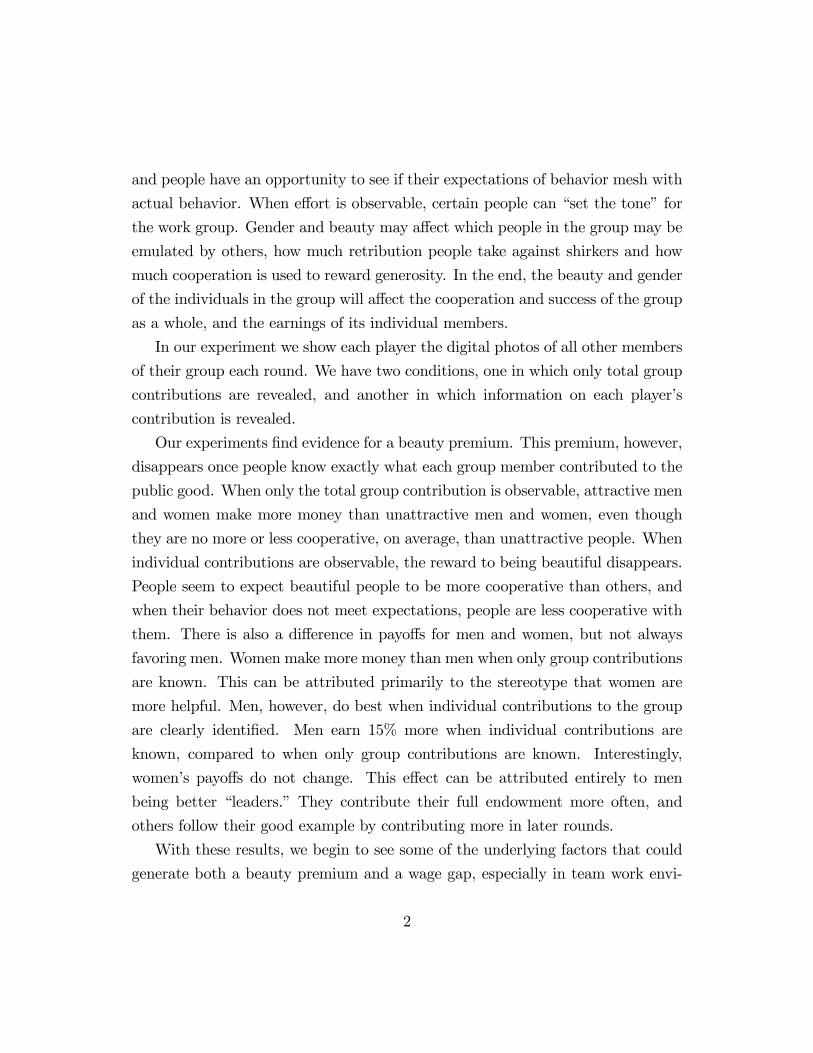
1. Introduction
It is well known from labor market studies that beauty and gender can have
big e¤ects on earnings. Hamermesh and Biddle (1994) have shown a signi�cant
premium to beauty, with attractive people earning more money than unattractive
people. There is also a signi�cant and persistent male-female wage gap. Even
when controlling for age and experience, men earn about 25% more than women
(O�Neill, 2003, 1998). While some of these di¤erences can be attributed to labor
market factors, much of the beauty premium and wage gap remains unexplained.
With labor market studies as inspiration, we look at the returns to beauty
and gender in an economic laboratory experiment where there are bene�ts to
group cooperation. Typically economic experiments take great pains to shield
the identities of subjects from each other, and as such have nothing to say about
how appearances may a¤ect earnings.1 Instead, we reveal the identities of players
to one another by showing their digital photos in the experiment. We �nd that
beauty and gender have signi�cant and sometimes unexpected a¤ects on earnings.
Furthermore, the behaviors and apparent stereotyping we �nd may provide some
clues into why gender and beauty are so important in the labor market.
The experimental setting we consider is a repeated linear public goods game.
While not a direct test of the beauty premium or the wage-gap found in the
labor market, a public goods game is nonetheless an interesting institution for
exploring how such wage di¤erences can emerge in an employment setting. People
often work in teams where shirking cannot always be perfectly monitored. This
allows for stereotyping to color evaluations of and reactions to both free riding and
generosity, and to a¤ect the productivity of the team. A repeated public goods
game o¤ers a setting where stereotyping is possible (in groups of more than two)
1An important exception to this is research by Mobius and Rosenblat (2006) who use a labormarket experiment to decompose the beauty premium. In their experiment, an employer receivesa precise measure of a worker�s productivity from a practice round and decides a wage to pay theworker. The interaction between the employer and worker is one shot, so the employer cannotverify if a beautiful worker was as productive as originally thought.
1
and people have an opportunity to see if their expectations of behavior mesh with
actual behavior. When e¤ort is observable, certain people can �set the tone�for
the work group. Gender and beauty may a¤ect which people in the group may be
emulated by others, how much retribution people take against shirkers and how
much cooperation is used to reward generosity. In the end, the beauty and gender
of the individuals in the group will a¤ect the cooperation and success of the group
as a whole, and the earnings of its individual members.
In our experiment we show each player the digital photos of all other members
of their group each round. We have two conditions, one in which only total group
contributions are revealed, and another in which information on each player�s
contribution is revealed.
Our experiments �nd evidence for a beauty premium. This premium, however,
disappears once people know exactly what each group member contributed to the
public good. When only the total group contribution is observable, attractive men
and women make more money than unattractive men and women, even though
they are no more or less cooperative, on average, than unattractive people. When
individual contributions are observable, the reward to being beautiful disappears.
People seem to expect beautiful people to be more cooperative than others, and
when their behavior does not meet expectations, people are less cooperative with
them. There is also a di¤erence in payo¤s for men and women, but not always
favoring men. Women make more money than men when only group contributions
are known. This can be attributed primarily to the stereotype that women are
more helpful. Men, however, do best when individual contributions to the group
are clearly identi�ed. Men earn 15% more when individual contributions are
known, compared to when only group contributions are known. Interestingly,
women�s payo¤s do not change. This e¤ect can be attributed entirely to men
being better �leaders.� They contribute their full endowment more often, and
others follow their good example by contributing more in later rounds.
With these results, we begin to see some of the underlying factors that could
generate both a beauty premium and a wage gap, especially in team work envi-
2

ronments. People give beautiful people the bene�t of the doubt in groups and
cooperate more with them, thereby enhancing group welfare. Women earn more
than men when individual contributions to group output are unknown because
they are stereotyped overall to be more helpful. However, once individual con-
tributions are known with certainty, the beauty premium disappears and a male
premium replaces it. This appears to be due to people being more willing to fol-
low the lead of generous men. When a man�s generous contribution is observed,
it engenders more cooperation than a similar contribution by a woman. This ef-
fect is ampli�ed when the proportion of men in the group is higher, suggesting a
kind of generosity-competition among men. As a result, men earn more money in
the experiment when individual contributions to group output are known. In our
data, the male premium is almost equal in size to the beauty premium.
Why are these results important? They illustrate how easily subtle sex and
beauty stereotypes can in�uence economic outcomes, and suggests that further
study on the role of stereotypes in economics could yield important insights.
2. Background
In our experiment subjects see the digital photos of their partners on the computer
screen when they make their decisions. In half of our sessions we also tell subjects
what each member contributed in the prior round. There are three ways this
could have an e¤ect. Simply showing faces could matter, gender and beauty
could matter, and �nally the information on amounts given could matter.
There is good reason to expect that simply seeing the faces of partners will
a¤ect play. Bohnet and Frey (1999a,b) �nd that visual identi�cation increases
cooperation in one-shot Prisoner�s Dilemma and Dictator games, and Burnham
(2003) reports that giving more than doubles in Dictator games when at least
one of the partners sees the other�s photograph. Scharlemann, Eckel, Kacelnik,
and Wilson (2001) see slightly more cooperation when subjects are faced with
a photograph of smiling bargaining partners, and Eckel and Wilson (2006) �nd
3
subjects are more trusting when they see their partner. Solnick and Schweitzer
(1999) report a signi�cant e¤ect of attractiveness on o¤ers received and responses
made in ultimatum bargaining games.
Gender also has been shown to have an important e¤ect on behavior and
payo¤s. Eckel and Grossman (1998) �nd groups of women to be more generous
than groups of men in Dictator games, while Andreoni and Vesterlund (2001) �nd
women more equalitarian than men in Dictator Games. Buchan, Croson, and
Solnick (2003) report that women are less trusting but more trustworthy than
men in an investment game. Gneezy, Niederle, and Rustichini (2003) �nd women
to be more productive in competitive-pay environments when in same-sex groups,
rather than mixed-sex groups.2 Mobius and Rosenblat (2006) use a labor market
experiment to decompose the beauty premium.
There is also experimental evidence from the sociology and psychology liter-
ature that beauty carries a premium. In Prisoner�s Dilemma games, people are
more cooperative with attractive partners (Mulford, Orbell, Shatto, and Stockard,
1998). Indeed, in a comprehensive review of the literature on beauty, Langlois,
Klakanis, Rubenstein, Larson, Hallam and Smoot (2000) �nd that attractive peo-
ple are not only judged and treated more favorably but they also behave di¤erently.
Finally, simply knowing what each other player has chosen can also have an
impact. For instance, Andreoni and Petrie (2004) �nd that cooperation is highest
when actions can be linked to the actor. Sell and Wilson (1991) also �nd posi-
tive e¤ects when information is available. But, information may also help adjust
judgements. Social expectancy theory predicts that if people have di¤erent expec-
tations of how, for instance, attractive and unattractive others will behave, then
they may have totally di¤erent reactions to the same observed behavior depend-
ing on which person they are facing (Darley and Fazio, 1980; Zebrowitz, 1997).
Furthermore, psychologists suggest that people come to the table with prejudices
and stereotypes. However, after meeting someone and gaining more information,
these prejudices are often revised or washed away (Devine, 1989). Related to
2See Eckel and Grossman (2000) for a review of gender di¤erences in laboratory experiments.
4
this are issues of similarity and familiarity. People tend to favor those similar to
themselves (McPherson, Smith-Lovin and Cook, 2001), and working with famil-
iar others can reduce transaction costs, as familiarity can enhance trust (Glaeser,
Laibson, Scheinkman, and Soutter, 2000).
This suggests that people may behave di¤erently with others when they know
their decisions, rather than just their appearance, and that people may want to
emulate the choices of �similar�others. Also, people can use their choices to signal
information to others in order to establish a link later (such as getting a date).
Identi�cation may not only serve to help form impressions before actions, but peo-
ple may also use identi�cation as a guideline for judging actions and formulating
a response.
3. Methodology
Our experiments use a linear public goods game. The game is repeated, and
subjects make their decisions on a computer. Each session has 20 subjects, and
they are randomly divided into 4 groups of 5 subjects. In each round a subject is
endowed with 20 tokens that could be invested in a private good or a public good.
The private good pays $0.02 per token invested by the individual, and the public
good pays $0.01 per token invested by the entire group. Therefore, the marginal
return to investing in the public good is 0.5. Each subject is paid based on his
investment in the private good and the total group investment in the public good.
Subjects play with the same group of 5 people for 8 rounds, then are randomly
re-matched to new groups for another 8 rounds, until they play with �ve di¤erent
groups, each for 8 rounds. So, subjects play 40 rounds in total in each session.3
A digital passport-style photograph is taken of each subject at the beginning
of the experimental session. The photo is from the shoulders up and is displayed
on top of the screen while subjects make decisions. At the end of each round, the
3Very few subjects knew other subjects in the experiment (87% of the subjects had �nevermet�any other subject in the experiment).
5

total amount contributed to the public good by all group members is reported.
There are two treatments: No Information and Information.4 In the Information
treatment, both the photo and the contribution of that group member from the
previous round are displayed. The contribution is listed below each photo, and
the photos are rearranged each round with the highest contributor on the left
and the lowest on the right. In the No Information treatment, only the photos of
each group member are displayed on the screen and no information on individual
actions is given.
All treatments were conducted twice. This gives us 80 subjects in total. Sub-
jects were recruited from economics and business classes at the University of Wis-
consin - Madison. There were 39 female subjects and 41 male subjects in total,
ranging in age from 18-29 years (mean 20.3 years old). Each experimental ses-
sion took about an hour and a half, and the average subject payment was $26.46
(standard deviation $3.13).
Subsequently, people not involved in the experiments rated each photo as to
the person�s physical attractiveness or how helpful looking he/she appears. In
total, the raters saw 140 photographs. These photos were of the 80 subjects in
the No Information and Information treatments and 60 other photos of subjects
in two other public goods game treatments.5 These other treatments were not
used here as they do not allow a clear test of beauty and gender e¤ects.
We chose to have the raters view the 80 subjects randomly mixed among
the other 60 photos to get a �global� measure of physical attractiveness and
helpfulness. We want to know if a subject is considered physically attractive
among his or her peers, not only among the subjects in the session. Drawing
on this broader distribution of 140 photographs gives us more information and
4Note that, in Andreoni and Petrie (2003), the No Information treatment is called �Photos�and the Information treatment is called �Information-and-Photos.�
5The photos of the 60 other subjects come from the same cohort as the 80 subjects in the NoInformation and Information treatments. They were recruited at the same time as the 80 othersubjects from economics and business school classes at the University of Wisconsin-Madison.Of the 60 subjects, 33 are male and 27 are female, ranging in age from 18-28 years (mean: 20.1years old).
6

con�dence in our classi�cation and subsequent results.
Each rater rates all 140 photographs along one dimension, physical attractive-
ness or helpfulness. The raters view the photos on the computer in a random
order, assign a rating, and have the ability to move back to previously rated pho-
tos to change or check ratings. Raters know they can do this before they begin
rating. The raters use a 9-point scale, with 1 indicating �not at all�and 9 indicat-
ing �very much so.�Raters are told to think of the number 5 as average. There
are 15 raters in total. Four women and four men rated each photo in terms of
physical attractiveness, and four women and three men rated each photo in terms
of helpfulness. The raters were all undergraduates of the University of Wisconsin-
Madison, with an average age of 20.7. The raters were paid a �at fee of $15 to
rate 140 photographs, and the rating task took 30-45 minutes to complete.
4. Beauty Classi�cation
In this section we discuss our beauty classi�cation methodology, the reliability
across those rating beauty, and explain how we de�ne attractiveness.
First, we assume the raters use all 140 photos as a frame of reference. When
discussing consensus among raters, therefore, we consider the consensus for all 140
photos. Also, when de�ning attractiveness, we use all 140 photos as the entire
frame of reference.6
Turning to the consensus among raters, the inter-rater reliability for physical
attractiveness is 0.86, and for helpfulness it is 0.82.7 These reliability measures
6Note that similar, yet not as strong, results hold if we de�ne the frame of reference to beonly the 80 photos of the subjects in the Information and No Information treatments. So, itappears that the frame of reference is important in de�ning who is attractive. We opt to basethe analysis of this paper on the larger frame of reference because it improves the accuracy andpredictive power of our ratings.
7We use the Cronbach coe¢ cient alpha for standardized variables (Cortina, 1993; SAS Insti-tute Inc., 1988). This measures the correlation between all raters and adjusts for rater speci�cmean and variance. While this rating raises automatically as the number of raters increases (wethank Daniel Hamermesh for pointing this out), we report it in order to compare with otherstudies using attractiveness ratings. Using an alternative measure of reliability, an intra-class
7

compare well with previous research on attractiveness and suggest a strong con-
sensus among raters. Our reliability measures also compare well with previous
research on attractiveness, where the range of reliability measures is between 0.85
and 0.95 (Langlois et al., 2000).8
There is some variability in the spread and average rating any given rater
gave. Some raters use the entire range from 1 to 9, but others truncate the range
between 3 and 8. Therefore, each rater�s ratings of all photos are standardized
by the rater�s mean and standard deviation, resulting in mean zero and standard
deviation of one. Then, for each subject, we average the standardized ratings
across all raters to give a value of physical attractiveness and helpfulness for each
subject. These averaged standardized ratings are used throughout the paper.
Overall, women are rated signi�cantly higher in attractiveness than men.
Women receive an average standardized rating of 0.29 and men -0.26. The same
holds for helpfulness. Women were rated, on average, at 0.25 and men at -0.22.
That is, women are considered more attractive and more helpful-looking than
men.
There are, obviously, many ways of de�ning an attractive person. Because we
wish to examine the e¤ects of beauty on earnings and women are disproportion-
ately rated more attractive than men, we take into consideration both gender and
beauty rating in our classi�cation. Of the 140 subjects, 66 are women and 74 are
men. For women, we took the top quartile of the distribution of attractiveness
ratings for these 66 women and classi�ed them as attractive. We did the same for
the men. Then, we took the bottom quartile of the distribution of attractiveness
ratings for the 66 women and classi�ed them as unattractive. We did the same
for men. Anyone in the middle of the distribution was classi�ed as middle attrac-
correlation coe¢ cent (two-way random e¤ects model), we �nd similar results. The ICC coef-�cient is 0.7506. We also �nd strong agreement among men and women in terms of who isattractive.
8Langlois et al. (2000) report an acceptable range of reliability measures is between 0.85 and0.95. The fact that measures fall on the lower end of this range and re�ect our 9�point scale.Most scales were 5-point or 7-point.
8

tive. For robustness, we repeated our analysis with both more and less exclusive
de�nitions, with nearly identical results.9 This classi�cation of subjects is also
within the range used by Hamermesh and Biddle (1994), where between 25%-34%
of their samples were classi�ed as above average or higher in attractiveness.10
Table 1Distribution of Attractiveness
Women MenAttractive 8 8Middle 19 25Unattractive 12 8Total 39 41
The distribution for the 80 subjects considered here is shown in Table 1.11
By de�nition, there are roughly an equal number of men and women classi�ed as
attractive.12
5. Results
We �rst discuss the beauty premium, then gender di¤erences in payo¤s, and �nally
the interaction of beauty and gender.
9We also classi�ed subjects as attractive and unattractive by using the 20th-percentile andthe 30th-percentile. Results using the 20th-percentile cut-o¤ are strikingly similar to thoseusing the quartile cut-o¤. Results using the 30th-percentile cut-o¤ follow similar trends to thoseusing the quartile cut-o¤, however some results that are statistically signi�cant with the quartilecut-o¤ are not with the 30th-percentile cut-o¤.10Note that Hamermesh and Biddle (1994) did not use the same range of their data to classify
people as unattractive. Between 7%-17% of their samples were classi�ed as below average orlower in attractiveness.11When we did not condition on gender, the distribution of attractive, middle attractive and
unattractive subjects across men and women was skewed. 14 women and only 3 men wereclassi�ed as attractive, and 14 men and only 4 women were classi�ed as unattractive.12The distributions of attractiveness are similar across the 140 subjects and the sample of 80
subjects. The hypothesis of independence across the two distributions cannot be rejected by aChi-Square test (p-value=0.761).
9
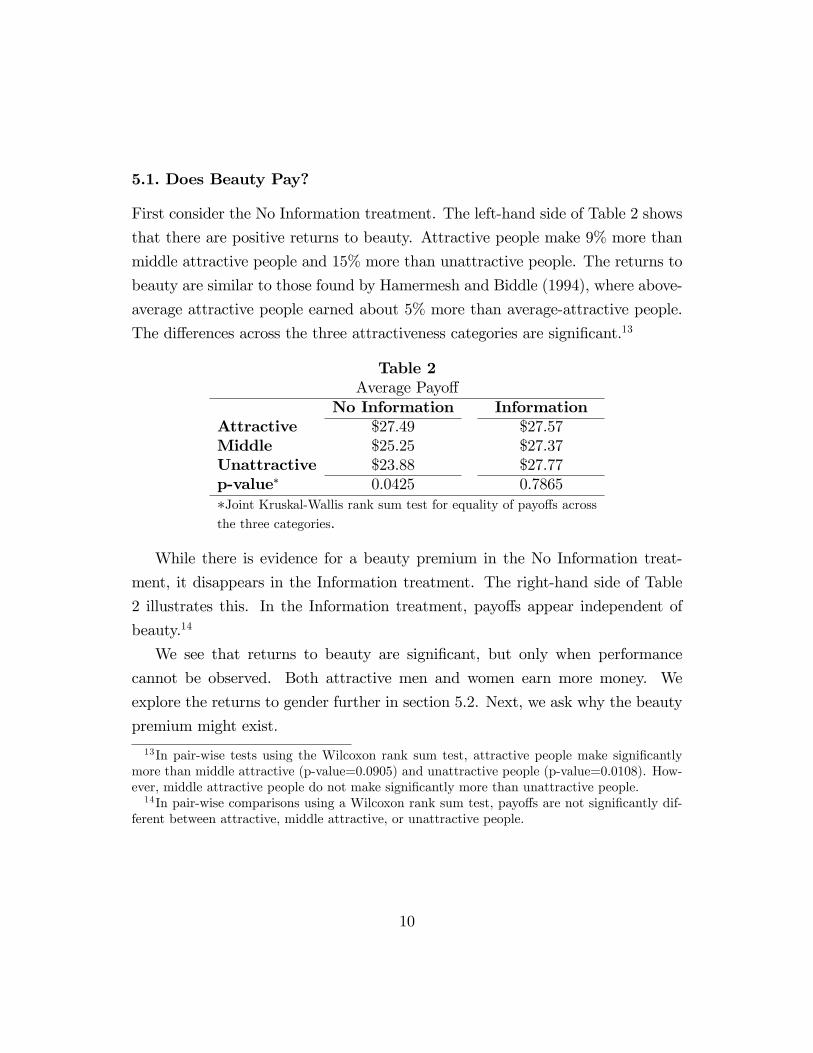
5.1. Does Beauty Pay?
First consider the No Information treatment. The left-hand side of Table 2 shows
that there are positive returns to beauty. Attractive people make 9% more than
middle attractive people and 15% more than unattractive people. The returns to
beauty are similar to those found by Hamermesh and Biddle (1994), where above-
average attractive people earned about 5% more than average-attractive people.
The di¤erences across the three attractiveness categories are signi�cant.13
Table 2Average Payo¤
No Information InformationAttractive $27.49 $27.57Middle $25.25 $27.37Unattractive $23.88 $27.77p-value� 0.0425 0.7865�Joint Kruskal-Wallis rank sum test for equality of payo¤s across
the three categories.
While there is evidence for a beauty premium in the No Information treat-
ment, it disappears in the Information treatment. The right-hand side of Table
2 illustrates this. In the Information treatment, payo¤s appear independent of
beauty.14
We see that returns to beauty are signi�cant, but only when performance
cannot be observed. Both attractive men and women earn more money. We
explore the returns to gender further in section 5.2. Next, we ask why the beauty
premium might exist.
13In pair-wise tests using the Wilcoxon rank sum test, attractive people make signi�cantlymore than middle attractive (p-value=0.0905) and unattractive people (p-value=0.0108). How-ever, middle attractive people do not make signi�cantly more than unattractive people.14In pair-wise comparisons using a Wilcoxon rank sum test, payo¤s are not signi�cantly dif-
ferent between attractive, middle attractive, or unattractive people.
10
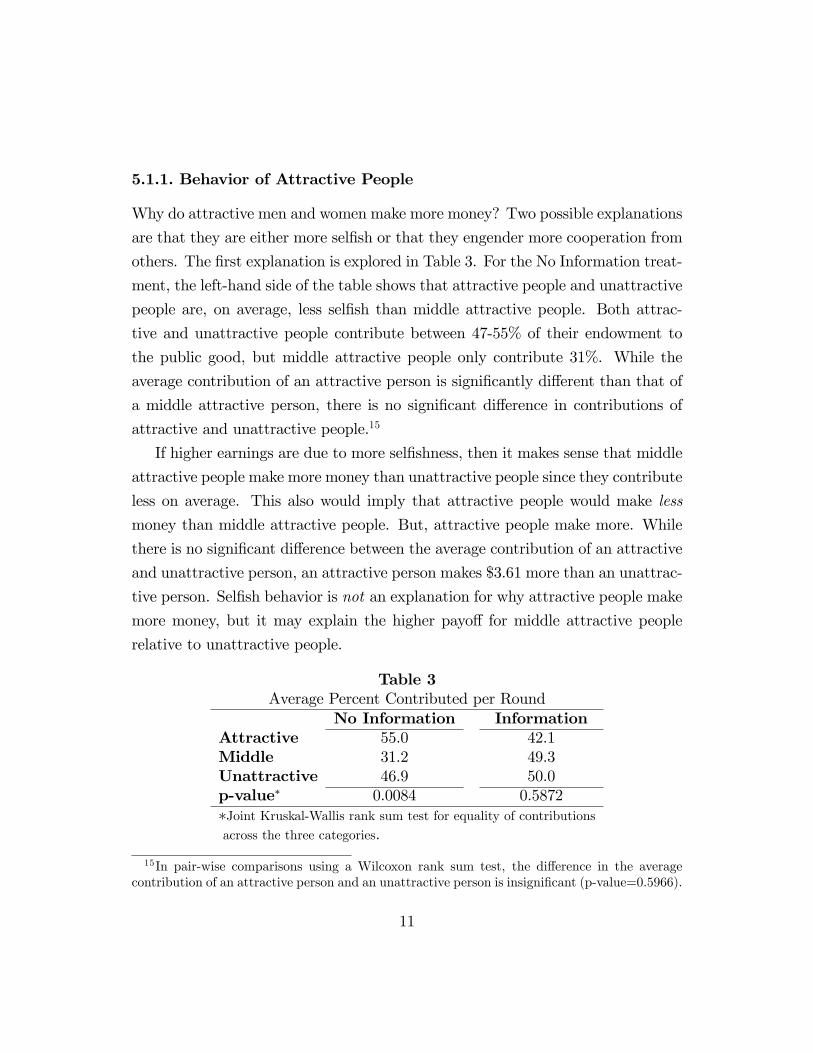
5.1.1. Behavior of Attractive People
Why do attractive men and women make more money? Two possible explanations
are that they are either more sel�sh or that they engender more cooperation from
others. The �rst explanation is explored in Table 3. For the No Information treat-
ment, the left-hand side of the table shows that attractive people and unattractive
people are, on average, less sel�sh than middle attractive people. Both attrac-
tive and unattractive people contribute between 47-55% of their endowment to
the public good, but middle attractive people only contribute 31%. While the
average contribution of an attractive person is signi�cantly di¤erent than that of
a middle attractive person, there is no signi�cant di¤erence in contributions of
attractive and unattractive people.15
If higher earnings are due to more sel�shness, then it makes sense that middle
attractive people make more money than unattractive people since they contribute
less on average. This also would imply that attractive people would make less
money than middle attractive people. But, attractive people make more. While
there is no signi�cant di¤erence between the average contribution of an attractive
and unattractive person, an attractive person makes $3.61 more than an unattrac-
tive person. Sel�sh behavior is not an explanation for why attractive people make
more money, but it may explain the higher payo¤ for middle attractive people
relative to unattractive people.
Table 3Average Percent Contributed per Round
No Information InformationAttractive 55.0 42.1Middle 31.2 49.3Unattractive 46.9 50.0p-value� 0.0084 0.5872�Joint Kruskal-Wallis rank sum test for equality of contributions
across the three categories.
15In pair-wise comparisons using a Wilcoxon rank sum test, the di¤erence in the averagecontribution of an attractive person and an unattractive person is insigni�cant (p-value=0.5966).
11

For the Information treatment, the right-hand side of Table 3 shows that
attractive people contribute less than middle attractive and unattractive people.
However, the di¤erence in contributions is not signi�cant, nor are their payo¤s in
Table 2.16
We do not �nd evidence that the beauty premium observed in the No Informa-
tion treatment is due to more sel�sh behavior by attractive people. Indeed, there
are no clear trends in contribution behavior and payo¤s. Attractive people are
no more cooperative than unattractive people, but they still make more money.
This suggest that the di¤erence in payo¤s may be due to how others respond to
beauty. We explore this next.
5.1.2. Favoritism and Beauty Stereotypes
Could the observed beauty premium be due to favoritism towards attractive peo-
ple? If favoritism exists, then we would expect people to react more cooperatively
with attractive people than with people who are not attractive. Table 4 explores
this hypothesis. We compare the average contribution of nonattractive people
(those who are classi�ed as middle and unattractive) in groups with no attractive
people and in groups with at least one attractive person. We concentrate on the
contributions of nonattractive people because we want to isolate the e¤ects of
beauty in a group on the behavior of others.
16In pair-wise comparisons using a Wilcoxon rank sum test, there are no signi�cant di¤erencesin the average contribution of attractive, middle attractive, or unattractive people.
12

Table 4Average Percent Contributed by Nonattractive People
in groups of Attractive People, All Rounds# of Attractivepeople in group No Information Information All0 29.8 53.8 42.21 or more� 41.4 44.8 43.0p-value 0.0023 0.0234 0.7477�In the No Information treatment, there are 14 groups with one attractive person,6 with two attractive people, 2 with three attractive people, and 2 with four
attractive people. In the Information condition, there are 11 groups with one
attractive person, 7 with two attractive people, and 5 with three attractive people.
Table 4 shows that the contributions of nonattractive people depend on the
beauty of the other group members. In the No Information treatment, the presence
of beauty in the group does engender more cooperation. The average percent
contributed in groups with no attractive people is 29.8%, but in groups with at
least one attractive person, the average increases to 41.4%.17 This di¤erence is
signi�cant and suggests the presence of beauty may engender more cooperation.
In the Information treatment, however, it is the absence of beauty that engenders
more cooperation. The average contribution in groups with at least one attractive
person is 44.8%, but in groups with no attractive people, it increases to 53.8%.
This di¤erence is also signi�cant, but it contradicts favoritism.
Why do nonattractive people reverse their behavior from one treatment to the
next? One hypothesis is rooted in beauty stereotypes and reciprocity. That is,
people are more cooperative with attractive people because they believe attractive
people are helpful. Langlois et al. (2000) found, in a comprehensive review of the
beauty literature, that attractive people are consistently judged and treated more
positively. We also �nd this in our ratings data. Thirty-eight percent of attractive
subjects are also judged helpful looking, 18% of middle attractive people are also
17Similar results hold if we include the contributions of attractive people. In this case, con-tributions increase to 46.2% in the No Information treatment and decrease to 44.8% in theInformation treatment. This suggests that it is not merely nonattractive people who are af-fected by the presence of attactive people in the group.
13

judged helpful looking, but only 5% of unattractive people are judged helpful
looking. This is remarkable because these ratings are by people who did not
observe the decisions of the individuals in the photos and they did not rate the
subjects in terms of attractiveness. This suggests that people independently expect
attractive people to be more cooperative.
While there may be reason to believe such a stereotype exists, it is a bit
tricky to tease apart because people may hold stereotypes but not act upon them.
However, Devine (1989) argues that if people hold stereotypes, once they meet
a stereotyped individual and gain more information, they revise or eliminate the
stereotype. That is, without information, they act upon the stereotype, but with
information, behavior changes. How behavior changes depends on how people
revise or react to behavior that does not coincide with the stereotype.
If people hold the stereotype that attractive people are cooperative and people
wish to reciprocate cooperation, then we should see changes in behavior in two
ways. First, without information, people should be more cooperative with attrac-
tive people. Evidence for this behavioral change can be found in Table 4. Without
information, we see that nonattractive people are more cooperative in groups with
attractive people than in groups with no attractive people, even though we know
that attractive people contribute the same, on average, as unattractive people.
This result also holds across rounds. There is higher cooperation in groups with
attractive people in every round of the 8-round sequence, with the di¤erence
increasing over the rounds. In round one, the di¤erence in cooperation is 10.4
percentage points, and in round eight, it is 18.0 percentage points.
Second, with information, we should see di¤erences in behavior in groups with
attractive people and in groups without attractive people because people can now
compare how the actions of attractive people di¤er from their expectations. How
behavior changes depends on whether deviations from expectations are rewarded
or punished.18 In Table 4, we see that with information, on average, nonattractive
18Bosman and van Winden (2002) �nd that subjects that expected their partners to sharemore of the pie than they actually did were more likely to punish in a power-to-take game.
14
people are more cooperative in groups with no attractive people. They contribute
20% more.
Could this be punishment of behavior that does not meet expectations? We
think so. Looking at behavior in the early rounds of the experiment, when people
do not have any information on actual behavior, we see that average contributions
are higher in groups with at least one attractive person compared to groups with
no attractive people. Contributions are 52% and 44% respectively in the very
�rst round. This pattern holds for the �rst three rounds. By round four though,
contributions in groups with at least one attractive person start to decline rapidly,
and by round 8, contributions are 28% in groups with at least one attractive
person and 45% in groups with no attactive people. Contributions remain higher
in groups with no attractive people for the remainder of the 40 rounds of the
experiment.
What is remarkable about this result is that if people base reciprocity solely
on met or unmet expectations on behavior, then there should be no di¤erence in
Table 4. The presence of an attractive person in the group should not matter.
That it does suggests that people react di¤erently to the same actions of attractive
and unattractive people.19
In sum, it appears that people discriminate based on beauty stereotypes. At-
tractive men and women are given the bene�t of the doubt when group members
do not see performance, even though they contribute amounts similar to unattrac-
tive men and women. Indeed, the presence of beauty engenders more mutual
cooperation, and this may explain the beauty premium. However, when group
members can evaluate performance, the presence of beauty engenders less cooper-
ation. People seem to expect attractive men and women to be more cooperative
than average. When they are not, others are less cooperative with them, and the
beauty premium disappears.
19In the very �rst round of the experiment, before any experience is gained with attractivepeople, there is no signi�cant di¤erence across treatments in the average contribution of nonat-tractive people in groups with attractive people. This suggests that subjects start out with thesame beliefs across treatments over the actions of attractive people.
15
5.1.3. Gender Di¤erences in Beauty Stereotypes
Does favoritism di¤er by gender? In the No Information treatment, it does not.
Both nonattractive men and women are signi�cantly more cooperative in groups
with attractive people than in groups with no attractive people.
In the Information treatment, only men signi�cantly decrease their contribu-
tions in groups of attractive people compared to groups with no attractive people.
In groups with no attractive people, men contribute 59.9%, but this declines to
41.1% in groups with at least one attractive person. Women increase their contri-
butions, from 46.3% to 47.7%, but this is not signi�cant.20 This may mean that
nonattractive men and women may hold di¤erent beauty stereotypes. Or, they
may hold the same stereotype, but only men act upon it.
These results suggest that there are no gender di¤erences in favoritism, but
there may be in beauty stereotypes. In the No Information treatment, both men
and women are more cooperative with an attractive person in the group. Men
and women, however, react di¤erently to information and attractive people in the
group. In the Information treatment, the reduction in contributions in groups of
attractive people is driven by the actions of men.21
5.2. Does Gender Pay?
We now move the focus from beauty to gender. Overall, men and women make the
same amount of money. Table 5 shows that both men and women make around
$26.50 over both treatments. However, women make $1.67 more than men in
the No Information treatment, and men make $1.38 more than women in the
Information treatment. The former di¤erence is signi�cant at the 10% level, and
the latter is not.20Strikingly similar results hold if attractive men and women are included in the average.21Fershtman and Gneezy (2001) also �nd that men are more apt to hold and act on stereotypes.
Using trust experiments, they �nd that men in Isreali society are more likely to act on ethnicstereotypes than women.
16

Table 5Average Payo¤Women Men p-value*
Both Treatments $26.50 $26.41 0.9463
No Information $26.22 $24.55 0.0962Information $26.80 $28.18 0.1162p-value* 0.5273 0.0002�Pair-wise Wilcoxon test for equality of payo¤s across the twotreatments/genders.
Within gender, women make about the same across treatments. They make
$26.22 in No Information and $26.80 in Information. By contrast, the payo¤ for
men is 15% higher in the Information treatment compared to the No Information
treatment. This di¤erence is signi�cant.
There is a gender di¤erence, but that switches from favoring women to men
when actions are known. There are large bene�ts to information, but only men
reap them. Again, there are two possible explanations. Women could be more
sel�sh than men, or men may engender more cooperation with their performance
than women. We discuss these possibilities next.
5.2.1. Behavior of Men and Women
Are women more sel�sh than men? Table 6 shows that, on average, women are
no more or less cooperative than men� men give roughly 15% more than women,
but this is not signi�cant. However, men play the extremes signi�cantly more
than women.22 Men contribute zero tokens 27.7% of the time, but women do so
only 16.3% of the time. Women also contribute all of their tokens only 9.4% of
the time, compared to men who do so 22.1% of the time. Similar results hold for
each treatment separately.
22Men are found to have higher variance in behavior relative to women in other research. An-dreoni and Vesterlund (2001) �nd that men are more likely to be completely sel�sh or completelyaltruistic. Pinker (2002) �nds higher variance in the IQ scores of men relative to women.
17

Table 6Average Contribution, Zero Tokens, and All Tokens
Both TreatmentsMen Women P-value
Average Contribution (%) 46.7 40.7 0.1938% of Times Zero Tokens 27.7 16.3 0.0594% of Times All Tokens 22.1 9.4 0.0012
This suggests that the gender premium to women is not due solely to more
sel�shness on their part. Women seem to be bene�ting from a combination of their
slightly lower contributions and their beauty. While they are not signi�cantly more
sel�sh, they are more beautiful, and returns to beauty are high. We return to the
interaction of beauty and gender in Section 5.3. First, we address the question of
why men do better in the Information treatment than women.
Table 7OLS Regression Coe¢ cients
Dependent Variable: Average Contribution to the GroupPooled Data
Model 1 Model 2Constant 6.36 8.41
(0.0002) (0.0001)% Men in group other than self 3.07 -0.36
(0.0011) (0.7970)% Men in group other than self * Info 6.06
(0.0011)Individual Fixed E¤ects yes yesR2 0.62 0.63Note: p-values in parentheses, n = 400
5.2.2. �Good Examples�and Sex Stereotypes
Are people more cooperative with men than with women? Table 7 reports the
results of linear regressions showing how the average individual contribution to
the group is a¤ected by the gender composition of the group.23 The regressions23The dependent variable is the average amount a subject contributed to a group over the 8
rounds he played with that group. That is, the average that individual i contributes to group
18
include individual �xed e¤ects.24 Model 1 shows that, over both treatments, as
the number of men in the group increases,25 the average individual contribution
of group members increases as well.26 These e¤ects are signi�cant. This suggests
that people cooperate more with men than with women, even though Table 6
showed that men give no more on average than women.
When we consider treatment e¤ects, Model 2 shows that, with information,
the cooperation e¤ect of more men in the group increases two fold.27 Without
information, the e¤ect is not signi�cantly di¤erent from zero. That is, people are
more cooperative in groups with more men only when performance is observable.28
For example, the average individual contribution to a group where half of the
group, other than oneself, is comprised of men will be about 3 tokens higher in
the Information treatment than in the No Information treatment.
Could this signi�cant increase in cooperation with information be explained
by favoritism based on sex stereotypes? If people expect attractive people to be
more cooperative, could they also expect women to be more cooperative, especially
since they are rated higher in attractiveness? From our ratings data on helpfulness,
indeed, more people expect women to be helpful than men, but, perhaps more
importantly, more people expect men to be more unhelpful than women.29 Forty-
j is de�ned as gij =P8
t=1 gijt=8. Each subject plays with 5 di¤erent groups, so in total, thereare 400 observations for the 80 subjects.24These are captured with identi�cation dummy variables. Note that these variables also
capture the treatment e¤ects of information.25This is the percent of men in the group other than the subject himself. So, for a group with
three men and two women, each man would have 50% of the group as men, and each womanwould have 75% of the group as men.26The dependent variable, average contribution to the public good, is censored at zero and
20 since subjects are only endowed with 20 tokens in each round. Although the models inTable 7 were run as OLS linear regressions, very similar results hold if the models are run as adouble-truncated Tobit.27Across treatments, there is no signi�cant di¤erence in the distribution of the gender compo-
sition of groups. The p-value for a Fischer Exact test is 0.522. Thus, the signi�cant treatmente¤ects are not due to one treatment having more groups with more men than the other treat-ment.28Note that this e¤ect also holds for both men and women separately.29Twenty-�ve percent of women are rated in the upper quartile of helpfulness compared to
19

one percent of men are rated as unhelpful, but only 10% of women are rated as
such.
This would suggest that people are more cooperative as the number of men in
the group increases because they discover that men are not as unhelpful as they
expected. So, even though men give no more on average than women, men may
be able to engender more cooperation because they exceed expectations.
Perhaps a stronger explanation of men�s ability to engender cooperation may
come from the �good example� that they set. As noted earlier, men are more
likely than women to contribute nothing or contribute their full endowment, but
as the number of men in the group increases, the probability of contributing zero
declines. A Tobit regression on the average probability of contributing zero in a
group shows a signi�cant decline in this probability as the percent of men in the
group increases.30 This holds for pooled data, for men only, and for women only.31
While the probability of contributing the �bad�extreme declines with the pres-
ence of more men, the probability of contributing the �good�extreme increases,
but only for men. Table 8 shows how the average probability that a man will
contribute the full endowment to the group changes as the percent of men in the
group increases.32 The results for women are similar, but insigni�cant. Model 1
shows that men are more likely to contribute all of their tokens as the percent of
men in the group increases, and Model 2 shows that, when performance is known,
men are almost twice as likely to contribute the full endowment.
12% of men.30The dependent variable is the average probability that a subject contributed zero tokens
to a group over the 8 rounds he played with that group. That is, the average probability thatindividual i contributes zero tokens to group j is de�ned as pij =
P8t=1 I(1jgi = 0)ijt=8, where
I(�) is an indicator function that equals 1 when the contribution was 0 tokens. The coe¢ cienton the variable �% men in group other than self�is, b� = �0:24 (s:d: = 0:07).31When performance is known, as in Model 2 in Table 8, the probability of free riding declines
even further, but the e¤ects are insigni�cant.32The dependent variable is the average probability that a subject contributed his full
endowment to a group over the 8 rounds he played with that group. That is, the aver-age probability that individual i contributes his full endowment to group j is de�ned aspij =
P8t=1 I(1jgi = 20)ijt=8, where I(�) is an indicator function that equals 1 when the contri-
bution was 20 tokens.
20

Table 8Tobit Regression Coe¢ cients
Dependent Variable: Average Probability of Contributing Full EndowmentMen Only
Model 1 Model 2Constant -0.29 0.04
(0.1683) (0.8543)% Men in group other than self 0.38 -0.15
(0.0221) (0.5533)% Men in group other than self * Info 0.87
(0.0076)Individual Fixed E¤ects yes yesLog-likelihood -87.20 -83.75Note: p-values in parentheses, n=205
This suggests that the reason that men make more money when performance
is known is because they put on a better performance, especially in the presence
of other men. Moreover, their performance may engender more cooperation from
others.33 While men free ride more than women, they also set a �good example�
more than women. As the composition of the group changes from women to men,
both men and women free ride less, but men set the �good example�even more.
This signi�cantly increases the contributions of others in the group, and men make
more money.
5.3. The Combined E¤ects of Beauty and Gender
Do the e¤ects of beauty and gender hold when we control for them together? Table
9 shows the e¤ects of beauty and gender on individual payo¤ in each group.34 The
33This result is consistent with Camerer, Ho, Chong, and Weigelt�s (2002) idea of �strategicteaching.� A person, recognizing that others learn in a repeated game, would make choicesto maximize long-run payo¤s. This would suggest that men set a good example to ensurecooperation, and higher earnings, in the future.34The dependent variable is the total payo¤ a subject earned in a group over the 8 rounds he
played with that group. Each subject plays with 5 di¤erent groups, so in total, there are 400observations for the 80 subjects.
21
regressions control for individual and group e¤ects.35
In the pooled data, the beauty premium holds for attractive and middle at-
tractive people, even when controlling for the beauty and gender composition of
the group. Looking at men and women separately, it is attractive women that gain
the beauty premium, but for men, only middle attractive men earn signi�cantly
more.
Interestingly, even when controlling for individual beauty, both men and women
earn more money when the number of attractive people in the group increases.
The premium to being in the presence of beauty, however, only holds when in-
dividual performance is unknown. Once the group knows what each individual
member contributes, the premium disappears.
Table 10 shows the e¤ects of beauty and gender on average contributions in
each group.36 As with the payo¤ regressions, these control for individual and
group e¤ects.
35To address unobservable correlation across individuals and across individuals in the samegroup, the estimates use a two-way random e¤ects error correction model.36The dependent variable is the average contribution a subject makes in a group over the 8
rounds he played with that group. Each subject plays with 5 di¤erent groups, so in total, thereare 400 observations for the 80 subjects.
22

Table 9OLS Regression Coe¢ cients
Dependent Variable: Total Individual Payo¤ (sum across all 8 rounds) with a GroupPooled Women Men(n=400) (n=195) (n=205)
Constant 3.98 4.33 4.13(0.31) (0.47) (0.36)
Attractive 0.58 0.62 0.22(0.24) (0.33) (0.36)
Middle Attractive 0.44 0.22 0.58(0.18) (0.27) (0.24)
# Attractive people in group other than self 0.53 0.55 0.49(0.11) (0.12) (0.13)
% Men in group other than self 0.63 0.36 0.10(0.41) (0.58) (0.58)
Info 0.91 0.09 0.76(0.43) (0.62) (0.54)
Attractive*Info -0.48 -0.42 -0.56(0.34) (0.46) (0.50)
Middle Attractive*Info -0.38 -0.20 -0.69(0.24) (0.35) (0.38)
# Attractive people in group other than self*Info -0.66 -0.72 -0.50(0.16) (0.18) (0.19)
% Men in group other than self * Info 0.62 1.51 1.72(0.57) (0.79) (0.82)
Individual & Group Random E¤ects yes yes yesR2
0.19 0.17 0.22Note: standard errors in parentheses, and signi�cant values (p-value < 10%) in bold.
23

Table 10OLS Regression Coe¢ cients
Dependent Variable: Average Contribution to the GroupPooled Women Men(n=400) (n=195) (n=205)
Constant 9.81 8.35 10.05(1.60) (2.29) (1.89)
Attractive 1.11 0.29 4.01(1.63) (2.25) (2.47)
Middle Attractive -2.98 -2.06 -4.12(1.29) (1.92) (1.75)
# Attractive people in group other than self 1.05 1.07 0.65(0.45) (0.49) (0.56)
% Men in group other than self -2.51 -1.36 -0.73(1.94) (2.37) (2.35)
Info -2.49 -2.12 -3.20(2.21) (2.95) (2.92)
Attractive*Info -2.13 -3.35 -2.94(2.26) (3.19) (3.46)
Middle Attractive*Info 3.48 0.52 5.75(1.77) (2.54) (2.75)
# Attractive people in group other than self*Info -1.32 -0.47 -1.91(0.64) (0.70) (0.76)
% Men in group other than self * Info 7.20 7.21 7.17(2.64) (3.18) (3.28)
Individual & Group Random E¤ects yes yes yesR2
0.17 0.18 0.26Note: standard errors in parentheses, and signi�cant values (p-value < 10%) in bold.
Looking at contributions, we see that average contributions are higher in
groups with more attractive people, but only when individual contributions are
not revealed. Once individual contributions are revealed, people are less coop-
erative as the number of attractive people in the group increases. As we saw
previously, this change in behavior is driven by men. We also see that people
are more cooperative in groups with more men when contributions are known,
24

con�rming earlier results.
In sum, when controlling for individual beauty and gender and for the beauty
and gender composition of the group, our main results still hold. There is a
premium to beauty, but that premium disappears when performance is known.
Others also bene�t from being in the presence of beauty because people are more
cooperative. This monetary return, however, disappear when group members can
clearly identify individual contributions. People are far less cooperative as the
number of attractive people in the group increases. Being in a group with more
men does increase average contributions, but only when individual contributions
are observed.
6. Discussion and Conclusions
We used laboratory experiments to examine the returns to beauty and gender
in a public goods game. Group members were identi�ed with digital passport-
style photographs. In one treatment, group members knew only the total amount
contributed to the public good by the group, while in the other treatment they also
knew the exact contribution of each group member. Subjects�photos were later
independently rated in terms of physical attractiveness and how helpful-looking
the subject appears.
In general, our results show signi�cant and surprising e¤ects of beauty and
gender on earnings. When performance is unknown, people tend to reward beauty
and females. And, when performance is known, the beauty premium disappears
and the female premium switches to a male premium. These results appear to be
rooted in beauty and sex stereotypes and have three main components.
First, relative beauty is rewarded. Attractive people make more money than
middle attractive people, who in turn make more money than unattractive peo-
ple. This premium to beauty mirrors Hamermesh and Biddle�s (1994) results and
can be quite large. Attractive people earn 15% more than unattractive people.
This premium disappears, however, when actions are known. We �nd the beauty
25
premium is not due to the actions of attractive people, but seems to be due to the
expectations of how attractive people will behave, as suggested by psychologists�
social expectancy theory. People expect beautiful people to be more coopera-
tive, and thus behave more cooperatively toward them when they are in the same
group. But when information on decisions reveals that attractive people are no
more or less cooperative than others, contributions decline relative to groups with
no attractive people. This seems to re�ect disappointed stereotypes of attractive
people.
Second, women bene�t for being stereotyped as helpful. Women make 7%
more than men when contributions are not known. Looking more closely, we �nd
the higher payo¤ enjoyed by women is not due to more sel�shness on their part
but, rather, may be a consequence of their beauty and sex stereotypes. Women
are rated signi�cantly higher in attractiveness than men, and their higher payo¤
seems to be the reward to their beauty. Also, because women are stereotyped to
be more helpful than men, people are more cooperative in groups of women than
in groups of men when performance is unknown.
Third, when performance is known, the gender premium switches from a fe-
male premium to a male premium. That is, while women gain the bene�ts of
beauty, men gain the bene�ts of information. The payo¤ for men is 15% higher
when performance is known. The payo¤ for women does not change. Indeed,
this bene�t to information for men is comparable in value to the attractiveness
premium for women. Why do men attain this information bene�t and women do
not? With information on actions, groups with more men are able to engender
more cooperation from others. That is, they set good examples that are fol-
lowed by others. Free riding declines in groups with more men, and, in apparent
male-competition, men are more likely to contribute their full endowment as the
proportion of men in the group increases.
There are obvious implications of these results for experimental methodology.
Indeed, this work justi�es the extreme measures experimenters take to protect the
identities of subjects. But are there implications of the beauty and gender e¤ects
26

we found for the real world?
The most striking result from this research is that, on average, men and women
did not behave very di¤erently, and attractive people did not behave appreciably
di¤erently than unattractive people. Nonetheless, beauty and gender had signif-
icant e¤ects on earnings. This happened because beauty and gender a¤ect the
way people were treated by others.
Hamermesh and Biddle (1994) found that there is some sorting of beautiful
people into occupations in which employers report that looks may increase pro-
ductivity, such as in sales, but that this is not strong enough to explain much of
the premium to beauty. This leaves social e¤ects rather than productivity e¤ects
as the natural place to look for explanations. Our research suggests one e¤ect of
beauty is rooted in stereotypes. Beautiful people tend to be in more successful
teams because other team members are more cooperative in the presence of beau-
tiful people. This is true when e¤ort is not observable, and suggests that a beauty
premium may be more likely to exist when productivity is not perfectly observed,
implying that beautiful people may also sort into occupations where individual
productivity is di¢ cult to measure. This hypothesis could be examined with labor
market data.
The gender gap can also possibly be explained by a di¤erent stereotype for
men. While beautiful people bene�t from a stereotype of being more cooperative
teammembers, men in our experiment bene�t from exceeding the low expectations
others have for them. People seem to expect men to be less helpful than they are.
When they see men exceeding expectations, they respond by following their lead.
Men may be seen as better leaders despite the expectation that they are more
sel�sh. In addition, when men are in groups together, they bene�t from a kind
of male-competitiveness for contributing to the public good. In the end, men
are more likely to be in successful groups when information on contributions is
known, and the more men in the group the greater the advantage to men. This
again suggests hypotheses that can be tested with labor market data. Professions
where e¤ort can be veri�ed more easily may favor men, and male-dominated
27
professions may also have a bigger wage gap.
This paper illustrates the possibility for subtle stereotypes to have major eco-
nomic impacts. However, economists are only beginning to consider seriously
causes and consequences of stereotypes. Further work� including theory, policy
and experiments� could fruitfully shed light on this important issue.
28

References
Andreoni, James and Ragan Petrie (2004), �Public Goods Experiments Without
Con�dentiality: A Glimpse Into Fund-Raising,� Journal of Public Economics,
88(7-8), 1605-1623..
Andreoni, James and Lise Vesterlund (2001), �Which Is the Fair Sex? Gender Dif-
ferences in Altruism,�The Quarterly Journal of Economics, 116(1), 293-312.
Bohnet, Iris and Bruno Frey (1999a), �The Sound of Silence in Prisoner�s Dilemma
and Dictator Games,�Journal of Economic Behavior and Organization, 38, 43-57.
Bohnet, Iris and Bruno Frey (1999b), �Social Distance and Other-Regarding Behav-
ior in Dictator Games: Comment,�American Economic Review, 89(1), 335-339.
Bosman, Ronald and Frans van Winden (2002), �Emotional Hazard in a Power-to-
Take Experiment,�The Economic Journal, 112, 147-169.
Buchan, Nancy, Rachel Croson and Sara Sonick (2003), �Trust and Gender: An
Examination of Behavior, Biases, and Beliefs in the Investment Game,�Working
Paper, The Wharton School, University of Pennsylvania.
Burnham, Terence (2003), �Engineering Altruism: a Theoretical and Experimental
Investigation of Anonymity and Gift Giving,�Journal of Economic Behavior and
Organization, 50, 133-144.
Camerer, Colin, Teck Ho, Juin-Kuan Chong, and Keith Weigelt (2002), �Strategic
Teaching and Equilibrium Models of Repeated Trust and Entry Games,�Working
Paper, California Institute of Technology.
Cortina, J.M. (1993), �What is Coe¢ cient Alpha? An Examination of Theory and
Applications,�Journal of Applied Psychology, 78, 98-104.
Darley, J.M. and R.H. Fazio (1980), �Expectancy Con�rmation Processes Arising in
the Social Interaction Sequence,�American Psychologist, 35, 867-881.
Devine, Patricia (1989), �Stereotypes and prejudice: Their automatic and controlled
components,�Journal of Personality and Social Psychology, 56(1), 5-18.
29
Eckel, Catherine and Philip Grossman (1998), �Are Women Less Sel�sh Than Men?
Evidence from Dictator Experiments,�Economic Journal, 108(448), 726-35.
Eckel, Catherine and Phillip Grossman (2000), �Di¤erences in the Economic Deci-
sions of Men and Women: Experimental Evidence,�Handbook of Experimental
Economic Results, forthcoming.
Eckel, Catherine and Rick Wilson (2006), �Judging a Book by its Cover: Beauty and
Expectations in a Trust Game.�Forthcoming, Political Research Quarterly.
Fershtman, Chaim and Uri Gneezy (2001), �Discrimination in a Segmented Society:
An Experimental Approach,�Quarterly Journal of Economics, 116(1), 351-377.
Glaeser, Edward, David Laibson, Jose Scheinkman, and Christine Soutter (2000),
�Measuring Trust,�The Quarterly Journal of Economics, 115(3), 811-846.
Gneezy, Uri, Muriel Niederle, and Aldo Rustichini (2003), �Performance in Competi-
tive Environments: Gender Di¤erences,�Quarterly Journal of Economics, 118(3),
1049-1074.
Hamermesh and Biddle (1994), �Beauty and the Labor Market,�American Economic
Review, 84(5), 1174-94.
Langlois, Judith, Lisa Klakanis, Adam Rubenstein, Andrea Larson, Monica Hallam,
and Monica Smoot (2000), �Maxims or Myths of Beauty? A Meta-Analysis and
Theoretical Review,�Psychological Bulletin, 126(3), 390-423.
McPherson, Miller, Lynne Smith-Lovin, James M. Cook (2001), �Birds of a Feather:
Homophily in Social Networks,�Annual Review of Sociology, 27, 415-444.
Mobius, Markus and Tanya Rosenblat (2006), �Why Beauty Matters,�American
Economic Review, 96(1), 222-235.
Mulford, Matthew, John Orbell, Catherine Shatto, and Jean Stockard (1998), �Phys-
ical Attractiveness, Opportunity, and Success in Everyday Exchange,�American
Journal of Sociology, 103(6), 1565-1592.
O�Neill, June (2003), �The Gender Gap in Wages, circa 2000,�American Economic
Review, 93(2), 309-314.
30

O�Neill, June (1998), �The Trend in the Male-Female Wage Gap in the United
States,�Ferber, Marianne, ed. Women in the Labour Market. Volume 1, Elgar
Reference Collection. International Library of Critical Writings in Economics, 90,
520-45.
Pinker, Steven (2002), The Blank Slate: The Modern Denial of Human Nature, New
York: Viking Press.
SAS Institute Inc. (1988), SAS Procedures Guide: Release 6.03 Edition, Cary, NC:
SAS Institute, Inc.
Scharleman, Jorn, Catherine Eckel, Alex Kacelnik, and Rick Wilson (2001), �The
Value of a Smile: Game Theory with a Human Face,�Journal of Economic Psy-
chology, 22(5), 617-640 .
Sell and Wilson (1991),
Solnick, Sara and Maurice Schweitzer (1999), �The In�uence of Physical Appearance
and Gender on Ultimatum Game Decisions,�Organizational Behavior and Human
Decision Processes, 79(3), 199-215.
Zebrowitz, L.A. (1997), Reading Faces: Window to the Soul?, Boulder, CO:Westview
Press.
31