Beats and Beat Frequency - Mr. Smith's Websitesmith-teach.com/ph30s/sound_waves/notes_files/54...
5
Beats and Beat Frequency The diagram below shows waves produced from two different tuning forks. One tuning fork produces a 440 Hz tone, while the other produces a 438 Hz tone. Since the frequencies are different, the waves have different wavelengths. Notice that at certain locations the waves interfere constructively, while at others they interfere destructively. Two compressions combine to form a larger compression. This constructive interference produces a louder sound. When a compression and a rarefaction interfere destructively, they produce a region with zero amplitude (no sound). The top two diagrams below show two waves with slightly different frequencies, while the third diagram shows the interference pattern that results from combining these two waves.
Transcript of Beats and Beat Frequency - Mr. Smith's Websitesmith-teach.com/ph30s/sound_waves/notes_files/54...
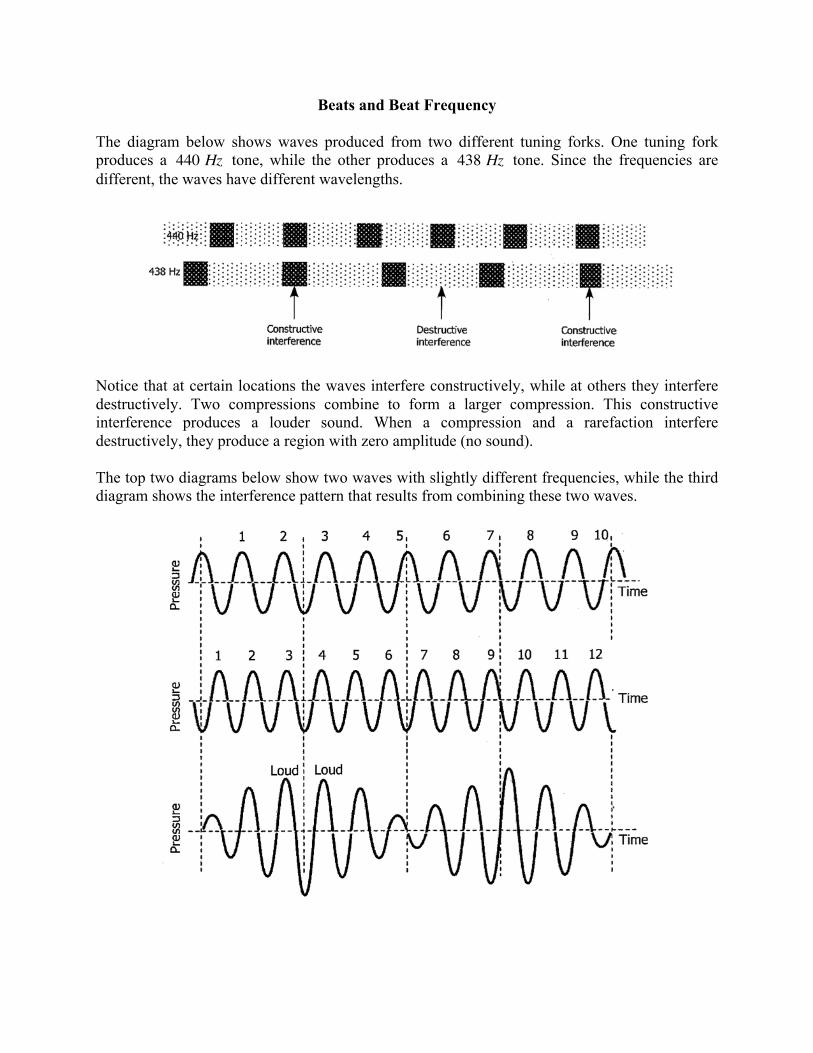
Beats and Beat Frequency The diagram below shows waves produced from two different tuning forks. One tuning fork produces a 440 Hz tone, while the other produces a 438 Hz tone. Since the frequencies are different, the waves have different wavelengths.
Notice that at certain locations the waves interfere constructively, while at others they interfere destructively. Two compressions combine to form a larger compression. This constructive interference produces a louder sound. When a compression and a rarefaction interfere destructively, they produce a region with zero amplitude (no sound). The top two diagrams below show two waves with slightly different frequencies, while the third diagram shows the interference pattern that results from combining these two waves.
Notice that there is a pattern in the resulting wave. The amplitude gets larger and smaller, producing a sound that is alternately loud, then soft. This interference of sound waves with slightly different frequencies, resulting in periodic variations in volume, is called beats. The beat frequency produced by two sounds is found by determining the absolute value of the difference of their frequencies.
fbeat = f2 − f1 Beats Simulation: http://library.thinkquest.org/19537/java/Beats.html
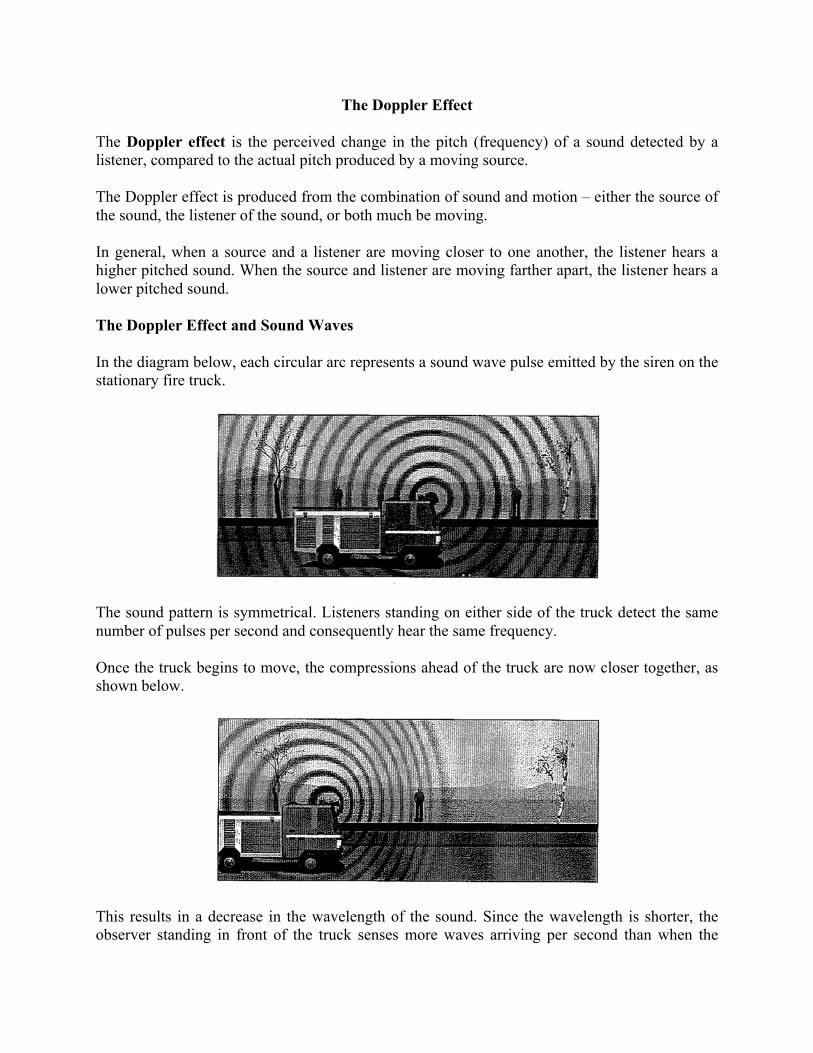
The Doppler Effect The Doppler effect is the perceived change in the pitch (frequency) of a sound detected by a listener, compared to the actual pitch produced by a moving source. The Doppler effect is produced from the combination of sound and motion – either the source of the sound, the listener of the sound, or both much be moving. In general, when a source and a listener are moving closer to one another, the listener hears a higher pitched sound. When the source and listener are moving farther apart, the listener hears a lower pitched sound. The Doppler Effect and Sound Waves In the diagram below, each circular arc represents a sound wave pulse emitted by the siren on the stationary fire truck.
The sound pattern is symmetrical. Listeners standing on either side of the truck detect the same number of pulses per second and consequently hear the same frequency. Once the truck begins to move, the compressions ahead of the truck are now closer together, as shown below.
This results in a decrease in the wavelength of the sound. Since the wavelength is shorter, the observer standing in front of the truck senses more waves arriving per second than when the
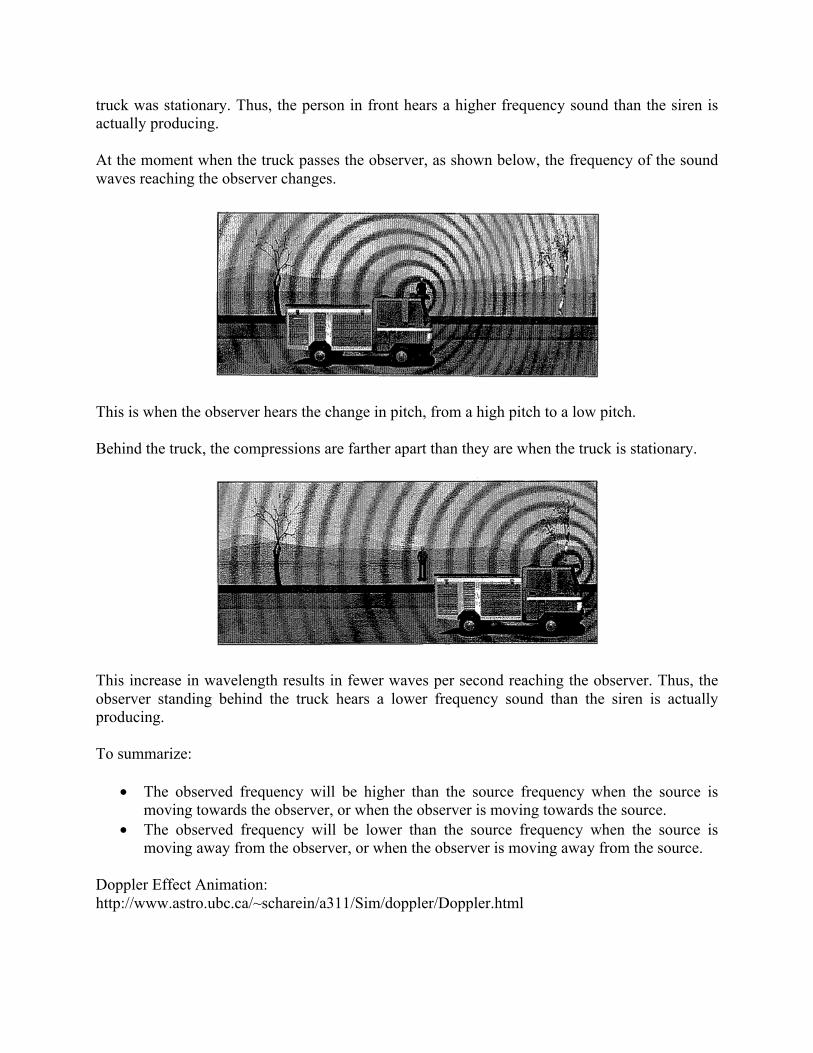
truck was stationary. Thus, the person in front hears a higher frequency sound than the siren is actually producing. At the moment when the truck passes the observer, as shown below, the frequency of the sound waves reaching the observer changes.
This is when the observer hears the change in pitch, from a high pitch to a low pitch. Behind the truck, the compressions are farther apart than they are when the truck is stationary.
This increase in wavelength results in fewer waves per second reaching the observer. Thus, the observer standing behind the truck hears a lower frequency sound than the siren is actually producing. To summarize:
• The observed frequency will be higher than the source frequency when the source is moving towards the observer, or when the observer is moving towards the source.
• The observed frequency will be lower than the source frequency when the source is moving away from the observer, or when the observer is moving away from the source.
Doppler Effect Animation: http://www.astro.ubc.ca/~scharein/a311/Sim/doppler/Doppler.html
Waves Worksheet #11 1. A tuning fork vibrates at a frequency of 524 Hz . An out of tune piano string vibrates at
529 Hz . a) What is the beat frequency? b) How much time separates successive beats?
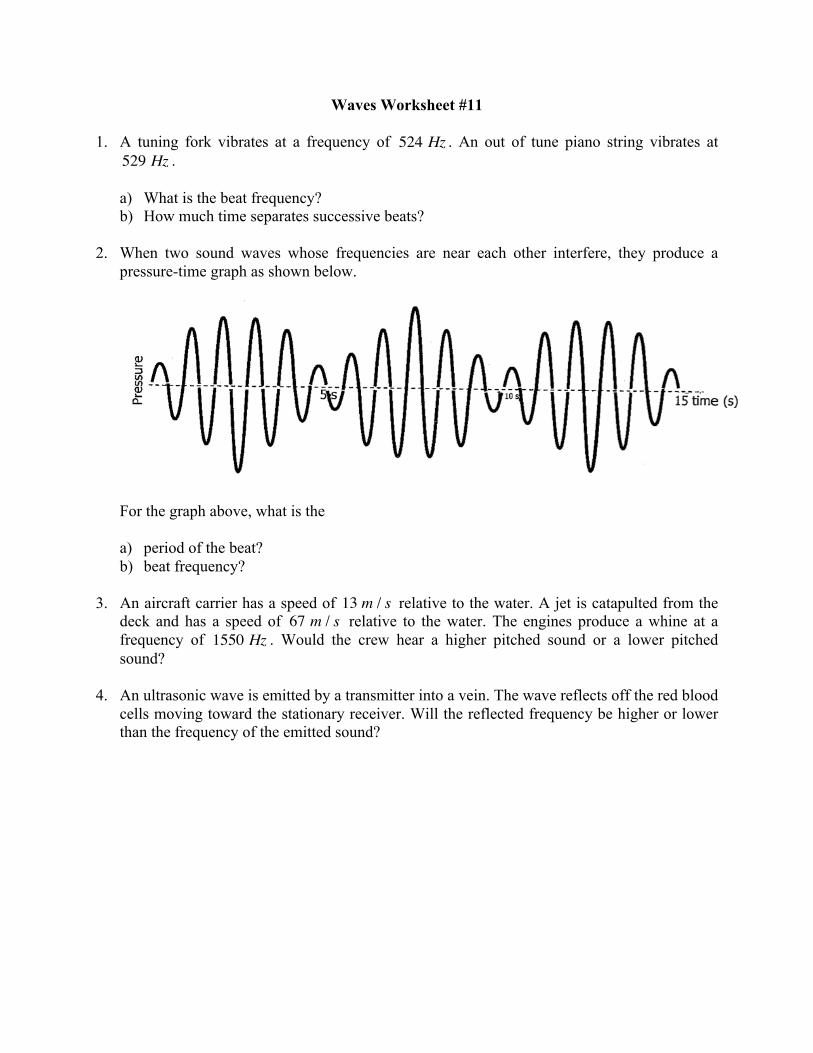
2. When two sound waves whose frequencies are near each other interfere, they produce a
pressure-time graph as shown below.
For the graph above, what is the
a) period of the beat? b) beat frequency?
3. An aircraft carrier has a speed of 13 m / s relative to the water. A jet is catapulted from the
deck and has a speed of 67 m / s relative to the water. The engines produce a whine at a frequency of 1550 Hz . Would the crew hear a higher pitched sound or a lower pitched sound?
4. An ultrasonic wave is emitted by a transmitter into a vein. The wave reflects off the red blood cells moving toward the stationary receiver. Will the reflected frequency be higher or lower than the frequency of the emitted sound?