BEARING'S EARLY FAULT DETECTION USING VIBRATION …frequency levels. Hence, fault can be discovered...
22
18 MD Proceedings of the 18 th Int. AMME Conference, 3-5 April, 2018 18 th International Conference on Applied Mechanics and Mechanical Engineering. Military Technical College Kobry El-Kobbah, Cairo, Egypt. BEARING'S EARLY FAULT DETECTION USING VIBRATION ANALYSIS M. A. Eissa 1 , F. R. Gomaa 2 and K. M. Khader 3 ABSTRACT Over recent decades, predictive maintenance's usage attracted the attention of maintenance specialists in some important industries. Moreover, machinery condition monitoring is an effective indicator for planning the maintenance schedules. Machine monitoring or early detection of incipient fault is an important judgment tool of the machine's health at critical parts such as; gears and bearings. Furthermore, vibration- monitoring process can be achieved by experienced operators using their visual inspection. However, many specialists in maintenance field recommend using the computerized inspection to meet increased demand for the automated monitoring applications and helpful engineering software. This paper deals with condition monitoring of machines in addition to designing machine monitoring assisting tool as software for time saving. This software is presented as fast tool affording instantaneous calculations of bearing fault frequencies for different bearing types. In addition, the presented software can instantaneously calculate the basic dynamic load rating considering bearing rating life. KEYWORDS Condition Monitoring, Wavelet Analysis, Bearing Lifetime, Computer Software. ----------------------------------------------------------------------------------------------------------------- 1 Graduate student, Dept. of Production Eng. and Mechanical Design, Faculty of Eng., Menoufia Univ., Shebin El-Kom, Menoufia, Egypt. Email: [email protected]. 2 Professor, Dept. of Production Eng. and Mechanical Design, Faculty of Eng., Menoufia Univ., Shebin El-Kom, Menoufia, Egypt. Email: [email protected]. 3 Associate professor, Dept. of Production Eng. and Mechanical Design, Faculty of Eng., Menoufia Univ., Shebin El-Kom, Menoufia, Egypt. Email: [email protected].
Transcript of BEARING'S EARLY FAULT DETECTION USING VIBRATION …frequency levels. Hence, fault can be discovered...

18 MD Proceedings of the 18th Int. AMME Conference, 3-5 April, 2018
18th International Conference on Applied Mechanics and Mechanical Engineering.
Military Technical College Kobry El-Kobbah,
Cairo, Egypt.
BEARING'S EARLY FAULT DETECTION USING VIBRATION
ANALYSIS
M. A. Eissa1, F. R. Gomaa2 and K. M. Khader3
ABSTRACT
Over recent decades, predictive maintenance's usage attracted the attention of maintenance specialists in some important industries. Moreover, machinery condition
monitoring is an effective indicator for planning the maintenance schedules. Machine monitoring or early detection of incipient fault is an important judgment tool of the machine's health at critical parts such as; gears and bearings. Furthermore, vibration-monitoring process can be achieved by experienced operators using their visual inspection. However, many specialists in maintenance field recommend using the computerized inspection to meet increased demand for the automated monitoring applications and helpful engineering software. This paper deals with condition monitoring of machines in addition to designing machine monitoring assisting tool as software for time saving. This software is presented as fast tool affording instantaneous calculations of bearing fault frequencies for different bearing types. In addition, the presented software can instantaneously calculate the basic dynamic load rating considering bearing rating life. KEYWORDS Condition Monitoring, Wavelet Analysis, Bearing Lifetime, Computer Software.
----------------------------------------------------------------------------------------------------------------- 1 Graduate student, Dept. of Production Eng. and Mechanical Design, Faculty of Eng.,
Menoufia Univ., Shebin El-Kom, Menoufia, Egypt. Email: [email protected]. 2 Professor, Dept. of Production Eng. and Mechanical Design, Faculty of Eng., Menoufia
Univ., Shebin El-Kom, Menoufia, Egypt. Email: [email protected]. 3 Associate professor, Dept. of Production Eng. and Mechanical Design, Faculty of Eng.,
Menoufia Univ., Shebin El-Kom, Menoufia, Egypt. Email: [email protected].

19 MD Proceedings of the 18th Int. AMME Conference, 3-5 April, 2018
INTRODUCTION
Rolling bearings are basic elements in most industrial applications. These elements are critical components, which can be used as an effective condition monitoring parts to avoid sudden failures resulting from increasing vibration levels. Regarding to the problems, which have definite severity or defect progress stage, a scheduled maintenance can be programmed to replace the damaged part via another one; hence the production process can continue without unnecessary delays. Condition monitoring (CM) details can be considered as early warning signs. Furthermore, these details can be used as effective detecting tools for optimizing the machine performance in addition to reducing maintenance costs and repairing time. CM techniques of ball bearings are used to detect the main effective dynamic characteristics of fault such as frequencies, mode shape and damping. There are four faults according to bearing's fault location namely in, outer race, inner race, balls and cage as mentioned by Grajales et al. [1]. Besides, the ability of these faults characteristic frequencies; it can be used as an important factor in early damage prediction. The warning signs of a machine failure are shown in Fig. 1, which presents an example of machine CM as discussed by Bolton [2].
Fig. 1. Warning signs of machine failure as described by Bolton [2]. Vibration can be considered as the main significant warning sign, which reveals to prone failure as shown in Fig.1. Therefore, vibration is an effective diagnostic tool because it early describes the main features of a system before the sudden damage as mentioned by National-Instrument [3]. Hence, discovering fault process can be considered as possible mission via analyzing the relation between vibration levels and natural frequencies as stated by Riaz et al. [4]. Predictive maintenance can be considered as an effective tool for reducing the damage rate of critical machine's components. Furthermore; it can be used for adjusting the equipment's operation with less possibility of failure as stated by Liggan and Lyons [5]. As well as, predictive maintenance has many benefits such as estimating true costs of the needed scheduled maintenance and gives successive

20 MD Proceedings of the 18th Int. AMME Conference, 3-5 April, 2018
warning signs before failure. Hence, the operational problems can be treated to avoid sudden failures. Furthermore, continuous updating of condition monitoring information can be analyzed using special computer software for suggesting an effective scheduled maintenance. Generally, increasing vibration levels is always associated with a period of concentrated energy, which appears through specific frequency levels. Hence, fault can be discovered using vibration data analysis. Rotating machinery has many types of fault such as; unbalance, shaft misalignment, untighten nuts and misaligned belt drive in addition to increasing vibration levels. The existence of defects in bearings can be considered the main reason for hearing noise resulted from increasing vibration levels in the machine’s bearings. These defects can be categorized into local and distributed defects. Local defects in ball bearings such initial cracks that can be considered as an effective source of serious defects. Discovering these initial cracks is not easy mission due to the small crack's detection difficulties. Clearly, initial cracks appear due to fatigue in the surface of bearing elements causing shock or impact of loads. On the other hand, the distributed defects resulting from manufacturing errors have many forms such as; surface roughness, waviness and misaligned elements as mentioned by Jayaswal et al. [6]. This paper is focusing on the latest developments in the area of early fault detection based on vibration analysis in addition to the literature review of CM in rotating machinery as a case study, especially via bearings usage. Furthermore, this paper deals with the importance of wavelet transform (WT) function usage as an effective method for detecting ball bearing fault instead of using the time and frequency domain methods. Moreover, easy usage software designed using Visual-Basic programming language for estimating both fault frequencies and dynamic load of ball bearing in order to avoid unplanned stops. This computer software can be considered as easy and fast designing tool for helping the mechanical engineers by providing them with real-time needed calculations. IMPORTANCE AND TYPES OF CONDITION MONITORING Condition monitoring process can be considered as the main part of the predictive maintenance process. Moreover, it is an effective detection tool for determining the early fault for rotating elements of the machines to avoid sudden failures. Four steps, namely; data collection, data interpretation, data analysis and diagnosis can be used for scheduling the maintenance as reported by Jardine et al. [7]. Condition Monitoring Importance The condition monitoring (CM) techniques can be considered as the main pillar of the predictive maintenance. Also, CM is an effective judgment tool of the machine's healthy situation at critical rotating elements such as; gears and bearings. Furthermore, saving time that can be wasted during swapping the defected part via new one can be considered the main goal of the monitoring process usage using vibration analysis.

21 MD Proceedings of the 18th Int. AMME Conference, 3-5 April, 2018
Types of Machine Condition Monitoring There are five types of machine CM. The first type is "Route-Based" which is dealing with advanced data analysis through recording data when handling instrument. The second one is "Portable Diagnostic" which uses sensors for testing the health of the mechanical elements. "Factory Assurance Test" as a third one that can be used for determining a possible device's failure and ensuring device's requirements achievement. The fourth type of machine CM is the "Online monitoring" which uses an embedded device for transmitting important running data to computer server for scheduling the maintenance plans. Finally, the fifth one is the "Online Protection" process which uses the interaction monitoring equipment, which associated with an embedded device for analyzing the running data. Moreover, limit settings can be used to control the running machines as discussed by ABS [8]. CONDITION MONITORING TECHNIQUES There are many methods can be used via CM namely; ultrasound wave, shock pulse, Fuzzy logic, neural network and vibration analysis. The first one is the ultrasound wave method; which is used to pinpoint welding flaws, cracks in materials, bearings and gears fault that appears via the high frequency. Generally, ultrasound method can be used with an approximately frequency range 35-50 kHz via sound pressure waves which create a small electrical charge in a resonant sensor. A suitable amplifier can be used for amplifying this electrical charge. Furthermore, an appropriate accelerometer converted this charge into suitable frequencies, which can be recorded in data collector in order to be measured and analyzed using frequency and time domain methods as discussed by Hijazi [9]. Ultrasound measures static or dynamic data. The static data is owing to a signal value of measurements at a specific time and data recorded or taken from photographs. However, dynamic data belongs to signal value of measurements taken during a long time period (as range 5-60 second) and data recorded as videos. Normally, ultrasound depends on converting wave of frequency above 20 kHz into sound with frequency range (0-5 kHz) associated with noise problems in order to detect the fault as discussed by El Anouar et al [10]. The second one is mechanically and electrically method called shock pulse method (SPM), which can be operated at a frequency of 32 kHz. The needed mechanical shock wave can be produced via an impact action between two masses. The combined signals resulted from this shock pulse can be measured using a special piezo-electrical accelerometer filters as discussed by Morando [11]. SPM has an effective ability for detecting impacts of rotating bearing damage resulted from surface roughness. These impacts produce shock pulse which depends on bearing surface condition and its angular velocity. Additionally, SPM has a unique ability for analyzing bearing conditions as lubrication without creating baseline data for trending. But, SPM has a poor ability for detecting very small cracks, hence it isn't recommended as early fault detection tool for rotating machine element especially with the bearings as mentioned by Yang et al [12]. The third one is Fuzzy logic mathematical method. Generally, Fuzzy logic method treats data information using useful ways approximately similar to the way of
22 MD Proceedings of the 18th Int. AMME Conference, 3-5 April, 2018
processing information inside human brains. Fuzzy logic method can be used for solving the appeared problems during the running operations. This method is based on collecting and analyzing all available characteristics information about causes of appeared problems. Hence, the relationship between all these causes can be formed as system entries. Good practice and the experience of specialists can be used for reviewing these entries separately for suggesting the best decisions in order to solve the appeared problem as stated by Balazinski et al [13]. The fourth one is neural network method which based on processing the available information via a suitable system similar to the nervous system. This method can be carried out by making up a number of samples owing to the system problems associated with putting these samples in electronic nodes. Hence, the system can be controlled based on efficient practical experience. Generally, all possible solutions to problems can be counted in the form of storage information patterns as stated by Siddique et al [14]. Solving problems via Fuzzy logic or neural network method needs a lot of effort regarding extract the problem information. Meanwhile, Fuzzy logic and neural network methods are efficient for collecting problem information via specialists with high skills and good practice for saving time as mentioned by Wang et al [15]. Finally, the fifth one is the vibration analysis, which is the most popular way can be used with machine's rotating elements maintenance. Moreover, vibration analysis is an effective tool for identifying machine faults, which can be used in maintenance field for early planning the maintenance schedules. Furthermore, the vibration analysis can be achieved via recording measurements in order to measure dynamic motion called the overall. It is considered the most appropriate method for CM, especially for very small defects. The vibration level can be easily measured using suitable sensors such as accelerometer depending upon periodic motion as discussed by Mobley [16]. The vibration measurements comprise many values such as; velocity, displacement, frequency and acceleration, where their values can be measured as; peak, root mean square, average and peak-to-peak as discussed by Amezquita and Adeli [17] in addition to Patil et al. [18]. Vibration Importance in Condition Monitoring
The early fault detection assists in improving the machines performance and productivity during running operation, where it ensures operation continuity without sudden stops. Furthermore, effective maintenance plans can be suggested dealing with early fault detection for keeping operational costs under control through preventing unnecessary machine downtime. The vibration analysis method is one of the most important ways that can be followed via condition monitoring for detecting early fault in rotating elements of machines. This method depends on definite steps. The first step is recording special measurements using a suitable accelerometer for the critical machine's locations, while the second step is analyzing these measurements through constructing the corresponding graphs. Finally, the vibration level peaks of these graphs can be compared with the corresponding vibration's peaks of elements of the machine, which have free defects. Hence, the machine's condition can be assessed, whether it needs maintenance or not. There are three procedures such as; frequency domain, time domain and equivalent frequency domain can be used as vibration analysis method.

23 MD Proceedings of the 18th Int. AMME Conference, 3-5 April, 2018
First, Frequency domain procedure depends on the observed frequency's amplitude for describing fault's characteristic through extracting the signature of the measured overall vibration single of rotating elements. Moreover, overall vibration can be compared with the corresponding standard ones. On the other hand, second is the time domain, which can be extracted from the machine's vibration signal. Time domain referred to the average of collecting measuring signals from operation. The concurrent average of measured time of rotating element using tachometer signal is the main parameter in time domain procedure. Average of the collecting signals can be evaluated via two ways, the first one called root mean square, while the second way called crest factor. The time domain cannot consider as effective procedure via noisy environment for detecting the defects and its locations. Third, in special cases, time domain can be transferred to its equivalent frequency domain values using vibration analysis with Discrete Fourier Transform (DFT) or short time Fourier transform (STFT). Smart signal processing and filtering are highly requested for solving the condition monitoring problems. Furthermore, advanced procedures such as Stochastic Subspace Identification (SSI), Envelop function and wavelet transform function are highly requested for solving these problems. PROBLEM STATEMENT Damage or failure in a bearing of the mechanical system causes bad effects as high vibration levels in addition to noise, which can cause a breakdown in the mechanical systems. Early fault detection of bearings is an important tool for preventing the sudden stoppage. The effective methods of detecting these early faults are employing on-line fault diagnosis. It is very important to test the capability of different processes as wavelet transform of multi-resolution processes, which assist for detecting an early fault of damages such as; wear, peeling and crack especially via noise separation at high frequencies. Moreover, machine monitoring helping tool as software can be designed. Also, this software can be designed for affording instantaneous calculations of bearing fault frequencies for different types of bearing. Likewise, this software can instantaneously calculate the basic dynamic load rating according to the demanded bearing rating life. PROBLEM SOLUTION APPROACH Vibration can be significantly controlled using a suitable model analysis technique. Troubleshooting of vibration in addition to structural health monitoring based on vibration analysis can be investigated for mechanical applications via a suitable technique. Traditional Experimental Model Analysis Classical or traditional model analysis deals with the input and output measurements
24 MD Proceedings of the 18th Int. AMME Conference, 3-5 April, 2018
for evaluating model parameters, which consists of damping ratio, model natural frequencies and mode shape. Operational Model Analysis The operational model employs only response measurements in operational condition exposed to an external or natural excitation of the structures to pinpoint modal characteristics. EARLY FAULT'S ONLINE DETECTION USING WAVELET ANALYSIS Detection of early faults as soon as these faults appeared is the main benefit that can be obtained from using online condition monitoring detection using wavelet analysis. Hence, the total deterioration case of the machine can be avoided via treating early fault instantly with its occurrence. Moreover, early fault detection of bearings can be considered as an effective monitoring tool for assessing the maintenance strategies. Generally, maintenance's specialist can start online detection method after sufficient period from the beginning of the running process, whether he has information about fault existence or not. Operation process can be monitored at three low speeds for detecting the possible defects such as misalignment and unbalance, while other faults of bearings and gears can be monitored via high speeds. Vibration level can be recorded using a suitable accelerometer fixed over the important part of the machine as the bearing with selecting the suitable frequency's range. Many ways can be used such as; frequency domain, time domain and wavelet transform function methods through analyzing the recorded measurements. The recorded measurements characteristics using different ways can be compared with standers for selecting the best way for early fault detection. Experimental Setup The suggested experimental model consists of motor, gearbox, shaft in addition to a pair of ball bearings. The suggested test simulation arrangement is shown in Fig. 2. The motor is single phase motor has 2 HP and its speed 3000 RPM. The gearbox is able to change shaft's rotating speed with different three angular speeds. The output shaft of the gearbox is rigidly coupled to another shaft that mounted via a pair of ball bearings. The type of these ball bearings is 2304 SKF of 10 balls, which has inner and outer race diameters, are equal to 20 mm and 52 mm respectively. Instruments for Analyzing Experimental Results There are many of instruments will be used for measuring and analyzing vibration of experimental setup at its critical locations. These instruments are shown in Fig. 3. The first instrument is (B&K) dual channel analyzer of type (3160). This instrument has internal signal conditioning circuitry, which has the ability for measuring the signal via accelerometer works through frequency's range (0-50) kHz. The second instrument is tri-axial piezoelectric accelerometer of type (4506) mounted over the bearing housings generates the required vibration signals, which possess spectral

25 MD Proceedings of the 18th Int. AMME Conference, 3-5 April, 2018
Fig. 2. Simulation of experimental arrangement.
Fig. 3. Instruments for analyzing experimental results.
components expanding over a wide frequency range. Moreover, fault types can be revealed in both radial and axial directions via accelerometer with bandwidth ranges from zero to 40 kHz. The rotating speed can be measured using the third instrument, which is called tachometer. Finally, (B&K) device software stores the measured data in addition to analyzing these experimental results. Furthermore, MATLAB codes can be developed for the discrete (adaptive) wavelet transform (DWT) in addition to continuous wavelet transform (CWT) analysis technique of time signals that resulted from experimental results. Measuring Procedure The measuring procedure consists of seven steps. The first step is preparing the simulation setup's arrangement that contains bearings, shaft, gearbox and motor. The second step is putting the tachometer device at a suitable place for measuring the shaft's speed. The third step is fixing the accelerometer device at the bearing for measuring in radial and axial directions. The fourth step is starting experimental test via motor speed equals 900 RPM. The fifth step is extracting the measured results via frequency response function of pulse analyzer device. The sixth step is analyzing the results via software. Finally, the seventh step is repeating the same previous steps at different available rotating speeds as 1200 and 1400 RPM.

26 MD Proceedings of the 18th Int. AMME Conference, 3-5 April, 2018
Analyzing Techniques There are three techniques will be used for analyzing the experimental results. The first technique is the Frequency Domain (FD), which can be used for illustrating all possible faults using values of frequencies, while the second one is the Time Domain (TD), which can be used via its values to illustrate wavelet transform function usage in addition to its usage as a sign of presence defect. The third one is Wavelet Transform (WT) function. The frequency domain can be directly exported from the used software, while time domain is the vector of data column converted from the experimental results curves. This vector of data can be used for providing the MATLAB program with the needed data for creating CWT and DWT functions. Generally, wavelet function usage is developed technique can be used for accurate analyzing experimental results which use CWT and DWT functions via separating the noise. Experimental Results and Model Analysis The frequency domain in addition to time domain has been measured at three different speeds (900, 1200 and 1400 RPM) through frequency range (0-3.2) kHz. The resulted curves of frequency and time domain are shown in Figs. 4, 5 and 6 for rotating speeds 900, 1200 and 1400 RPM respectively. The red lines are used in Figs. 4, 5 and 6 (b) for indicating the peaks of frequency domain. These peaks can denote the detection fault types. These peaks are at approximately the values (200, 1100, 1400, 1500 Hz) which observed from resulted curves of rotating speeds (900, 1200 and 1400 RPM) respectively. Also, the approximate amplitudes (6, 5, 3 and 3 in m/s2) are corresponding to the frequencies (200, 1100, 1400 and 1500 Hz) respectively. Generally, troubleshoot chart's concept can reveal types of fault according to frequency's peaks. In case of elements rotate out of balance, the peak of frequency domain can be noticed at the value equals to the value of rotating speed in RPM. While, the peaks of frequency domain can be noticed at values equal to rotating speed in RPM multiplied by integer numbers (1, 2, 3 and 4), in case of members have misalignment or bent shaft. Hence, the misalignment is the detected fault. WAVELET FUNCTION Wavelet function can be considered as an effective, developed and accurate technique, which affords accurate analyzing of the experimental results using adaptive wavelet, and continuous wavelet functions in addition to separating the noise. Continuous Wavelet Transform Function and Discrete Wavelet Analysis Generally, the wavelet deals with the continuous wavelet transform function (CWT) in addition to discrete (adaptive) wavelet analysis (DWT) types. CWT function of S(t) introduced by Kulkarni and Sahasrabudhe [19], where S(t) is the signal, as follows;
dta
bttS
aabCWT
s
s
s
ss ∫∞
∞−
−= *
)(1
),( ϕ
(1)

27 MD Proceedings of the 18th Int. AMME Conference, 3-5 April, 2018
Fig. 4. Frequency domain and time domain (at 900 RPM).
Fig. 5. Frequency domain and time domain (at 1200 RPM).
Fig. 6. Frequency domain and time domain (at 1400 RPM).

28 MD Proceedings of the 18th Int. AMME Conference, 3-5 April, 2018
where φ* is the conjugate function of the mother wavelet φ(t), as and bs are the dilatation (scaling) and translation (shift) parameters respectively. Also, the factor (1/√as) is used for ensure energy persevering. Also, φ(t) can represented as follows;
−=
s
s
sa
bt
at ϕϕ
1)(
(2)
The S(t) can formulated as introduced by Kulkarni and Sahasrabudhe [19], as follows;
dbdatWca
tSssss baba
s
,,
1)( ψ
ψ∫∫=
(3)
The mother wavelet φ(w) must be compactly supported and satisfied with the
admissibility condition, where (W) is critical sampling of the CWT. Also, (W) and (cψ) can be formed as follows;
∫−= dtettW jt
)()( ϕ (4)
∞<= ∫∞
∞−
)()(
2
WdW
Wc
ϕψ
(5)
The DWT can be derived from the discretization of CWT. Moreover, the most common discretization is dyadic. The DWT is given by Kulkarni and Sahasrabudhe [19] as follows;
dtkt
tSkjDWTj
j
j ∫∞
∞−
−=
2
2)(
2
1),( ϕ
(6)
where as and bs are replaced by, as=2-j and b=k2-j where j and k are an integers. Wavelet Curve Forming Steps The wavelet curves can be achieved via four steps. The First step is extracting the desired vector column of numbers from the time curve of the experimental results. The second step is selecting the menu called (Toolboxes-wavelet-wavelet toolbox) and the suitable type of wavelets functions from MATLAB, while the third step is selecting the analyzer type of continuous wavelet that is (1D). The fourth step is selecting the main function "Morlet" for mechanical fault. In addition, data of time must be inserted with suitable scale. Hence, the desired curves can appear as shown in Fig.7. The analyzed signals at a scale equal to (16) in addition to wavelet map are shown in Figs. 7, 8 and 9 for rotating speeds (900, 1200 and 1400 RPM) respectively. Furthermore, these figures present the relation between time, scale and amplitude via CWT curves. Moreover, the location of four frequency impulses of the bearing can be easily extracted from wavelet map in order to figure out their defect occurrence time.

29 MD Proceedings of the 18th Int. AMME Conference, 3-5 April, 2018
Fig. 7. Analyzed signal at 900 RPM.
Fig. 8. Analyzed signal at 1200 RPM.
Fig. 9. Analyzed signal at 1400 RPM.

30 MD Proceedings of the 18th Int. AMME Conference, 3-5 April, 2018
Discrete (Adaptive) Wavelet Transform (DWT) Adaptive wavelet transform (DWT) is an effective technique for separating the noise from (CWT) curves as discussed by Kompella et al. [20]. Furthermore, it is an efficient tool for locating impulses after separating the noise from CWT curve and omitting any external effect. Moreover, it can extract values, which denote the fault as extensively discussed with many details by Ibrahim et al. [21]. The analyzed signal is shown in Fig. 10 after separating the noise from CWT curve. Besides, focusing on fault peaks in addition to extracting the corresponding values to be compared with the standard troubleshoots attributes of different fault types to figure out the fault type. Some areas of the analyzed signal magnified are illustrated in Fig. 11 after separating the noise for rotating speeds (900, 1200 and 1400 RPM), where the peaks are clearly indicated by black lines. RESULTS AND DISCUSSION OF MODEL ANALYSIS The relation between time, scale and amplitude via CWT curves are presented in Figs. 7, 8 and Fig. 9 for different rotating speeds. Clearly, bearing defects occurrence time can be extracted from wavelet map related to the location of four frequency impulses. The frequencies peaks can be extracted from Fig.7 that denotes fault existence in bearings. The theoretical natural frequencies can be calculated for different rotating speeds as introduced by Lacey [22] for revealing expected defects frequencies of bearing's parts. These calculated frequencies can be compared with the existence frequencies peaks regarding troubleshooting chart to figure out the possibility of defect existence in addition to determining defect types. The previous technique can be used for determining the bearings defect's types as shown in Fig. 11. The calculated natural frequencies of bearings from the theoretical equations using the designed program software in addition to extracted time from Fig. 11 are listed in Table 1, regarding three shaft's rotating speeds. The extracted frequencies can be calculated using the relation F = (1/T). The tabulated results reveal the bearing defect's existence where the calculated frequencies are close to the extracted ones, at 1400 RPM speed in outer race. The value of the outer race frequencies that calculated from equations equals to 96 Hz, which approximately equals 92Hz, extracted from the curve. The previous technique can't detect very small cracks that can appear in bearing. This is related to no peaks appeared at high frequencies in the frequency domain curves of Fig. 5 and Fig. 6 in addition to Fig. 7. Early fault detection process can be considered as hard mission using frequency domain method, which mostly gives a constant resolution in the time and frequency domains. On the other hand, wavelet technique is efficient using multi-resolution for localizing short time components. Moreover, this technique is an effective testing tool for detecting bearings defects at high frequencies. Hence, most of the possible types

31 MD Proceedings of the 18th Int. AMME Conference, 3-5 April, 2018
Fig. 10. Analyzed signal after separating the noise.
Fig. 11. Zoom areas of analyzed signal after separating the noise. Table 1. Calculated and extracted frequencies of bearing at different shaft's speeds.
Shaft's speed (RPM)
Calculated freq. (Hz)
Extracted period (in seconds)
Extracted freq. (Hz)
900
1200
1400
63,102,56,5.7
84,136,75.8,7.6
96.6,156.4,87.7,8.7
0.0074,0.0073,0.0076
0.0201,0.0205,0.0216
0.0108,0.0292,0.0300
135,137,131.5
50,48.7,46.02
92,34.2,33.3

32 MD Proceedings of the 18th Int. AMME Conference, 3-5 April, 2018
of damages such as wear, peeling and crack can be detected for different sizes and different durations. Also, this technique can present a whole evaluation of the machine's status during working period. In addition, it can be considered as an effective tool for machine CM assessment. Unfortunately, transmitting the numerical results of this technique to MATLAB package's toolbox is a complicated process, because wavelet has provided as a form of applied mathematics. PREDICTIVE MAINTENANCE SOFTWARE FOR BEARING'S FAULT DIAGNOSIS There are various methods for monitoring the performance of bearings considering different operating conditions. These different methods assist through making the suitable decisions about maintenance, operations and maintenance schedules. Moreover, fault diagnosis technique of predictive maintenance usage can help for taking a right decision as stopping the machine in order to change the defect bearing to avoid sudden machine failure. Developing online software became the main request for supporting the rapid developing of predictive maintenance techniques. This software can be used for instantaneously analyzing the measured data in order to avoid the sudden stops using a suitable programming language. Hence, this software can be considered as fast assessing tool for machine monitoring in addition to affording instantaneous calculations. In this regard, many of famous companies specialist as in SKF Company are encouraging programmers who are working in the predictive maintenance fields for developing effective programs dealing with predictive maintenance of bearings as in SKF handbook [23]. Ball Bearing's Fault Frequencies Fault frequencies of bearing can be calculated using the following equations as the presented by Lacey [22] as follows;
−= φcos1
2
1
D
dfFTF r (7)
−= φcos1
2 D
df
nBFPO r (8)
+= φcos1
2 D
df
nBFPI r (9)
−=
2
cos12
φD
df
d
DBSF r (10)
where; (d) is the ball bearing diameter in mm, (D) is the pitch diameter in mm, (β) is the contact angle, (n) is the number of balls or rollers and (ƒr) is the relative rotating speed between the inner and outer races in RPM. The previous equations present the four faults (FTF, BFPO, BFPI and BSF) in Hz. The (FTF) is the fundamental train frequency, while (BFPO) is the ball passing frequency in outer race. Also, (BFPI) is the ball passing frequency in inner race, while (BSF) is the ball spin frequency.

33 MD Proceedings of the 18th Int. AMME Conference, 3-5 April, 2018
Ball Bearing's Lifetime Generally, lifetime of bearing is the number of operating hours or revolutions that the bearing is able to efficiently work at specific rotating speed before the advent of the first sign of metal fatigue in inner, outer races or rolling element. There are factors affecting this bearing's lifetime such as; the value and direction of the load during operation process, selecting the proper lubricants in addition to incorrect methods of bearing's installation and handling. Varying load and forces, which exposed to the bearing during the running process, can be considered one of the main effective factors, which reduce the bearing's lifetime. The ball bearing is exposed to radial load, which is perpendicular to the shaft's rotation direction in addition to another load called axial or thrust load, which is parallel to shaft axis. Bearings can work in a good manner via the effect of radial and axial loads under proper operating conditions as discussed by SKF [24]. Basic dynamic load rating depends on the type of the ball bearings. The basic dynamic rating life (L10) can be defined as introduced by SKF handbook [25] in addition to AST [26] as follows;
3
10
16667
=
r
rh
P
C
nL (11)
where; (L10h) is the basic rating life in hours, (Cr) is the basic dynamic radial load in
(KN), (n) is number of revolution in RPM, and (Pr) is the dynamic equivalent load in
(KN) which can be calculated using the following equation;
arr FYFXP += (12)
where; (Fr) and (Fa) is the radial and axial loads in (KN) respectively in addition to (X)
and (Y), which are the radial and axial load factors. The load factors (X) and (Y) can
be selected from the tabulated values of Table 2 as introduced by AST [26]. Where,
the selection of (X) and (Y) depends on the bearing diameter (D) in mm and the
value of (Fa / Fr) in addition to the listed value of (e) regarding to (Fa / Fr) as follows;
Table 2. Radial Load Factor and Axial Load Factor.
Fa/(2D2) e Fa/Fr ≤ e Fa/Fr > e
X Y X Y 0.172 0.19 1 0 0.56 2.3
0.345 0.22 1 0 0.56 1.99 0.689 0.26 1 0 0.56 1.71 1.03 0.28 1 0 0.56 1.55 1.38 0.3 1 0 0.56 1.45 2.07 0.34 1 0 0.56 1.31 3.45 0.38 1 0 0.56 1.15 5.17 0.42 1 0 0.56 1.04
6.89 0.44 1 0 0.56 1
The basic dynamic radial load (Cr) can be defined as follows;

34 MD Proceedings of the 18th Int. AMME Conference, 3-5 April, 2018
3 10
16667
hrr
LnPC = (13)
where; the value of basic rating life (L10h) can be selected based on type of friction effect and operation from a recommended ranges that listed in Table 3, as introduced by AST [26] as follows;
Table 3. Rating life (L10h). Basic rating Life (L10h)
(in hours) Operating conditions
500 Infrequent operation 4000 ~ 8000 Short or intermittent operation, function has little effect
8000 ~ 12000 Intermittent operation, function has significant effect 12000 ~ 20000 8 hours of non-continuous operation 20000 ~ 30000 8 hours of continuous operation 40000 ~ 60000 24 hours of continuous operation
100000 ~ 200000 24 hours of free operation with guaranteed trouble
First part of software for calculating defect frequencies of bearing This paper presents machine monitoring assisting tool as software for time saving. This software will be designed as fast assisting tool affording immediate calculations of bearing fault frequencies of different bearing types. Furthermore, the designed software can instantaneously compute the basic dynamic load rating considering the bearing rating life. The first part of this software presents the usage steps for calculating and showing the bearing fault frequencies (FTF, BFPO, BFPI and BSF) of different bearing types. The main interface screen of this software's first part is shown in Fig. 12 for calculating the fault frequencies of bearings. This part of the designed software affords fast calculations of bearing faults frequencies (FTF, BFPO, BFPI and BSF) for the selected type of bearings. These frequencies can directly appear as soon as the software's user selects the desired specifications such as; contact type, number of balls, pressure angle, etc. The calculated frequencies via this software were compared with some published ones for testing their validity, which had approximately same values. Also, the flow chart of these sequences is shown in Fig. 13. The calculated frequencies values can be compared with measured values in order to take the correct decision regarding the swapping the defect bearings with another one. The difference between this designed software and published similar ones; it has an easy way of using it in addition, it has many ways for selecting the bearings parameters. Also, the designed software can be considered fast calculation tools regarding to its real-time through doing its calculation. Second part of software for calculating basic dynamic load rating The second part of the designed software affords an easy interface menu in order to instantaneously calculate the basic dynamic radial load rating of ball bearings. It is clear that, the actual applied load is not recommended to exceed than the calculated

35 MD Proceedings of the 18th Int. AMME Conference, 3-5 April, 2018
Fig. 12. Interface software screen of bearing frequencies calculation.
Fig.13. Flow chart of bearing frequencies calculation.

36 MD Proceedings of the 18th Int. AMME Conference, 3-5 April, 2018
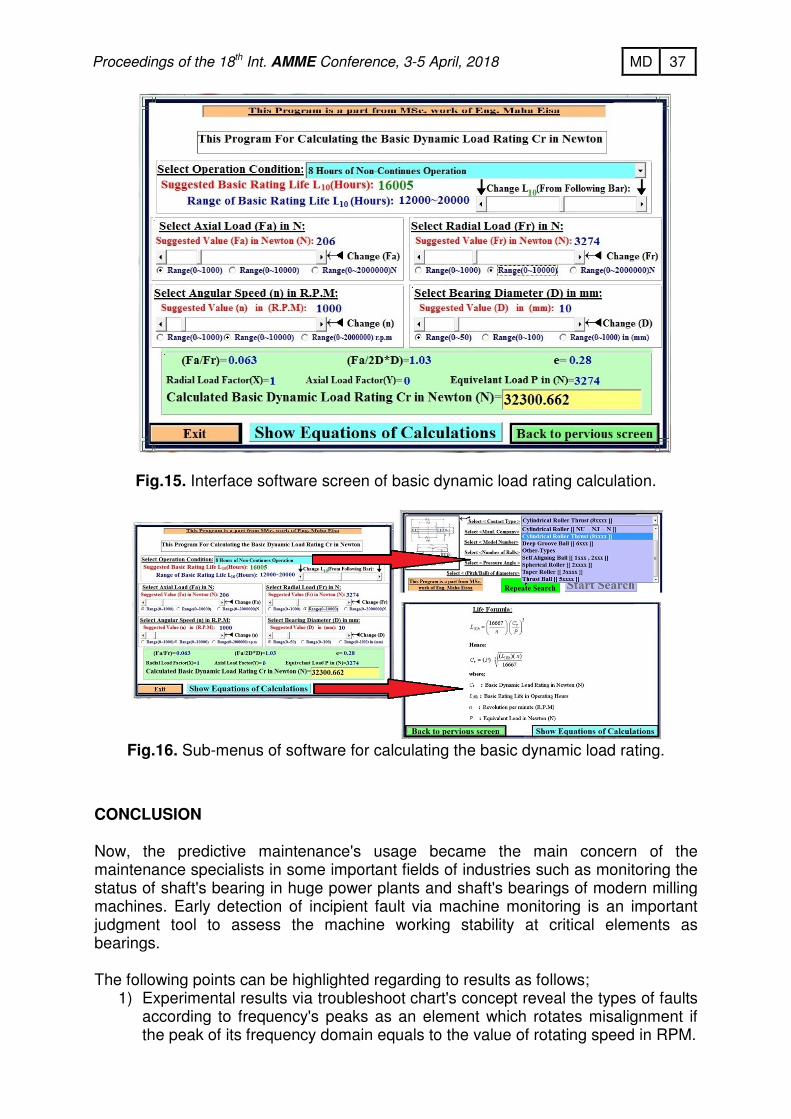
basic dynamic load rating during the working operation to avoid bearing's destruction and lifetime reducing. These calculations are dealing with the ball bearings of internal diameter greater than 10 mm and the ball bearings of bore diameter greater than 50 mm, because the designed software uses equations of ball bearings through its calculations as in AST [26]. The calculated dynamic load rating can directly appear as soon as the software’s user selects the desired specifications such as; lifetime or type of operation, values of axial and radial loads, rotating speed etc. The flow chart of these sequences is shown in Fig. 14. Also, the interface screen of software's second part is shown in Fig. 15 for calculating the dynamic load rating. Furthermore, operation selection in addition to presenting the equation of dynamic load rating is shown in Fig.16.
Fig.14. Flow chart's steps of bearing basic dynamic load rating calculation.
37 MD Proceedings of the 18th Int. AMME Conference, 3-5 April, 2018
Fig.15. Interface software screen of basic dynamic load rating calculation.
Fig.16. Sub-menus of software for calculating the basic dynamic load rating.
CONCLUSION Now, the predictive maintenance's usage became the main concern of the maintenance specialists in some important fields of industries such as monitoring the status of shaft's bearing in huge power plants and shaft's bearings of modern milling machines. Early detection of incipient fault via machine monitoring is an important judgment tool to assess the machine working stability at critical elements as bearings. The following points can be highlighted regarding to results as follows;
1) Experimental results via troubleshoot chart's concept reveal the types of faults according to frequency's peaks as an element which rotates misalignment if the peak of its frequency domain equals to the value of rotating speed in RPM.

38 MD Proceedings of the 18th Int. AMME Conference, 3-5 April, 2018
2) Wavelet transform of multi-resolution processes is efficient during predicting the possible types of damage such as wear, peeling and crack which occur with different sizes and durations.
3) Wavelet transform of multi-resolution processes can be considered as the suitable tool for detecting most of early faults of defects at high frequencies due to its capability for noise separation.
4) This paper designed and implemented machine monitoring helping tool as software. The presented software is designed as fast tool affording immediate calculations of bearing fault frequencies for several types of bearing. Furthermore, the designed software can instantly calculate the basic dynamic load rating related to the requested bearing rating life.
REFERENCES
[1] J. A. Grajales, J. F. López, and H. F. Quintero, "Ball bearing vibrations model:
Development and experimental validation", Ingeniería y competitividad, (Engineering and Competitiveness), vol. 16, no. 2, pp. 279-288, 2014.
[2] J. Bolton. (2017, 20 Jan.), Top 10 warning signs for low minerals process efficiency, https://www.global.weir/newsroom/news-articles/2017/01/25/top-10-warning-signs-for-low-minerals-process-efficiency/. [On line]
[3] National-Instrument. (2017, 19 Jul.), Machine condition monitoring technical library, http://www.ni.com/white-paper/6511/en/. [On line]
[4] S. Riaz, H. Elahi, K. Javaid, and T. Shahzad, "Vibration Feature Extraction and Analysis for Fault Diagnosis of Rotating Machinery-A Literature Survey", Asia Pacific Journal of Multidisciplinary Research, vol. 5, no. 1, pp. 103-110, 2017.
[5] P. Liggan and D. Lyons, "Applying predictive maintenance techniques to utility systems", Pharmaceutical engineering Magazine, ISPE, vol. 31, no. 6, pp.1-7, 2011.
[6] P. Jayaswal, A. Wadhwani, and K. Mulchandani, "Machine fault signature analysis", International Journal of Rotating Machinery, HINDAWY, vol. 2008, pp.1-10, 2008.
[7] A. Jardine, D. Lin, and D. Banjevic, "A review on machinery diagnostics and prognostics implementing condition-based maintenance", Mechanical systems and signal processing, vol. 20, no. 7, pp. 1483-1510, 2006.
[8] ABS. (2016, April). Guidance notes on equipment condition monitoring technique, https://maritimecyprus.files.wordpress.com/2016/05/abs-equipment_condition_monitoring.pdf. [On line]
[9] A.Hijazi. (2011, 25 October). Introduction to non-destructive testing techniques, https://eis.hu.edu.jo/ACUploads/10526/Ultrasonic%20Testing.pdf. [On line]
[10] B. El Anouar, M. Elamran, B. Elkihel, and F. Delaunois, "A comparative experimental study of ultrasound technique and vibration analysis in detection of bearing defect", presented at 13ème Congrès de Mécanique, (Meknès, MAROC), https://cmm2017.sciencesconf.org/129197/document , pp.11-14, April 2017.
[11] L. Morando, Bearing condition monitoring by the shock pulse method, Iron and Steel Engineers, vol. Dec., pp. 40-43, 1998.
[12] R. Yang, J. Kang, J. Zhao, J. Li, and H. Li, "A case study of bearing condition monitoring using SPM", in Prognostics and System Health Management Conference (PHM-2014 Hunan), 2014, pp. 695-698.

39 MD Proceedings of the 18th Int. AMME Conference, 3-5 April, 2018
[13] M. Balazinski, E. Czogala, K. Jemielniak, and J. Leski, "Tool condition monitoring using artificial intelligence methods", Engineering Applications of Artificial Intelligence, vol. 15, no. 1, pp. 73-80, 2002.
[14] A. Siddique, G. Yadava, and B. Singh, "Applications of artificial intelligence techniques for induction machine stator fault diagnostics", 4th IEEE International Symposium in Diagnostics for Electric Machines, Power Electronics and Drives, 2003 SDEMPED, 2003, pp. 29-34.
[15] W. Wang, K. Chau, C. Cheng, and L. Qiu, "A comparison of performance of several artificial intelligence methods for forecasting monthly discharge time series", Journal of hydrology, vol. 374, no. 3-4, pp. 294-306, 2009.
[16] R. Mobley, Chapter 1: Introduction to vibration Analysis, Vibration fundamentals, 1st Edition, Butterworth-Heinemann, Elsevier, pp.1-60, 1999.
[17] J. Amezquita-Sanchez and H. Adeli, "Signal Processing Techniques for Vibration-Based Health Monitoring of Smart Structures," Archives of Computational Methods in Engineering, vol. 23, no. 1, pp. 1-15, 2016.
[18] K. Patil, S. Narale, and H. Waikar, "Vibration Analysis of Rotating Shaft with Longitudinal Crack", International Journal of Scientific Engineering and Research (IJSER), vol. 5, no. 1, pp. 89-92, 2017.
[19] P. Kulkarni and A. Sahasrabudhe, "Application of wavelet transform for fault diagnosis of rolling element bearings," International Journal of Scientific & Technology Research, vol. 2, no. 4, pp. 138-148, 2013.
[20] K. Kompella, V. Mannam, and S. Rayapudi, "DWT based bearing fault detection in induction motor using noise cancellation", Journal of Electrical Systems and Information Technology, vol. 3, pp. 411-427, 2016.
[21] A. Ibrahim, S. Abd-elrahman, M. Zahran, and H. El-mongy, "An experimental investigation for gear fault diagnosis using adaptive wavelet analysis of vibration signals," Bulletin of Faculty of Engineering, Faculty of Engineering, Menia University, vol. 26, no. 2, pp.101-119, 2007.
[22] S. Lacey, "An overview of bearing vibration analysis", maintenance & asset management, vol. 23, pp. 32-42, 2008.
[23] SKF, SKF Bearing Maintenance Handbook: Mounting rolling bearings, http://skf.elanders.cn/media/custom/upload/File-1352446538.pdf, 2010, pp.45-92.
[24] SKF, SKF Rolling Bearings, Principles of bearing selection and application Selecting bearing size, http://www.skf.com/binary/77-121486/SKF-rolling-bearings-catalogue.pdf, 2016, pp. 61-95.
[25] SKF, Railway Technical Handbook, Bearing calculation, vol. 2, http://www.skf.com/binary/tcm:12-96059/13085EN.pdf , 2012, pp. 143-163.
[26] AST. (2011, 26 October), Life and load ratings-radial ball bearings, http://www.astbearings.com/pdf-viewer.html?file=assets%2Ffiles%2FTechnical-Information-Sheet--Radial-Ball-Bearings-Life-and-Load-Ratings--ENB-04-0637.pdf , DOCUMENT NO. ENB-04-0637 REV. B DCR17-049, or in http://dpk3n3gg92jwt.cloudfront.net/ast/pdf/ENB-04-0637.pdf, [On line]