Beam Extraction System for the K=500 Superconducting...
6
BEAM EXTRACTION SYSTEM FOR THE K=500 SUPERCONDUCTING CYCLOTRON M.M. Gordon and E.M. Fabrici Cyclotron Laboratory, Michigan State University, East Lansing, Michigan 48824 Abstract In addition to three electrostatic deflectors, the proposed extraction system contains six sets of "focus- ing bars." Calculations are presented to demonstrate the usefulness of these elements for both beam deflect- ion and focusing. Next, the troublesome field pertur- bations produced by the focusing bars are discussed, together with the design for "compensating bars." Pre- extraction orbit calculations are then presented to show the evolution of the radial and axial phase space areas associated with the accelerating beam, and to demonstrate the effects of various resonances including those generated by the focusing bars. 1. Introduction The general features of the K=500 Superconductint l ) cyclotron are described elsewhere in these proceedings. This cyclotron will utilize the "precessional" extraction method which has prove n so successful in our present machine and in many other isochronous cyclotrons. The basic procedure consists in acceler- ating the ions out be yond the isochronous region into the edge region of the magnetic field, thereby passing through the vr=l resonance where the addition of a carefully controlled first harmonic "field bump" drives the orbits off center. The resultant orb it precession then produces the necessary large radius gain per turn at the entrance of the electrostatic deflector. Before discussing the pre-extraction orbit calculations in detail, we first consider the hardware required to deflect the beam out of the cyclotron. Fig. 1 shows a schematic diagram of this hardware according to the present design. In order to complete beam deflection in less than one turn, we require three electrostatic deflectors together with a series of six short magnetic channels, called "focusing bars". For simplicity, the three electrostatic deflectors will be fixed in position and have fixed apertures. Our orbit calculations indicate that electric fields less than 110 kV/cm should suffice in all cases, and considering the "VE law" together with our own experience, we feel confide nt that an aperture as large as 10 mm can be used without serious sparking problems. 2. Foc using Bars Focusing bars are extremely useful for beam extraction since they prov ide a fairly strong focusing gradient together with a deflecting field which can be varied significantly. One set of these bars consists of three rectangular steel rods which enclose the beam as shown in Fig. 2. When situated in the strong field of the cyclotron, these bars become magnetized to saturation, and generate a quadrupole-like field within the aperture occupied by the beam. The magnetic field produced by the focusing bars can be calculated quite easily by assuming they are uniformly magnetized in the vertical direction. The validity of this assumption has been checked, at least in the two dimensional case, by use of the "TRIM" pro- gram which employs a sophisticated relaxation calcula- tion . For a standard magnet stee l with a 21.2 kG saturation field, the two calculation methods were found to agree very well for external field all the way down to about 5 kG. Below this level, the assumption of sa turation becomes progressively poorer. , \ \ " <80 0 \'0-----' I \ I I , Fig. 1. Schematic Diagram of the Extraction System . The elements shown. are three electrostatic deflectors (El, E2, E3), six sets of focusing bars (Fl, F2.1-F2.5), and two sets of compensating bars (Cl, C2). All of the focusing bars have the same aperture a = 0.5 inch, corresponding to a focusing gradient of 9.6 kG/inch, and a field decrement of 0.9 kG at the center of the aperture. The elements Cl and C2 are designed to com- pensate for the first harmonic field components pro- duced by the two groups of focusing bars, Fl and F2, respectively. The curve labeled OE represents the envelope of all the internal orbits prior to extraction (see Fig. 5). The two large circles at r= 30 and 36 inch indicate the boundaries of the superconducting coils. The three broken spiral curves locate the centers of the three magnet hills. Scale markings for the azimuthal angle 8 are shown on a reference circle at r=20 in ch . Fig. 2 shows a plot of the median plane field and the corresponding field gradient as a function of x, the radial displacement from the center of the aperture. These results pertain to a set of focusing bars having the "standard" geometry: (height)/(width) = a/(a/4), where a is the aperture, and in our case, a = 0.5 in ch . This cross sectional geometry is also shown in Fig. 2. The length of the bars here is 1 = 4.0 inch, and the plotted fields refer to a point halfway from each end. The strong gradient of the focusing bars opposes the radially defocusing gradient associated with the edge region of the cyclotron field through which the extracted beam must pass. As shown in Fig. 2, the focusing gradient is not only strong, but is also nearly constant over about 80% of the aperture. In our case with a = 0.5 inch, this gradient has an ave- rage value of 9.6 kG/inch, and varies by on ly ± 0.6 kG/inch over an interval = 0.4 inch. Proceedings of the Eighth International Conference on Cyclotrons and their Applications, Bloomington, Indiana, USA 0018-9499/79/0400-2101$00.75 c ○1979 IEEE 2101
Transcript of Beam Extraction System for the K=500 Superconducting...
BEAM EXTRACTION SYSTEM FOR THE K=500 SUPERCONDUCTING CYCLOTRON
M.M. Gordon and E.M. Fabrici Cyclotron Laboratory, Michigan State University, East Lansing, Michigan 48824
Abstract
In addition to three electrostatic deflectors, the proposed extraction system contains six sets of "focusing bars." Calculations are presented to demonstrate the usefulness of these elements for both beam deflection and focusing. Next, the troublesome field perturbations produced by the focusing bars are discussed, together with the design for "compensating bars." Preextraction orbit calculations are then presented to show the evolution of the radial and axial phase space areas associated with the accelerating beam, and to demonstrate the effects of various resonances including those generated by the focusing bars.
1. Introduction
The general features of the K=500 Superconductint l ) cyclotron are described elsewhere in these proceedings. This cyclotron will utilize the "precessional" extraction method which has proven so successful in our present machine and in many other isochronous cyclotrons. The basic procedure consists in accelerating the ions out beyond the isochronous region into the edge region of the magnetic field, thereby passing through the vr=l resonance where the addition of a
carefully controlled first harmonic "field bump" drives the orbits off center. The resultant orbit precession then produces the necessary large radius gain per turn at the entrance of the electrostatic deflector.
Before discussing the pre-extraction orbit calculations in detail, we first consider the hardware required to deflect the beam out of the cyclotron. Fig. 1 shows a schematic diagram of this hardware according to the present design. In order to complete beam deflection in less than one turn, we require three electrostatic deflectors together with a series of six short magnetic channels, called "focusing bars". For simplicity, the three electrostatic deflectors will be fixed in position and have fixed apertures. Our orbit calculations indicate that electric fields less than 110 kV/cm should suffice in all cases, and considering the "VE law" together with our own experience, we feel confident that an aperture as large as 10 mm can be used without serious sparking problems.
2. Focusing Bars
Focusing bars are extremely useful for beam extraction since they provide a fairly strong focusing gradient together with a deflecting field which can be varied significantly. One set of these bars consists of three rectangular steel rods which enclose the beam as shown in Fig. 2. When situated in the strong field of the cyclotron, these bars become magnetized to saturation, and generate a quadrupole-like field within the aperture occupied by the beam.
The magnetic field produced by the focusing bars can be calculated quite easily by assuming they are uniformly magnetized in the vertical direction. The validity of this assumption has been checked, at least in the two dimensional case, by use of the "TRIM" program which employs a sophisticated relaxation calculation . For a standard magnet steel with a 21.2 kG saturation field, the two calculation methods were found to agree very well for external field all the way down to about 5 kG. Below this level, the assumption of saturation becomes progressively poorer.
, \ \
" <800 \'0-----' I \
I I ,
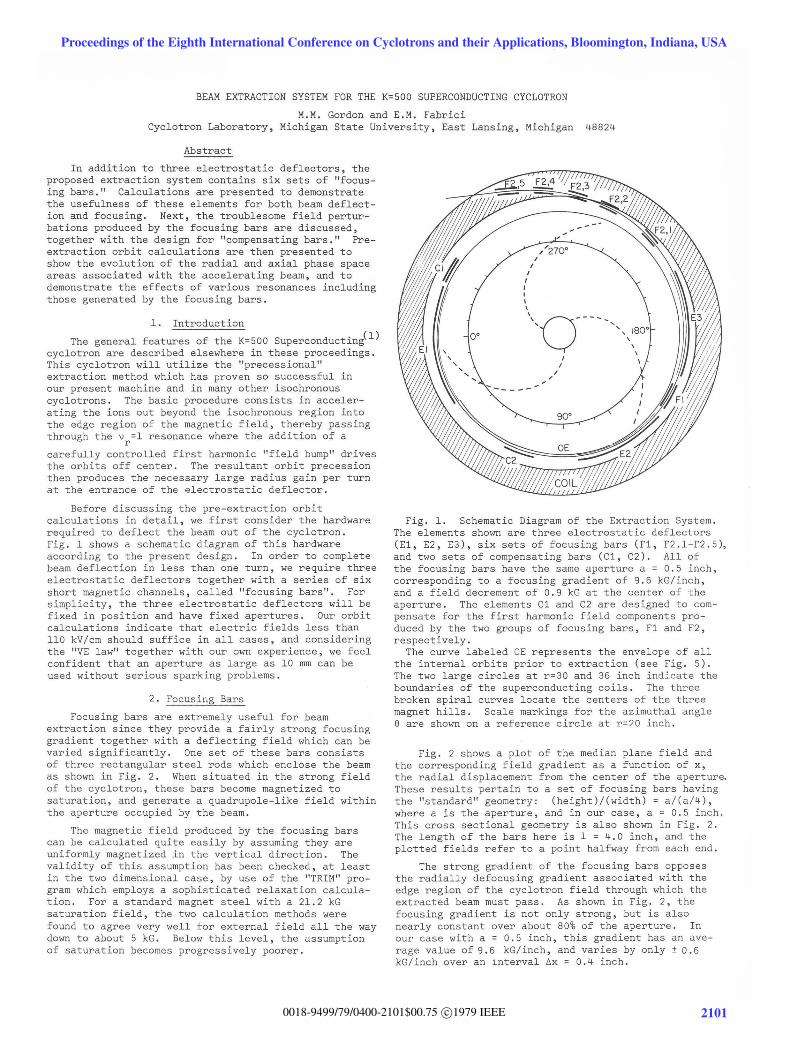
Fig. 1. Schematic Diagram of the Extraction System . The elements shown. are three electrostatic deflectors (El, E2, E3), six sets of focusing bars (Fl, F2.1-F2.5), and two sets of compensating bars (Cl, C2). All of the focusing bars have the same aperture a = 0.5 inch, corresponding to a focusing gradient of 9.6 kG/inch, and a field decrement of 0.9 kG at the center of the aperture. The elements Cl and C2 are designed to compensate for the first harmonic field components produced by the two groups of focusing bars, Fl and F2, respectively.
The curve labeled OE represents the envelope of all the internal orbits prior to extraction (see Fig. 5). The two large circles at r= 30 and 36 inch indicate the boundaries of the superconducting coils. The three broken spiral curves locate the centers of the three magnet hills. Scale markings for the azimuthal angle 8 are shown on a reference circle at r=20 inch .
Fig. 2 shows a plot of the median plane field and the corresponding field gradient as a function of x, the radial displacement from the center of the aperture. These results pertain to a set of focusing bars having the "standard" geometry: (height)/(width) = a/(a/4), where a is the aperture, and in our case, a = 0.5 inch . This cross sectional geometry is also shown in Fig. 2. The length of the bars here is 1 = 4.0 inch, and the plotted fields refer to a point halfway from each end.
The strong gradient of the focusing bars opposes the radially defocusing gradient associated with the edge region of the cyclotron field through which the extracted beam must pass. As shown in Fig. 2, the focusing gradient is not only strong, but is also nearly constant over about 80% of the aperture. In our case with a = 0.5 inch, this gradient has an average value of 9.6 kG/inch, and varies by only ± 0.6 kG/inch over an interval ~x = 0.4 inch.
Proceedings of the Eighth International Conference on Cyclotrons and their Applications, Bloomington, Indiana, USA
0018-9499/79/0400-2101$00.75 c○1979 IEEE 2101

6
4
2
o
-4
-I.
b
a (db/dx ) ,-, ,/'"'" , ......... \
-.5
, S"I , . ,
Vl
'" ~ u c
N A"
o x (inches) .5
Fig. 2. Geometry and Median Plane Field of Focusing Bars. Cross sectional view of three steel bars enclosing the beam with an aperture a = O.S inch. Plots show the median plane field b(x) and its scaled gradient, a(db/dx), as functions of x, the radial displacement from the aperture center.
The focusing gradient is nearly constant over 80% of the aperture, with an average value of 9.6 kG/inch for a = 0.5 inch.
The focusing bars also produce a negative (deflecting) field near the center of the aperture, which should provide valuable assistance to the electrostatic deflectors. In addition, we plan to have each set of focusing bars mounted so that it can be moved radially by ±O.l inch. As a result, the deflecting field will be variable over a range from O. to 1.B kG. This flexibility should provide significant help in solving the problem of matching the ion orbits to the prescribed extraction path for the many different ions and final energies produced by this cyclotron.
3. Beam Optics
Most of our orbit calculations have been carried out for the special case which presents the greatest difficulty for beam extraction. The magnetic field in this case has its maximum value, corresponding to 700 A in the superconducting coils. With this field, we chose the largest possible q/A value consistent with vertical focusing requirements, namely q/A = 0.31. In this case, the vr = 1 resonance occurs at 47.6 MeV/A,
and the designated extraction energy is 49.4 MeV/A where v = 0.76.
r The calculation of the central ray prior to the
extraction energy will be described in Section S. We merely note here that this accelerated orbit arrives at the entrance of the first deflector with a radius gain per turn of 0.2 inch. This central ray was then
successfully tracked through the extraction system using 92 kV/cm on all three electrostatic deflectors, together with a field decrement of 0.9 kG in all six sets of focusing bars. The resultant orbit is the one shown in Fig. 1.
In addition to the central ray, two sets of accelerated orbits were calculated starting from 40.3 MeV/A with initial displacements on a (r, Pr) and a (z, pz)
eigen-ellipse, respectively. The radial eigen-ellipse was chosen to have a width 6r = 0.1 inch, which corresponds to a final emittance area of 6.8 mm-mrad. This area should suffice for design studies since it exceeds the expected radial emittance by a factor of two. The axial eigen-ellipse was determined by choosing 6z = 0.4 inch at 40.3 MeV/A, which then corresponds to a final emittance of 7.1 mm-mrad. A beam height of 0.4 inch is about the largest expected in this cyclotron.
The properties of the accelerated orbits prior to extraction are described in Section S. At the extraction energy, the resultant displaced rays were then tracked through the extraction system along with the central ray. First, a detailed examination of the beam optics was carried out in order to determine the optimum number and distribution of focusing bars, assuming that each set provided a 9.6 kG/inch focusing gradient. The resultant optimized configuration is the one shown in Fig. 1.
The final results for the beam optics in the extraction system are summarized in Fig. 3. As c~n be seen, the radial and vertical beam widths behave very well throughout. The radial width never exceeds 0.24 inch, while the vertical height remains below 0.39 inch. We should note that the large difference in Fig. 3 between the positive and negative x values results from the strong non linearity in the edge region of the cyclotron magnetic field.
Fig. 3 also shows the results of a dispersion calculation obtained by tracking two orbits through the extraction system with initial conditions identical to those of the central ray except for an energy difference of ±50 keV/A out of 49.4 MeV/A. This corresponds to an energy spread 6E = 100 keY/A, which is approximately the energy gain per turn in this case. As can be seen, these two rays move steadily apart and reach a final separation of 0.39 inch. This result should be compared with the 0.24 inch final radial width obtained from the beam emittance.
In order to demonstrate the power of the focusing bar gradient, the beam optics calculations were repeated with this gradient set to zero. These results are indicated by the broken curves in Fig. 3. Although the change in the maximum vertical amplitude is hardly significant, the changes in the final radial widths due to the radial emittance and dispersion are truly phenomenal. For the radial emittance case, the width increases from 0.24 to 9.6 inch when the gradient is zero, while for the dispersion calculation, the final width increases from 0.39 to 6.0 inch.
4. Compensating Bars
The only serious drawback to the use of focusing bars arises from their large fringing field, which can also be seen in Fig. 2. This fringing field is sufficiently strong in the region occupied by the beam prior to extraction that it may seriously disturb these orbits. This disturbance is produced mainly by the first harmonic component of the fringing field in the vicinity of the vr = 1 resonance. Though usually
less serious, the gradient of the second harmonic component can also be troublesome.
Proceedings of the Eighth International Conference on Cyclotrons and their Applications, Bloomington, Indiana, USA
2102 0018-9499/79/0400-2102$00.75 c○1979 IEEE

, +.3
'" '" ECR ' 49.40 MeV/A ,-The set Cl is identical to Fl
and is located 1800 away at the same radius. It follows from symmetry that Fl + Cl produce no net first harmonic at all.
,-+.2 ",,""
,-
-------------~--~<~---------------------------"" ------+.1 -.; '" o. .s:: u
.S; -.I ------------------------------------------
The group F2 is significantly further from the accelerating beam than Fl, and its effect is proportionately weaker. As a result, we have found that effective compensation can be obtained from just one element, C2, whose location is shown in Fig. 1. This element consists of a single steel bar, 1.0 inch high and 0.3 inch thick, whose radial position can be adjusted so as to minimize the net first harmonic.
>< ---.2 -..........
" , -.3 \F2 EI
~ .3 u .S;
.2 )( 0 E
.1 N
0
.2
-.; liE: + 50. keY
'" .s:: u 0 .S; ';(
t.E: - 50. keY
-.2 dB/dx: 9.6 kGauss/inch
dB/dx: O. kGauss/inch
,-
/ /
/ ",
_ .... < "" ....
--.......... ..... ......
" "-'\
,
\ -.4
0 40 EK> 120 160 200 240
8(deg)
Fig. 3. Focusing and Dispersion Properties of the Extraction System. The two solid curves at top show the envelope of the radial displacements for a set of orbits tracked through the extraction system. These orbits originate on an eigen-ellipse centered on the central ray (shown in Fig. 1) with a total radial emittance of 6.8 mm-mrad. At center is a plot of the maximum z values for the linear vertical oscillations of a set of orbits which originate on a (z'Pz) eigenellipse corresponding to an emittance of 7.1 mm-mrad.
The two solid curves at bottom illustrate the dispersion arising from two orbits which differ in energy by ±50 keV/A out of 49.4 MeV/A, but which otherwise match the central ray. The broken curves in all three cases show the results of the same calculations but with the field gradient of the focusing bars set to zero, thereby demonstrating the power of these gradients. Between the two upper plots are symbols marking the positions of the three electrostatic deflectors and the six sets of focusing bars described in Fig. 1.
In order to minimize the orbit disturbances, sets of "compensating bars" are introduced. These elements are designed to cancel as effectively as possible the undesirable field perturbations. Clearly, if the compensating bars could be arranged to restore the three sector symmetry of the field, these perturbations would vanish completely. However, this ideal solution is not feasible in our situation because of space restrictions.
The six sets of focusing bars shown in Fig. 1 are divided into two groups, Fl and F2, with Fl containing one set, while F2 contains five sets, F2.l - F2.5. Our design contains only two sets of compensating bars, Cl and C2, which serve to correct the field perturbations from Fl and F2, respectively.
2EK> 320
The perturbation effect of the fringing fields of all the focusing and compensating bars can be under-stood qualitatively by examining a fourier analysis of the resultant field. The solid curves in Fig. 4 present the results of such an analysis for the configuration of elements assumed for the preextraction orbit calculations described in the next section. As can be seen, the first harmonic amplitude bl(r) is only 0.5 G at
r=25.7 where vr = 1, and remains
below 1. 3 G out to r=26. 85, the maximum radius of the accelerating beam.
The average field bO(r) produces
a phase shift, while dbo/dr changes vr and vz
. The
gradient of the second harmonic perturbation, db2/dr,
provides the driving force for the parametric resonances, vr = 2/2 and Vz = 2/2. Judging from the results
obtained from the orbit calculations described below, we conclude that the perturbations bo and b 2 shown in
Fig. 4 produce no unmanageable difficulties. We should note that the rapid rise in these perturbations near r=27 is produced by Fl and Cl which have an inner radius of 27.22 inch.
The fringing field affects the pre-extraction orbit calculations, and the results of these calculations are required to determine the configuration of focusing bars in the extraction system. Evidently, an iteration process is required to achieve a self-consistent design. The extraction system shown in Fig. 1 represents the results obtained after two iteractions. This configuration of focusing and compensating bars produces a fringing field whose fourier components are also shown in Fig. 4, but as broken line curves. As can be seen, these results are quite similar to those depicted as solid curves. Since analytical estimates indicate that these differences are not significant, no further iteractions are planned.
5. Pre-extraction Orbits
We turn now to the calculation of the accelerated orbits leading up to the central ray and the displaced rays used in the extraction design studies described in Section 3. These pre-extraction orbit calculations were carried out in the total magnetic field including all the field perturbations produced by the focusing and compensating bars.
Proceedings of the Eighth International Conference on Cyclotrons and their Applications, Bloomington, Indiana, USA
0018-9499/79/0400-2103$00.75 c○1979 IEEE 2103

100.
10.
" .. ",
b, # ----------~----------~/
I.
" -------...... .,.,;/
-----~
0.1~2~4~.-----L-----2~5~.-----L----~26-.-----L------2L7.~
R (inches)
Fig. 4. Perturbation Field of the Focusing and Compensating Bars. Plots of the average field -bo' and the first and second harmonic amplitude, bl and b 2 ,
as functions of the radius r. The solid curves refer to the field used for the pre-extraction orbit calculations described in Section 5 and Section 6. The broken curves were obtained afterward from the final configuration of extraction elements shown in Fig. 1.
Note that vr = 1 occurs approximately at r = 25.7
inch, while the extraction energy corresponds to an orbit having an average radius of 26.4 inch. For reference, the inner radius of Fl and Cl is at 27.22 inch.
To calculate these orbits, we utilize the "Spiral Gap" program which was designed specifically to include the effects of the radial as well as the azimuthal electric field in the gaps associated with spiral dees. As is appropriate for such an rf system, one "turn" corresponds to the ion returning to the same spiral gap line, rather than traversing 3600 in 8. We have assumed that the three dees (located in the magnet valleys) have a constant angular width of 60 0 and a peak voltage of 100 kV independent of radius. The maximum voltage gain per turn is therefore:
(600 kV) Isin(lTh/6) I
where h is the rf harmonic number.
The rf system is designed to operate in the frequency range from 9 MHz to 32 MHz. For our special case with q/A = 0.31, the orbital frequency is 22.4 MHz, so that first harmonic (h=l) acceleration is required here. The peak energy gain per turn is then 93 keV/A.
All orbit calculations were begun at 40.3 MeV/A where the magnetic field is still isochronous and where the effects of the focusing bar fringe fields are not yet significant. Also, all orbits start out with phase ~ = 0, corresponding to peak energy gain.
The central ray reaches the extraction energy 49.4MeV/A after 99 turns with a final phase ~ = 250 •
The radius gain per turn at the entrance to the first deflector was optimized at 0.2 inch through the use of a suitably chosen first harmonic field bump, which turns
out to have a 2.0 G amplitude. We should note that under these conditions, the central ray is never off center by more than 0.2 inch, as measured by its (r, Prj displacement from the instantaneous equilib-
rium orbit.
An additional set of eight orbits was computed with initial (r, Prj values distributed around an
eigen-ellipse centered on the central ray and having an initial radial width of 0.1 inch (about four times the normal radius gain per turn). The results of these calculations are summarized in a Pr vs. r phase
space diagram presented in Fig. 5 which shows the evolution of these orbits between turn n=74 (47.1 MeV/A) and the final turn n=99 (49.4 MeV/A).
The points in this diagram are plotted once per turn along a fixed spiral line corresponding to the exit from one dee. The actual value on the last turn is just 2.60 before the azimuth where the ions enter the first electrostatic deflector. As shown in Fig. 5, the clear separation between all the orbits on the last turn (n=99) and those on all preceding turns is 0.09 inch, which should provide enough clearance for the deflector septum.
The turns prior to n=74 are omitted since they are well behaved and rather uninteresting. Between turn n=74 and turn n=84 the orbits pass through the vr = 1
resonance where they are driven off center. As can be seen, the orbits then execute two large prEcession loops before reaching the final turn.
The n=99 "ellipse" shown in Fig. 5 provided the input data for the extraction optics calculations displayed at the top of Fig. 3. Examination of this ellipse reveals that it has been deformed into a shape somewhat like a "kidney bean". Further study of the phase diagram shows that this deformation originates back around turn n=80 (47.6 MeV/A) and evolves continuously thereafter.
This aberration effect is produced mainly by the severe phase space distortions associated with the v = 3/3 nonlinear resonance.
r Although we have observed strong coupling effects
between the radial and longitudinal motion in similar orbit calculations carried out for third harmonic (h=3) acceleration. this coupling does not appear at all significan~ here. First, the orbits on the final turn (n=99) exhibit an energy spread of only 6 keV/A and a phase spread of only 1.10 , while the area of the final ellipse is essentially the same as the initial one. Moreover, we found that the distortion of the final ellipse was practically unaltered when the calculation was repeated with the coupling completely removed by artificially giving the orbits a fixed energy gain at each gap crossing.
6. Vertical Motion
The vertical oscillations associated with the central ray were also calculated using the Spiral Gap orbit program. This program treats only linear vertical motion, a.nd although it calculates completely the coupling of the radial into the vertical motion, it omits the reverse coupling entirely.
An additional set of orbits was calculated with (r, Prj values identical to those of the central ray,
and with initial (z, pz) values distributed around an
eigen-ellipse appropriate to the starting energy, 40.3 MeV/A. As noted in Section 3, the size of this eigen-ellipse was chosen so that its maximum vertical extent on the first turn was 0.4 inch.
Proceedings of the Eighth International Conference on Cyclotrons and their Applications, Bloomington, Indiana, USA
2104 0018-9499/79/0400-2104$00.75 c○1979 IEEE

Bo" 47.4 kGauss q/A":31 VOEE " 100 kV Fig . 5. Radial Phase Space Diagram.
1.3 b," 2 Gauss <p, "60· Plot showing evolution of Pr vs. r
1.2
'iQ,~3.~~ '.5
.9
23.7 23.8
"ellipses" through the vr = 1 resonance
(n=74-84) to the entrance of the first deflector (n=99). The inset shows the initial conditions at 40.3 MeV/A. The broken curve connects the points for the central ray plotted once per turn from n=74 to n=99.
The arrow indicates the displacement of one particular orbit from the central ray. To avoid confusion through overplotting, the ellipses are not shown on every turn until n=93.
.8
25k.5~--'~~.~6---'2~5.77---:2~5~.8~--~?oh.9'---'~~~-o~~.',--~~~.2---'~~.3~-'~~A'---~~~.5'---~26~~~ R (inches)
I , ~
I 40.33 MeV/A
•• 1
74 47.07 MeV/A
Fig. 6. Axial Phase Space Diagram for the Central Ray. Evolution of the Pz vs. z ellipses characterizing the
linear vertical oscillations about the central ray .
The four panels here indicate results obtained at 40.3 MeV/A (n=l), 47.1 MeV/A (n=74), 48.5 MeV/A (n=89), and the final energy 49.4 MeV/A (n=99)/ The
o , --, --- I ---+- vr = 2vz
coupling resonance occurs
89 48.46 MeVlA
• .1
· .2 · .1 .2 -.2 -.1
Z (inches)
The res ults of these calculations are summarized in Fig. 6 which shows the (z, pz) ellipses on turns n=l,
74, 89, and the final turn n=99. This last ellipse provided the input for the vertical motion part of the beam optics calculations described in Fig. 3. From n=l to n=74 (47.1 MeV/A), the value of v increases from
z 0.10 to 0.35, and as expected, the major axis of the ellipse (and zmax) shrinks accordingly. But the major
axis then expands considerably between n=74 and n=99, even though V
z increases here from 0.35 to 0.90. Part
of this increase is caused by the well
coupling resonance which is crossed at The cause f or the re s t of the increase later.
known v = 2v r z 48.0 MeV/A (n=84). will be discussed
In order to investigate the coupling resonance more completely, f our more sets of orbits were calculated with the same initial (z, pz) values as above, but with
initial (r, Pr) values evenly spaced around the radial
eigen-ellipse for n=l shown in Fig. 5. These calculations reveal that the four (z, pz) ellipses remain
practically indistinguishable from the central ray ellipse all the way out to turn n=74, at least. This result confirms that radial-vertical coupling effects are insignificant prior to passage through the vr = 1
resonance which occurs between n=74 and 84.
99 around 48.0 MeV/A (n=84).
49.37 MeVlA
.2
Fig. 7 shows a superposition of all five (z, pz)
ellipses as they appear on turn 84, and on the same turns n=89 and 99 displayed in Fig. 6. As can be seen, the vr = 2v
z coupling resonance causes these ellipses
to fan out and to stretch by different amounts. The orbits pass through this resonance on turn n=84 (48.0 MeV/A), and, on turn n=89, the longest ellipse is about 2.5 times longer than the central ray ellipse.
Fig. 7 also reveals an unanticipated phenomenon. Between turns 89 and 99, all five ellipses continue to stretch and by almost exactly the same factor, about 1.7. This common elongation factor implies that the phenomenon is not produced by a coupling resonance. It seems instead to be caused by the orbits approaching close to the Vz 2/2 stop-band.
As noted near the end of Section 4, the Vz = 2/2
parametric resonance can be generated by the fringing field of the focusing and compensating bars. This is one of the effects deomonstrated in Fig. 8 which shows the changes in both vr and V z produced by these fring-
ing fields. In particular, we find that V z increases
from 0.83 to 0.90 at 49.4 MeV/A which corresponds to the final turn (n=99), and that this turn comes quite close to the V
z = 2/2 stop-band which starts at 49 .52
MeV/A.
Proceedings of the Eighth International Conference on Cyclotrons and their Applications, Bloomington, Indiana, USA
0018-9499/79/0400-2105$00.75 c○1979 IEEE 2105

.I
84. 48.0 Mev/A
-.1 Ft-----II---+--+--+-+---+--+----+-+--+--+--t-...... -+--+--t--+i -.2
(f) Q) .r.
.I
.~ O'~--+_----_+------+_----_+--~~~~---+------~-----+------~--~
N C.
-.1
89 48.46 MeV/A
-.2Fi--+ __ -+---i-+---+--t--........ -=t=---+-~+---+--+--f---=i .2
.1
- .1 99 49.37 Mev/A
The undesirable increase in z shown in both 1.2 max
Fig. 7. Effects of Coupling Resonance and Stop-band. Plots showing evolution of the Pz vs. z ellipses for the central
ray and four other accelerated orbits. The heavy solid ellipse pertains to the central ray and matches the data in Fig. 6 for n=89 and 99. The broken line ellipse applies to the orbit indicated by the arrow in Fig. 5, while the other three ellipses here pertain to every other one of the remaining orbits in that figure.
These five ellipses, which are indistinguishable prior to turn n=74, become sharply differentiated as they pass through the vr = 2vz coupling resonance
around turn n=84. Between n=89 and 99, all five ellipses stretch by almost the same factor, which indicates the approach of these orbits to the V
z = 2/2 stop-band
shown in Fig. 8.
Fig. 8. Effect of Field Perturbations on Focusing Frequencies. Plots of the radial and axial frequencies, vr and vz '
as a function of energy in the extraction region . The solid curve shows the results obtained with the total field including the perturbations of the focusing and compensating bars. The broken curve represents the results obtained in the original unperturbed field.
Because of complications at the vr = 3/3 resonance, the equilibrium
orbit disappears between 47 .3 and 47.7 MeV/A as a result of the field perturbations. These perturbations also produce the Vz = 2/2 stop-band observed
between 49.52 and 49 .65 MeV/A.
TF Fig. 6 and Fig. 7 between n=89 and 99 can therefore be attributed to what may be called the "focusing bar resonance". Fig. 7 also demonstrates that this resonance aggravates significantly the effect of the vr = 2V
z
----- U F
coupling resonance. The overall enlargement of the axial phase space area will manifest itself as beam "halo", and will probably lead to some beam loss. However, this loss should not be serious as long as tight control is maintained over the amount of offcenteredness resulting from the vr = 1 resonance.
References
1) H. Blosser "The Michigan State University Superconducting Cyclotron Program" - paper at this Conference.
.8
.6
Extr. .4 En .
j 49
.2~--~~--~--~--~--~~ __ ~-L-U 47 48 50
MeV/A
Proceedings of the Eighth International Conference on Cyclotrons and their Applications, Bloomington, Indiana, USA
2106 0018-9499/79/0400-2106$00.75 c○1979 IEEE


![Manual Completo de Electricidad Industrial [C78]](https://static.fdocuments.in/doc/165x107/55cf9a95550346d033a2755d/manual-completo-de-electricidad-industrial-c78.jpg)