Beacon Presentation EPA NARPM Annual Training
40
1 High Resolution Site Characterization and Indoor Air Sampling Techniques for VOCs/SVOCs Presented by: Harry O’Neill President Beacon Environmental Services, Inc. 30 November 2012 National Association of Remedial Project Managers Annual Training Program
-
Upload
harryoneill -
Category
Documents
-
view
188 -
download
0
Transcript of Beacon Presentation EPA NARPM Annual Training

1
High Resolution Site Characterization and Indoor Air Sampling Techniques for
VOCs/SVOCs
Presented by:Harry O’Neill
PresidentBeacon Environmental Services, Inc.
30 November 2012
National Association of Remedial Project Managers Annual Training Program

2
Road Map
• Beacon Environmental: Background, Experience, and Certifications
• Sorbent samplers
• Passive Soil Gas (PSG) Surveys – High Resolution Site Characterization
• PSG Survey Case Study – DoD Facility
• Sorbent samplers to measure VOC concentrations
• Passive Diffusion Samplers Case Study – 14 Day Sampling Period at
DoD Facility
• Conclusions
3
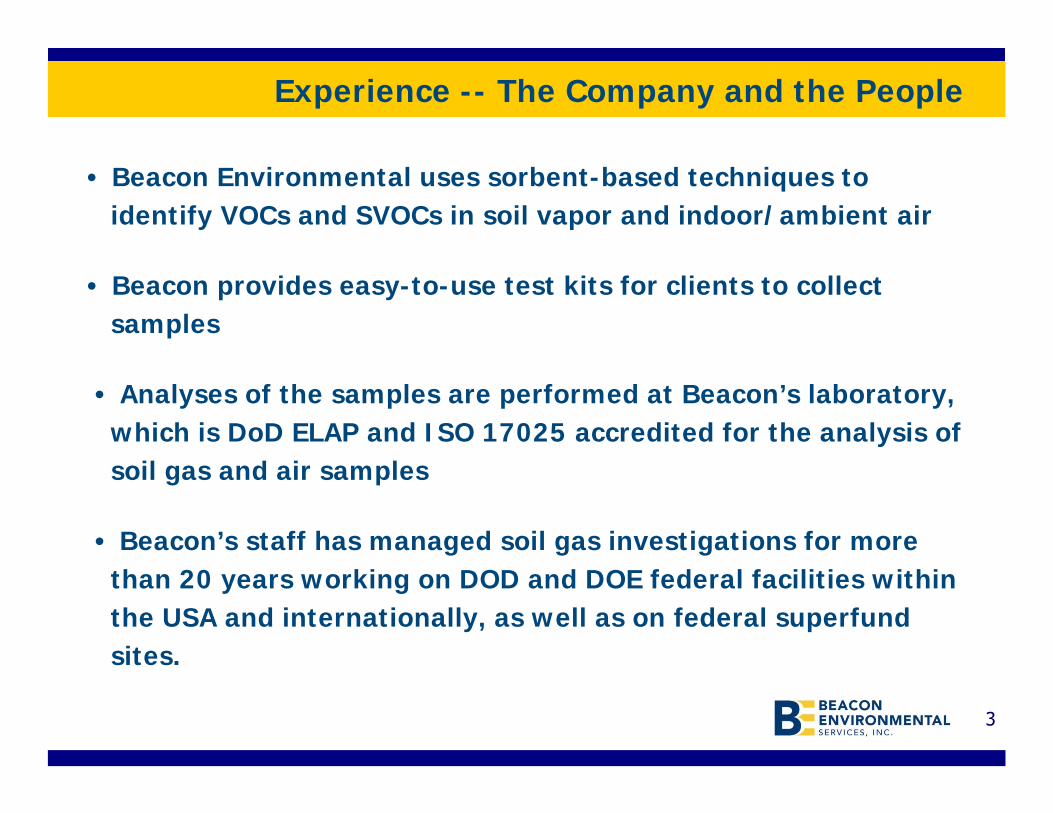
Experience -- The Company and the People
• Beacon Environmental uses sorbent-based techniques to identify VOCs and SVOCs in soil vapor and indoor/ambient air
• Beacon provides easy-to-use test kits for clients to collect samples
• Analyses of the samples are performed at Beacon’s laboratory, which is DoD ELAP and ISO 17025 accredited for the analysis of soil gas and air samples
• Beacon’s staff has managed soil gas investigations for more than 20 years working on DOD and DOE federal facilities within the USA and internationally, as well as on federal superfund sites.

4
Laboratory Accreditation
Accredited Analytical Methods:
U.S. EPA Methods 8260C, TO-17, and TO-15
Beacon’s Quality System ensures consistent and reliable results
Beacon is a specialized laboratory focused on providing highly accurate soil gas and air data
Accredited in accordance with:U.S. DoD Environmental Laboratory Accreditation Program (ELAP)
ISO/IEC 17025:2005
5
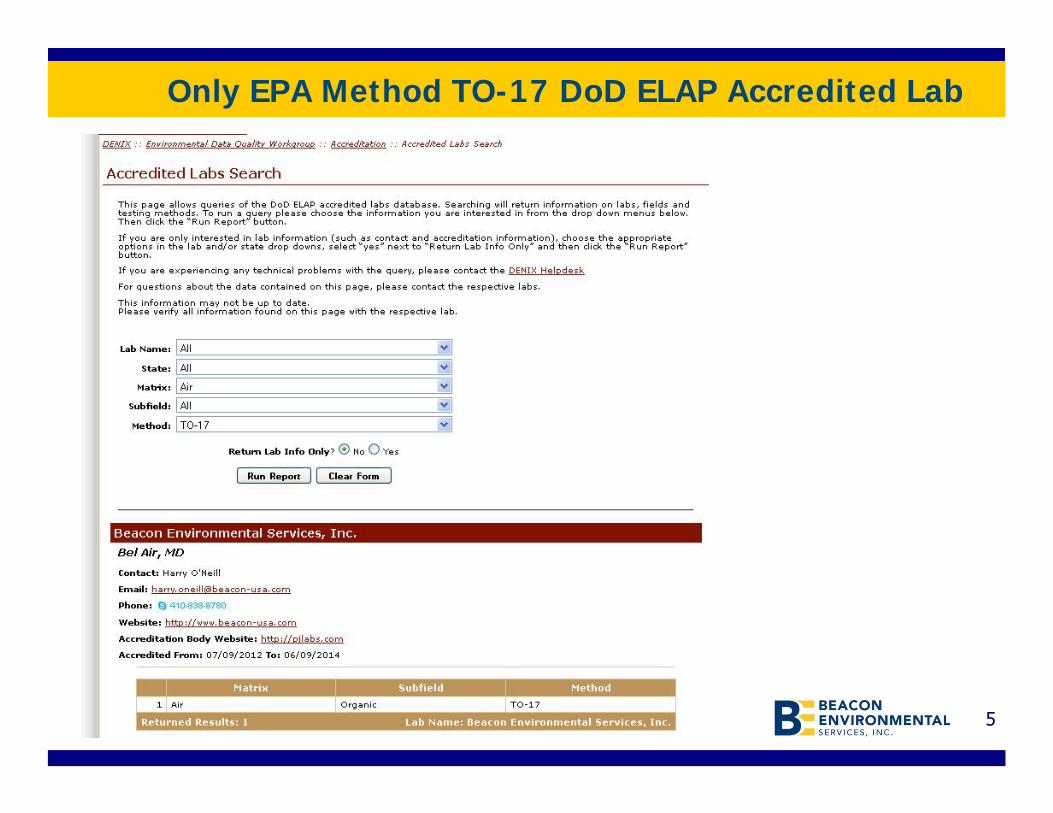
Only EPA Method TO-17 DoD ELAP Accredited Lab
6
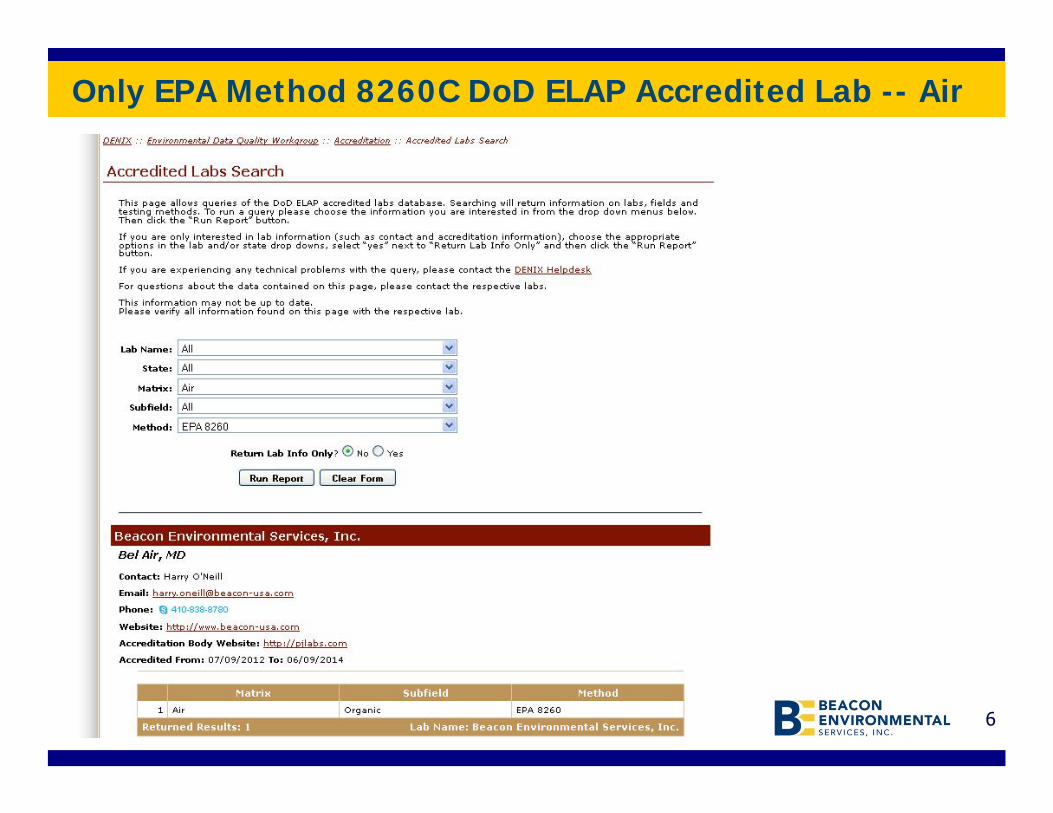
Only EPA Method 8260C DoD ELAP Accredited Lab -- Air

7
Field Sampling Accreditation
Accredited for the collection of soil gas and air samples.
Passive and Active sampling methods.
*First and only company in the nation to receive NEFAP accreditation.*
Beacon provides our services through easy to use field kits, but also has trained personnel to collect soil gas or air samples
Accredited in accordance with:TNI National Environmental Field Activities Program (NEFAP ) Accredited
for Environmental Field Sampling (Air and Emissions)
8
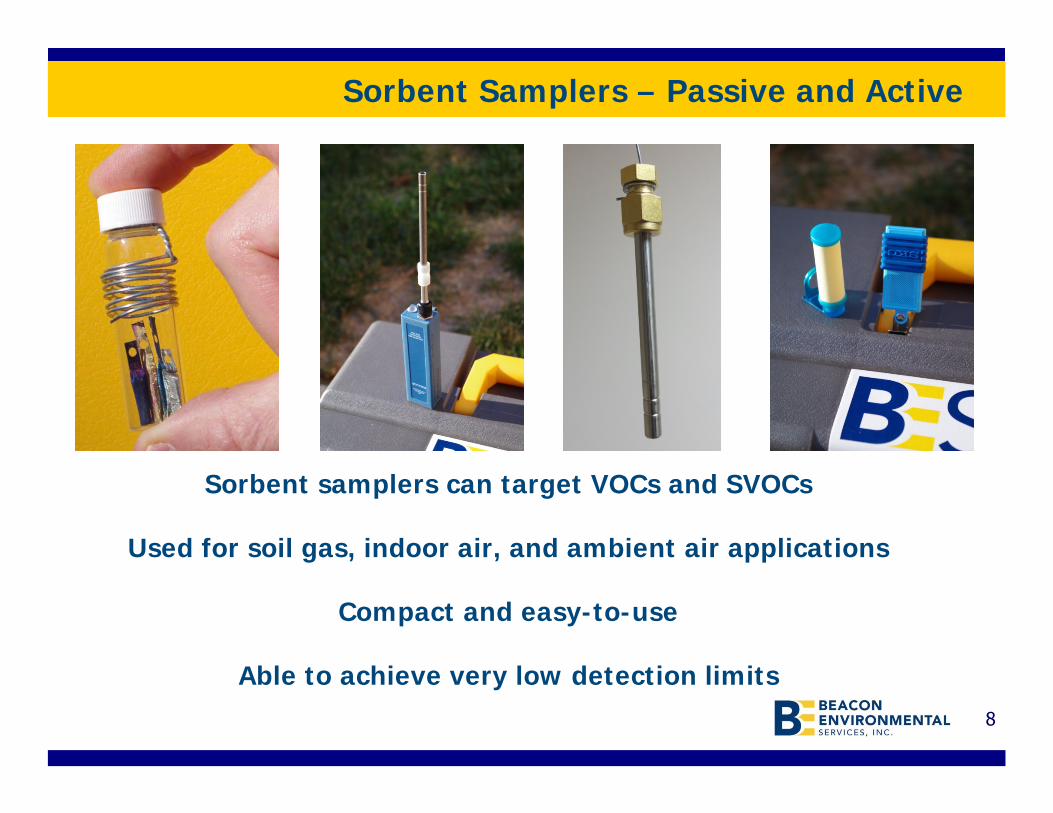
Sorbent Samplers – Passive and Active
Sorbent samplers can target VOCs and SVOCs
Used for soil gas, indoor air, and ambient air applications
Compact and easy-to-use
Able to achieve very low detection limits
9
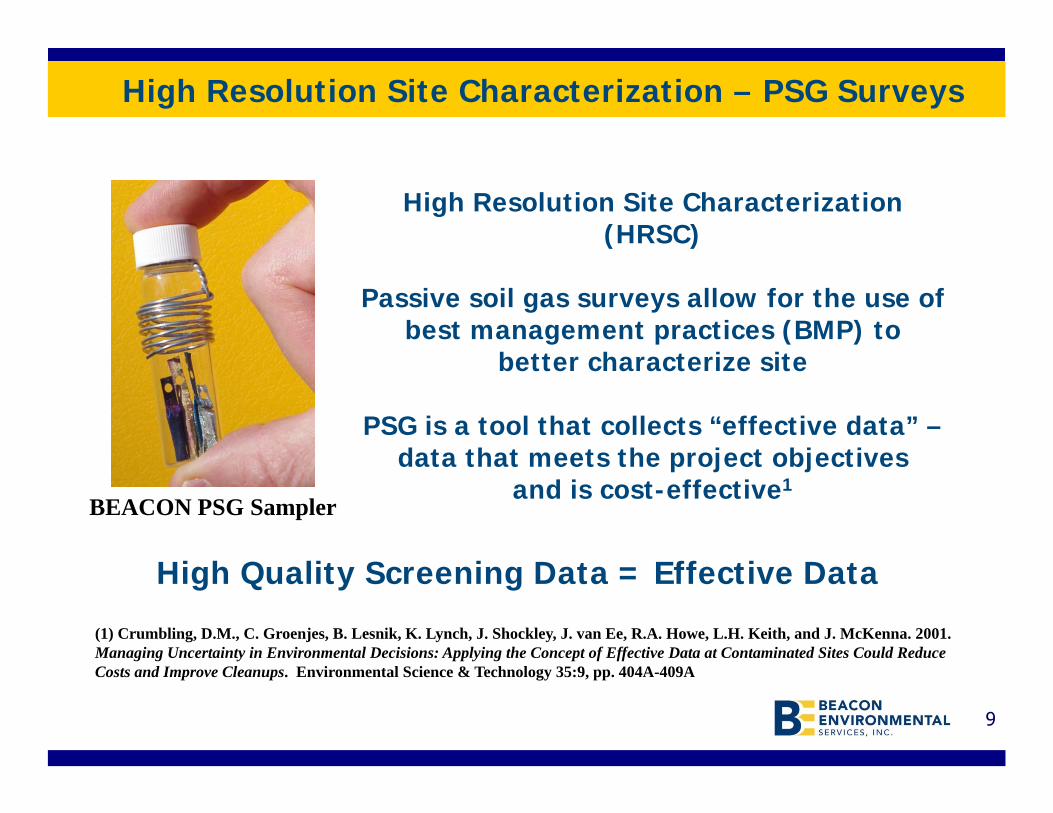
High Resolution Site Characterization – PSG Surveys
High Resolution Site Characterization (HRSC)
Passive soil gas surveys allow for the use of best management practices (BMP) to
better characterize site
PSG is a tool that collects “effective data” –data that meets the project objectives
and is cost-effective1
(1) Crumbling, D.M., C. Groenjes, B. Lesnik, K. Lynch, J. Shockley, J. van Ee, R.A. Howe, L.H. Keith, and J. McKenna. 2001. Managing Uncertainty in Environmental Decisions: Applying the Concept of Effective Data at Contaminated Sites Could Reduce Costs and Improve Cleanups. Environmental Science & Technology 35:9, pp. 404A-409A
High Quality Screening Data = Effective Data
BEACON PSG Sampler
10
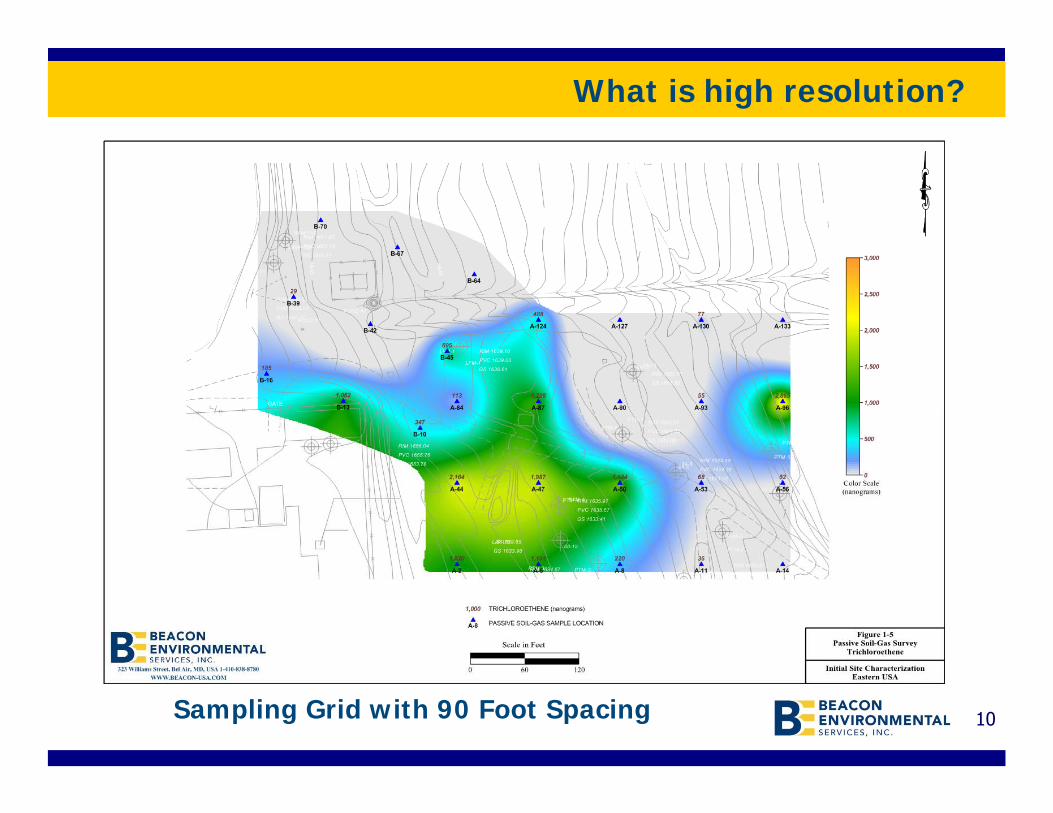
What is high resolution?
Sampling Grid with 90 Foot Spacing

11
High Resolution – Now you got the picture
HRSC Sampling Grid with 30 Foot Spacing
12
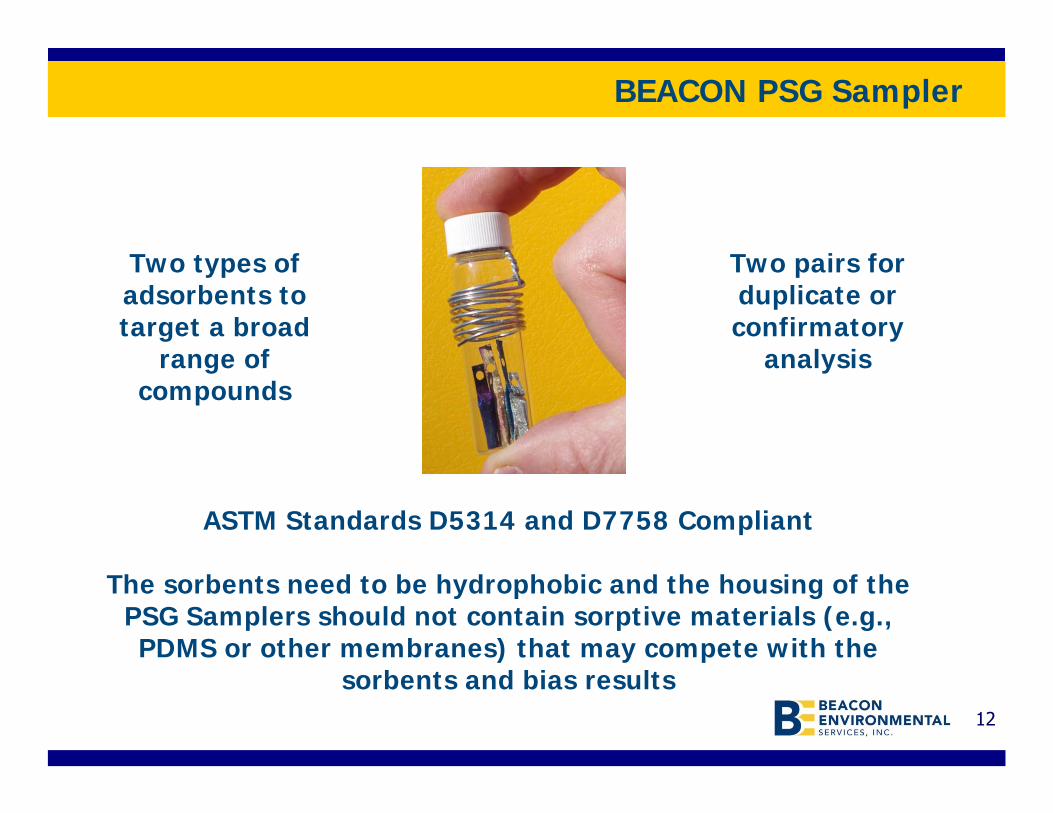
BEACON PSG Sampler
ASTM Standards D5314 and D7758 Compliant
The sorbents need to be hydrophobic and the housing of the PSG Samplers should not contain sorptive materials (e.g., PDMS or other membranes) that may compete with the
sorbents and bias results
Two types of adsorbents to target a broad
range of compounds
Two pairs for duplicate or confirmatory
analysis

13
Passive Soil Gas Sample Collection Kit
Passive Soil Gas Technologies are typically provided through sample collection kits and
only require hand tools for sample collection.
14
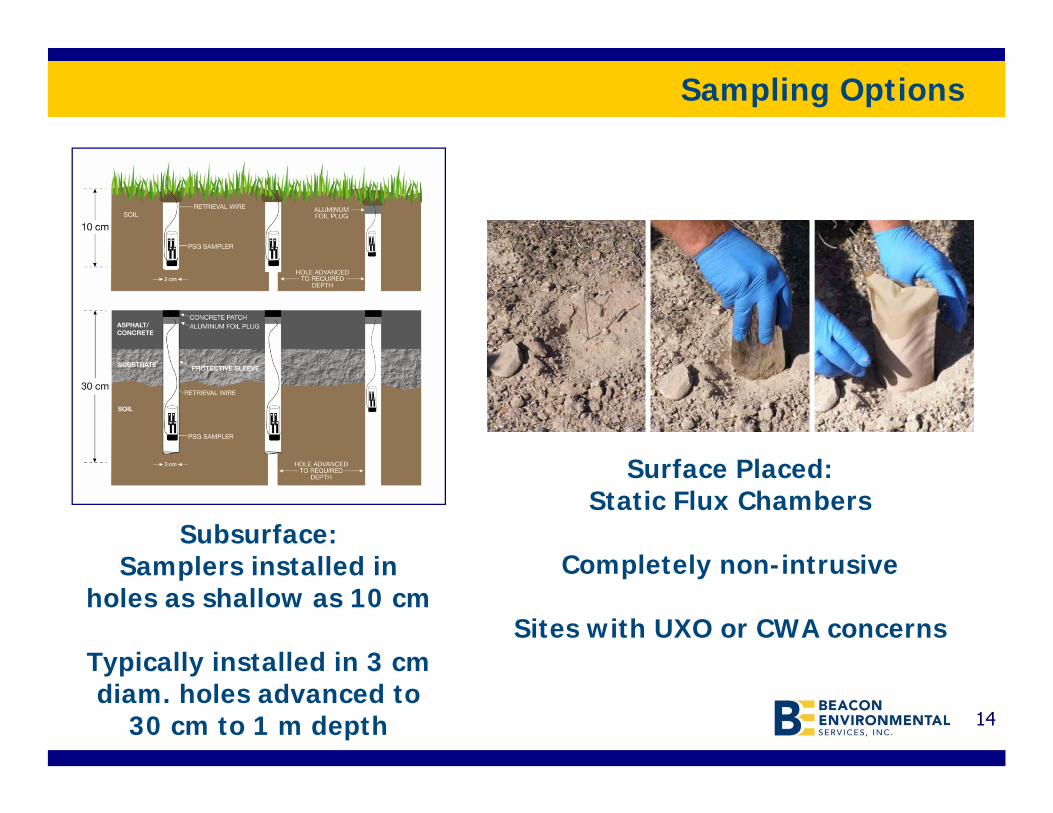
Sampling Options
Subsurface:Samplers installed in
holes as shallow as 10 cm
Typically installed in 3 cm diam. holes advanced to
30 cm to 1 m depth
Surface Placed:Static Flux Chambers
Completely non-intrusive
Sites with UXO or CWA concerns
15
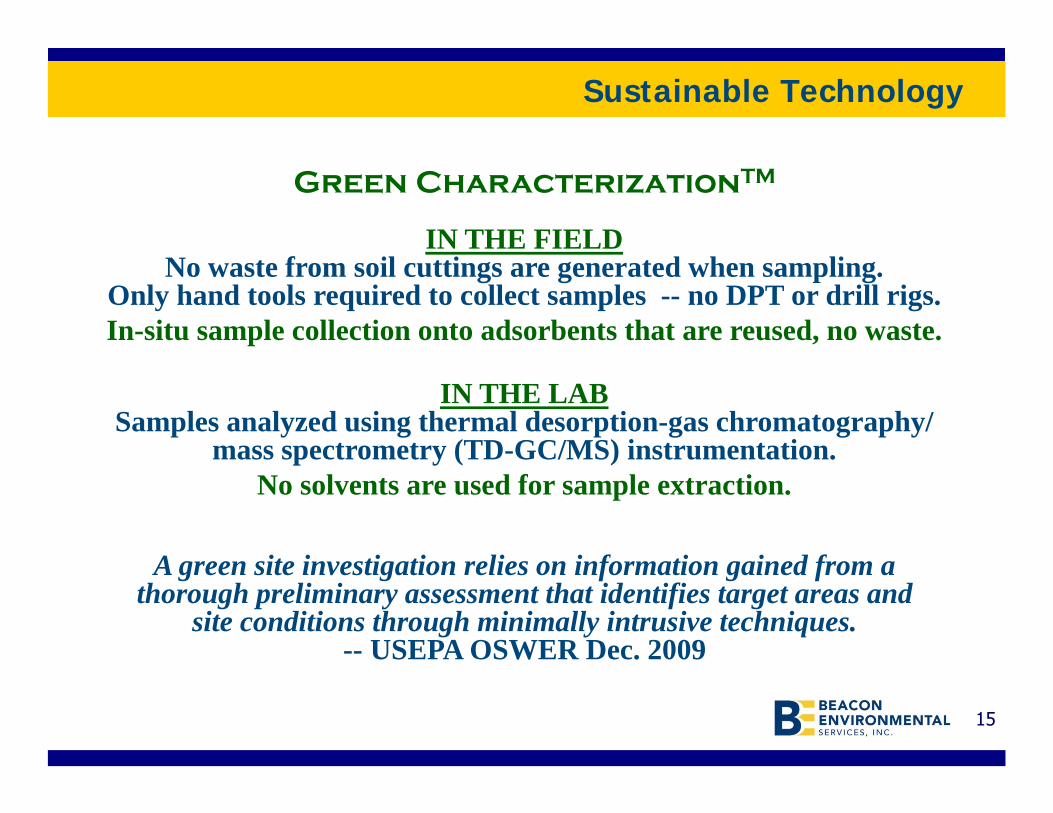
Sustainable Technology
IN THE FIELDNo waste from soil cuttings are generated when sampling.
Only hand tools required to collect samples -- no DPT or drill rigs.In-situ sample collection onto adsorbents that are reused, no waste.
IN THE LABSamples analyzed using thermal desorption-gas chromatography/
mass spectrometry (TD-GC/MS) instrumentation.No solvents are used for sample extraction.
Green CharacterizationTM
A green site investigation relies on information gained from a thorough preliminary assessment that identifies target areas and
site conditions through minimally intrusive techniques. -- USEPA OSWER Dec. 2009

16
Benefits of HRSC
High Density, Low Cost Low Density, High Cost
High Resolution Site Characterization (HRSC)
17
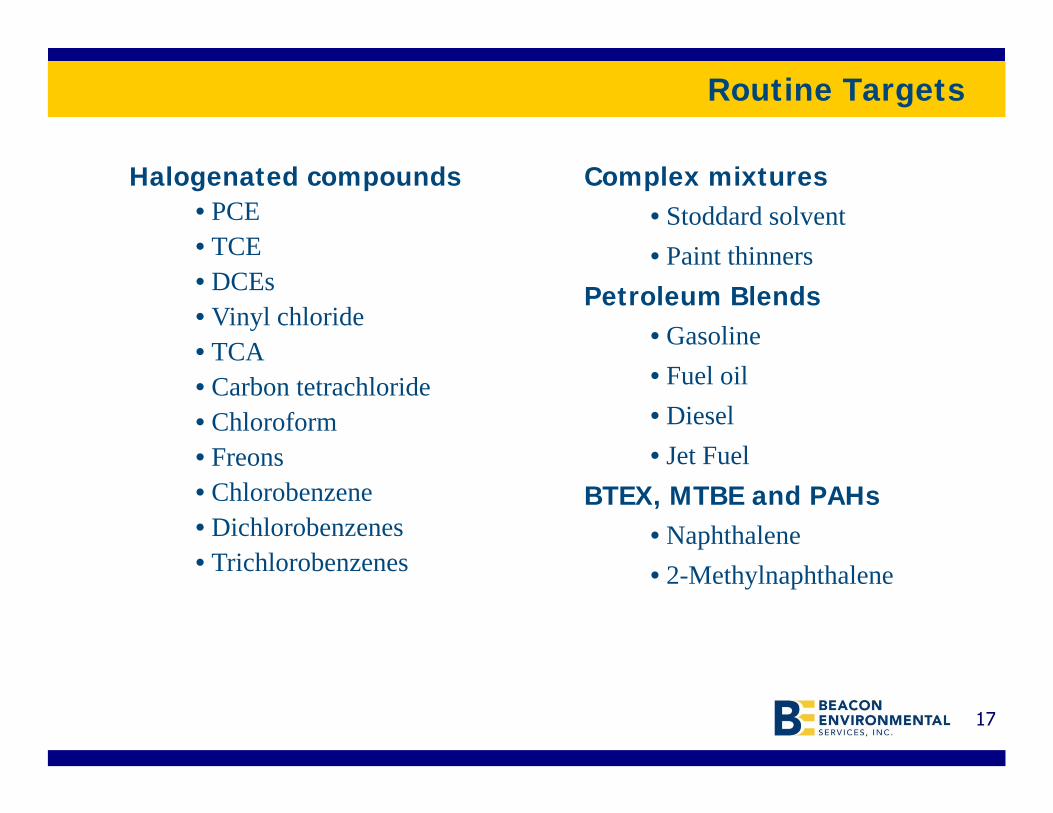
Routine Targets
Halogenated compounds• PCE • TCE • DCEs • Vinyl chloride• TCA • Carbon tetrachloride• Chloroform• Freons• Chlorobenzene• Dichlorobenzenes• Trichlorobenzenes
Complex mixtures• Stoddard solvent• Paint thinners
Petroleum Blends• Gasoline • Fuel oil• Diesel• Jet Fuel
BTEX, MTBE and PAHs• Naphthalene• 2-Methylnaphthalene

18
Additional Targets
Heavier PAHs
• Acenaphthalene, Fluorene, Pyrene
Ketones
Alcohols
Explosives
• Nitrotoluenes, Dinitrotoluenes, Nitrobenzenes
Pesticides
Chemical Warfare Agent (CWA) and Breakdown Products
• Mustard, GB, VX, 1,4-Thioxane, 1,4-Dithiane, Thiodiglycol
Mercury (Hg)
Total Nitrotoluenes & DNTs

19
HRSC Case Study: Source Area Identification
Objectives:Identify sources of contamination in gw
Challenges:Legacy contamination remains from undocumented activities
Heavily wooded area
Area receives significant rainfall
20
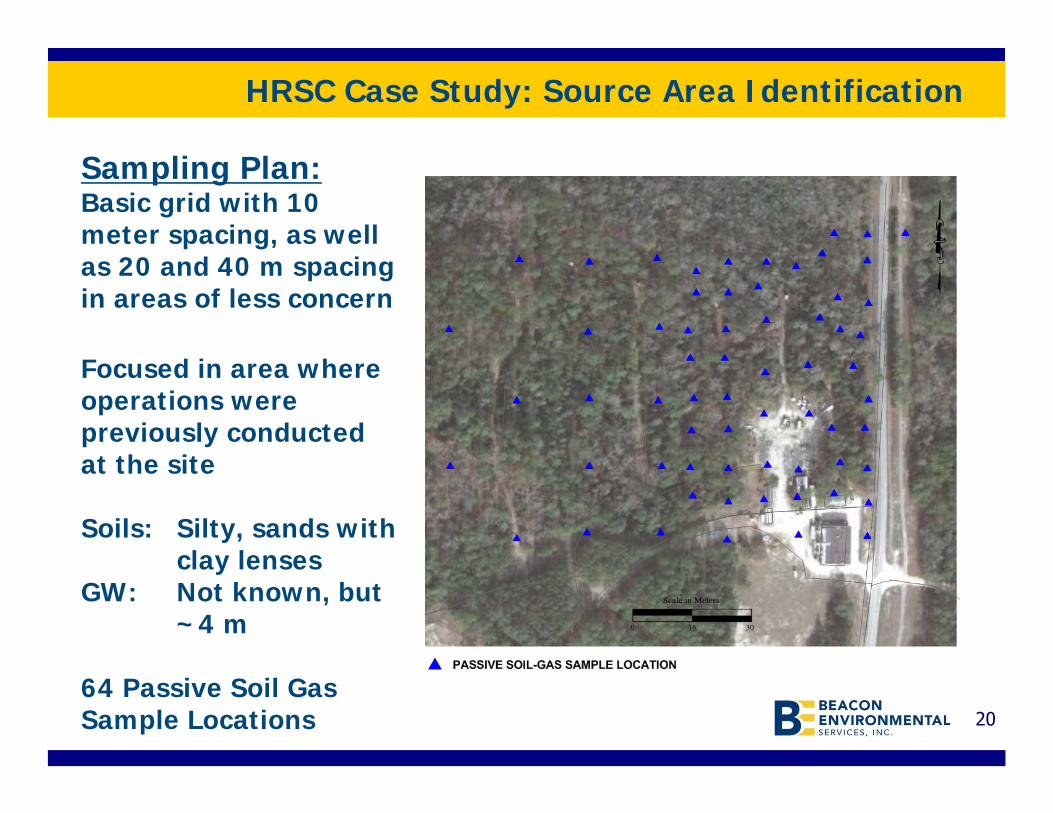
HRSC Case Study: Source Area Identification
Sampling Plan:Basic grid with 10 meter spacing, as well as 20 and 40 m spacing in areas of less concern
Focused in area where operations were previously conducted at the site
Soils: Silty, sands with clay lenses
GW: Not known, but ~4 m
64 Passive Soil Gas Sample Locations
21
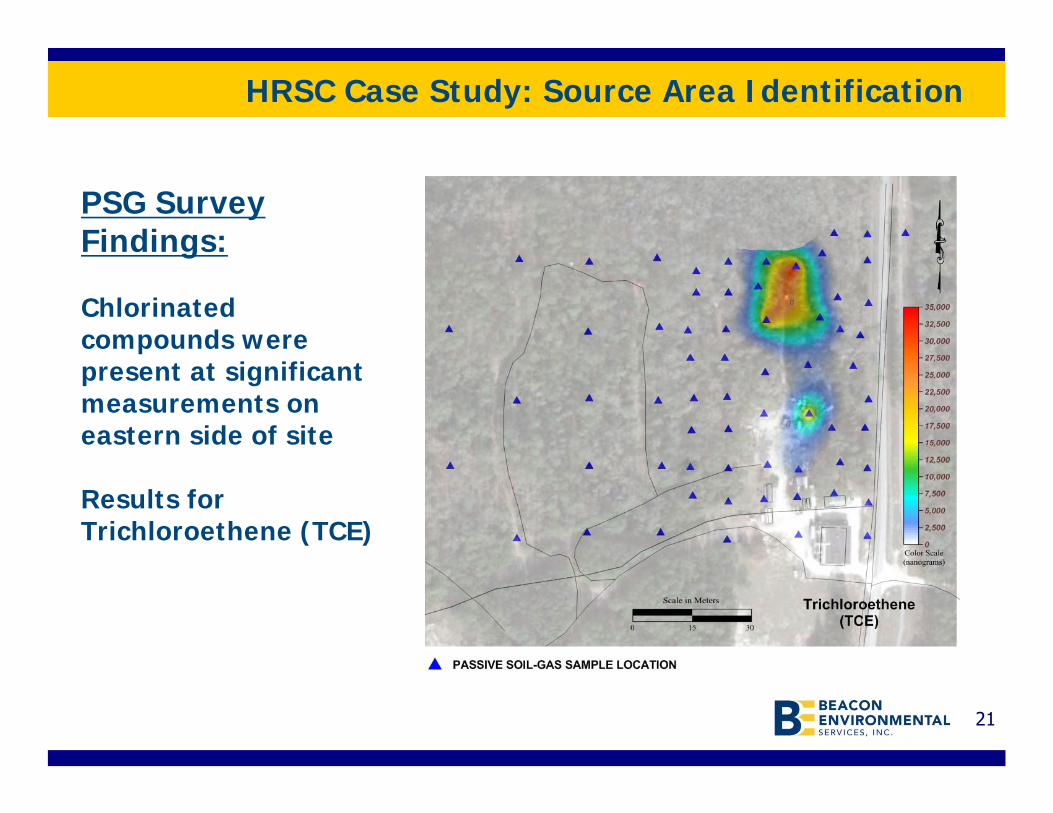
HRSC Case Study: Source Area Identification
PSG Survey Findings:
Chlorinated compounds were present at significant measurements on eastern side of site
Results for Trichloroethene (TCE)

22
HRSC Case Study: Source Area Identification
Findings:
Results for Tetrachloroethene(PCE)

23
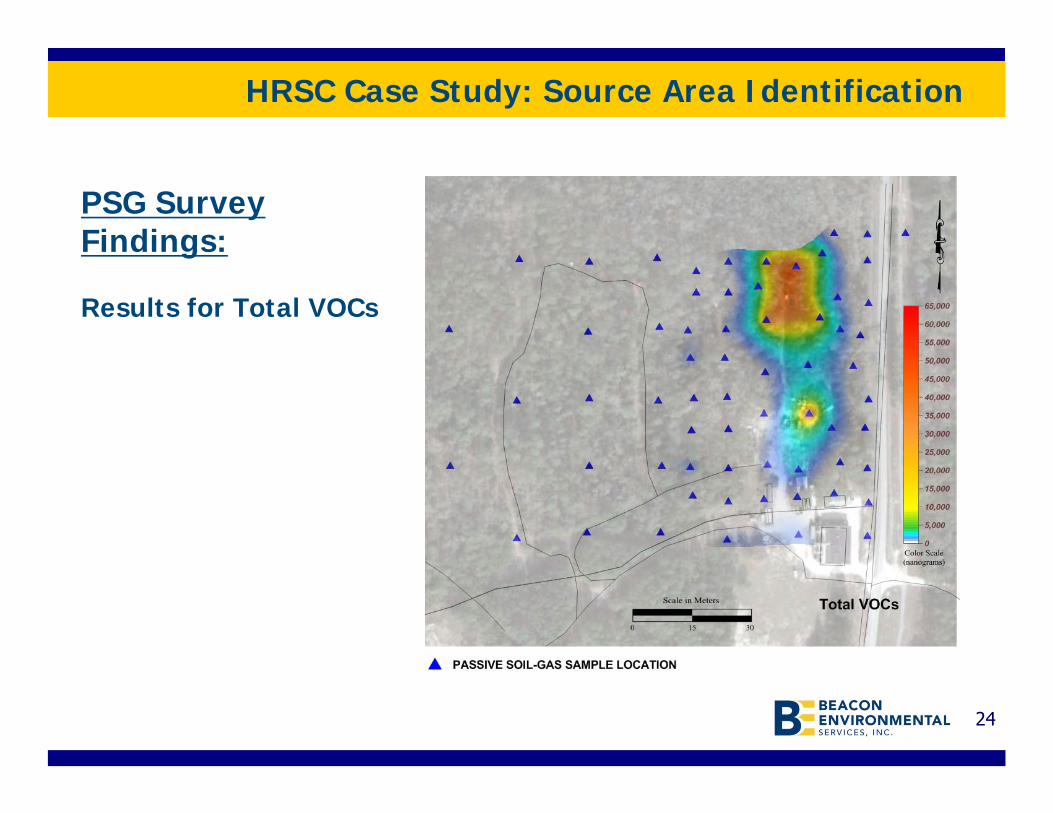
HRSC Case Study: Source Area Identification
PSG Survey Findings:
Results for 1,1,2,2-Tetrachloroethane (R-130)
24
HRSC Case Study: Source Area Identification
PSG Survey Findings:
Results for Total VOCs

25
HRSC Case Study: Source Area Identification
Soil Sampling:Soil samples were collected at locations reporting highest measurements in the PSG survey, as well as at contaminant boundary areas and areas reporting non-detects.
Contamination was expected to be found closer to where site activities occurred.

26
HRSC Case Study: Source Area Identification
Soil Sampling Results:
Samples collected at 1 to 1.5 m depth at multiple intervals of soil column using Terra Core sampler
Strategy was to sample at “hot spots” and confirm the non-detects from the passive soil gas survey

27
HRSC Case Study: Source Area Identification
PSG and Soil Results:Soil samples confirmed the results of the PSG survey and identified a significant source area.
An additional source area is expected to be present where the second highest soil sample was collected. The next phase includes collecting additional samples to identify the exact location of this more discrete release.

28
HRSC Case Study: Source Area Identification
PSG and Soil Results:Soil sampling alone likely would not have identified source areas, as evident at location reporting low soil concentrations.
The PSG survey just as importantly indicated where no additional sampling is required as was confirmed with the soil sampling.
Two GW wells are being installed at “hot spots.”

29
Reported Data in Units of Mass… Not Concentration
PSG data should not be reported in units of conc.Reliable relative values in mass between sample
locations are important
All soil gas guidance documents clearly state data not to be used for determining concentration
No agencies or regulators accepting PSG data converted to concentration, but Beacon can provide “rule of thumb” estimates based on empirical data
However, reporting data in units of mass (ng or ug) meets project objectives to characterize sites and guide where to collect a limited number of soil, gw, or active soil gas samples

30
EPA Method TO-17 Provides Concentration Data
PDS
No pumps
required
Method TO-17
Uses low-flow pumps
Tubes: Method TO-17 with pumpPassive Diffusion Samplers

31
EPA Method TO-15 – Summa Canisters
In two Method TO-15 interlaboratory comparisons administered by ERA the acceptance range for PCE results were:−33% to 168% (July -Sept 2009 study)−56% to 131% (October – November 2007 study)
In a 2007 TO-14/TO-15 study conducted by Scott Specialty Gasses the reported values for toluene reported by 12 labs varied from 51%-290%
Source: Short-term Variability, Radon Tracer, and Longterm Passive Sampler Performance in the FieldPresented at AEHS 2012 by Christopher Lutes, Brian Cosky, Robert Uppencamp, and Lilian Abreu (ARCADIS)Brian Schumacher and John Zimmerman (US EPA National Exposure Research Laboratory), Robert Truesdale and Shu-yiLin (RTI International), Heidi Hayes (Air Toxics Ltd.), Blayne Hartman (Hartman Environmental Geosciences)
No technique is perfect, but something to consider:
32
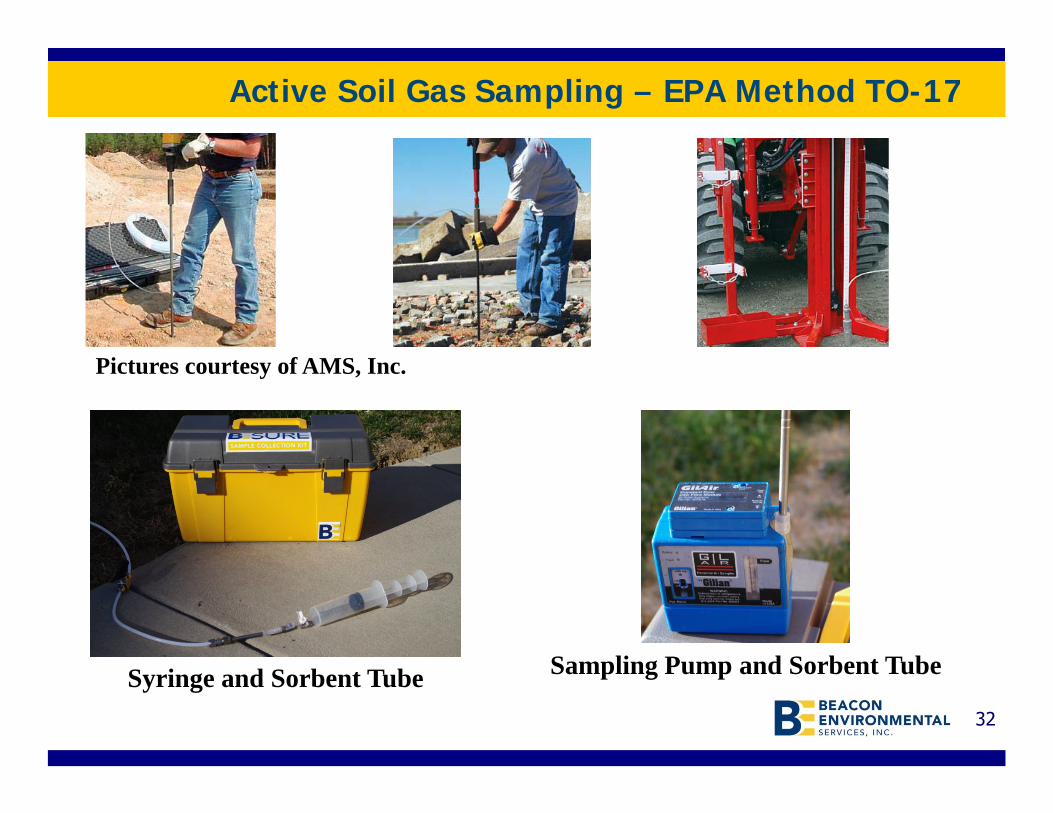
Active Soil Gas Sampling – EPA Method TO-17
Syringe and Sorbent Tube Sampling Pump and Sorbent Tube
Pictures courtesy of AMS, Inc.

33
Indoor Air Sampling with Sorbents – Active and Passive
Calculate concentration:
ug/m3 = mass/(flow rate x time)
mass = nanogramsflow rate = ml/min
time = minutes(e.g., 1000 x ng/ml = ng/L = ug/m3)
Calculate concentration:
ug/m3 = mass/(uptake rate x time)
mass = nanogramsuptake rate = ml/min
time = minutes(e.g., 1000 x ng/ml = ug/m3)
Active Sampling Passive Sampling

34
Passive Sampling – 14 day Sampling Periods
Vapor Intrusion Study – June 2012Industrial Building –Naval Facility
Building is slab on grade and total area is approximately 56,700 ft2
Sampled in office spaces and kitchen with 8-ft ceilings, as well as outside
Prior subslab soil vapor samples recorded PCE and TCE ranging from 200 to 120,000 ug/m3
24-Hour Summa canister samples were compared to samples collected with passive sorbent tubes over a 14-day period
Project Management: CH2M Hill

35
Passive Sampling – 14 day Sampling Periods
Two Sorbent Tubes at each location
Summa canister
36
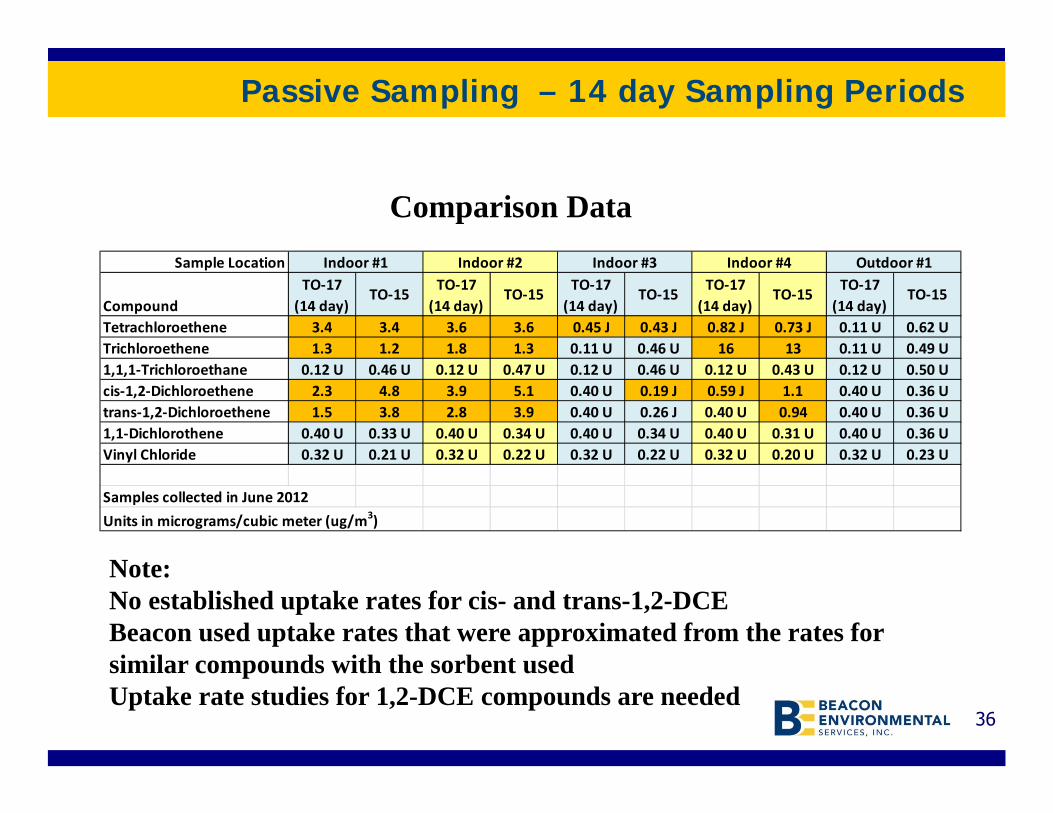
Passive Sampling – 14 day Sampling Periods
Comparison Data
Note: No established uptake rates for cis- and trans-1,2-DCEBeacon used uptake rates that were approximated from the rates for similar compounds with the sorbent usedUptake rate studies for 1,2-DCE compounds are needed
Sample Location
CompoundTO‐17 (14 day)
TO‐15 TO‐17 (14 day)
TO‐15 TO‐17 (14 day)
TO‐15 TO‐17 (14 day)
TO‐15 TO‐17 (14 day)
TO‐15
Tetrachloroethene 3.4 3.4 3.6 3.6 0.45 J 0.43 J 0.82 J 0.73 J 0.11 U 0.62 UTrichloroethene 1.3 1.2 1.8 1.3 0.11 U 0.46 U 16 13 0.11 U 0.49 U1,1,1‐Trichloroethane 0.12 U 0.46 U 0.12 U 0.47 U 0.12 U 0.46 U 0.12 U 0.43 U 0.12 U 0.50 Ucis‐1,2‐Dichloroethene 2.3 4.8 3.9 5.1 0.40 U 0.19 J 0.59 J 1.1 0.40 U 0.36 Utrans‐1,2‐Dichloroethene 1.5 3.8 2.8 3.9 0.40 U 0.26 J 0.40 U 0.94 0.40 U 0.36 U1,1‐Dichlorothene 0.40 U 0.33 U 0.40 U 0.34 U 0.40 U 0.34 U 0.40 U 0.31 U 0.40 U 0.36 UVinyl Chloride 0.32 U 0.21 U 0.32 U 0.22 U 0.32 U 0.22 U 0.32 U 0.20 U 0.32 U 0.23 U
Samples collected in June 2012Units in micrograms/cubic meter (ug/m3)
Indoor #1 Indoor #2 Indoor #3 Indoor #4 Outdoor #1

37
Passive Sampling – 14 day Sampling Periods
Comparison Data
Strong correlation between passive diffusion sorbent tubes and summa canister data for the two primary compounds of concern (PCE and TCE) considering different sampling durations and sampling methods.
Both compounds have established uptake rates for the sorbent tubes used
ISO 16017-2: Indoor, ambient and workplace air -- Sampling and analysis of volatile organic compounds by sorbent tube/thermal desorption/capillary gas chromatography -- Part 2: Diffusive sampling
Sample Location
CompoundTO‐17 (14 day)
TO‐15 RPD TO‐17 (14 day)
TO‐15 RPD TO‐17 (14 day)
TO‐15 RPD TO‐17 (14 day)
TO‐15 RPD
Tetrachloroethene 3.4 3.4 0% 3.6 3.6 0% 0.45 J 0.43 J 5% 0.82 J 0.73 J 12%Trichloroethene 1.3 1.2 8% 1.8 1.3 32% 0.11 U 0.46 U NA 16 13 21%
Samples collected in June 2012Units in micrograms/cubic meter (ug/m3)
Indoor #1 Indoor #2 Indoor #3 Indoor #4

38
Conclusions
• Sorbent technologies can be used to target a broad range of VOCs and SVOCs employing easy-to-use techniques for time integrated measurements
• Passive soil gas methods allow for the rapid collection of data to produce high resolution data sets to collect “effective data”
• High resolution site characterization allows you to better delineate contamination and refine the conceptual site model (CSM)
• PSG surveys allow you to reduce the number of required soil, soil gas, and groundwater samples, which reduces the overall project costs.
• Based on the described study and other prior sampling, passive diffusion samplers allow you to sample over several days or weeks to measure organic compounds in indoor and ambient air providing a sample that may be more representative of average concentrations

39
Any Questions?

40
Thank you
Please contact us if you have any questions, to discuss project applications, or schedule training at your regional office:
Beacon Environmental Services, Inc.Harry O’Neill
Bel Air, MD USA1-410-838-8780
Thank you!