Beach nourishment projects, practices, and objectives—a ...
31
ELSEVIER Coastal Engineering 47 (2002) 81-111 Coastal Engineering Ali International Journal for Coastal, Harbour and Offshore Engineers www. elsevier. com/locate/coastaleng Beach nourishment projects, practices, and objectives—a European overview H. Hanson a’*, A. Bramptonb, M. Capobiancoc, H.H. Detted, L. Hamm6, C. Laustmpf, A. Lechuga8, R. Spanhoffh a Department of Water Research Engineering, University of Lund, P.O. Box 118, 22100 Lund, Sweden b Coastal Group, HR Wallingford, Howbery Park, Wallingford, Oxon 0X10 8BA, UK CSATE Srl-Systems and Advanced Technologies Engineering, Santa Croce 664/a, 30135 Venice, Italy Leichtweiss Institut fur Wasserbau, Technischen Universität Braunschweig, P.O. Box 3329, D-38023, Brunswick, Germany e SOGREAH Ingénierie, 6 rue de Lorraine, 38130 Echirolles, France fDanish Coastal Authority, P.O. Box 100, DK 7620 Lemvig, Denmark g Centro de Estudios de Puertos y Costas, Antonio López 81, 28024 Madrid, Spain hNational Institute for Coastal and Marine Management/RIKZ, Ministry of Transport, Public Works, and Water Management, P.O. Box 20907, 2500 EX, The Hague, The Netherlands Abstract The uses of beach fill in the countries of the European Union are highlighted and discussed with respect to the general situation, project type and objectives, design and evaluation procedures, legal framework, and financial aspects. As expected, significant differences were found among the investigated countries. In general, the study shows that it would be very profitable for south European countries to leam about the Dutch and German practices, particularly regarding the long-term coastal management and the regular monitoring of the coastal morphology. On the other hand, recent Dutch experience has shown that their legal system is a bit rigid, leading sometimes to renourishments that are less necessary to reach the global objective. © 2002 Elsevier Science B.V. All rights reserved. Keywords: Beach fill; Beach nourishment; Nourishment design; Evaluation procedures 1. Introduction The present study is part of a project called SAFE {Performance of Soft Beach Systems and Nourish ment Measures for European Coasts), sponsored by the European Commission. This project, conducted between March 1996 and June 1999, aimed at contributing to the improvement of the design prac- * Corresponding author. Fax: +46-46-222-4435. E-mail address: [email protected] (H. Hanson). tices of artificial nourishment schemes in Europe (Hamm et ah, 2002, this issue). As a part of this project, an inventory of and a comparison between the major nourishment countries involved in the SAFE project were performed. The objective of this particular study is to com pile, disseminate, and exchange national information on a European level concerning beach fill operations for coastal protection, on the projects involved and on the practices used. A tour is taken through the major beach nourishment countries in Europe, in no 0378-3839/02/$ - see front matter © 2002 Elsevier Science B.V. All rights reserved. PII: S0378-3839(02)00122-9
Transcript of Beach nourishment projects, practices, and objectives—a ...

ELSEVIER Coastal Engineering 47 (2002) 81-111
CoastalEngineeringAli International Journal for Coastal, Harbour and Offshore Engineers
www. elsevier. com/locate/coastaleng
Beach nourishment projects, practices, and objectives—a European overview
H. Hanson a’*, A. Bramptonb, M. Capobiancoc, H.H. Detted, L. Hamm6,C. Laustmpf, A. Lechuga8, R. Spanhoffh
a Department o f Water Research Engineering, University o f Lund, P.O. Box 118, 22100 Lund, Sweden b Coastal Group, HR Wallingford, Howbery Park, Wallingford, Oxon 0X10 8BA, UK
CSATE Srl-Systems and Advanced Technologies Engineering, Santa Croce 664/a, 30135 Venice, Italy Leichtweiss Institut fu r Wasserbau, Technischen Universität Braunschweig, P.O. Box 3329, D-38023, Brunswick, Germany
e SOGREAH Ingénierie, 6 rue de Lorraine, 38130 Echirolles, France fDanish Coastal Authority, P.O. Box 100, DK 7620 Lemvig, Denmark
g Centro de Estudios de Puertos y Costas, Antonio López 81, 28024 Madrid, Spain hNational Institute fo r Coastal and Marine Management/RIKZ, Ministry o f Transport, Public Works, and Water Management,
P.O. Box 20907, 2500 EX, The Hague, The Netherlands
Abstract
The uses of beach fill in the countries of the European Union are highlighted and discussed with respect to the general situation, project type and objectives, design and evaluation procedures, legal framework, and financial aspects. As expected, significant differences were found among the investigated countries. In general, the study shows that it would be very profitable for south European countries to leam about the Dutch and German practices, particularly regarding the long-term coastal management and the regular monitoring of the coastal morphology. On the other hand, recent Dutch experience has shown that their legal system is a bit rigid, leading sometimes to renourishments that are less necessary to reach the global objective.© 2002 Elsevier Science B.V. All rights reserved.
Keywords: Beach fill; Beach nourishment; Nourishment design; Evaluation procedures
1. Introduction
The present study is part of a project called SAFE {Performance o f Soft Beach Systems and Nourishment Measures for European Coasts), sponsored by the European Commission. This project, conducted between March 1996 and June 1999, aimed at contributing to the improvement of the design prac-
* Corresponding author. Fax: +46-46-222-4435. E-mail address: [email protected] (H. Hanson).
tices of artificial nourishment schemes in Europe (Hamm et ah, 2002, this issue). As a part of this project, an inventory of and a comparison between the major nourishment countries involved in the SAFE project were performed.
The objective of this particular study is to compile, disseminate, and exchange national information on a European level concerning beach fill operations for coastal protection, on the projects involved and on the practices used. A tour is taken through the major beach nourishment countries in Europe, in no
0378-3839/02/$ - see front matter © 2002 Elsevier Science B.V. All rights reserved. PII: S 0 3 7 8 -3 8 3 9 (0 2 )0 0 122-9

82 H. Hanson et al. / Coastal Engineering 47 (2002) 81-111
particular order, describing the present situation. For each country, the general situation is briefly discussed together with an overall description of project types, objectives, design, and evaluation. In the concluding section of this paper, a comparison between the different countries is presented, where common features as well as differences are discussed. This includes the more detailed design as- pects-methods, considerations, constraints, fill types, methodologies, and equipment. The paper also gives a brief description of the beach nourishment situation in other countries of the European Union.
2. Beach fills in Germany (DE)
Germany has 1900 km of coastline. Of this, just under one third consists of sandy beaches, which in many cases are exposed to coastal erosion. Up until 1950, shore protection in Germany was mainly achieved through hard structures. The first fill in modem times was performed in 1951 on the Island of Nordemey. Since then, there has been a gradual change from hard to soft protection measures in sandy coastal zones. After the first fill, more than 130 fills have been performed in 60 different sites (Fig. 1) adding up to a total fill volume of about 50M m3. Appendix A lists the beach lengths and
nourishment volumes for projects where these numbers could be established.
2.1. Project types and objectives
The mainland of the German North Sea coast is protected by sea dykes. Beach fills are carried out in sandy beaches which are predominant on the East- fhsian Islands (Federal State of Lower Saxony) and on the Northfrisian Islands (Schleswig-Holstein) in the North Sea and along the coastline of the Baltic Sea (Schleswig-Holstein and Mecklenburg-Vorpommern). The protection of the islands is of high priority because their presence is considered as a large-scale natural barrier that protects the mainland.
Not only because of the different coastal conditions but also because the federal states in Germany have different protection policies, the project objectives may vary depending on location:
1. Soft protection of seawalls and revetments against local scour through toe nourishments, mainly on the Islands of Nordemey, Sylt, Föhr, and Amrum. The effective total length is 10 km and so far, 11.5M m3 of sand have been filled from 1962 to 1996.
2. Strengthening of dunes and beaches in order to keep shorelines at their 1992 positions introduced
m/
Rostock0
H a m b u rg
B erl inP o tsdam 0
em erhaven® ^ ■
O ldenburg.. 0n3 ®
Enschede O snabrück „HannoverB raunschw eig® M agdeburg
Fig. 1. Documented beach nourishment sites in Germany.

H. Hanson et al. / Coastal Engineering 47 (2002) 81-111 83
as a legai instrument in the island of Sylt along 30 km of dunes and cliff adding up to 22M m3 from 1983 to 1996, and maintaining a critical, minimum beach profile in front of the dune at Langeoog along 3 km with a total volume of 2.9M m3 from 1971 to 1994 (Dette, 1998).
3. Seaward and landward extension of natural dimes as high water and flooding protection in order to provide, at all times, a minimum natural dune width of 40-45 m along the Baltic coastline with an effective length of 144 km in 36 sites.
4. Erosion mitigation, i.e. raising and widening of the beach and the nearshore underwater berm profile along the Baltic coastline with a total effective length of 50 km in 20 sites. Total volume adds up to 7.8M m3 of sand from 1968 to 1994.
5. Compensation of lee-erosion caused by coastal structures in Sylt, with an effective length of 2.5 km. Total fill volume so far is 2M m3 from 1995 to 1997. Also, at Warnemünde, Baltic Sea, with an effective length of 2.2 km in nine refills, a total volume of 1.0M m3 was filled from 1972 to 1994.
These five types of projects are carried out in the framework of legal coastal protection by coastal authorities. In addition, local communities take initiatives to improve their beaches for recreational purposes. Type 2 above was a result of a changing policy over time from no protection measures to manmade interference and the favouring of beach nourishment instead of continuous maintenance of hard structures (seawalls and revetments). This policy was introduced into the legal framework for Sylt in the early 1990s.
2.2. Execution, design and evaluation
The design methods in order to meet the various objectives can all be classified into the category of generic templates. Refined design stage methods are at the very beginning of being considered as design tools. Maximum storm singe levels (i.e. no overtopping of dunes and no breaching) and longshore transport rates are the major design parameters taken into consideration. Wave run-up and depth
of closure are not considered. No other direct design constraints are taken into account. Environmental concerns are only raised in the licensing of offshore borrow areas. Recreational disruptions in high season (July-September) are avoided by timing the execution in the months of April till June. Aeolian transport in front of resorts is minimised by installing fences or bushes.
There is a general ambition to use at least the same grain size as the native one, but preferably a coarser one. Structural supports in combination with a fill, for example a geotextile barrier in the fill body to reduce erosion dining major storm surges or underwater sills to reduce wave energy impact on the beach fill, have been investigated. However, these are still far from being accepted as supporting tools, partly due to the mental reasons of the authorities who argue that if standard fill practice is well proved, why change.
For the protection of the Westerland seawall in Sylt, three unusual design types were developed (Dette and Gärtner, 1987) including (1) a successful spit-type fill which extended seawards more than 350 m from the seawall, (2 ) a less successful, linear, 1-km long fill to 3 m above MHW, and (3 ) the combination of both previous designs called a “girland-type” fill with satisfying results.
In nearly all fill sites, initial projects have been carried out with an expected renourishment period of 5 -7 years. Profile and berm nourishments are the typical fill types. Offshore mounds have so far not been carried out. Berm nourishment fill profiles incorporate a certain precautionary volume. With respect to an initial overfill ration, so far, no adequate design tools have been initiated by the authorities, probably due to the philosophy that each amount of sand is a benefit for the fill site and for the neighbouring areas.
Hopper dredgers with trailing suction and loading capacities of up to 8000 m3 are the traditional equipment for operation in nearshore borrow areas. Stationary dredgers with deep suction and sinker lines attached to the beach are mostly used in sheltered areas. After using trailing suction during the first years (1985-1988), excavation of borrow material in deeper water (e.g. more than 15 m, like off Sylt) later turned out to be more effective through deep suction dredger which were anchored

84 H. Hanson et al. / Coastal Engineering 47 (2002) 81-111
during the time of loading. Problems and disadvantages due to rough sea (waves between 1 and 2 m) at first, expected from the “stationary” deep suction dredging, were not experienced with the anchored dredgers.
In general, coastal protection in Germany is done within a well-developed, long-term strategy for actions along the coast. For most projects, the responsible authorities are implementing follow-up programmes. However, serious overall performance evaluation programmes are still not used to any extent, and only used in special cases. Almost all of the well-documented projects are located on the island of Sylt.
2.3. Legal and financial aspects
German coastal protection is regulated by the constitutional law in terms of the Conflicting Legislation Act. The national government may apply this right, if a matter is not regulated effectively by federal law or if the legislation of one state interferes with the legislation of other states or that of the entire nation. The five coastal federal states have formulated special regulations for coastal protection in their federal legislation. Although these regulations differ in certain aspects, the national government has not yet made any use of the Conflicting Legislation Act.
The national government, being aware of its overall responsibility, financially supports the coastal protection works of the coastal federal states. This support is subsidiary, i.e. national funds are only granted if matched by funds from the concerned federal states.
In 1969, Article 91a was amended to the Constitutional Law of 1949. In this article, the cooperation between the national government and the federal states was legally established by means of “joint tasks” . Such tasks have to be classified as being of national importance and as being necessary for improving the standard of living. Coastal protection has been identified as such joint task and, thus, was included in Article 91a. The national financial share in these tasks was fixed at 70%.
The protection of sandy coastlines against storm surges and erosion by means of repeated beach fills and nourishments is handled individually by the
coastal federal states in terms of the “general protection guidelines” or site specific master plans. Since 1950, more than 95% of all nourishment sites in Germany have benefited from those regulations. The rest, e.g. small fill projects mostly for recreational purposes, are financed by local authorities on the basis of their own interest. Within this legal scheme, the economy of coastal protection projects is not considered. So far, economic justification or optimisation (design vs. cost) of such projects is not compulsory, partly because there is yet a legal or public pressure to do so.
After nearly 50 years of experience, the method of active coastal protection by means of repeated fills is a standard tool with ever increasing importance. However, the next step on how to minimise the regular refills and by these means reduce the expenditure still lies ahead and is presently under discussion.
3. Beach fills in Italy (IT)
Italy has 7500 km of which just under half consists of low lying alluvial beds, particularly exposed to coastal erosion. An idea on the importance that Italy attaches to its problems in coastline engineering comes from the northern Adriatic beaches, holiday destination of more than 90 million tourists from Italy and northern Europe. The annual revenue from a typical square metre of beach from tourist-related activities approaches US$3200, which is roughly equivalent to the current market value of 1 m2 of apartment.
In Italy, modem beach fills have been practised since 1969. During this period, about 50 fills have been performed in 36 sites (Zaggia, 1998) adding up to a total fill volume of about 15M m3 (Fig. 2). A large majority of these fills are small-size interventions around 100-150 x IO3 m3. The exceptions are (1) four large interventions at Cavallino, a barrier beach in the Lagoon of Venice, and Pelles- trina, a barrier beach in front of Venice (7.6M m3), (2) Ravenna in the Po river delta (1.4M m3), (3) Ostia close to Rome (1.4M m3), and (4) Bergeggi on the Italian Riviera (2M m3). Appendix B lists the beach lengths and nourishment volumes for projects where these numbers could be established.

H. Hanson et al. / Coastal Engineering 47 (2002) 81-111 85
noble ¡Turin ^M ila n ^ V e n i c e
Piacenza© p arm a©
Genoa^ M odena® QB o lo ÿ ia
A I I A
BOSNIA £ HERZ.
®flice ♦ F lo ren ce i Marino _Ancona
Marir
L ivorno '-V \t *©Peru9is*% . ♦ ADRIATIC SEA
* r" rJ ^ P e s c a r a
Split'
HR o m e |
I T A L YFoggia
M a p le s í^ ) Salerno♦
.Bari
„T aran toÆ l L i
T Y R R H E N I A N S E AC o sen za .©
-C atanzaro
Palermo 0Etna
Messina
Fig. 2. Documented beach nourishment sites in Italy.
3.1. Project types and objectives
Almost all projects comprise of a combination of sand nourishment and hard structures (Benassai et al., 1997). These different projects may be attributed to one of the following general objectives: (1) erosion mitigation at local scale, (2) enhanced recreation at a very small scale, and (3) in southern Italy, there is often a need to safeguard the coastal railway. These interventions may, almost generally, be regarded as remedial (counteractive) rather than preventive (proactive) measures, i.e. emergency-type actions are taken as problems are identified along the coast without any long-term planning or overall strategy.
3.2. Execution, design and evaluation
Most projects are based on a generic design with a combination of hard and soft structures. Most
minor projects are designed by simple scoping methods utilising crude evaluations of shoreline retreat rate together with an evaluation of the equilibrium slope. In larger projects, the somewhat more refined design methods are used, where a crude evaluation of the longshore sediment transport rate is combined with detailed computations of the volume budget. In addition, the Dutch CUR (1987) manual is consulted in determining longterm trends, renourishment intervals, etc.
Physical model tests are quite common for larger projects. However, numerical models are not used, with the exception of the Pellestrina and Cavallino projects where, to some extent, such models were used. These projects were, however, undertaken in the particular framework of the Special Law for the Safeguard of Venice. In general, monitoring is only limited or not done at all. Also, there is no established methodology for maintenance schemes, and no actual performance evaluation is made for the projects.

86 H. Hanson et al. / Coastal Engineering 47 (2002) 81-111
3.3. Legal and financial aspects
In Italy, coastal waters and beaches are State- owned. This means that initial costs have generally been attributed to the State, while the regional governments are responsible for the maintenance and associated costs, at least formally. Exceptions to the attribution of the maintenance costs are the rales, typically based on the occurrence of extreme events that require the support of emergency measiues (with fonds coming from the State). Revenues, however, go to the municipalities. In the past, there were hardly any cost-benefit analyses of projects. What is most evident is, thus, the discrepancy between who is paying and who is receiving the benefits. The situation is anticipated to change in the future.
The Law of 1907 distinguished between two types of coastal defences: those to protect built-up areas and those to halt beach erosion. Concerning the former, the local planning authority is in charge and can obtain financial support from the Ministry of Public Works, once its operative sections have considered the works to be technically feasible. In the second case, both the municipality and the port authority can apply for financial support from the Ministry of Public Works in order to build up the defences.
The Decree Law of 1985 restricted development to 300 m inland from the high water mark. The regions were requested to issue territorial and landscape plans aimed at regulating the uses of these areas and ensiuing their sustainable exploitation. Stabilisation of dunes in order to protect the hinterland is now being considered.
New legislative developments are expected by the application of the so-called “coastal plan” , currently under preparation by the Ministry of the Environment. Other new legislative developments that could eventually move in the direction of “coastal zone management” are also expected following the possible adoption of the strategic environmental assessment for the coastal zone and the transfer of competence from the State to the regions (Law of 1997).
4. Beach fills in the Netherlands (NL)
In the Netherlands, modem beach fills have beenpractised since 1970. During this period, about 200
fills and refills have been performed in about 35 sites adding up to a total fill volume of about 110M m3 (Fig. 3 ). Since 1991, the average fill volume amounts to about 6M m3 per year.
The Netherlands has straggled for many centimes to safeguard its territory from flooding. The western part of the country is below mean sea level. Large portions of the Dutch coast are receding since long. Historically, this recession has been stopped at some places with dykes, whereas at other various places, no strict measiues have been taken, or the recession has merely been slowed down with groins and fences. Thus, in general, the policy was previously one of selective retreat. The disastrous flooding in 1953 of large parts of the southwestern part of the Netherlands led to a change in this policy and to the legislation concerning minimal safety standards for the coast against flooding.
A further step in this direction was taken in 1990 when the policy of dynamic preservation was adopted (Anonymous, 1990). This was based on the presumption that it is technically and economically possible to compensate natural erosion of sandy coasts by nourishment. Prior to this policy, noiuishments were carried out to reinforce dunes against breaching as part of the safety legislation. As an example, Appendix C lists the beach lengths and nourishment volumes for various projects that have been subject to an
G roningen Oldenbi
éBruggeQ ^ n ty ie r p
A ®Gent
JTHE NETHERLANDS 'r Amsterdam 'A,
E nschede /
(¿Rotterdam „V - r 7 CNijmëgen
Tilfcrarg û,
•-‘-''IA Duisburg® 9
9 ♦
h e Hague
®DiissBld.C o lo g n e„Brussels J ®
Fig. 3. Documented beach nourishment sites in the Netherlands.

H. Hanson et al. / Coastal Engineering 47 (2002) 81-111 87
evaluation of nourishment performance (Roelse, 1996).
4.1. Project types and objectives
After adopting the dynamic preservation policy, the overall objective has been to preserve the 1990 coastline location through nourishments on a national scale. Thus, policy implies that the future coastline should nowhere be landward of the 1990 position. When required, sand is nourished to warrant the latter. Through this procedure, the legal safety standards are expected to be met automatically in most places.
4.2. Execution, design and evaluation
The responsibility for coastal protection in the Netherlands is divided between national (Rijkswaterstaat which also have local offices) and regional authorities, with the so-called water boards. A local Rijkswaterstaat body designs the nourishment and produces a blueprint covering all aspects to be taken into account by a contractor, such as place of sand mining, shape of the nourished profile, i.e. how much sand has to be placed in each profile, in which time frame the work should be performed, etc. Thus, the design is very strict with little variation from site to site (CUR, 1987). The principal design parameters are (1) nourishment volume, depending on the rate of autonomous erosion and the requested lifetime and (2) effectiveness factor of nourished sand. The latter is defined as the ratio of the autonomous erosion rate before to the actual erosion after implementation of the nourishment.
The coastline is defined by a measured sand volume (derived from annual cross-shore profiles, see below) rather than from an observed horizontal line such as the MLW. Beach nourishments are designed to compensate for the natural loss of sand in a coastal stretch for a defined period of time to come. The amount of sand to be filled is, thus, calculated by multiplying the design lifetime with the annual loss derived from the regression over the previous 10 years. The amount is then corrected (by adding 10—20%) for the site-dependent effectiveness factor to account for the possible slightly
increased erosion rate after the nourishment, compared to the autonomous one.
In some special places, another position, more seaward than the actual one, has been deliberately defined as the 1990 criterion, in order to ensure that the safety of the coast will be automatically warranted as long as the coastline meets the 1990 criterion. In addition, safety against flooding is checked every year, on the basis of measured profiles. The evaluation of nourishments is based on annual surveys, performed along the entire Dutch coast since 1965, with cross-shore profiles 200-250 m apart. Dining operations, the treated sections of the nourishment site are surveyed before and soon after their treatment, in order to achieve proper nourishment volume values.
Selected nourishments have been evaluated based on the following criteria: effectiveness factor = ratio of erosion rate before and after nourishment; preservation factor = ratio of actual lifetime and design lifetime; recreation factor = ratio of beach width after and before nourishment; natural values factor = ratio of actual and design lifetime of dune foot stabilisation; flood protection factor = ratio of actual and design lifetime in maintaining the dune profile.
4.3. Legal and financial aspects
The new Sea Defence Law of 1996 regulates the responsibility for maintaining the safety against flooding and the division of tasks between government and regional authorities. Maintenance of the primary sea defences is handled at a regional level, through the water boards who are supervised by the provinces. Because of the national interest in safety, the Minister of Transport, Public Works, and Water Management has the overall supervision. For dune systems, a large part of the profile is considered to make up the primary defence, from the shoreface to the landward side of the first dune. The local water boards are in first instance responsible for the dunes while the government has to maintain the coastline. This approach obviously requires close collaboration between the two levels, which takes place on a provincial level in the so-called provincial consultative bodies (POKs), each consisting of representatives from the provincial government, the local water board(s), and the Rijkswaterstaat. The

88 H. Hanson et al. / Coastal Engineering 47 (2002) 81-111
provincial authorities chair the POKs to ensure that coastal management is in line with the regional planning policy. According to the Sea Defence Law, the dune profiles are measiued at least once a year and whenever the standards are not met, measiues will be taken with high priority.
The local Rijkswaterstaat’s authority is also responsible for numerous permits needed. They have to be granted by local municipalities, water boards, etc. They concern, inter alia, permission to work in the areas, such as installing pipelines and pumping stations. There may be regional differences. For example, in one province, the beach has remained under the jiuisdiction of Rijkswaterstaat, for the specific reason of controlling the permits to work there, while in another, it has become part of the water board’s responsibility. Fortunately, with the present day experience, obtaining these permits is a routine operation.
In the policy of dynamic preservation, the Minister of Transport, Public Works, and Water Management has to inform the parliament every 5 years on the results of this policy. A first (interim) report was provided in 1993; a first full report in 1995, while the next one was due in 2000. The policy will be continued for the time being. With the maintenance scheme built into the legal structure, little economic justification is necessary for individual projects.
5. Beach fills in France (FR)
The total length of coastline in mainland France is estimated at about 5500 km including some 1960 km of sandy beaches. Coastal defence works are quite significant but noiuishment is only a marginal technique adopted to control the erosion. A recent inventory (Hamm et al., 1998) showed that modem beach fills have been practised since 1962. During this period, about 115 fills and refills have been performed in 26 sites adding up to a total fill volume of about 12M m3 (Fig. 4). This very limited quantity reflects that most coastal defence works in France still comprise the construction of groynes, seawalls, and detached breakwaters. France has a coastline bordering both the Atlantic Ocean, with extreme tidal variations in some locations, and the Mediterranean Sea with little or no tide.
5.1. Project types and objectives
The French approach to beach nourishment is traditionally to couple it with hard structures as supporting measiues to minimise sand losses and maintenance. In addition, in the most important noiuishment projects, the noiuishment option was chosen on the basis of the desire to get rid of available sand dredged to maintain navigable depths in a nearby harboiu. A slight change in policy may possibly be reflected in two recent projects (Chatellaillon and Fromentine, south and north of La Rochelle, respectively, in Fig. 4) representing a new approach with much less supporting measiues and allowance of an annual loss of material, implying some periodic renoiuishment.
Project motivations include the creation of recreational beaches, coastal defence, dune restoration, and, as mentioned above, the use of dredged sand from harboiu extensions or maintenance. No difference is made in practice between protection against flooding and stabilisation of the shoreline. In general—as in Italy—the measiues may be classified as remedial rather than preventive.
The inventory is summarised in Appendix D. A total of 24 sites have been documented including:
- Nine artificial beaches made of sand or gravel. The term “artificial beach” is used here to point out that the shoreline has been moved seaward to a point never been reached naturally before during the last century. Such beaches have been built for recreational purposes between 1962 and 1978.
- Eleven sites have been nourished in order to control beach erosion. Among these sites, the case of the beach of Anglet is unusual because of the technique adopted (shoreface noiuishment) and of the large volume of sand deposited there (8.2M m3 between 1974 and 1992).
- One shingle beach has been nourished periodically since 1969 to avoid flooding of the low-lying areas (Les Bas-Champs).
In addition, dune restoration works were carried out along the Gulf of Lion on the Mediterranean coast since 1984 particularly in three sites (Les Orpellières, Maguelonne, and La Gracieuse Spit) to control flooding.

H. Hanson et al. / Coastal Engineering 47 (2002) 81-111 89
Dusseldorf1® - w w « «n-W \_ f - 0 BrusseL0 i ^ C o lo g n e
uiüüUife \N G L A N D
Plymouth B ournem outh w . ,0 ♦ S j B E L J T Í U H > ^ e s b a d e n s
Cherbourg ^ ^Amiens - - - î
LeHaore Rouen _ ’ -Luxembourg CCaen u ® „Reims \ .
^ • 0 Metz®Strasboun
La RochelleQ
S?"l
^Angers-■tours
R A
Orléans
M \
Dijpfiu 1 / Bern
y ®:S W I T SME
M
o f B i s c a y
B ordeaux ,,
I *
C í r f —. 4 :*«®St.Etienne j j,
r h -cV^Toulouse©
Santander ® Bilbao >
© 0^Vitoria ^
+ M E U /T E E R ^ jVE/tlVN ^PÏflENÈÉS^-j
Mont p e ll te t . ./P 4- ®Am
Marseille®** ^
Fig. 4. Documented beach nourishment sites in France.
In total, 1M m3 of shingle, 0.3M m3 of gravel, and 10.5M m3 of sand have been used at these sites (total of 11.8M m3). For most of them, the total quantity was less than 0.1M m3 (eleven cases) or between 0.1 and 0.3M m3 (eight cases). Five sites have received more than 0.3M m3 in total, and three of them are regularly nourished (Bas-Champs, Anglet, and Arcachon basin). These three sites represent 82% of the material placed on French beaches.
5.2. Execution, design and evaluation
Design methods of coastal defence works are rather well developed in France. The survey of the completed projects has shown that detailed design studies have been performed for 15 cases. A typical design study includes the determination of the design
water levels and wave climate, field investigation to get information on the bathymetry and bottom sediment distribution, and a first assessment of the past and present situation from a morphodynamic viewpoint. In a second step, the beach fill itself is designed including the hard structures that will guarantee a low loss rate. Such a design is based on classical coastal engineering concepts (SPM, 1984) but also includes environmental considerations.
As mentioned, many of the projects are motivated from the perspective of getting rid of dredged material mainly from port areas. Thus, grain size varies from shingle to fine sand depending on the location providing a material that may be more or less suitable for beach nourishment. The use of fine sand in several locations (e.g. Cavalaire and Anglet) led to major
90 H. Hanson et al. / Coastal Engineering 47 (2002) 81-111
losses. The fill material is generally placed on the beach by tracks in the case of shingle and pebbles, and hydraulically in the case of dredged sand. Dune restoration makes use of available sand on the beach. For the main project at Anglet, a shoreface nourishment scheme was used.
Detailed studies are commonly carried out to provide a morphodynamic evaluation of the beach to be nourished. A mobile-bed scale model has been the traditional tool in France in performing morphodynamic impact investigations since the 1950s. Scale models were used in nine cases in the 24 sites included in the inventory. Shoreline numerical models are also being used in recent years to study large-scale evolutions. In several cases, in situ tests have been performed to check the design. However, monitoring after noiuishment is in most cases not systematic. The monitoring program is not planned in advance and is often not comprehensive. Topographic surveys are quite frequently carried out for dune and beach nourishments, but are typically not complemented by bathymetric surveys. The wave climate is seldom recorded but international databases (weather ships, satellite data) as well as hindcast techniques are used.
The inventory also showed that the key performance indicator is the volume loss of sand in most cases. A notable exception is the case of Anglet beach where periodic shoreface nourishments were made in order to maintain the shoreline position.
5.3. Legal and financial aspects
The Law of 1807 specifies that the Ministry of Public Works shall certify the necessity of coastal defence works. All costs incurred for coastal defence works shall be borne by the protected landowners in proportion to their interests, except in cases where the government decides that subsidies from public fluids would be advisable or are merited. In practice, such subsidies have usually been extremely small, owing to the limited financial resoiuces generally devoted to coastal defence works. This law also sets out guidelines for the so-called “compulsory” associations that are responsible for having these works carried out and maintained. It has always been difficult to put these laws into effect, which gave rise to the saying, “France has no coastal defence system, only expenses” (De Rouville, 1954).
Since 1970, the local government representative provides certification with possible funding (10 — 30%) in cases of the defence of luban areas. Such funding is, however, exceptional. The Law of 1973 allows local communities to take initiatives in this area when common interests are threatened. In practice, local municipalities are nowadays in charge of coastal defence works with possible partial financial support from regional authorities. As a consequence, there is no national coastal management in France and no national standard for beach fill design and evaluation. Each project is managed according to prevailing and local conditions. On the other hand, mentalities are slowly changing and many regional flinders are now becoming aware of the necessity to think regionally before funding locally.
The Law of 1977 was aiming at the protection of nature and institutes an environmental impact assessment study when the budget of works exceeds 1M ECU. Further legal texts improved the accreditation procediue including public inquiries, concertation, and administrative procedures when the works occupy a siuface over 2000 m2. In practice, the financial threshold is not reached and the siuface area threshold is difficult to define. Thus, noiuishment projects escape this law.
A further text of 1979 requires an administrative accreditation when coastal structures are built on the coastal public land. It is worth to mention here that coastal defence works in this law covers hard structures only. So, in practice, accreditation procediues are seldom in effect for noiuishment operations in France.
The so-called Littoral Law of 1986 extends the concept of coastal defence works to natiual sites with an accreditation procediue when the budget of works exceeds 0.15M ECU. It also forbids new artificial beach developments and protects the natiual state of the coastline. Furthermore, the coherence between the earlier laws and the new environmental laws needs improvements, which are reported to be in progress.
6. Beach fills in Spain (ES)
Practically the entire Spanish Mediterranean coast consists of sandy beaches (Lechuga, 1994). The principal cause of erosion along this coast is the

H. Hanson et al. / Coastal Engineering 47 (2002) 81-111 91
intemiption of the sand transport by numerous harbour installations. Modem beach fills have been practised only since 1983. During the last 5 years alone, more than 600 fills and refills have been performed in about 400 sites adding up to a total fill volume of about 110M m3 (Fig. 5). The vast majority of the projects are along the Mediterranean coast. Appendix E lists the beach lengths and nourishment volumes for projects where these numbers could be established.
6.1. Project types and objectives
Beach fills are usually done without any supporting structures. In some cases, detached breakwaters are used. In quite a few cases, existing detached breakwaters have been removed in connection with the noiuishment project. Being a nation where a significant portion of the income is based on toiuism, the
overall objective of these noiuishments is connected to the recreational space rather than to the exact position of the shoreline or to the concerns about flooding. Thus, the objective may be stated: the dry beach width must exceed 60 m at all times for recreational reasons. As for the French and Italian cases, the measiues are mostly remedial rather than preventive.
6.2. Execution, design and evaluation
The overall Spanish design type may be classified as profile translation. Numerical or physical models have only been used in a few important projects. Similarly, follow-up studies, including annual bathymetry and grain size studies, are only performed for these major projects. In the design process, environmental concerns seem more important than the engineering aspects.
B ia rr izLa Coruñj
PcrpirjÉJÎripUjiwO rense .Burgos®Logr0no
a rcelor
ladajozLisbon®
¡canteMurcia
SevillaGranada
angier
^Toulouse Aix-en-l
TarragonS P A I N DTortosa
. m * ™ \ j mC Jfcellón de la
j— rPlana
PalmsA m
Ech Ch
Oran
Tenerife
Gran Canaria
Fig. 5. Documented beach nourishment sites in Spain.
92 H. Hanson et al. / Coastal Engineering 47 (2002) 81-111
6.3. Legal and financial aspects
The financial processes involved in beach nourishment are regulated by the Shores Act of 1989, according to which all beaches in Spain are State- owned. This act states that works within the jurisdictions of the central government shall be financed by proper budgetary appropriations and, if applicable, with contributions from the regional governments, local governments, international organisations, and private parties. The Shores Act imposes severe restrictions on building and development in a “protection zone” 100-200 m landward from the beach.
In practice, almost all nourishments are financed by the central government, because, according to the Shores Act, the coastal defence is strictly its responsibility. In some projects, with a more developmental rather that piue protective character such as beachfront promenades, regional and local governments may contribute financially jointly with the central government. In the near future, more of the coastal works are going to be considered as part of an integrated coastal zone management process. A first example of this could be the management of the Castellón coastal zone project.
7. Beach fills in the United Kingdom (UK)
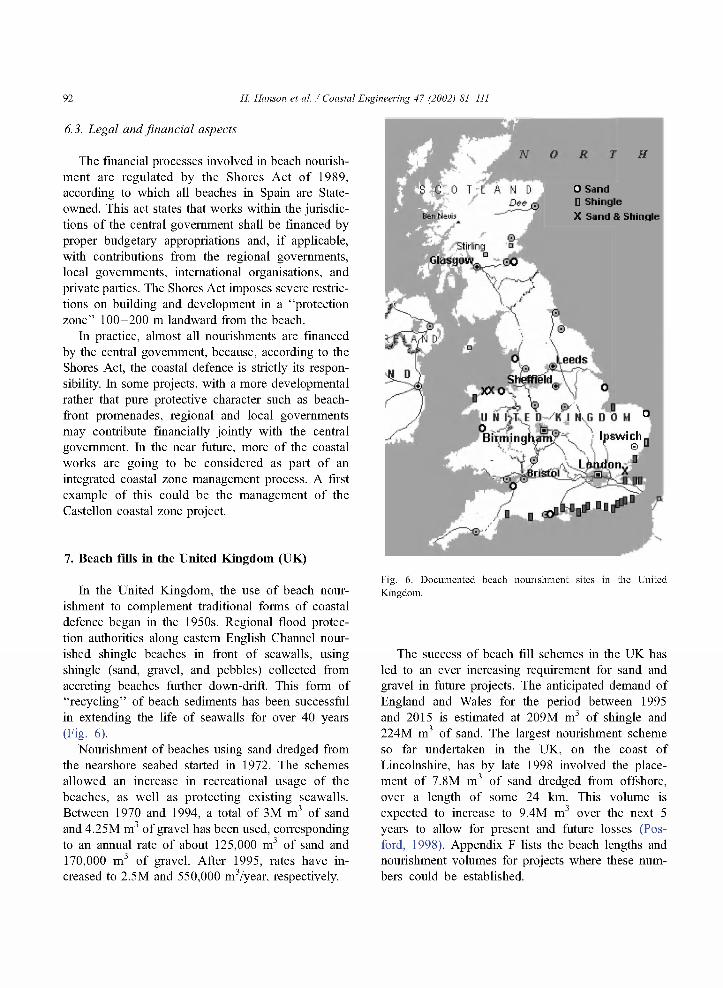
In the United Kingdom, the use of beach noiuishment to complement traditional forms of coastal defence began in the 1950s. Regional flood protection authorities along eastern English Channel nourished shingle beaches in front of seawalls, using shingle (sand, gravel, and pebbles) collected from accreting beaches further down-drift. This form of “recycling” of beach sediments has been successful in extending the life of seawalls for over 40 years (Fig. 6).
Nourishment of beaches using sand dredged from the nearshore seabed started in 1972. The schemes allowed an increase in recreational usage of the beaches, as well as protecting existing seawalls. Between 1970 and 1994, a total of 3M m3 of sand and 4.25M m3 of gravel has been used, corresponding to an annual rate of about 125,000 m3 of sand and170,000 m3 of gravel. After 1995, rates have increased to 2.5M and 550,000 m3/year, respectively.
H
O Sand D Shingle X Sand & Shingle
a. N D
r.i'B tirling
U N h i , E D K I H G fl O M 0o A \ few . \Birminqh
r.
3 II □□
□ D n t P 00^
{ ' r * t ■
Fig. 6. Documented beach nourishment sites in the United Kingdom.
The success of beach fill schemes in the UK has led to an ever increasing requirement for sand and gravel in future projects. The anticipated demand of England and Wales for the period between 1995 and 2015 is estimated at 209M m3 of shingle and 224M m3 of sand. The largest nourishment scheme so far undertaken in the UK, on the coast of Lincolnshire, has by late 1998 involved the placement of 7.8M m3 of sand dredged from offshore, over a length of some 24 km. This volume is expected to increase to 9.4M m3 over the next 5 years to allow for present and future losses (Pos- ford, 1998). Appendix F lists the beach lengths and nourishment volumes for projects where these numbers could be established.

H. Hanson et al. / Coastal Engineering 47 (2002) 81-111 93
7.1. Project types and objectives
Beach management schemes in the UK, including nourishment, have usually been carried out to protect the land against flooding or erosion. Benefits such as increased opportunities for recreation and aesthetic improvements will influence rather than dominate the selection of an appropriate coastal defence scheme. Factors such as the initial cost, future maintenance requirements, and the achievable standard of protection may indicate that beach nourishment is not the best defence type in some sites. The fact that nourishment is likely to improve rather than damage beaches further down-drift is also an important consideration in England and Wales, where so much of the developed coastline is already protected by coastal defences.
Beach nourishment has also been carried out, in a few cases, to reduce damage caused by land reclamation or harbours. Such mitigation works have been required by coastal defence authorities as a condition for such developments to be granted with planning permission. In very recent years, the desire to make best use of dredged materials has led to several experimental “beach fill” schemes. In these, a wide range of sediments, from mud and silts to gravel, has been placed on eroding intertidal mudflats in estuaries to help build up foreshore levels, and hence protect salt marshes and flood embankments along the shoreline.
7.2. Execution, design and evaluation
In the past, many coastal defence schemes relocated rather than solved flooding or erosion problems, and to avoid this, a national strategy for planning and installing defences has now been introduced. As a first step, for each coastal “cell” , a shoreline management plan has been drawn up. This draws together relevant information on the coastline, on its attributes and its processes. After consultations, appropriate recommendations are made either for the maintenance or advancement of the shoreline, or for its retreat, whether natural or assisted.
Where it is decided that some form of intervention is desirable, more detailed planning and study of the particular site is undertaken to decide on the most effective form of works. Some type of beach manage
ment is always considered at this stage, usually including possible beach nourishment. The major factors in deciding on the best type of defence are (1) benefit/cost ratio (B/C), (2) feasibility and likely effective lifetime, (3) standard of defence that is appropriate, e.g. the return period of flood events that the scheme is designed to prevent, and (4) environmental impacts of any proposed scheme, both locally and at a distance.
As an initial step, a very wide range of defence options is considered, with only the most inappropriate being rejected. There will then be further assessment “rounds” , considering the economic, engineering, and environmental aspects of all the remaining options. At each stage, the design, costs, and performance of the various defence types will be refined, with some alternatives being rejected, until the best option is identified.
The design of a beach nourishment scheme starts by examining nearby beaches. This allows an estimate to be made for the cross-section of a beach that would be “stable” , assuming a similar sediment type. The volume of sediment needed is then calculated, and the costs estimated using past schemes and knowledge of local sediment resources as a guide. As more detailed consideration of a possible nourishment scheme proceeds, the major issues are normally as follows. (1) The availability and cost of suitable materials for beach fill. At this stage, discussions are often started with contractors that might be able to supply suitable material. (2) The height and width of the proposed new beach profile. These parameters are usually calculated with numerical models, which for shingle beaches are of an empirical type. (3) The likely rate of longshore drift and future shoreline changes, both locally and along adjacent stretches of coast.
The last of these considerations is often the critical concern. In the UK, the potential effects of tidal currents as well as the waves may need to be considered, especially near the mouths of estuaries and tidal inlets. Beach nourishment schemes have usually been accompanied by the construction of hard structures, usually groynes, designed to reduce the losses of the material that was placed. Novel types of beach structures including detached or shore-linked breakwaters have also been used. The design of nourishment schemes with or without structures is usually carried out using numerical models, to deter

94 H. Hanson et al. / Coastal Engineering 47 (2002) 81-111
mine their performance under storm conditions and their “ far field” effects. Sometimes physical models are also used to optimise the design of hard structures, especially where the existing shoreline has a complex topography.
The nourishment of shingle beaches was initially performed with the material either being delivered by road or by sea using bottom-opening barges. Shingle is now also pumped directly onshore through floating pipelines or by the “rainbow” method, where material is pumped through a tube over the bow of a dredger which itself is taken as close inshore as possible and grounded. Shingle beach fill volumes have ranged from as little as 2000 up to 1.5M m3 (at Seaford in 1987). The primary sources of beach fill for such schemes have been existing in offshore extraction areas, originally developed by and licensed to companies dredging for sand and gravel for use in the construction industry.
As the number of beach fill schemes has increased, alternative sources of inexpensive sediment have been sought. Inland sources have included “as dug” sand and gravel, i.e. with no sorting, gravel that was not required by the construction industry because it was too large or too small, and even crushed rock. Although most nourishment schemes have been on the “open coast” , there have been recent examples on muddy estuarial coastlines as well (CIRIA, 1996b).
Some recent noiuishment schemes rely on a programme of regular recycling to preserve the required beach levels, rather than control structures. Shingle or sand is collected from the down-drift end of the beach and returned to the up-drift coast. In some cases, a single large “terminal groyne” has been installed to facilitate these operations. It seems likely that those type of “active” beach management will become more common in the future as finding supplies of sediment for recharge becomes more difficult. A recent review of the methods used in the UK is presented in the Beach Management Manual (CIRIA, 1996a).
Once completed, beach nourishment schemes have usually been monitored by regular beach surveys, initially at short intervals but typically reducing to six—monthly or annually after a few years. Such surveys are carried out using land- surveying methods, now including the use of
GPS, sometimes complemented by boat surveys of the underwater beach profile. Aerial photogramme - try is used to survey large areas. The changes in beach profiles are analysed to calculate the total volume of material lost, and this provides a simple quantitative measure of the longevity (and costs) of the scheme.
7.5. Legal and financial aspects
Coastal defence policy is set by the government, and the “strategy for flood and coastal defence in England and Wales” (Ministry of Agriculture, Fisheries and Food, 1993 ) provides a detailed view of the policy framework. The stated aim of the policy is to reduce the risks to people and the developed and natiual environment from flooding and erosion by (1) encoiuaging the provision of adequate and cost effective flood warning systems, (2) encoiuaging the provision of adequate, technically, economically and environmentally sound and sustainable flood and coastal defence measiues, and (3) discoiuaging inappropriate development in areas at risk from flooding or coastal erosion.
Coastal protection in England, Scotland and Wales may be carried out under the Coast Protection Act (1949) by local government authorities. They are required to consult over major construction or reconstruction schemes with the environment agency, neighboiuing councils, conservation organisations, harboiu authorities, and fisheries bodies. Approvals and/or licences may also be required from various governmental departments and other bodies. The department responsible for coastal defence in each region will give ultimate approval and may assist financially with a scheme. Landowners, railway owners, highway, and harboiu authorities may also undertake coastal protection works. Such bodies must normally consult the relevant coastal protection authority before commencement of works.
Sea defence in England and Wales may be undertaken by the environment agency who has the overall supervisory powers to protect against flooding, under the Water Resoiuces Act (1991). Consent from the appropriate governmental department is required to obtain financial assistance from central funds, and there is a statutory requirement to advertise any scheme and to carry out an environmental impact assessment if

H. Hanson et al. / Coastal Engineering 47 (2002) 81-111 95
appropriate. Sea defence works may also be undertaken by councils or by internal drainage boards, under the Land Drainage Act (1991 ), and owners may undertake works on their own property. Sea defence works may only be undertaken with the consent of the environmental agency.
Funding for most coastal defence schemes comes from the central government, the environmental agency, and local government authorities. However, schemes are sometimes undertaken by the coastal landowners who will principally benefit from defences. In some cases, financial contributions to works associated with coastal defence schemes may be made by the European Regional Development Fund, by special interest groups such as the Sports Council or by charities, such as the National Lottery.
8. Beach fills in Denmark (DK)
The Danish coastline is 7400 km long. Roughly speaking, there are three different types of coast: (1) tidal coast protected by sea dykes, (2) highly exposed North Sea coast, and (3) less exposed coasts of the Baltic Sea and the Kattegat (Fig. 7). About 100 years ago, the dunes on the North Sea coast were stabilised by marram grass planting. At the same time, harbours and groin groups were built which resulted in serious down-drift erosion. The combined result of the stabilisation of the dunes and the erosion was that in 1982, the dunes had disappeared or were weak along 50 km of the coast. So in 1982, it was decided to implement a coastal protection scheme.
As a primary option, the dunes were reinforced. Where that was not possible, a revetment was built to protect the remaining dune. On highly exposed stretches where erosion should be stopped, low detached breakwaters were used in combination with nourishment.
An increasing volume of nourishment has been applied since 1982. In 1998, the total nourishment volume on the North Sea coasts was 3.6M m3 and the total volume applied since 1974 was 31M m3. On the less exposed beaches of the Baltic Sea and the Kattegat, only three beach fill projects have been carried out with a total volume of 100,000 m3. Appendix G lists the beach lengths and nourishment
JLTfctAND /
C HI ES\*/1ÍLH 0 LSTEIN
Fig. 7. Documented beach nourishment sites in Denmark.
volumes for projects where these numbers could be established.
8.1. Project types and objectives
About 97% of the noruishment volume was applied on a stretch of the North Sea coast where dunes protect the low hinterland against flooding. The background for this is the policy that was formulated in 1982. The headlines of this policy were (1) to reestablish and maintain a safety level against flooding of a minimum 100-year return period, (2) to stop the erosion where towns are situated close to the beach, and (3 ) to reduce erosion on parts of the coast where erosion in the near future would reduce the safety against flooding to less than 100 years.
The main design objectives of the individual projects are coastal protection, dune reinforcement and maintenance of a protective beach (Laustrup and Madsen, 1994). The term “coastal protection” means that the loss in sediment is replaced in order to stop

96 H. Hanson et al. / Coastal Engineering 47 (2002) 81-111
or reduce the general retreat of the coastal profile. However, so far, only the losses above — 6 m have been compensated. As could be expected, this has led to the steepening of the profiles in general. If and how far this steepening process will continue is being studied at present. On stretches where the dunes are weak, new dunes are built or the existing dunes are reinforced. It is important to maintain a beach with width and volume sufficient to protect the dunes against erosion and to prevent erosion below a critical level at the foot of a revetment. In Denmark, there is no need to build wider beaches for recreational purposes since the number and total length of good quality beaches are high compared to the number of potential users.
8.2. Execution, design and evaluation
The principal design parameters are the autonomous erosion, the requested lifetime, and the effectiveness factor of the nourishment sand. The calculation of the autonomous erosion is based on a regression analysis of the erosion in the different segments of the profiles. On the North Sea coast, a storm with a return period of 1 year may lower the beach so much that the beach no longer serves its purpose as a protective beach. Consequently, the policy is to renourish the beach once a year. If a larger volume is placed on the beach, it may affect the quality of the beach in a negative way. Full- scale tests have indicated that coastal protection of the shoreface-part of the profile may be achieved with nourishment projects with a lifetime in the order of 3 years.
The effectiveness of the nourishment sand is calculated using the renourishment factor (James, 1975). The next step will be to account for a difference in effectiveness as a consequence of initial losses due to shaping, positioning, and volume of the nourishment. The erosion between — 4 and — 6 is compensated by shoreface nourishment. A buffer volume at the dune foot is needed to prevent erosion in the dune. Sand to be placed on the beach is pumped onshore through a submerged pipeline. In some cases, the sand is pumped over the bow by the “rainbow” method mentioned above. Sand on the foreshore is placed either by dumping or by pumping over the bow.
The evaluation of the nourishment is based on surveys normally carried out annually at cross-shore
lines at a distance of 200 m. The general effect of the nourishment program is evaluated using surveys carried out every second year along the entire North Sea coast. Here, the distance between the lines is 1 km. The safety level of the dunes is recalculated every 5 years by means of aerial photogrammetry.
8.3. Legal and financial aspects
On the North Sea coast, the actual policy for safety assessment and erosion control is established through agreements between local authorities and the national government based on Danish coastal authority recommendations. The agreements are renegotiated every 5 years. The costs are shared between the government and the local authorities. The government typically pays 50-70%. In some stretches, the government pays 100%.
In the Baltic Sea and Kattegat coasts, coastal protection is regulated by an act passed in 1988. According to this act, the counties are responsible for the administration of coastal protection projects. Since the counties do not have any coastal engineering expertise, the coastal authority provides assistance at the planning stage and consulting firms provide assistance at the project stage. The general practise is that there is no public funding for coastal protection in this region. Here, the individual landowners have to cover all costs. The coastal authority is responsible for issuing permits for coastal protection and other structures in the coastal zone.
9. Other countries
Of Belgium’s only 65 km of shoreline, 35 km are protected by beaches in combination with seawalls, 3 km by breakwaters (coastal harbours) and the remaining part by beaches and dunes. Modem, large-scale beach fills were first carried out in 1968. Since then, 17.2M m3 of sand have been used on several locations for over a total coastal length of 19.5 km. To compensate for beach erosion down-drift of Zeebrugge harboiu, an initial fill of 8.5M m3 was placed over 8 km of beach in 1977-1979 (Kerchaert et al., 1986). Since then, two smaller-scale refills were necessary in 1986 and 1998, respectively.

H. Hanson et al. / Coastal Engineering 47 (2002) 81-111 91
In Greece, beach nourishment is not a common practice to fight coastal erosion. The majority of the projects are hard measiues for coastal protection, while there are a few cases of small-scale nourishment combined with hard structures (jetties, groynes, etc.). In these cases, the volume of supplied material is in the order of a few thousands up to 10,000 m3.
In Ireland, there have only been two significant beach noiuishments since 1993 and very little prior to this date. The largest of these was Rosslare Strand, Wexford, which received an approximate quantity of160.000 m3 of sand between 1994 and 1996. The second case was Donábate Beach, Dublin, which was noiuished between 1993 and 1998 with a quantity of approximately 75,000 m3 of sand/gravel material.
The first nourishment in Portugal was performed in 1950 at Estoril, near Lisbon, with the deployment of15.000 m3 of sand. The first large-scale intervention was done at Algarve involving about 0.9M m3 of sand. Between 1950 and 1997, more than 29 fills were recorded in 12 different sites, adding up to a total fill volume of about 6.6M m3. About 2/3 of these volume was placed along the Portuguese South coast (low to moderate wave energy) with only about 170 km, as compared to the 830 km of the West coast (high wave energy).
In Sweden, beach noiuishments are very unusual for coastal protection. In these cases, the volume of supplied material is in the order of a few thousands up to 15,000 m3. In almost all coastal erosion cases, revetments or groynes have been used.
Even though outside of Eiuope, the conditions in the United States (US) will be very briefly described. This is mainly because over the past 75 years, beach noiuishment has become the preferred alternative for shore protection in the US. As a result, the US has
become the leading country in the world in terms of experience, number of projects, as well as volumes nourished (Basco, 1999). Here, for beach nourishment projects jointly funded by the federal government (through the Corps of Engineers ) and the local sponsor (State and/or County government), the only benefit that can be legally calculated to the benefit/cost ratio is the structural damage mitigation benefit of widened beaches (IWR, 1996; Basco, personal communication). The storm damage reduction is evaluated using numerical models for a set of design storm events. Thus, focus is more directed towards the protective function of the beach rather than on the beach system itself. Other “benefits” cannot be included in federal projects to calculate the B/C ratio at this time. Each site-specific case in the US is evaluated separately and must meet its own test of whether or not the benefits exceed the costs. There is, however, a large backlog in the Corps of Engineers projects with B/C>1 but still not funded due to political and budget reasons. Thus, a beach management plan for the entire US is badly needed. As a result of this, some states, especially Florida, have established their own separate funding soiuces for beach nourishment projects whenever and wherever it makes economic sense to do so in the long run. They do not wait for the joint project of the federal government and the Corps of Engineers.
10. Comparative results
10.1. Rates and volumes
There are big differences in nourishment rates and volumes between the investigated countries. Table 1 shows the number of fills, fill rates and volumes for the
Table 1Beach fill numbers, rates and volumes
Country (year started)
Total volume (IO6 m3)
Number of fills
Number of sites
Average volume/fill (IO3 m3)
Average volume/site (IO6 m3)
Fills/site
FR (1962) 12 115 26 104 0.5 4.4IT (1969) 15 36 36 420 0.4 1DE (1951) 50 130 60 385 0.8 2.1NL (1970) 110 150 30 733 3.7 5ES (1985) 110 600 400 183 0.3 1.5UK (1954) 20 35 32 570 0.6 1.1DK (1974) 31 118 13 263 2.4 9.1

98 H. Hanson et al. / Coastal Engineering 47 (2002) 81-111
Table 2Annual fill rates for selected countries
Country Annual fill (IO6 nd/year)
Country Annual lili( IO6 nd/year)
FR 0.7 UK 4IT 1 DK 3DE 3 Japan3 5NL 6 South Africa3 5ES 10 Australia3 1
USA (Federal)3 30
a Approximate numbers based on oral information from a large number of initiated persons.
respective countries together with the year when modem beach nourishments were introduced on a more regular basis. Spain and the Netherlands are by far the biggest nourishing countries in Europe. The most distinguishing difference between the two is that the sand in the Netherlands is placed on relatively few locations, while in Spain, the sand is portioned out over a large number of smaller sites.
Table 2 shows the present annual fill rates for these countries and estimates of corresponding values for some other countries around the world. Thus, the total annual rate of the European countries adds up to about 28M m3, which is about the same volume as that for the federal projects in the USA, i.e. where the US Army Corps of Engineers are involved. In the USA, there is an estimated additional 20-30M m3 per year,
if projects funded by the State, local governments, and private interests are included.
Looking a bit more on detail reveals a number of interesting features. Table 3 shows estimates of national average values on beach nourishment-related parameters for lui rope and the US, where Y= number of years of modem beach fills (except for NL where only the period after adopting the dynamic preservation policy is considered); E= total fill volume over these years (IO6 m3); LN = km of beach subject to beach nourishment out of the total km of sandy beaches (km) (here, each specific beach section counts only once even though it may have been nourished many times); LP = total length of all noiuishment projects summed up (km) (here, the length of every beach nourishment is counted even if many of them are on the same beach); LS = total length of soft (sand or gravel) material boundary of the entire country (km); AVN — annual fill volume (m3/m/year) per m of beach nourishment = E/LN/T; AV P — average unit volume (m3/m) for all fill projects = E/LP; AYS — annual fill volume per km of total length of sandy beach = E/ LS/T; AN F — average number of fills on a particular project site — LP/LN; AR1 — average renoiuishment interval (years) = Í7ANF; RUV—range of unit volumes (m3/m) for each fill project.
The most striking variation between the countries is the length of coast subject to noiuishment (LN) relative to the total length of soft coastline (LS). In
Table 3National average values on beach nourishment-related parameters
Item FR IT DE NL3 ES UK DK USAb
7= number of years of fills 33 37 48 10 13 44 24 46V= total fill volume (IO6 m3) 12 15 50 60.2 110 20 31 144LN = length of coastline subject to nourishment (km) 35 73 128 152 200 n/a 80 350LP = total length of all nourishment projects (km) 190 85 313 291 525 n/a 515 n/aLS = total length of soft (sand and gravel) coastline (km) 1960 3620 602 292 1760 3670 500 61,400AVN = annual fill volume per m of coastline subject to 10.4 5.6 10 39.6 42.3 n/a 16 9
nourishment (m3/m/year) = J7LN/7AVP = average unit volume tor all projects (m3/m)= J7LP 63 176 210 207 210 n/a 60 n/aAVS = annual fill volume per m of total length of soft 0.19 0.11 1.7 20.6 4.8 n/a 2.6 0.05
coastline (m3/m/year) = J7LS/7ANF = average number of fills on a particular 5.4 1.2 2.4 1.9 2.6 n/a 6.4 n/a
project site = LP/LNARI = average renourishment interval (years) = 7/ANF 6.1 31.8 19.6 5.2 4.9 n/a 3.7 n/aLN/LS (%) 1.8 2.0 21.3 52.1 11.4 n/a 16 0.6RUV = range of unit volumes for individual projects (m3/m) 3.3-400 19-511 30-500 31-596 70-450 n/a 10-100 n/a
a Only for the period 1991-2000 (after adoption of National Dynamic Preservation policy). b Only Corps o f Engineers projects, Alaska not included.

H. Hanson et al. / Coastal Engineering 47 (2002) 81-111 99
NL, more than half (52.1%) of the soft coastline is subject to nourishment whereas in the US, it is less than 1% (0.6%). In other countries in Europe, FR and IT also show low numbers, indicating little noiuishment activity and long soft coastlines. With regard to the AVN values, NL and ES fill on an average about 40 m3/year along coastlines subject to noiuishment whereas other countries fill around 10 m3/year (no value for UK). This could indicate that NL and ES are losing more of their fills or that they are more persistent in compensating all losses of material. A similar pictiue is shown in the ARI values, where the average return interval in NL and ES, together with FR and DK, is about 5 years, whereas the corresponding numbers for the other countries are around 25. As opposed to NL and ES, however, FR and DK fill less in each project as indicated by their lower AVP values. All countries studied show a very wide range of unit volumes for individual projects.
10.2. Design parameters
Tables 4 and 5 show an attempt to classify the design parameters taken into account in the respective countries. Table 4 indicates the wave- and sediment-related conditions that are included in the design process, where the parameters listed are storm = storm siuge levels, Q\ ~ longshore sediment transport rates, run-up ~~ run-up levels, Dc ~ depth of closure, waves = wave height (and direction), sed. dist. = spatial distribution of sediment grain size, and aeolian transp. = losses of sediment due to aeo-
Table 4Design considerations for coastline maintenance in the respective countries (Y = yes, N = no)
Parameter FR IT DE NL ES UK DK
Storm Y Y Y Na N Y NaQl Y Y Y N Y Y NRun-up Y N N Na N Y NaDe Y N N N Y N YWaves Y Y Na Y Y NSed. dist. Y N Na Y Y NAeolian transp. N Y N N N N
a Considered for safety nourishment, not for coastline management.
Table 5Design elements in the respective countries
Element FR IT DE NL ES UK DK
h b Y Y Y Y Y Y YWB Y Y Y Y Y NOverfill Y Y N Y N N NVol./m Y Y Y Y Y YTransition N Y Y Y Y N
>1 1 >1 1 >1 Ia >1Structures Y Y N N Y/N Y N3Ren. period
(year)N N 5 -7 5 n/a N
Follow-up N N Y Y Y/N Y/N YPerf. eval. N N Y/N Y N Y/N Y
Hq = berm height; Wb = berm width; overfill = the use o f overfills; vol./m = volume of fill per m of beach; transition = the use o f transitions at the lateral ends; Dß/D^ = grain size of borrow material relative to the natural sediment grain size; structures = the use of supporting structures; ren. period = calculated renouiishment period; follow-up = the use o f follow-up programs; perf. eval. = the use of performance evaluation programs.
a For sandy beaches only. For shingle beaches often < 1.
lian transport. Table 5 shows the fill properties and procedures that are explicitly taken into account in the nourishment design, where I In ~ berm height, Kb = berm width, overfill = the use of overfills, vol./m = volume of fill per m of beach, transition = the use of transitions at the lateral ends, DQ! Dn = grain size of borrow material relative to the natiual sediment grain size, structures = the use of supporting structures, ren. period = calculated renourishment period, follow-up = the use of follow-up programs, and perf. eval. = the use of performance evaluation programs.
11. Overall conclusions and discussion
Over the last decades, there has been a gradual change from hard to soft coastal defence techniques. Periodic artificial nourishment is widely regarded today as an environmentally acceptable method of beach and dune protection and restoration for short-term ingencies (viz. storm-induced erosion) as well as long-term issues (i.e. structural erosion and relative sea-level rise). The present paper highlights the fact that such tendency is neither easy to sustain nor well established. It also
100 H. Hanson et al. / Coastal Engineering 47 (2002) 81-111
highlights the fact that a large variety of situations and experiences exist in Europe.
Parameters used in the design process are summarised and compared. However, they are hard to evaluate, as they still only present which parameters are taken into account and not how. Countries, such as Italy, that consider more parameters may seem to perform a more thorough design than others do. However, it could also indicate that these countries improvise more from case to case than others, such as the Netherlands, which has a more consistent design. Also, the number of parameters that needs to be taken into account certainly reflects the degree of varying conditions from site to site, which is of course smaller in the Netherlands than in Italy or France.
11.1. Beach fill practice
There are—as expected—significant differences between the investigated European countries regarding (1) engineering methods and evaluation procedures, (2) overall coastal management strategies (which are very developed in some countries and virtually nonexistent in others), and (3) legal and financial frameworks. The following more specific remarks can be made concerning the different national characteristics:
- NL and DK are the only countries that have a serious overall performance evaluation program integrated into their legal framework.
- NL, DE, DK, and UK have developed a longterm strategy for actions along the coast and the three former are also implementing thorough follow-up programs.
- ES has a fairly well-developed organization and a long-term philosophy for their actions but anticipates running into problems of finding suitable borrow areas in the near future.
- ES, IT, and FR all apply a strategy of remedial rather than preventive measures and seem to suffer from a lack of overall long-term strategy, coastal management, regular monitoring of the coastline, as well as a comprehensive survey of available borrow areas.
- IT and FR suffer from lack of financial support for regular renourishments.
- IT experiences unclear commitments and sharing of responsibilities between the Ministry of Environment and the Ministry of Public Works.
- All investigated countries foresee a continued transfer from hard to soft measures and regard beach nourishments as an effective means of coastline preservation.
- Annual fill volume per m of coastline subject to nourishment is considerably higher in NL and ES (around 40 m3/m/year) than in the other countries (around 10 m3/m/year).
- The average renourishment interval is considerably longer in IT and DE (around 25 years) than in the other countries (around 5 years).
- Nourishments are expected to continue over foreseeable friture in all participating countries.
The present study shows that it would be very profitable for south European countries to learn about the north European practices, particularly regarding the long-term coastal management and the regular monitoring of the coastal morphology. On the other hand, the recent Dutch experience has shown that their legal system is a bit rigid leading sometimes to almost automatic local renourishments that, strictly speaking, are unnecessary in reaching the global objective. Fortunately, they still serve to preserve the coastline of a wider area (Roelse, 1996). The UK experience of beach nourishment using mixed sediments, including gravel, may be of interest elsewhere in Europe.
In conclusion, the countries in Europe have a lot to give and take from one another regarding beach nourishment policy, strategy, and methodology. Even though controlling conditions are quite different between countries, it would be very beneficial to establish a European strategy and a European methodology for beach nourishments.
Even though the European countries that do have a nourishment strategy have quite different policies, they all seem to be based on an inherent beach property whether it is beach volume, dry beach width or shoreline location. As a contrast and brief comparison, the conditions in the US are quite different. There, beach nourishments are mainly motivated from a storm damage-reduction benefit perspective, even though recreation benefits are also considered. Thus, focus is more directed towards the protective function of the

H. Hanson et al. / Coastal Engineering 47 (2002) 81-111 101
beach system rather than on the beach system itself. The US system seems more dynamic and flexible in that it is more adaptable to local and varying conditions, whereas the European systems are more rigid. On the other hand, the simpler rules in some European countries are easier to implement on a wider scale, which in the long-term perspective may be more cost- effective.
Acknowledgements
This work is undertaken as part of the SAFE project partly funded by the European Commission/ Directorate of Science, Research and Development (DG-XII), Contract No. MAS3-CT95-0004 and by Ministère de l’Equipement, des Transports et du Logement/Direction de la Recherche et des Affaires Scientifiques et Techniques/Service Technique des Ports Maritimes et des Voies Navigables (France), Subvention No. 97 M/3. Contributions about the conditions in their respective countries have been supplied by Mr. J. Casey, Department of the Marine and Natural Resources (Ireland), Mr. O. Ferreira, University of Algarve (Portugal), Mr. S. Christopou- los, Aristotle University of Thessaloniki (Greece), Mr. P. De Wolf, Ministry of the Flemish Community (Belgium) and Prof. D.R. Basco, Old Dominion University (USA), and are gratefully acknowledged. The authors would also like to acknowledge the review of Prof. Basco whose comments were of great help and improved the quality of this paper.
Disclaimer
Facts and figures given in this paper are based on information available to and provided by the authors and do not necessarily express the opinion of the European Commission or the national governments.
Appendix A . Details on selected German sites
A.I. Location: sylt
The main aim: erosion control for prevention of under scour at 3-km long stretch of embankments.
Hard structures: seawalls and revetments. Dredgers: trailing hopper (1984) and suction hopper (since 1990). Dumping distances: 2000 m (1000-m sinker line from hopper to shore and 1000 m along beach). Design support method: conclusions from detailed monitoring of previous fills. Performance: satisfactory.
A.2. Location: Island o f Norderney/North Sea
Aim: from 1855 to 1950, revetments in combination with 30 groynes, extending nowadays to over 6 km were built in order to protect a resort village behind the dunes. The retreat of the shoreline could be stopped but not the erosion of the beach within the groins. In 1950, a task force concluded that a beach raised above MHW at the toe of the revetment would be the best security measure for the structure. An initial fill of 1.25M m3 (approximately 200 m3/m) was recommended; furthermore, a yearly replenishment of90.000 m3 is to be replaced by refills in 5-10-year intervals. This was the beginning of active coastal protection in Germany. In over 42 years (1952-1994), a total of 4.3M m3 of sand were dumped on the beach. This is equivalent to an average yearly fill rate of80.000 m3 for the first three decades and 165,000 m3 for the last decade (1984-1994). The increase can be directly related to an increase in storm surge frequency.
Stationary dredgers: cutter (1976-1984) and suction (since 1989). Dumping distance (sinker line from dredger to beach): 800-2800 m. Daily dumping rate: 15,000-30,000 m3. Design support method: analysis of a minimum profile equivalent to a minimum volume of 50 m3/m above MLW in front of the structure. Below this volume, the risks of structural damages increase. Performance: satisfactory related to current efforts; refill interval is unpredictable because it is dependent on storm surge frequency. High initial losses from fill volume of more than 200-70 m3/m within 1 to 2 years were experienced. Optimization of losses without supporting measures at the seaward groin limit (e.g. underwater sills in order to translate the groin fields in closed units) to reduce continuous sand losses during normal tides resp. only slightly raised water levels into a deep tidal gully extending along the groin heads less promising.

102 H. Hanson et al. / Coastal Engineering 47 (2002) 81-111
Table A.lBasic information on nourishments on Sylt
Location Year Length Volume Unit D5q native/ Fill type Purpose/ Borrow Supporting % remaining/(m) (IO3 m3) volume
(m3/m)borrow(mm)
problem site measure no. of years
Westerland 1972 900 1000 1100 0.35/0.44a Spit Increase berm elevation
Terrestrial - 25/6
1978 1690 1000 590 0.35/0.44a Linear fill Increase berm elevation
Terrestrial - 17/6
1984 1390 1030 740 0.35/0.35 Girland Increase berm elevation
Offshore - 33/6
1990 1490 1200 805 0.35/0.35 Girland Increase berm elevation
Offshore - 50/3
1996 2140 745 350 0.35/0.50 Flat spit Increase berm elevation
Offshore - n/a
Northern part 1985 4805 1975 410 0.29/0.50 High berm Recessionprevention
Offshore - 15/5
1990 1900 990 520 0.29/0.40 Lower berm Offshore - 50/21987 520 300 580 0.29/0.54 Spit Housing
protectionOffshore Geotextile
barriern/aa
1996 1150 240 210 0.29/0.51 Bar Supp. sand bag bar
Offshore Artificialbar
n/a
Southern part 1984 1840 320 175 0.38/0.29 Berm Recessionprevention
Offshore — 10/3
1987 2880 1440 500 0.38/0.42 Berm Recessionprevention
Offshore — 25/3
1996 2940 400 135 0.38/0.51 Berm Recessionprevention
Offshore n/a
n/a = not available.a Thirty percent losses in fines ..0.20 mm) during dumping (not included in fill volume list).
Table A.2Basic information on nourishments :in Nordemey and East Frisean Islands
Location Year Length(m)
Volume (IO3 m3)
Unitvolume(m3/m)
D5q native/borrow(mm)
Filltype
Purpose/problem
Borrow site Supportingmeasure
% remaining/ no. of years
Nordemey andEast Frisean Islands
1951-1952 6000 1250 200 0.21/0.11 Berm Filling groin field
Wadden area - 5/16
1967 2000 240 120 0.21/0.20 Berm Filling groin field
Foreshore - 7/9
1976 1000 400 400 0.21/0.20 Berm Filling groin field
Tidal shoal - 7/6
1982 1500 470 310 0.21/0.20 Berm Filling groin field
Tidal shoal - 10/2
1984 1700 410 240 0.21/0.20 Berm Filling groin field
Tidal shoal - 18/5
1989 1800 450 250 0.21/0.17 Berm Filling groin field
Tidal shoal - 24/3
1992 2100 500 240 0.21/0.20 Berm Filling groin field
Tidal shoal - 24/2
1994 1300 320 250 0.21/0.20 Berm Filling groin field
Tidal shoal — n/a
n/a = not available.

H. Hanson et al. / Coastal Engineering 47 (2002) 81-111 103
Appendix B. Details on selected Italian sitesTable B.lInventory of nourished beaches along the Adriatic coast in Italy (1968-1997)
Location Year Length Volume Unit £>50 Fill Purpose/ Borrow Supporting Performance/(m) (IO3 m3) volume
(m3/m)native/borrow(mm)
type problem site measure lifetime
Borgo Prino 1968-1969 600 50 83 n/a n/a n/a n/a - n/aBergeggi 1970-1973 n/a 2000 +
10/yearn/a n/a n/a n/a n/a n/a
Pietra Ligure 1971-1972 500 45 90 n/a n/a n/a From land n/aLavagna 1972 500 80 160 n/a n/a n/a Bypass Two groins n/aPorto Canale 1980-1985 1500 400 267 n/a n/a n/a Bypass - n/a
di ViareggioLe Gorette 1990 2500 74 30 n/a n/a n/a From land Six groins +
submerged barriern/a
Cecina Mare 1987-1991 1433 155 108 n/a n/a n/a From land Four groins + submerged barrier
n/a
Ostia 1990 3000 1400 467 n/a n/a n/a From land Submerged barrier n/aNettuno 1970 3500 310 89 n/a n/a n/a Bypass - n/aTerracina 1993 9000 500 56 n/a n/a n/a Dredging Seven groins +
submerged barriern/a
S. Felice Circeo 1995-1997 5000 2000 400 n/a n/a n/a From land Submerged barrier n/aSabaudia 1988-1991 n/a 250 n/a n/a n/a n/a n/a - n/aFormia 1991 1200 200 167 n/a n/a n/a From land One groin +
submerged barriern/a
Mintumo-Scauri n/a n/a 100 n/a n/a n/a n/a n/a One groin + submerged barrier
n/a
Paola S. Lucido 1993 5700 1100 193 —/0.35 n/a n/a Dredging 18 groins + submerged barrier
n/a
Cala Gonone 1994-1997 1700 170 100 n/a n/a n/a From land - n/a
n/a = not available.
Table B.2Inventory of nourished beaches along the Thyrrenian coast in Italy (1991-1997)
Location Year Length(m)
Volume (IO3 m3)
Unitvolume(m3/m)
-D50native/borrow(mm)
Filltype
Purpose/problem
Borrowsite
Supportingmeasure
Performance/lifetime
S. Margherita di Caorle
1991 1600 130 81 0.18/0.13 n/a n/a From land Groins +submergedbarrier
n/a
Land Sourcellino 1996 11,000 2000 182 0.19/0.22 n/a n/a Dredging 32 groins + submerged barrier
n/a
Isola di Pellestrina 1995-1997 9000 4600 511 0.19/0.22 n/a n/a Dredging 18 groins + submerged barrier
n/a
Porto Corsini- Casal BorsettI
1988-1993 600 350 140 n/a n/a n/a From land 10 groins + submerged barrier
n/a
(continued on next page)

104 H. Hanson et al. / Coastal Engineering 47 (2002) 81-111
Table B.2 {continued)
Location Year Length(m)
Volume (IO3 m3)
Unitvolume(m3/m)
¿Lonative/borrow(mm)
Filltype
Purpose/problem
Borrowsite
Supportingmeasure
Performance/lifetime
Lido Dante- 1988-1991 4500 900 200 n/a n/a n/a From land 17 groins n/aMarina di Ravenna
Foce Fiume 1988-1991 2500 350 167 n/a n/a n/a From land 25 groins n/aSavio
Cesenatico 1984 800 65 + 10/year
81 n/a n/a n/a From land Two groins +submergedbarrier
n/a
Riccione 1986 1000 75 75 n/a n/a n/a From land Submergedbarrier
n/a
Misano (FO) 1984 1600 180 113 n/a n/a n/a From land 26 groins + submerged barrier
n/a
Fiume Esino- Fosso Rubiano (AN)
1984 680 n/a n/a n/a n/a n/a n/a Three groins +submergedbarrier
n/a
Porto Recanatin(MC)
1983-1984 700 16 23 0.14/0.20 n/a n/a From land Two groins +submergedbarrier
n/a
Grotta Sea area (AP)
1983-1984 1200 23 19 0.1/1.0 n/a n/a From land Six groins +submergedbarrier
n/a
S. Benedetto del Tronton
1984 550 31 56 n/a/1.0 n/a n/a From land Three groins +submergedbarrier
n/a
n/a = not available.
Appendix C. Details on selected Dutch sites
Table C.lSelected nourished beaches along the Dutch coast
Location Year Length Volume Unit D5q native/ Fill type Purpose/ Borrow Support Lifetime(m) (IO3 m3) volume
(m3/m)borrow(mm)
problem site
Ameland- 1980 6000 2200 367 0.16/0.18 Seaward dune Safety Channel 8midden enforcement maintenance
Westerpad-Jan 1990 4600 970 211 0.16/0.19 Seaward dune Safety Sea bottom - n/aSietzepad enforcement
Ameland- 1992 1300 230 177 0.16/0.19 Dune enforcement Safety Sea bottom 5midden
Ameland- 1992 8100 1442 178 0.16/0.20 Beach nourishment Coastline Sea bottom 5midden preservation
Eierland 1979 5600 3089 552 0.16/0.20 Beach nourishment Safety Sea bottom 5De Koog 1984 5870 3021 515 0.20/0.19 Beach nourishment Safety Sea bottom 10Eierland 1985 5000 2849 570 0.20/0.18 Beach nourishment Safety Sea bottom 5Eierland 1990 5010 2543 508 0.20/0.18 Beach nourishment Safety Sea bottom 3
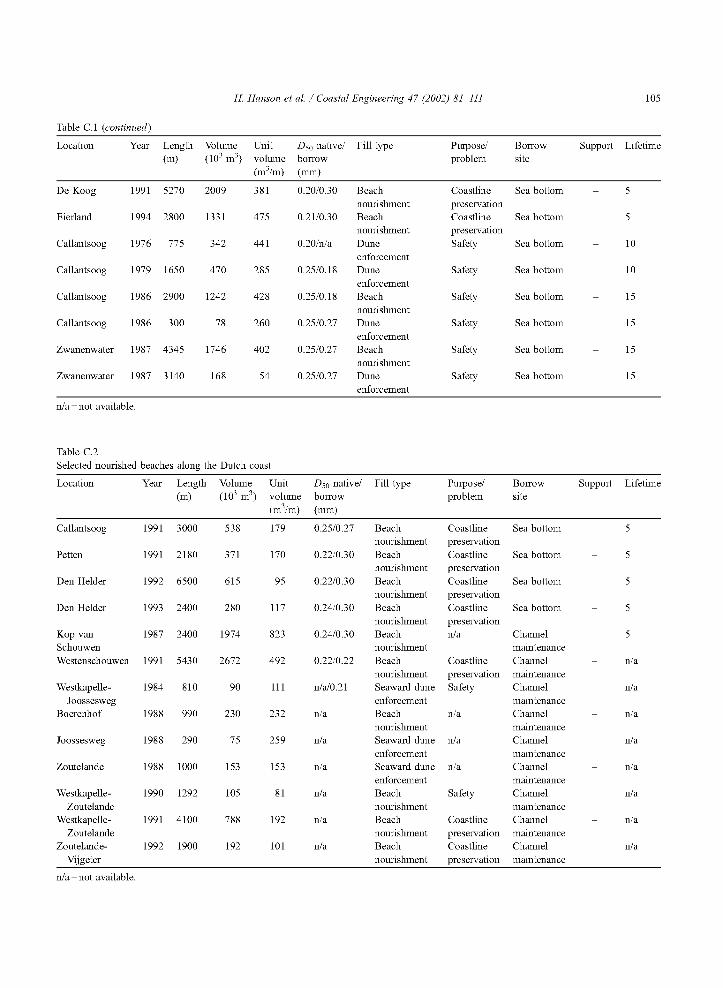
H. Hanson et al. / Coastal Engineering 47 (2002) 81-111 105
Table C.l {continued)
Location Year Length Volume Unit D so native/ Fill type Purpose/ Borrow Support Lifetime(m) (IO3 m3) volume
(m3/m)borrow(mm)
problem site
De Koog 1991 5270 2009 381 0.20/0.30 Beachnourishment
Coastlinepreservation
Sea bottom 5
Eierland 1994 2800 1331 475 0.21/0.30 Beachnourishment
Coastlinepreservation
Sea bottom 5
Callantsoog 1976 775 342 441 0.20/n/a Duneenforcement
Safety Sea bottom 10
Callantsoog 1979 1650 470 285 0.25/0.18 Duneenforcement
Safety Sea bottom 10
Callantsoog 1986 2900 1242 428 0.25/0.18 Beachnourishment
Safety Sea bottom 15
Callantsoog 1986 300 78 260 0.25/0.27 Duneenforcement
Safety Sea bottom 15
Zwanenwater 1987 4345 1746 402 0.25/0.27 Beachnourishment
Safety Sea bottom 15
Zwanenwater 1987 3140 168 54 0.25/0.27 Duneenforcement
Safety Sea bottom 15
n/a = not available.
Table C.2Selected nourished beaches along the Dutch coast
Location Year Length(m)
Volume (IO3 m3)
Unitvolume(m3/m)
D so native/borrow(mm)
Fill type Purpose/problem
Borrowsite
Support Lifetime
Callantsoog 1991 3000 538 179 0.25/0.27 Beach Coastline Sea bottom 5nourishment preservation
Petten 1991 2180 371 170 0.22/0.30 Beach Coastline Sea bottom 5nourishment preservation
Den Helder 1992 6500 615 95 0.22/0.30 Beach Coastline Sea bottom 5nourishment preservation
Den Helder 1993 2400 280 117 0.24/0.30 Beach Coastline Sea bottom 5nourishment preservation
Kop van 1987 2400 1974 823 0.24/0.30 Beach n/a Channel 5Schouwen nourishment maintenanceWestenschouwen 1991 5430 2672 492 0.22/0.22 Beach Coastline Channel - n/a
nourishment preservation maintenanceWestkapelle- 1984 810 90 111 n/a/0.21 Seaward dune Safety Channel - n/a
Joossesweg enforcement maintenanceBoerenhof 1988 990 230 232 n/a Beach n/a Channel - n/a
nourishment maintenanceJoossesweg 1988 290 75 259 n/a Seaward dune n/a Channel - n/a
enforcement maintenanceZoutelande 1988 1000 153 153 n/a Seaward dune n/a Channel - n/a
enforcement maintenanceWestkapelle- 1990 1292 105 81 n/a Beach Safety Channel - n/a
Zoutelande nourishment maintenanceWestkapelle- 1991 4100 788 192 n/a Beach Coastline Channel - n/a
Zoutelande nourishment preservation maintenanceZoutelande- 1992 1900 192 101 n/a Beach Coastline Channel - n/a
Vijgeter nourishment preservation maintenance
n/a = not available.

106 H. Hanson et al. / Coastal Engineering 47 (2002) 81-111
Appendix D. Details on selected French sites
Table D.lInventory of nourished beaches along the Atlantic coast of France (1962-1995)
Location Year Length(m)
Volume (IO3 m3)
Unitvolume(m3/m)
D5q native/borrow(mm)
Filltype
Purpose/problem
Borrowsite
Supportingmeasure
Performance
Malo les Bains
1978 600 200 333 0.2/0.5 Beach n/a Dredged Twobreakwaters
Nourishment only in the area protected by BW
Malo les Bains
1988 500 160 320 0.2/0.5 Beach n/a Dredged Threebreakwaters
n/a
Bas-Champs 1969/1994 4000 900 9 n/a/shingle Beach n/a Beach 51 groynes Effective development of 4 km
Criei 1979/1994 500 150 20 n/a/shingle Beach n/a Beach Fivegroynes
Beach in critical state
MoulinBlanc-Brest
1978 900 160 180 n/a Beach n/a Dredged Onegroyne
Profile maintained between 1978 and 1983
La Noveillard- Pomic
1972 200 40 200 n/a Beach n/a Dredged Twogroynes
Satisfactory
Plage des Dames
1996 200 8 40 n/a Beach n/a Marine Timberblocks
n/a
Fromentine 1989 500 50 100 0.24/45 Beach n/a n/a Wooden fences + plants
11,500 m3 lost since 1989
La Rochelle/ les Minimes
1967 300 n/a n/a n/a/0.77 Beach n/a Dredged Twogroynes
Beach is still in place
ChatelaillonPlage
1989-1991 1000 350 350 0.15 Beach n/a Marine Onegroyne
Sand losses are tailing off
Bource franc 1993 1250 117 93 n/a/0.31 Beach n/a Dredged Four groynes built before
Maximumelevationof 2.4 m
Arcachon west coast
1976/1991 1500 526 23 n/a Beach n/a Dredged Renourishment every year
Arcachon north coast
1978/91 800 101 10 n/a Beach n/a Dredged n/a
Anglet-Bayonne 1974/92 1200 8200 380 n/a/0.22 Shore-face n/a Dredged Sixgroynes
1980 shallow waternourishment, very positive
Saint-Jean-de-Luz
1971-73 750 80 107 0.33/n/a Beach n/a Beach Two groynes + twobreakwaters
The sand supplied has been washed away
n/a = not available.

H. Hanson et al. / Coastal Engineering 47 (2002) 81-111 107
Table D.2Inventory of nourished beaches along the Mediterranean coast of France (1962-1995)
Location Year Length(m)
Volume (IO3 m3)
Unitvolume(m3/m)
¿Lonative/borrow(mm)
Filltype
Purpose/problem
Borrowsite
Supportingmeasure
Performance
Barcarès Plage Nord
1982-1983 n/a 16 n/a n/a Beach n/a Beach None Erosion stabilised after nourishment
Les Orpellières 1984-1985 800 4 5 n/a Dune n/a Beach Wooden fences + plants
Local beach widening; general nourishment
Maguelonne 1986-1990 11,000 37 3.3 n/a Dune n/a Beach Wooden fences + plants
Scheme resisted storms well
La Gracieuse 1988-1993 4000 50 12.5 0.18/n/a Dune n/a Beach Wooden fences + plants
The spit is no longer submerged
Le Prado 1975-1990 1300 150 115 n/a Beach n/a Terrestrial Three breakwaters No additional supply; redistributed before summer
La Ciotat 1975-1977 700 31 44 n/a Beach n/a Terrestrial Two groynes + two breakwaters
Ridge redistributed before summer; sand accumulated
Le Mourillon 1977 1000 50 50 n/a Beach n/a n/a Two breakwaters +submergedbreakwater
n/a
Fréjus-SaintAygulf
1989 500 200 400 n/a Beach n/a Dredged Three breakwaters 10 times more bathers can beaccommodated
Cavalaire 1968/1971 300 50 55 0.2/n/a Beach n/a Dredged Three groynes Deposition on another beach: material not blocked
La Croisette 1962-1964 1040 125 120 0.25/n/a Beach n/a Terrestrial Three groynes 1 st maintenance resupply (2400 m3) in 1989
Le Larvotto 1965-1967 450 80 180 n/a Beach n/a Terrestrial Three breakwaters 5000 m3 placed in 30 years + transfers
n/a = not available.
Appendix E. Details on selected Spanish sites
Table E.lSelected nourished beaches along the Mediterranean coast of Spain
Location Year Length (m)
Volume (IO3 m3)
Unitvolume(m3/m)
D5q native/borrow(mm)
Filltype
Purpose/problem
Borrowsite
Supportingmeasure
Performance
AlgarroboBeach,Málaga
1990 600 145 241 n/a Berm Delta recession n/a n/a n/a
(continued on next page)

108 H. Hanson et al. / Coastal Engineering 47 (2002) 81-111
Table E.l {continued)
Location Year Length(m)
Volume (IO3 m3)
Unitvolume(m3/m)
D5q native/borrow(mm)
Filltype
Purpose/problem
Borrowsite
Supportingmeasure
Performance
Torrox Beach, Malaga
1991 1700 476 280 n/a Berm Eroding dunes with houses
n/a n/a - 11 X IO3m3/year
FuengirolaBeach,Málaga
1990 700 1200 1714 n/a Berm Erosionharbour
n/a n/a n/a
CarihuelaBeach,Málaga
1990 1500 415 276 n/a Berm Eroding beach with houses
n/a n/a n/a
MalaguetaBeach,Málaga
1990 2500 1700 680 n/a/0.4-0.6 Berm Eroding beach with houses
Offshore,25 m depth
Detachedbreakwater
- 3 4 X IO3 m3/year
MarbellaBeach,Málaga
1991 4200 1000 238 n/a Berm Erosionharbour
n/a n/a n/a
Poniente,Benidorm
1991 2200 700 318 n/a Berm n/a n/a n/a n/a
n/a = not available.
Table E.2Selected nourished beaches along the Atlantic coast of Spain
Location Year Length(m)
Volume (IO3 m3)
Unitvolume(m3/m)
-D50native/borrow(mm)
Filltype
Purpose/problem
Borrowsite
Supportingmeasure
Performance
Castro Urdiales 1988 600 326 543 n/a/0.1-0.8 Berm New beach n/a n/a n/aBeach,Santander
Oran Beach, La Coruña
1989 1450 510 352 n/a/>l Berm Widen slowly eroding beach
n/a n/a n/a
San Cosme, Lugo
n/a 1000 400 400 variable Berm Erosionharbour
n/a n/a n/a
La Antilla Beach,
1984 2500 400 160 n/a Berm Widen eroding Beach
n/a n/a n/a
HuelvaZurrióla,
Guipúzcoa1995 850 1100 1294 n/a/0.33 Berm New beach Sea
bottom 15 km
Groin - 3 0 X IO3 m3/year
n/a = not available.
Appendix F. Details on selected sites in the United Kingdom
Table F.lInventory of nourished beaches along the coast of United Kingdom (1972-1998)
Location Year Length(m)
Volume (IO3 m3)
Unitvolume(m3/m)
-D50native/borrow(mm)
Filltype
Purpose/problem
Borrowsite
Supportingmeasure
Performance
Portobello 1972 1500 160 120 n/a/1.35 Bay Reaction Dredged(nearshore)
Six groynes 80% left by 1988

H. Hanson et al. / Coastal Engineering 47 (2002) 81-111 109
Table F.l (continued)
Location Year Length(m)
Volume (IO3 m3)
Unitvolume(m3/m)
D50native/borrow(mm)
Filltype
Purpose/problem
Borrowsite
Supportingmeasure
Performance
Portobello 1988 1500 100 67 n/a/1.35 Bay Top up Dredged(nearshore)
Six groynes n/a
Seaford 1987 1450 2500 580 n/a/< 1.0 Linear Reaction Dredged(offshore)
Terminal groyne and recycling
>100% left after 10 years
Hurst spit 1996 3000 300 100 n/a/1.0 Linear Reaction Dredged(nearshore)
Recycling n/a
Sand Bay 1983/84 2200 320 145 n/a/>l Linear Reaction Dredged(offshore)
Sand fencing No loss after 7 years and little since then
MablethorpeSkegness
1996/1998 24,000 7500 312 n/a/0.3 Linear Reaction Dredged(offshore)
n/a n/a
n/a = not available.
Appendix G. Details on selected Danish sites
G.I. Location: Lonstrup
A 1.1-km stretch with a village on top of a 25-m high sand/clay cliff. The average coastal retreat rate is 1.4 m/year. The initiation of the coastal protection scheme was an increasing risk for a number of the houses. During a storm in 1981, 5-15 m of the cliff was eroded which accelerated the final decision. The objective of the project was to stop the retreat of the cliff instantaneously and to maintain this situation in the future.
An initial beach nourishment of 58,000 m3 was performed in 1983 (53 m3/m) in front of a revetment built in 1982. In the following years, renourishment projects of about 20,000 m3 (18 m3/m) per year were implemented. The average D50 was 0.315 mm. The height of the beach today is the same as in the initial situation, which means that the average annual losses are equal to the average annual nourishment, in agreement with the projections estimated in the design phase (Laustrup and Madsen, 1994).
Prefill monitoring comprised profiles from cliff top to about 20 m depth with an interval of about 1 km measiued at least every second year since 1970. Postfill monitoring was performed since 1983, after which the beach has been surveyed foiu times per year at lines with a mutual distance of 25 m. In the same period, a bathymetric survey
with a line interval of 100 m has been carried out every year.
G.2. Location: Fjalt-ring—Torsminde
The project site is located on the lee side of a large groyne system with an average coastal retreat rate of about 10 m/year. A part of the stretch is a narrow land spit with a potential breach risk. The background for the different coastal protection schemes carried out since the late 1970s was the erosion risk for some houses and farms and the breach risk for the sand dike on the land spit. The objective of the project was to stop the coastal retreat. Nourishment projects with increasing volumes have been implemented since the early 1980s. In the period 1993-1996, an EU-spon- sored program with the objective of comparing a beach with a shoreface nourishment was implemented on the stretch.
In 1997 and 1998, a 2-Mm3 shoreface nourishment was carried out at 5 -6 m depth on the outer bar (400 m3/m). The average Ds0 was 0.4 mm. Initial and further losses have not been analysed yet. A large number of bathymetric surveys have been carried out on the stretch since 1938 giving a detailed picture of the natural development prior to the project. Postfill monitoring was performed through bathymetric surveys and sediment sampling every 2 months in lines with a mutual distance of 200 m.
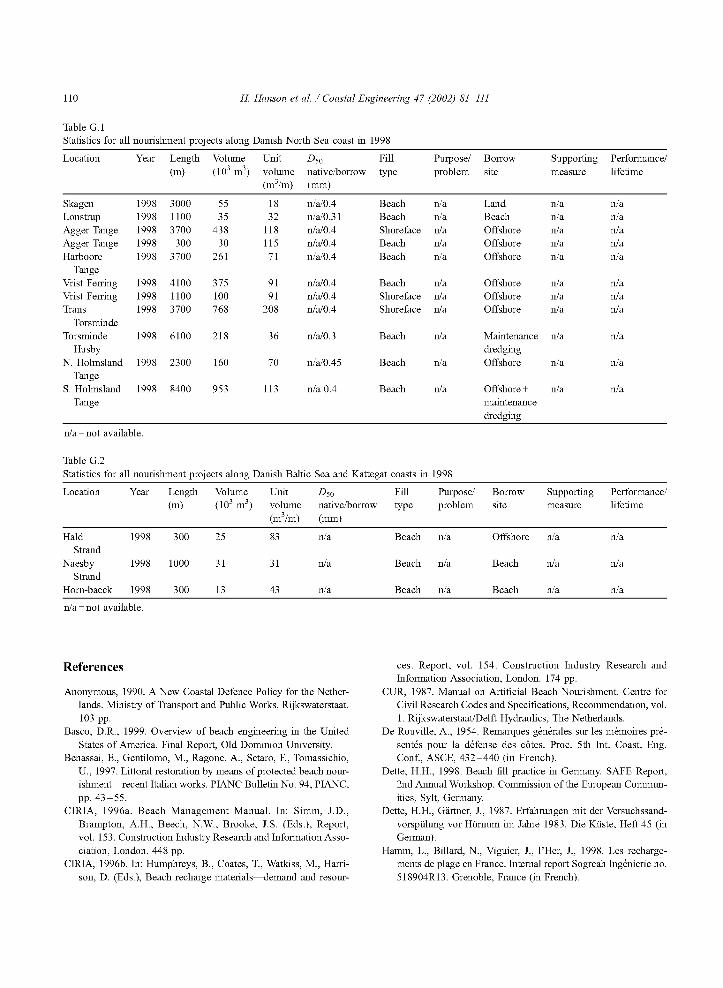
110 H. Hanson et al. / Coastal Engineering 47 (2002) 81-111
Table G.lStatistics for all nourishment projects along Danish North Sea coast in 1998
Location Year Length(m)
Volume (IO3 m3)
Unitvolume(m3/m)
-D50native/borrow(mm)
Filltype
Purpose/problem
Borrowsite
Supportingmeasure
Performance/lifetime
Skagen 1998 3000 55 18 n/a/0.4 Beach n/a Land n/a n/aLonstmp 1998 1100 35 32 n/a/0.31 Beach n/a Beach n/a n/aAgger Tange 1998 3700 438 118 n/a/0.4 Shoreface n/a Offshore n/a n/aAgger Tange 1998 300 30 115 n/a/0.4 Beach n/a Offshore n/a n/aHarboore 1998 3700 261 71 n/a/0.4 Beach n/a Offshore n/a n/a
TangeVrist Ferring 1998 4100 375 91 n/a/0.4 Beach n/a Offshore n/a n/aVrist Ferring 1998 1100 100 91 n/a/0.4 Shoreface n/a Offshore n/a n/aTrans 1998 3700 768 208 n/a/0.4 Shoreface n/a Offshore n/a n/a
TorsmindeTorsminde
Husby1998 6100 218 36 n/a/0.3 Beach n/a Maintenance
dredgingn/a n/a
N. Hohnsland 1998 2300 160 70 n/a/0.4 5 Beach n/a Offshore n/a n/aTange
S. Holmsland Tange
1998 8400 953 113 n/a 0.4 Beach n/a Offshore +maintenancedredging
n/a n/a
n/a = not available.
Table G.2Statistics for all nourishment projects along Danish Baltic Sea and Kattegat coasts in 1998
Location Year Length(m)
Volume (IO3 m3)
Unitvolume(m3/m)
D50native/borrow(mm)
Filltype
Purpose/problem
Borrowsite
Supportingmeasure
Performance/lifetime
Hald 1998 300 25 83 n/a Beach n/a Offshore n/a n/aStrand
Naesby 1998 1000 31 31 n/a Beach n/a Beach n/a n/aStrand
Hom-baeck 1998 300 13 43 n/a Beach n/a Beach n/a n/a
n/a = not available.
References
Anonymous, 1990. A New Coastal Defence Policy for the Netherlands. Ministry of Transport and Public Works, Rijkswaterstaat. 103 pp.
Basco, D.R., 1999. Overview of beach engineering in the United States of America. Final Report, Old Dominion University.
Benassai, E., Gentilomo, M., Ragone, A., Setaro, F., Tomassichio, U., 1997. Littoral restoration by means of protected beach nourishment—recent Italian works. PIANC Bulletin No. 94, PIANC, pp. 43-55.
CIRIA, 1996a. Beach Management Manual. In: Simm, J.D., Brampton, A.H., Beech, N.W., Brooke, J.S. (Eds.), Report, vol. 153. Construction Industry Research and Information Association, London. 448 pp.
CIRIA, 1996b. In: Humphreys, B., Coates, T., Watkiss, M., Harrison, D. (Eds.), Beach recharge materials—demand and resour
ces. Report, vol. 154. Construction Industry Research and Information Association, London. 174 pp.
CUR, 1987. Manual on Artificial Beach Nourishment. Centre for Civil Research Codes and Specifications, Recommendation, vol. 1. Rijkswaterstaat/Delft Hydraulics, The Netherlands.
De Rouville, A., 1954. Remarques générales sur les mémoires présentés pour la défense des côtes. Proc. 5th Int. Coast. Eng. Conf., ASCE, 432-440 (in French).
Dette, H.H., 1998. Beach fill practice in Germany. SAFE Report, 2nd Annual Workshop. Commission of the European Communities, Sylt, Germany.
Dette, H.H., Gärtner, L, 1987. Erfahrungen mit der Versuchssand- vorspiilung vor Hörnum im Jahre 1983. Die Küste, Heft 45 (in German).
Hamm, L., Billard, N., Viguier, J., l’Her, J., 1998. Les rechargements de plage en France. Internal report Sogreah Ingénierie no. 518904R13. Grenoble, France (in French).

H. Hanson et al. / Coastal Engineering 47 (2002) 81-111 l i i
Hamm, L., et al., 2002. A Summary of European experience with Shore nourishment. Coastal Engineering 47, 237-264 (this issue).
IWR, 1996. An analysis of the U.S. Army Corps of Engineers shore protection program. Institute of Water Resources, IWR Report 96-PS-l, U.S. Army Corps of Engineers, Fort Belvoir, VA.
James, W.R., 1975. Techniques in evaluating suitability of borrow material for beach nourishment. Report TM60, US Army Corps of Engineers, Coastal Engineering Research Center, Vicksburg, MS.
Kerchaert, R, Roobers, P.P.L., Noordam, A., DeCandat, P., 1986. Artificial beach nourishment on Belgium east coast. J. Waterw. Port Coast. Ocean Eng., ASCE 112 (5), 560-571.
Laustrup, C., Madsen, H.T., 1994. Design of breakwaters and beach nourishment. Proc. 24th Int. Coast. Eng. Conf., ASCE, 1359-1372.
Lechuga, A., 1994. Littoral dynamics and shoreline erosion: selected Spanish cases. U.S.-Spain Workshop on Natural Hazards.
Ministry of Agriculture, Fisheries and Food, 1993. Strategy for flood and coastal defence in England and Wales. MAFF/Welsh Office, MAFF Publications PB 1471.
Posford, D., 1998. Review of Lincshore nourishment strategy study. Report Prepared for the Environment Agency, Anglian Region, October 1998.
Roelse, P., 1996. Evaluation of sand nourishments at the Dutch coast 1975-1994. Report RIKZ-96.028, National Institute for Coastal and Marine Management/RIKZ, pp. 72 (in Dutch).
SPM, 1984. Shore Protection Manual, 2nd ed. U.S. Army Corps of Engineers, Coastal Engineering Research Center, US Government Printing Office, Washington, DC, 2 Vols.
Zaggia, R., 1998. Analisi critica degii interventi di ripascimento in Italia. Degree Thesis, Université di Padova, Facoltà di Ingegne- ria, Dipartimento di Ingegneria Idraulica, Marittima e Geotecn- ica, pp. 160 (in Italian).