Be equipped Directors’ remuneration in smaller …...Be equipped Directors’ remuneration in...
24
The Deloitte Academy: promoting excellence in the boardroom March 2016 Be equipped Directors’ remuneration in smaller companies
Transcript of Be equipped Directors’ remuneration in smaller …...Be equipped Directors’ remuneration in...

The Deloitte Academy: promoting excellence in the boardroomMarch 2016
Be equipped Directors’ remuneration in smaller companies

Contents
Overview from Juliet Halfhead 1
1. Introduction 2
2. Main findings 4
3. Incentive arrangements – key themes 5
4. Current trends 6
4.1 Base salary levels 6
4.2 Base salary increases 7
4.3 Pension 8
4.4 Annual bonus 9
4.5 Performance share plans 14
4.6 Shareholding guidelines 18
4.7 Non-executive director fees 19
5. Appendix – FTSE SmallCap companies included in the analyses 21
To start a new section, hold down the apple+shift keys and click
to release this object and type the section title in the box below.
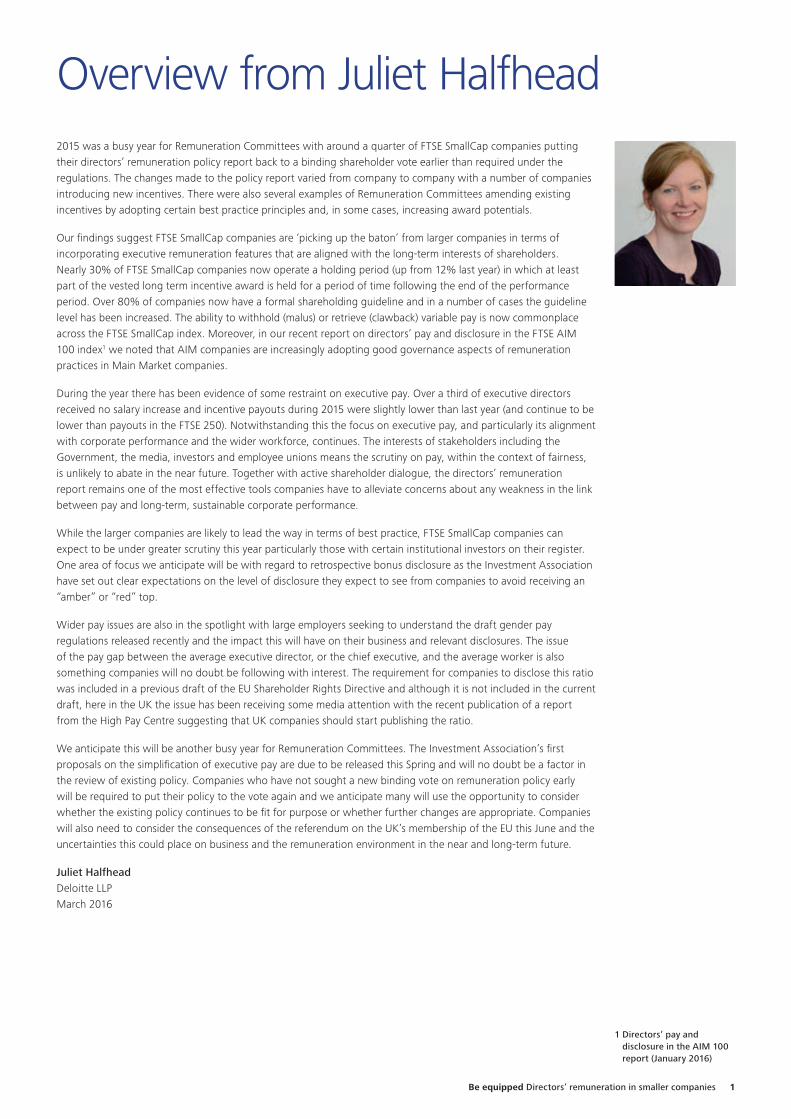
Overview from Juliet Halfhead2015 was a busy year for Remuneration Committees with around a quarter of FTSE SmallCap companies putting their directors’ remuneration policy report back to a binding shareholder vote earlier than required under the regulations. The changes made to the policy report varied from company to company with a number of companies introducing new incentives. There were also several examples of Remuneration Committees amending existing incentives by adopting certain best practice principles and, in some cases, increasing award potentials.
Our findings suggest FTSE SmallCap companies are ‘picking up the baton’ from larger companies in terms of incorporating executive remuneration features that are aligned with the long-term interests of shareholders. Nearly 30% of FTSE SmallCap companies now operate a holding period (up from 12% last year) in which at least part of the vested long term incentive award is held for a period of time following the end of the performance period. Over 80% of companies now have a formal shareholding guideline and in a number of cases the guideline level has been increased. The ability to withhold (malus) or retrieve (clawback) variable pay is now commonplace across the FTSE SmallCap index. Moreover, in our recent report on directors’ pay and disclosure in the FTSE AIM 100 index1 we noted that AIM companies are increasingly adopting good governance aspects of remuneration practices in Main Market companies.
During the year there has been evidence of some restraint on executive pay. Over a third of executive directors received no salary increase and incentive payouts during 2015 were slightly lower than last year (and continue to be lower than payouts in the FTSE 250). Notwithstanding this the focus on executive pay, and particularly its alignment with corporate performance and the wider workforce, continues. The interests of stakeholders including the Government, the media, investors and employee unions means the scrutiny on pay, within the context of fairness, is unlikely to abate in the near future. Together with active shareholder dialogue, the directors’ remuneration report remains one of the most effective tools companies have to alleviate concerns about any weakness in the link between pay and long-term, sustainable corporate performance.
While the larger companies are likely to lead the way in terms of best practice, FTSE SmallCap companies can expect to be under greater scrutiny this year particularly those with certain institutional investors on their register. One area of focus we anticipate will be with regard to retrospective bonus disclosure as the Investment Association have set out clear expectations on the level of disclosure they expect to see from companies to avoid receiving an “amber” or “red” top.
Wider pay issues are also in the spotlight with large employers seeking to understand the draft gender pay regulations released recently and the impact this will have on their business and relevant disclosures. The issue of the pay gap between the average executive director, or the chief executive, and the average worker is also something companies will no doubt be following with interest. The requirement for companies to disclose this ratio was included in a previous draft of the EU Shareholder Rights Directive and although it is not included in the current draft, here in the UK the issue has been receiving some media attention with the recent publication of a report from the High Pay Centre suggesting that UK companies should start publishing the ratio.
We anticipate this will be another busy year for Remuneration Committees. The Investment Association’s first proposals on the simplification of executive pay are due to be released this Spring and will no doubt be a factor in the review of existing policy. Companies who have not sought a new binding vote on remuneration policy early will be required to put their policy to the vote again and we anticipate many will use the opportunity to consider whether the existing policy continues to be fit for purpose or whether further changes are appropriate. Companies will also need to consider the consequences of the referendum on the UK’s membership of the EU this June and the uncertainties this could place on business and the remuneration environment in the near and long-term future.
Juliet HalfheadDeloitte LLPMarch 2016
1 Directors’ pay and disclosure in the AIM 100 report (January 2016)
Be equipped Directors’ remuneration in smaller companies 1

1. IntroductionFor the purpose of this report smaller companies are defined as constituents of the FTSE2 SmallCap index only (excluding investment trusts).
The FTSE SmallCap index currently has 142 constituents excluding investment trusts although one of these companies did not disclose sufficient information in the remuneration report to be included in the analyses. Therefore a total of 141 companies are included in the analyses with market capitalisations ranging from around £90m up to £700m.
We have included information from the latest report and accounts of companies with financial year ends up to and including 31 August 2015.
We have also included information from shareholder communications on new incentives and share plans in FTSE SmallCap companies put forward for approval at Annual General Meetings up until the end of February 2016.
During the year 29 companies asked shareholders to approve the directors’ remuneration policy report. This equates to around a quarter of FTSE SmallCap companies excluding newly listed companies. Of those, nine companies introduced a new long-term plan or amended an existing one while eight companies increased the maximum potential under their annual or long-term plans. Certain companies also simplified their executive remuneration arrangements by removing share matching plans or by limiting the number of long-term plans in operation at Board level to one.
In addition, within the 142 constituents, there are 21 newly listed companies on the FTSE SmallCap who have put, or will be putting, their policy reports to a binding vote for the first time.
Using this reportThe data in this report is only intended to provide you with a guide to directors’ remuneration in smaller companies. We would strongly recommend you consult your advisers on the interpretation of the data and its relevance to your particular circumstances.
This report does not constitute the provision of advice or services to any reader of this report, and therefore Deloitte LLP may not be named in a company’s remuneration report as having provided material assistance to the Remuneration Committee based solely on the use of the information provided in this report.
How we can help youThe Deloitte executive compensation consulting practice covers all aspects of senior executive remuneration and share plan services.
Our well-established team comprises over 70 professional staff including remuneration, share plan, tax and accounting specialists, actuaries and lawyers. We provide advice on all areas including implementation, investor relations, accounting, legal and tax issues.
Our practice is built around an integrated model, linking all of these areas, often separated in competitor companies.
2 FTSE is a trademark of the London Stock Exchange Group. All rights in FTSE indices vest in FTSE International Limited. For more information visit: www.ftse.com.
One team
Design
All-employee schemesAssistance with drafting
remuneration reports
Tax assistance, global tax analysis, tax efficient arrangements, tax guides
and HMRC reporting
Remuneration committee advisers
Implementation& communication
Strategic plan designInsight on shareholder
views and assistance with consultation
Drafting ofincentive plan rules
Business relevant performance measures
Updates on market trends and corporate governance
Drafting of share scheme participant documentation
Cost effective funding and specialist advice on
tax accounting, legal and financial issues
Executive paybenchmarking updates
Drafting of employee communication documents
2

To start a new section, hold down the apple+shift keys and click
to release this object and type the section title in the box below.
The experience and breadth of our practice means that we have particular strengths in the key areas of investor relations and legal implementation of incentive schemes.
We also have access to a wider knowledge base within Deloitte. This allows us to more fully understand industries and provide our clients with strategic solutions for their specific needs.
We are currently Remuneration Committee advisers to a range of different organisations across the FTSE AllShare including around 30% of FTSE 100 companies, 20% of FTSE 250 companies and over 10% of FTSE SmallCap companies.
ContactsIf you would like further information on any of the areas covered in this report or help in interpreting and using this data please do not hesitate to contact any of the names below:
Helen Beck020 7007 [email protected]
Stephen Cahill020 7303 [email protected]
William Cohen020 7007 [email protected]
Sally Cooper020 7007 [email protected]
Anita Grant0118 322 [email protected]
Nicki Demby020 7303 [email protected]
Nick Hipwell020 7007 [email protected]
Mitul Shah020 7007 [email protected]
Juliet Halfhead0121 695 [email protected]
David Cullington 020 7007 0899 [email protected]
Clare Edwards 020 7007 1997 [email protected]
John Cotton020 7007 [email protected]
James Harris 020 7007 [email protected]
Katie Kenny020 7007 2162 [email protected]
Shona Thomson020 7303 [email protected]
Julie Swann0121 695 5081 [email protected]
Ali Sidat020 7007 [email protected]
Dennis Patrickson020 7007 1996 [email protected]
Be equipped Directors’ remuneration in smaller companies 3
To start a new section, hold down the apple+shift keys and click
to release this object and type the section title in the box below.
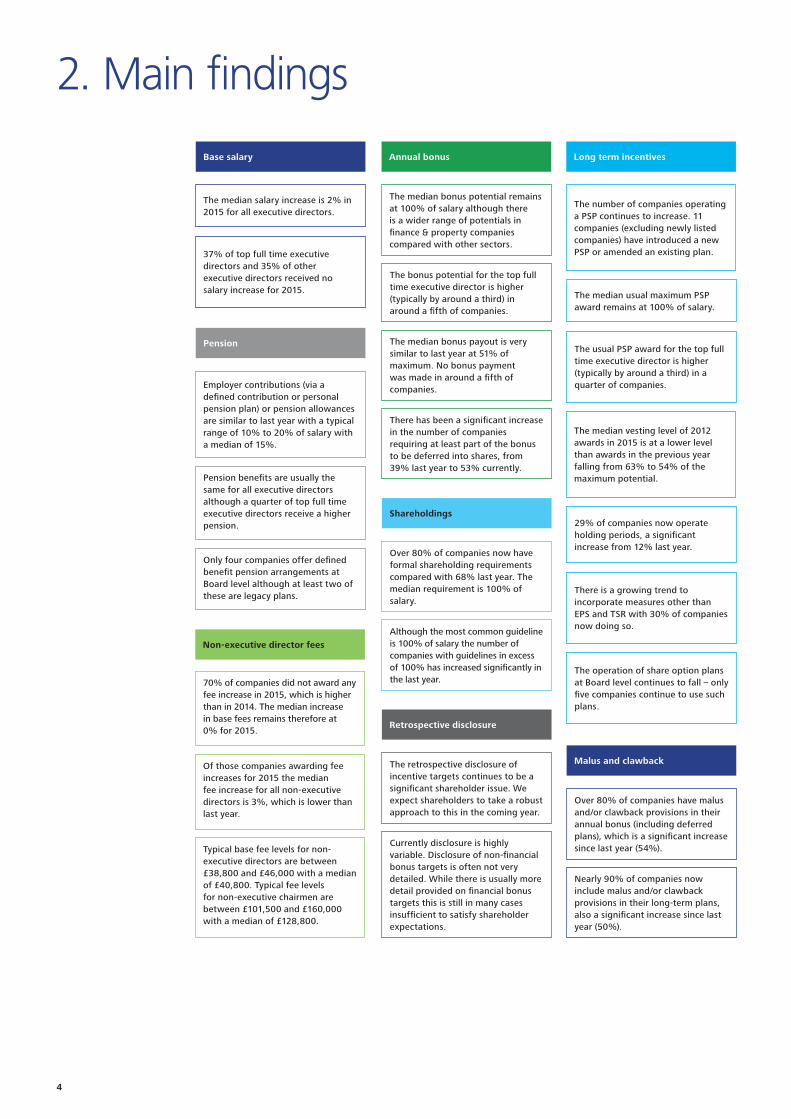
2. Main findings
Base salary Annual bonus Long term incentives
The median salary increase is 2% in 2015 for all executive directors.
The median bonus potential remains at 100% of salary although there is a wider range of potentials in finance & property companies compared with other sectors.
The number of companies operating a PSP continues to increase. 11 companies (excluding newly listed companies) have introduced a new PSP or amended an existing plan.
The median vesting level of 2012 awards in 2015 is at a lower level than awards in the previous year falling from 63% to 54% of the maximum potential.
37% of top full time executive directors and 35% of other executive directors received no salary increase for 2015.
The bonus potential for the top full time executive director is higher (typically by around a third) in around a fifth of companies.
The median usual maximum PSP award remains at 100% of salary.
29% of companies now operate holding periods, a significant increase from 12% last year.
The median bonus payout is very similar to last year at 51% of maximum. No bonus payment was made in around a fifth of companies.
There has been a significant increase in the number of companies requiring at least part of the bonus to be deferred into shares, from 39% last year to 53% currently.
Malus and clawback
Over 80% of companies have malus and/or clawback provisions in their annual bonus (including deferred plans), which is a significant increase since last year (54%).
Nearly 90% of companies now include malus and/or clawback provisions in their long-term plans, also a significant increase since last year (50%).
Non-executive director fees
70% of companies did not award any fee increase in 2015, which is higher than in 2014. The median increase in base fees remains therefore at 0% for 2015.
Of those companies awarding fee increases for 2015 the median fee increase for all non-executive directors is 3%, which is lower than last year.
Typical base fee levels for non-executive directors are between £38,800 and £46,000 with a median of £40,800. Typical fee levels for non-executive chairmen are between £101,500 and £160,000 with a median of £128,800.
Shareholdings
Over 80% of companies now have formal shareholding requirements compared with 68% last year. The median requirement is 100% of salary.
Although the most common guideline is 100% of salary the number of companies with guidelines in excess of 100% has increased significantly in the last year.
Retrospective disclosure
The retrospective disclosure of incentive targets continues to be a significant shareholder issue. We expect shareholders to take a robust approach to this in the coming year.
Currently disclosure is highly variable. Disclosure of non-financial bonus targets is often not very detailed. While there is usually more detail provided on financial bonus targets this is still in many cases insufficient to satisfy shareholder expectations.
The usual PSP award for the top full time executive director is higher (typically by around a third) in a quarter of companies.
There is a growing trend to incorporate measures other than EPS and TSR with 30% of companies now doing so.
The operation of share option plans at Board level continues to fall – only five companies continue to use such plans.
Pension
Employer contributions (via a defined contribution or personal pension plan) or pension allowances are similar to last year with a typical range of 10% to 20% of salary with a median of 15%.
Pension benefits are usually the same for all executive directors although a quarter of top full time executive directors receive a higher pension.
Only four companies offer defined benefit pension arrangements at Board level although at least two of these are legacy plans.
4
To start a new section, hold down the apple+shift keys and click
to release this object and type the section title in the box below.
3. Incentive arrangements – key themes
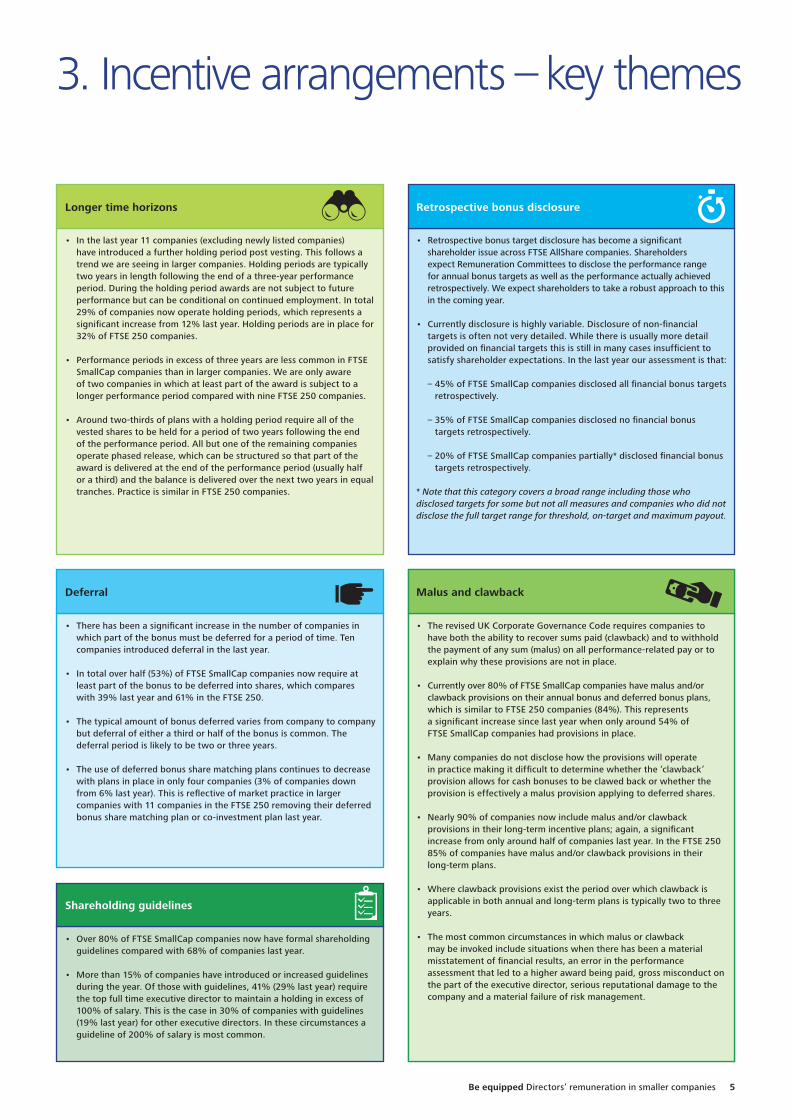
• In the last year 11 companies (excluding newly listed companies) have introduced a further holding period post vesting. This follows a trend we are seeing in larger companies. Holding periods are typically two years in length following the end of a three-year performance period. During the holding period awards are not subject to future performance but can be conditional on continued employment. In total 29% of companies now operate holding periods, which represents a significant increase from 12% last year. Holding periods are in place for 32% of FTSE 250 companies.
• Performance periods in excess of three years are less common in FTSE SmallCap companies than in larger companies. We are only aware of two companies in which at least part of the award is subject to a longer performance period compared with nine FTSE 250 companies.
• Around two-thirds of plans with a holding period require all of the vested shares to be held for a period of two years following the end of the performance period. All but one of the remaining companies operate phased release, which can be structured so that part of the award is delivered at the end of the performance period (usually half or a third) and the balance is delivered over the next two years in equal tranches. Practice is similar in FTSE 250 companies.
Longer time horizons
• There has been a significant increase in the number of companies in which part of the bonus must be deferred for a period of time. Ten companies introduced deferral in the last year.
• In total over half (53%) of FTSE SmallCap companies now require at least part of the bonus to be deferred into shares, which compares with 39% last year and 61% in the FTSE 250.
• The typical amount of bonus deferred varies from company to company but deferral of either a third or half of the bonus is common. The deferral period is likely to be two or three years.
• The use of deferred bonus share matching plans continues to decrease with plans in place in only four companies (3% of companies down from 6% last year). This is reflective of market practice in larger companies with 11 companies in the FTSE 250 removing their deferred bonus share matching plan or co-investment plan last year.
Deferral
• Over 80% of FTSE SmallCap companies now have formal shareholding guidelines compared with 68% of companies last year.
• More than 15% of companies have introduced or increased guidelines during the year. Of those with guidelines, 41% (29% last year) require the top full time executive director to maintain a holding in excess of 100% of salary. This is the case in 30% of companies with guidelines (19% last year) for other executive directors. In these circumstances a guideline of 200% of salary is most common.
Shareholding guidelines
• Retrospective bonus target disclosure has become a significant shareholder issue across FTSE AllShare companies. Shareholders expect Remuneration Committees to disclose the performance range for annual bonus targets as well as the performance actually achieved retrospectively. We expect shareholders to take a robust approach to this in the coming year.
• Currently disclosure is highly variable. Disclosure of non-financial targets is often not very detailed. While there is usually more detail provided on financial targets this is still in many cases insufficient to satisfy shareholder expectations. In the last year our assessment is that:
– 45% of FTSE SmallCap companies disclosed all financial bonus targets retrospectively.
– 35% of FTSE SmallCap companies disclosed no financial bonus targets retrospectively.
– 20% of FTSE SmallCap companies partially* disclosed financial bonus targets retrospectively.
* Note that this category covers a broad range including those who disclosed targets for some but not all measures and companies who did not disclose the full target range for threshold, on-target and maximum payout.
Retrospective bonus disclosure
Malus and clawback
• The revised UK Corporate Governance Code requires companies to have both the ability to recover sums paid (clawback) and to withhold the payment of any sum (malus) on all performance-related pay or to explain why these provisions are not in place.
• Currently over 80% of FTSE SmallCap companies have malus and/or clawback provisions on their annual bonus and deferred bonus plans, which is similar to FTSE 250 companies (84%). This represents a significant increase since last year when only around 54% of companies had provisions in place.
• Many companies do not disclose how the provisions will operate in practice making it difficult to determine whether the ‘clawback’ provision allows for cash bonus to be clawed back or whether the provision is effectively a malus provision applying to deferred shares.
• Nearly 90% of companies now include malus and/or clawback provisions in their long-term incentive plans; again, a significant increase from only around half of companies last year.
• Where clawback provisions exist the period over which clawback is applicable in both annual and long-term plans is typically two to three years.
• The most common circumstances in which malus or clawback may be invoked include situations when there has been a material misstatement of financial results, an error in the performance assessment that led to a higher award being paid, gross misconduct on the part of the executive director, serious reputational damage to the company and a material failure of risk management.
• The revised UK Corporate Governance Code requires companies to have both the ability to recover sums paid (clawback) and to withhold the payment of any sum (malus) on all performance-related pay or to explain why these provisions are not in place.
• Currently over 80% of FTSE SmallCap companies have malus and/or clawback provisions on their annual bonus and deferred bonus plans, which is similar to FTSE 250 companies (84%). This represents a significant increase since last year when only around 54% of FTSE SmallCap companies had provisions in place.
• Many companies do not disclose how the provisions will operate in practice making it difficult to determine whether the ‘clawback’ provision allows for cash bonuses to be clawed back or whether the provision is effectively a malus provision applying to deferred shares.
• Nearly 90% of companies now include malus and/or clawback provisions in their long-term incentive plans; again, a significant increase from only around half of companies last year. In the FTSE 250 85% of companies have malus and/or clawback provisions in their long-term plans.
• Where clawback provisions exist the period over which clawback is applicable in both annual and long-term plans is typically two to three years.
• The most common circumstances in which malus or clawback may be invoked include situations when there has been a material misstatement of financial results, an error in the performance assessment that led to a higher award being paid, gross misconduct on the part of the executive director, serious reputational damage to the company and a material failure of risk management.
Malus and clawback
Be equipped Directors’ remuneration in smaller companies 5

To start a new section, hold down the apple+shift keys and click
to release this object and type the section title in the box below.
4. Current trends4.1 Base salary levelsThe analyses of salary levels in this report are set out by reference to market capitalisation. We have used six market capitalisation bands to reflect the wide spread of financial size within FTSE SmallCap companies. The market capitalisation for each company is based on its annual average market capitalisation as at 1 February 2016.
It is important that salary market data is not used in isolation. Remuneration Committees should consider salaries ‘in the round’ taking into account the executive director’s experience, performance and value to the business as well as the performance of the company and pay levels across the wider group and external environment. Moreover the company should consider the impact salary increases can have on the overall remuneration package given their link to pension and variable pay.
The guidance from investors and investor bodies should also be taken into account. In particular companies should be prepared to provide a robust rationale for any salary increases in excess of the increase awarded to the wider employee population or when these are not supported by company performance.
Market capitalisation £m
Lower quartile
£
Median£
Upper quartile
£
90 – 150 288,400 317,800 350,000
151 – 220 314,000 360,000 407,500
221 – 320 331,500 380,700 409,800
321 – 400 357,600 434,500 461,600
401 – 480 392,000 450,000 467,300
481 – 700 418,000 463,000 522,800
Market capitalisation £m
Lower quartile
£
Median£
Upper quartile
£
90 – 150 197,000 232,300 249,300
151 – 220 192,000 231,300 262,600
221 – 320 215,000 250,000 288,400
321 – 400 267,000 296,200 322,900
401 – 480 269,900 291,700 326,500
481 – 700 273,000 289,600 303,800
0
100,000
200,000
300,000
400,000
500,000
600,000
90-150 151-220 221-320 321-400 401-480 481-700
Salary, £
Lower quartile to median Median to upper quartile
0
50,000
100 000
150,000
200,000
250,000
300,000
350,000
90-150 151-220 221-320 321-400 401-480 481-700
Salary, £
Lower quartile to median Median to upper quartile
Top full time executive directors – base salary levels by market capitalisation
Finance directors – base salary levels by market capitalisation
6

To start a new section, hold down the apple+shift keys and click
to release this object and type the section title in the box below.
4.2 Base salary increases• Around 80% of FTSE SmallCap companies disclosed the salaries effective in 2015. The median salary increase,
including those awarding no increase, was 2% for both the top full time executive director and other executive directors. For those awarding increases the median salary increase was 2.5% for all executive directors.
• Over a third of companies did not increase salaries for the top full time executive director (37%) and other executive directors (35%), which is slightly higher than last year in respect of the top full time executive director (33%) and also higher than last year in relation to other executive directors (23%).
• The number of companies awarding significant salary increases in 2015 has fallen compared with last year. Only one company awarded an increase in excess of 8% to its executive directors compared with around 8% of companies awarding increases in excess of 10% in 2014.
• The chart below shows the range of salary increases awarded to the top full time executive director and to other executive directors in 2015.
2015 salary increases
0% 5% 10% 15% 20% 25% 30% 35% 40%
0%
0% to 2%
2% to 3%
3% to 5%
5% to 8%
More than 8%
% of companies
Other executive directors Top full time executive directors
Guidance from investors and proxy voting agencies
• The Remuneration Committee should explain its policy for setting and reviewing salary levels. Changes in salary levels should be disclosed and justified and take into account the pay and conditions across the company. Post-freeze ‘catch-up’ increases are not generally supported.
• Any increase in base salaries in excess of inflation or those awarded to the rest of the workforce should be fully explained and justified to shareholders.
• Salaries should reflect the role and responsibilities of the individual and be set at a level which is no higher than necessary.
• Salary decisions should not be taken on the basis of simple benchmarking against peer companies and if benchmarking is used then it should not be with the aim of matching the median. Salary benchmarking should not be carried out too frequently.
• Remuneration Committees should be aware of the multiplier effect that increases in salary have on total remuneration.
• Where an individual is appointed on an ‘entry-level’ salary with the intention of increasing this to a higher level over time, this intention should be explained at the time of appointment.
• The use of fixed allowances is discouraged. When such payments are considered necessary this should be clearly justified and explained within the context of the remuneration package as a whole.
Be equipped Directors’ remuneration in smaller companies 7
To start a new section, hold down the apple+shift keys and click
to release this object and type the section title in the box below.
4.3 PensionFrom our analysis only four FTSE SmallCap companies offer defined benefit pension arrangements at Board level although at least two of these are legacy arrangements which would not be applicable to newly appointed directors.
The vast majority of companies provide pension benefits to executive directors in the form of a contribution to a company-operated defined contribution plan, a contribution to a personal pension plan or a salary supplement in lieu of a pension contribution (or a combination of any or all of the three).
• Around 6% of companies do not appear to provide any pension benefit to executive directors (this is slightly higher for top full time executive directors at 11%).
• The typical employer contribution or salary supplement is similar to last year with a typical range of 10% to 20% of salary with a median of 15% of salary (compared with a range of 15% to 25% of salary in the FTSE 250). It is usual for the pension provision to be the same for all executive directors although it is worth noting that a quarter of top full time executive directors receive a higher pension contribution.
Guidance from investors and proxy voting agencies
• Pension benefits should not be used as a mechanism for increasing total remuneration. Any changes to pension benefits should be disclosed and justified.
• The pension provision should be in line with the general approach for employees and any difference should be disclosed and justified.
• Directors should not be offered an unreduced pension on early retirement.
• Pension-related benefits, including payments in lieu of participation in a pension plan, should be clearly disclosed. Payments in lieu of a pension contribution should be treated as a separate non-salary benefit and excluded from the calculation of quantum for annual and long-term awards.
• Compensation for changes in tax relief is not acceptable.
Pension changes
On 8 July 2015 the Government announced a number of changes to the pension landscape impacting both registered pensions and relevant non-UK schemes. The most significant of these were:
• Effective from 6 April 2016, the annual allowance (“AA”) will be proportionately restricted by £1 for every £2 of adjusted income (which includes employer pension contributions) over £150,000 pa down to a minimum of £10,000 pa. This means that for those with adjusted income of more than £210,000 pa (including employer pension contributions) the AA will be £10,000 pa.
• There will be a de minimis income threshold of £110,000 pa below which the AA will not be tapered. Any salary sacrifice arrangements entered into on or after 9 July 2015 will be added back when determining whether the £110,000 pa threshold is met.
• The lifetime allowance (“LTA”) will be reduced from £1.25m to £1m from 6 April 2016 and individuals are likely to need to consider whether to make elections to protect their lifetime allowance. The LTA will be indexed annually in line with the Consumer Price Index from 6 April 2018.
8
To start a new section, hold down the apple+shift keys and click
to release this object and type the section title in the box below.
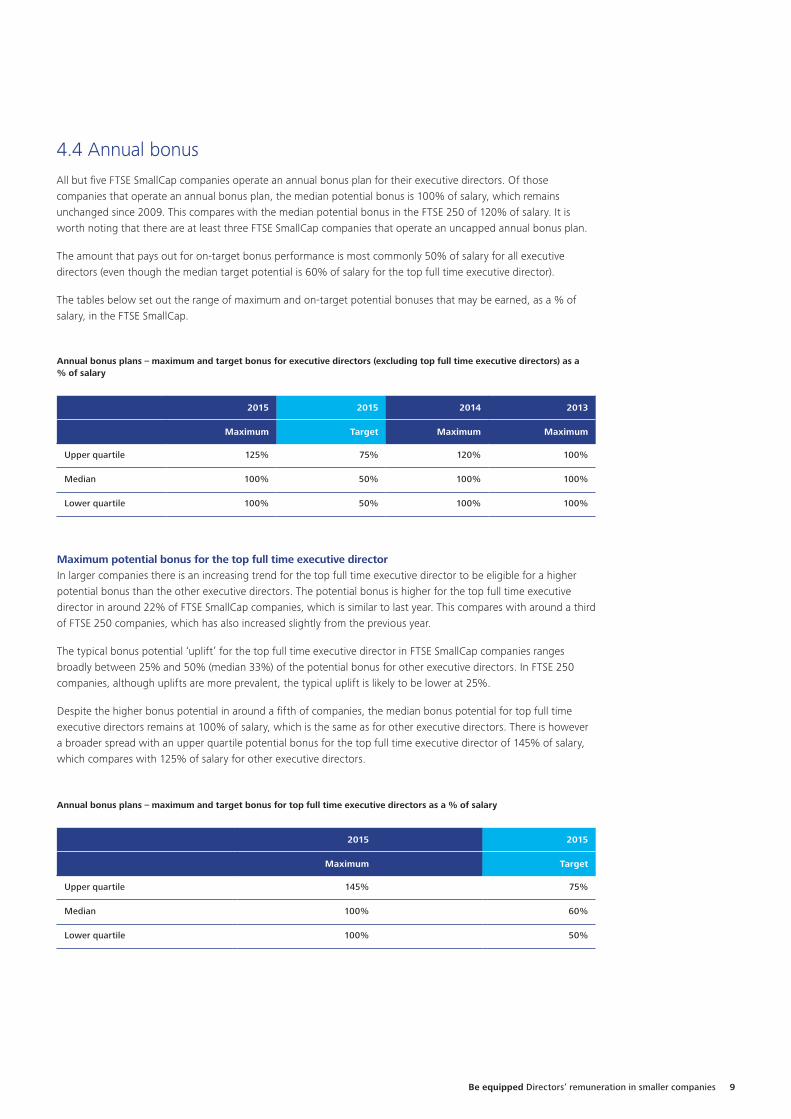
4.4 Annual bonusAll but five FTSE SmallCap companies operate an annual bonus plan for their executive directors. Of those companies that operate an annual bonus plan, the median potential bonus is 100% of salary, which remains unchanged since 2009. This compares with the median potential bonus in the FTSE 250 of 120% of salary. It is worth noting that there are at least three FTSE SmallCap companies that operate an uncapped annual bonus plan.
The amount that pays out for on-target bonus performance is most commonly 50% of salary for all executive directors (even though the median target potential is 60% of salary for the top full time executive director).
The tables below set out the range of maximum and on-target potential bonuses that may be earned, as a % of salary, in the FTSE SmallCap.
Annual bonus plans – maximum and target bonus for executive directors (excluding top full time executive directors) as a % of salary
2015 2015 2014 2013
Maximum Target Maximum Maximum
Upper quartile 125% 75% 120% 100%
Median 100% 50% 100% 100%
Lower quartile 100% 50% 100% 100%
Annual bonus plans – maximum and target bonus for top full time executive directors as a % of salary
2015 2015
Maximum Target
Upper quartile 145% 75%
Median 100% 60%
Lower quartile 100% 50%
Maximum potential bonus for the top full time executive directorIn larger companies there is an increasing trend for the top full time executive director to be eligible for a higher potential bonus than the other executive directors. The potential bonus is higher for the top full time executive director in around 22% of FTSE SmallCap companies, which is similar to last year. This compares with around a third of FTSE 250 companies, which has also increased slightly from the previous year.
The typical bonus potential ‘uplift’ for the top full time executive director in FTSE SmallCap companies ranges broadly between 25% and 50% (median 33%) of the potential bonus for other executive directors. In FTSE 250 companies, although uplifts are more prevalent, the typical uplift is likely to be lower at 25%.
Despite the higher bonus potential in around a fifth of companies, the median bonus potential for top full time executive directors remains at 100% of salary, which is the same as for other executive directors. There is however a broader spread with an upper quartile potential bonus for the top full time executive director of 145% of salary, which compares with 125% of salary for other executive directors.
Be equipped Directors’ remuneration in smaller companies 9
To start a new section, hold down the apple+shift keys and click
to release this object and type the section title in the box below.
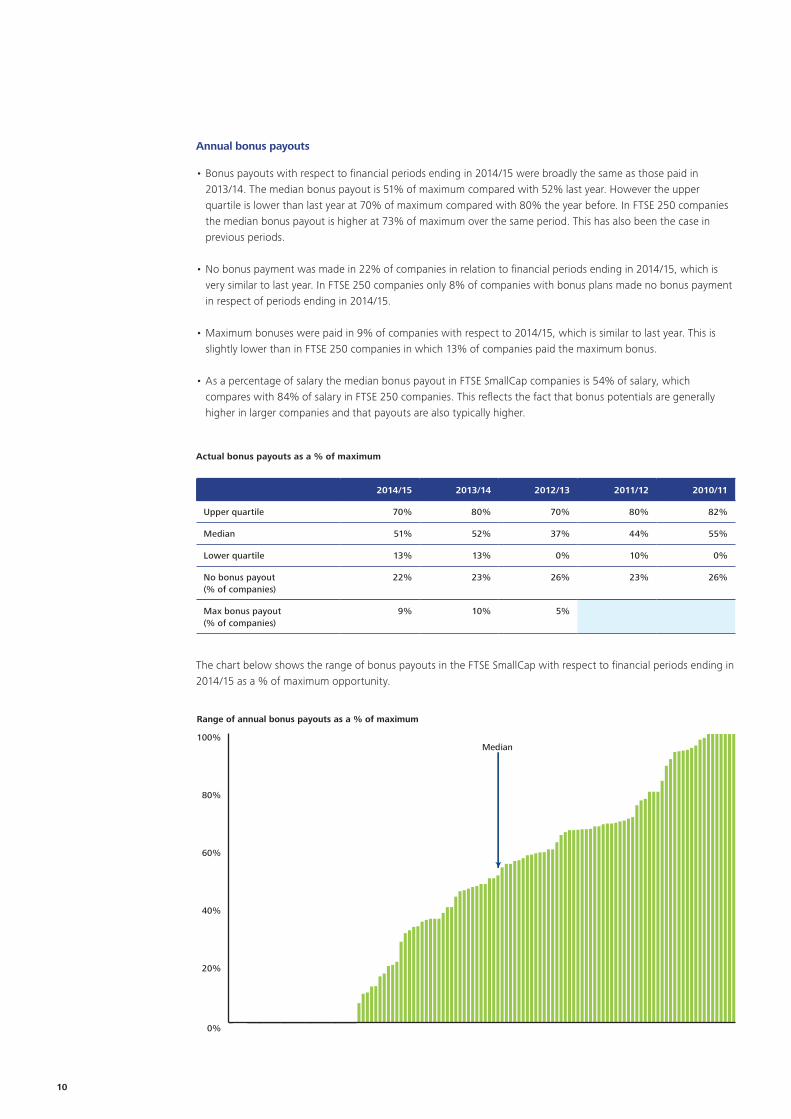
Annual bonus payouts
• Bonus payouts with respect to financial periods ending in 2014/15 were broadly the same as those paid in 2013/14. The median bonus payout is 51% of maximum compared with 52% last year. However the upper quartile is lower than last year at 70% of maximum compared with 80% the year before. In FTSE 250 companies the median bonus payout is higher at 73% of maximum over the same period. This has also been the case in previous periods.
• No bonus payment was made in 22% of companies in relation to financial periods ending in 2014/15, which is very similar to last year. In FTSE 250 companies only 8% of companies with bonus plans made no bonus payment in respect of periods ending in 2014/15.
• Maximum bonuses were paid in 9% of companies with respect to 2014/15, which is similar to last year. This is slightly lower than in FTSE 250 companies in which 13% of companies paid the maximum bonus.
• As a percentage of salary the median bonus payout in FTSE SmallCap companies is 54% of salary, which compares with 84% of salary in FTSE 250 companies. This reflects the fact that bonus potentials are generally higher in larger companies and that payouts are also typically higher.
Actual bonus payouts as a % of maximum
2014/15 2013/14 2012/13 2011/12 2010/11
Upper quartile 70% 80% 70% 80% 82%
Median 51% 52% 37% 44% 55%
Lower quartile 13% 13% 0% 10% 0%
No bonus payout (% of companies)
22% 23% 26% 23% 26%
Max bonus payout (% of companies)
9% 10% 5%
The chart below shows the range of bonus payouts in the FTSE SmallCap with respect to financial periods ending in 2014/15 as a % of maximum opportunity.
Range of annual bonus payouts as a % of maximum
0%
20%
40%
60%
80%
100%Median
10

To start a new section, hold down the apple+shift keys and click
to release this object and type the section title in the box below.
Sector differencesWhile the median potential bonus is the same across all sectors at 100% of salary, there is a wider range of potential bonuses in the finance & property sector in which the maximum potential bonus ranges from a minimum of 60% of salary to a maximum of 300% of salary. This compares with a range of 50% to 250% of salary in industrial & manufacturing companies and from 50% to 150% of salary in retail & services companies.
Bonus payouts in the finance & property and industrial & manufacturing sectors in respect of financial periods ending in 2014/15 are broadly similar (although there is a greater variance in payouts in the industrial & manufacturing sector). Typical payouts in the retail & services sector are generally lower than in the other sectors, which may reflect the more challenging trading conditions currently affecting customer-facing businesses.
The following chart shows the interquartile range of maximum potential bonuses and actual bonus payouts in respect of financial periods ending in 2014/15 as a % of salary across the different sectors.
Bonus potential vs actual payout – (as a % of salary)
0%
20%
40%
60%
80%
100%
120%
140% All companies Finance & property Industrial & manufacturing Retail & services
Potential Actual Potential Actual Potential Actual Potential Actual
Lower quartile to median Median to upper quartile
Performance measures
• 88% of FTSE SmallCap companies use more than one performance measure to determine the bonus payout with more than half (54%) using three or more measures. It is now very uncommon for the bonus to be determined by reference to a single measure.
• Almost two-thirds of FTSE SmallCap companies use a mixture of financial and non-financial measures to determine bonus payouts. In the remaining third the bonus is based entirely on financial measures. The exact combination of measures will vary from company to company but typically around 80% of the bonus will be based on financial measures and 20% on non-financial measures.
• It is worth noting that in FTSE 250 companies there is a move towards using more non-financial measures; the bonus is wholly based on financial measures in only 25% of these companies compared with 40% just three years ago.
Be equipped Directors’ remuneration in smaller companies 11
To start a new section, hold down the apple+shift keys and click
to release this object and type the section title in the box below.
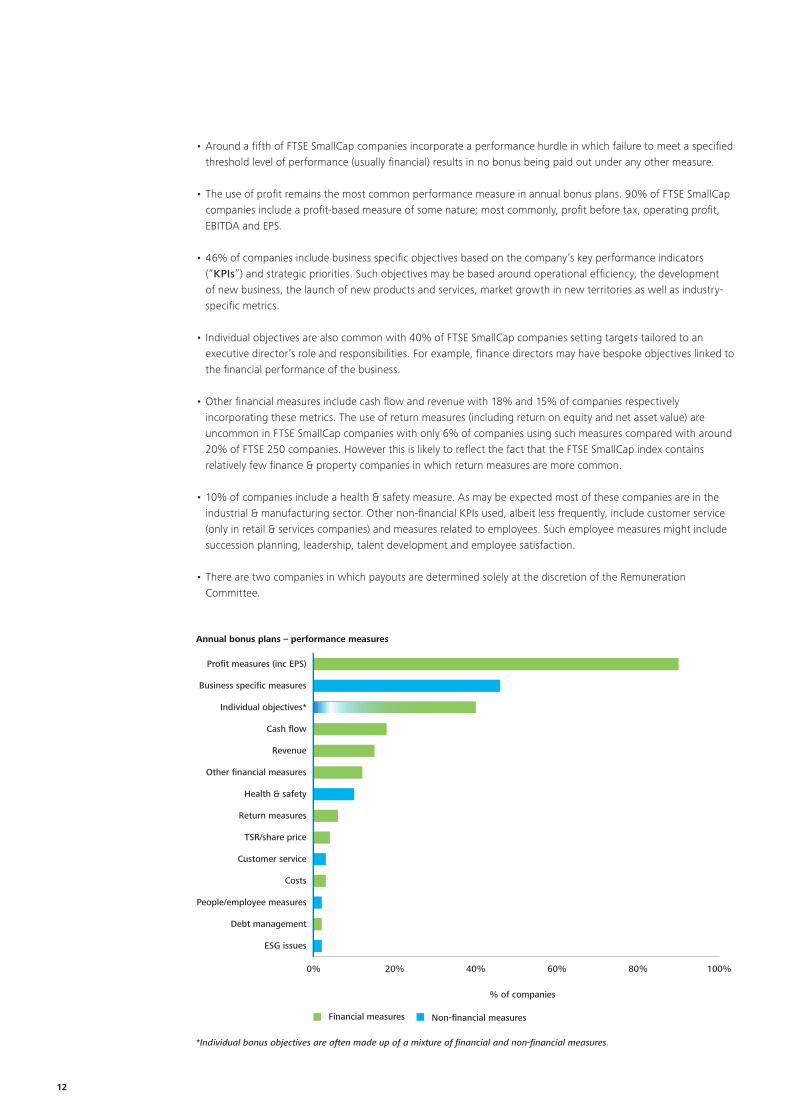
• Around a fifth of FTSE SmallCap companies incorporate a performance hurdle in which failure to meet a specified threshold level of performance (usually financial) results in no bonus being paid out under any other measure.
• The use of profit remains the most common performance measure in annual bonus plans. 90% of FTSE SmallCap companies include a profit-based measure of some nature; most commonly, profit before tax, operating profit, EBITDA and EPS.
• 46% of companies include business specific objectives based on the company’s key performance indicators (“KPIs”) and strategic priorities. Such objectives may be based around operational efficiency, the development of new business, the launch of new products and services, market growth in new territories as well as industry-specific metrics.
• Individual objectives are also common with 40% of FTSE SmallCap companies setting targets tailored to an executive director’s role and responsibilities. For example, finance directors may have bespoke objectives linked to the financial performance of the business.
• Other financial measures include cash flow and revenue with 18% and 15% of companies respectively incorporating these metrics. The use of return measures (including return on equity and net asset value) are uncommon in FTSE SmallCap companies with only 6% of companies using such measures compared with around 20% of FTSE 250 companies. However this is likely to reflect the fact that the FTSE SmallCap index contains relatively few finance & property companies in which return measures are more common.
• 10% of companies include a health & safety measure. As may be expected most of these companies are in the industrial & manufacturing sector. Other non-financial KPIs used, albeit less frequently, include customer service (only in retail & services companies) and measures related to employees. Such employee measures might include succession planning, leadership, talent development and employee satisfaction.
• There are two companies in which payouts are determined solely at the discretion of the Remuneration Committee.
0% 20% 40% 60% 80% 100%
ESG issues
Debt management
People/employee measures
Costs
Customer service
TSR/share price
Return measures
Health & safety
Other financial measures
Revenue
Cash flow
Individual objectives*
Business specific measures
Profit measures (inc EPS)
% of companies
Financial measures
*Individual bonus objectives are often made up of a mixture of financial and non-financial measures.
Non-financial measures
Annual bonus plans – performance measures
12
To start a new section, hold down the apple+shift keys and click
to release this object and type the section title in the box below.
Retrospective bonus disclosureRetrospective bonus disclosure is a key area of focus for shareholders and best practice across the FTSE AllShare is moving towards more detailed disclosure around financial, strategic and personal targets. Shareholders expect Remuneration Committees to disclose the performance range for annual bonus targets as well as the performance actually achieved retrospectively.
One of the key drivers for this is the publication of the Investment Association’s (“IA”) guidance in November 2015 concerning retrospective annual bonus disclosure. In summary, the IA expects companies to disclose the full range of targets and, if any company considers their targets to be commercially sensitive, they must explain the circumstances that justify the use of this approach and indicate when targets will be disclosed in the future (ideally in the next financial period).
Our findings suggest that certain investor bodies and proxy agencies have been more stringent towards breaches of best practice in larger companies in 2015 with respect to retrospective disclosure. However, in line with the IA’s updated guidance, we expect investor bodies and proxy agencies to apply a more robust approach across all companies in the coming year.
Guidance from investors and proxy voting agencies
• Maximum bonus levels should be disclosed and any change from the previous year should be explained.
• Annual bonuses exist to reward contribution above the level expected.
• Companies should explain the performance measures chosen. Bonus payments should be clearly linked to business targets ideally through disclosed KPIs.
• Following payment of the bonus companies should provide a full analysis in the annual remuneration report of the extent to which the relevant targets were actually met. Generally this would include disclosure of the performance range for annual bonus targets. Withholding such information on the basis of ‘commercial sensitivity’ is discouraged and can lead to a vote against the annual remuneration report.
• Where non-financial objectives are used the majority of any payout should be linked to financial performance.
• Where a company increases the maximum bonus opportunity, the performance targets should be made sufficiently more challenging to justify the additional reward that can be earned.
• Targets should reflect the Board’s appetite for risk and should not promote or reward excessive risk-taking.
• Annual bonuses should not be paid if the business has suffered an exceptional negative event. If some targets have been met, “shareholders should be consulted on bonus policy and any proposed payments should be carefully explained”.
• The deferral of a portion of the bonus into shares can create a greater alignment with shareholders. However the use of deferral should not result in an increase in the size of the award.
• Remuneration Committees should exercise judgment about the overall performance of the company when determining awards. In particular the Remuneration Committee should consider how the results have been achieved and not just what was achieved. The range of discretion that can be applied to bonus awards should be disclosed. Any use of discretion and its impact on the award should be explained.
• Provisions to pay a guaranteed bonus or to operate an uncapped bonus plan are not acceptable.
• There should be no provisions for the re-testing of performance conditions.
Be equipped Directors’ remuneration in smaller companies 13
To start a new section, hold down the apple+shift keys and click
to release this object and type the section title in the box below.
4.5 Performance share plansAround 87% of companies operate a performance share plan (“PSP”) for their executive directors, which is an increase since last year (82%). 11 companies have introduced a new PSP or amended an existing plan (excluding new plans introduced by companies who have listed during the year). There are now only five companies that continue to operate a share option plan at Board level. It is interesting to note that around 8% of companies do not operate any form of long-term incentive for their executive directors.
The usual maximum PSP award in the FTSE SmallCap broadly ranges between 100% and 150% of salary for executive directors with a median of 100%. The median has remained the same in recent years and compares with a median opportunity of 150% of salary in the FTSE 250.
The absolute maximum PSP award is broadly between 150% and 200% of salary with a median of 200%. However awards at this level are often only made in exceptional circumstances such as for recruitment or retention purposes. In the FTSE 250 the median absolute maximum PSP award is also 200% of salary.
Threshold PSP vesting performance is most commonly equal to 25% of maximum opportunity in FTSE SmallCap companies, which is the same as in larger companies.
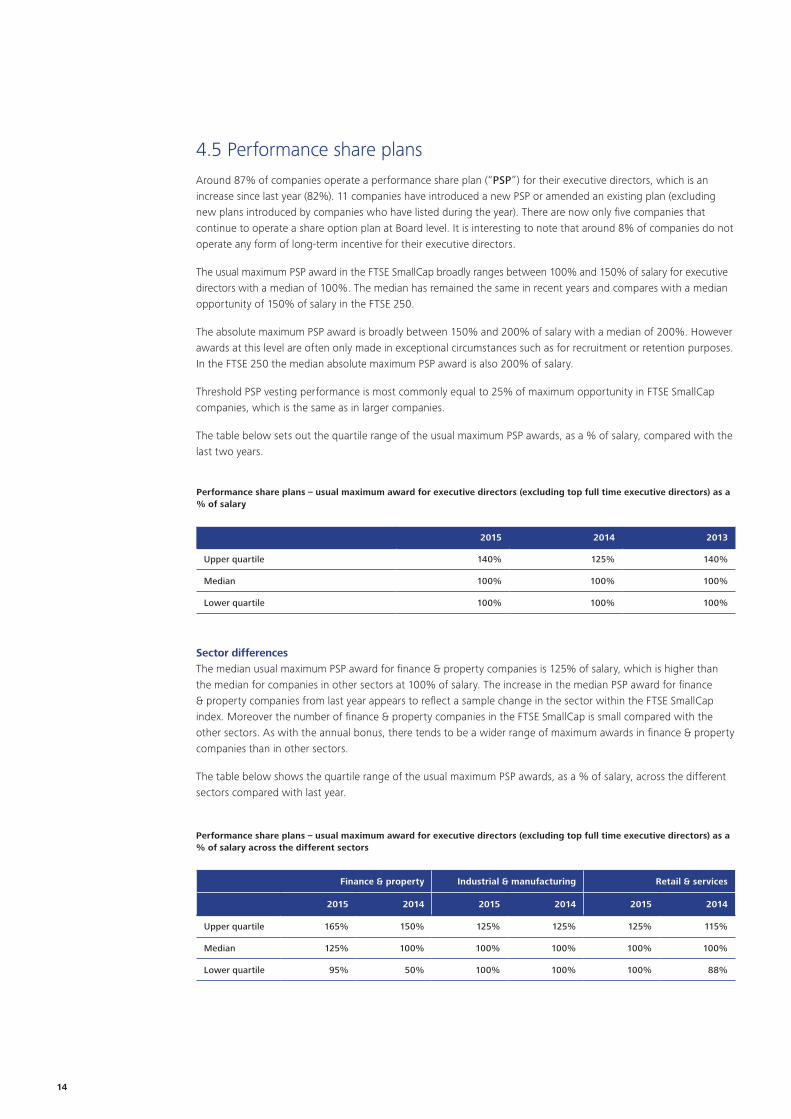
The table below sets out the quartile range of the usual maximum PSP awards, as a % of salary, compared with the last two years.
Performance share plans – usual maximum award for executive directors (excluding top full time executive directors) as a % of salary
2015 2014 2013
Upper quartile 140% 125% 140%
Median 100% 100% 100%
Lower quartile 100% 100% 100%
Sector differencesThe median usual maximum PSP award for finance & property companies is 125% of salary, which is higher than the median for companies in other sectors at 100% of salary. The increase in the median PSP award for finance & property companies from last year appears to reflect a sample change in the sector within the FTSE SmallCap index. Moreover the number of finance & property companies in the FTSE SmallCap is small compared with the other sectors. As with the annual bonus, there tends to be a wider range of maximum awards in finance & property companies than in other sectors.
The table below shows the quartile range of the usual maximum PSP awards, as a % of salary, across the different sectors compared with last year.
Performance share plans – usual maximum award for executive directors (excluding top full time executive directors) as a % of salary across the different sectors
Finance & property Industrial & manufacturing Retail & services
2015 2014 2015 2014 2015 2014
Upper quartile 165% 150% 125% 125% 125% 115%
Median 125% 100% 100% 100% 100% 100%
Lower quartile 95% 50% 100% 100% 100% 88%
14
To start a new section, hold down the apple+shift keys and click
to release this object and type the section title in the box below.
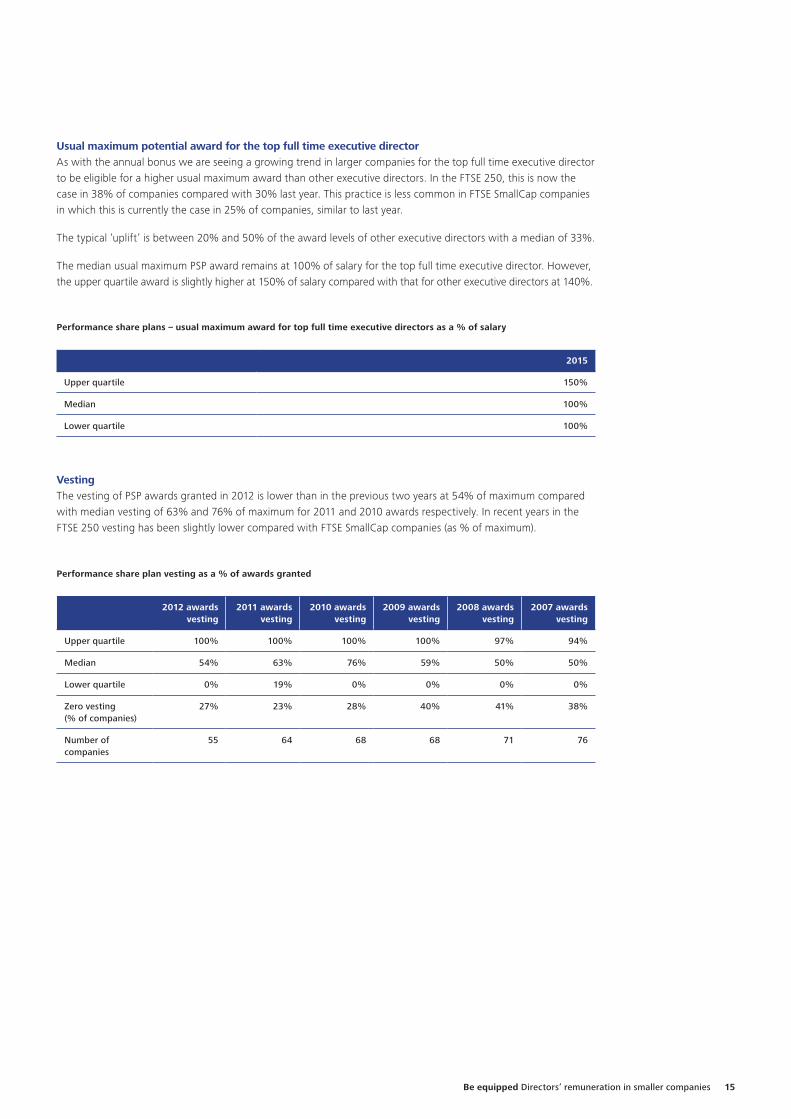
Performance share plan vesting as a % of awards granted
2012 awards
vesting2011 awards
vesting2010 awards
vesting2009 awards
vesting2008 awards
vesting2007 awards
vesting
Upper quartile 100% 100% 100% 100% 97% 94%
Median 54% 63% 76% 59% 50% 50%
Lower quartile 0% 19% 0% 0% 0% 0%
Zero vesting(% of companies)
27% 23% 28% 40% 41% 38%
Number of companies
55 64 68 68 71 76
Usual maximum potential award for the top full time executive directorAs with the annual bonus we are seeing a growing trend in larger companies for the top full time executive director to be eligible for a higher usual maximum award than other executive directors. In the FTSE 250, this is now the case in 38% of companies compared with 30% last year. This practice is less common in FTSE SmallCap companies in which this is currently the case in 25% of companies, similar to last year.
The typical ‘uplift’ is between 20% and 50% of the award levels of other executive directors with a median of 33%.
The median usual maximum PSP award remains at 100% of salary for the top full time executive director. However, the upper quartile award is slightly higher at 150% of salary compared with that for other executive directors at 140%.
Performance share plans – usual maximum award for top full time executive directors as a % of salary
2015
Upper quartile 150%
Median 100%
Lower quartile 100%
VestingThe vesting of PSP awards granted in 2012 is lower than in the previous two years at 54% of maximum compared with median vesting of 63% and 76% of maximum for 2011 and 2010 awards respectively. In recent years in the FTSE 250 vesting has been slightly lower compared with FTSE SmallCap companies (as % of maximum).
Be equipped Directors’ remuneration in smaller companies 15
To start a new section, hold down the apple+shift keys and click
to release this object and type the section title in the box below.
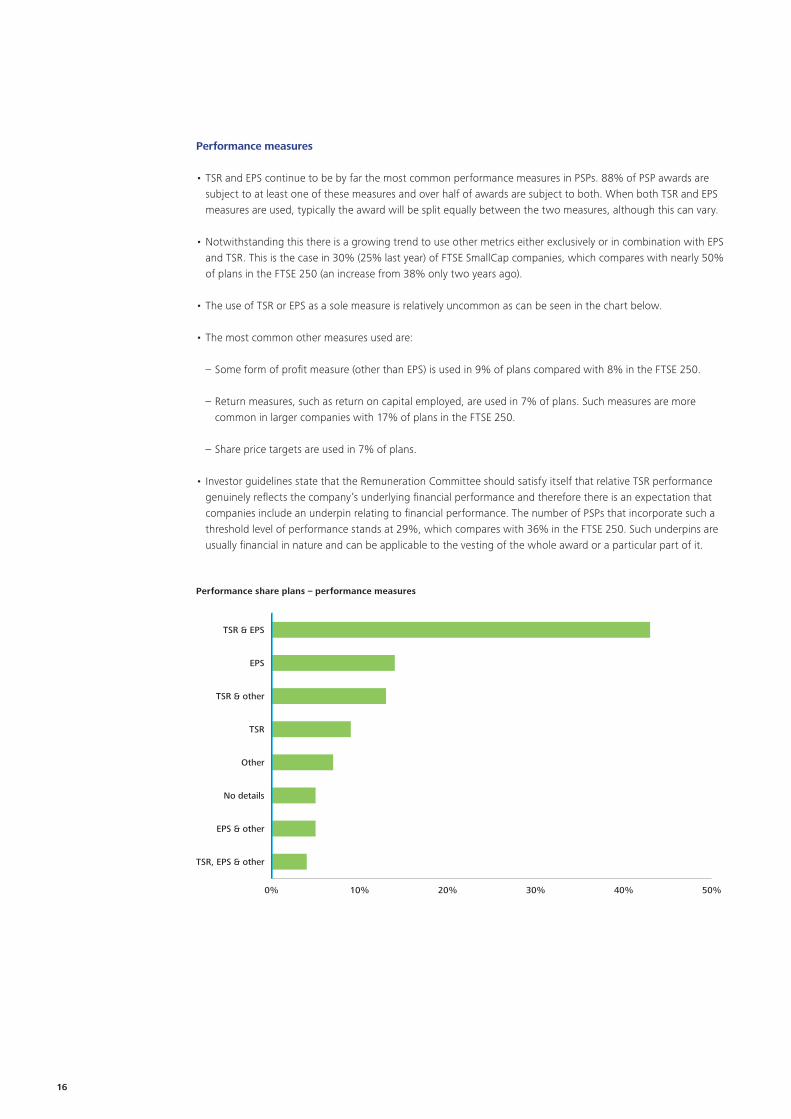
Performance measures
• TSR and EPS continue to be by far the most common performance measures in PSPs. 88% of PSP awards are subject to at least one of these measures and over half of awards are subject to both. When both TSR and EPS measures are used, typically the award will be split equally between the two measures, although this can vary.
• Notwithstanding this there is a growing trend to use other metrics either exclusively or in combination with EPS and TSR. This is the case in 30% (25% last year) of FTSE SmallCap companies, which compares with nearly 50% of plans in the FTSE 250 (an increase from 38% only two years ago).
• The use of TSR or EPS as a sole measure is relatively uncommon as can be seen in the chart below.
• The most common other measures used are:
– Some form of profit measure (other than EPS) is used in 9% of plans compared with 8% in the FTSE 250.
– Return measures, such as return on capital employed, are used in 7% of plans. Such measures are more common in larger companies with 17% of plans in the FTSE 250.
– Share price targets are used in 7% of plans.
• Investor guidelines state that the Remuneration Committee should satisfy itself that relative TSR performance genuinely reflects the company’s underlying financial performance and therefore there is an expectation that companies include an underpin relating to financial performance. The number of PSPs that incorporate such a threshold level of performance stands at 29%, which compares with 36% in the FTSE 250. Such underpins are usually financial in nature and can be applicable to the vesting of the whole award or a particular part of it.
0% 10% 20% 30% 40% 50%
TSR, EPS & other
EPS & other
No details
Other
TSR
TSR & other
EPS
TSR & EPS
Performance share plans – performance measures
16
To start a new section, hold down the apple+shift keys and click
to release this object and type the section title in the box below.
Guidance from investors and proxy voting agencies
• Award limits for the plan and the individuals must be fully disclosed and increases in opportunity must be fully explained.
• Where the share price has fallen significantly Remuneration Committees should take this into account when determining the number of shares to be awarded. To do otherwise may have a significant impact on dilution and could result in windfall gains over the performance period.
• Performance measures should be relevant, stretching and designed to promote the long-term success of the company. The performance period should be no less than three years and shareholders generally prefer longer periods. The use of additional holding periods is encouraged such that the total performance and holding period should cover at least five years.
• Performance measures and the definition of any performance measurement along with the vesting conditions should be fully explained. Retrospective disclosure of performance against targets is a minimum expectation.
• Shareholders prefer financial measures, which are linked to value creation. Targets should be challenging but realistic. Performance can incorporate a combination of absolute and relative return measures although Remuneration Committees should ensure that the vesting result does not produce outcomes that are not in line with overall company performance.
• Companies should use their discretion to ensure that outcomes are in line with the overall performance of the company, its future prospects and the experience of shareholders over the performance period.
• If targets are to be lowered this should be accompanied by a reduction in the potential award.
• Threshold vesting amounts, which should reflect expected performance, should not be significant in relation to salary. Investors will pay close attention to the absolute value as well as to the percentage of maximum, which should be no more than 25% of maximum. No vesting should occur for below threshold performance. Full vesting should only arise for exceptional performance linked to significant value creation.
• Dilution limit guidelines on the use of new issue and treasury shares in incentive plans should be complied with.
• Incentive plans should be simple to understand for participants and shareholders and, as such, the operation of multiple long-term plans should be avoided.
• Uncapped incentive plans are unlikely to be supported.
• Effective remuneration planning should make exceptional awards unnecessary.
Be equipped Directors’ remuneration in smaller companies 17
To start a new section, hold down the apple+shift keys and click
to release this object and type the section title in the box below.
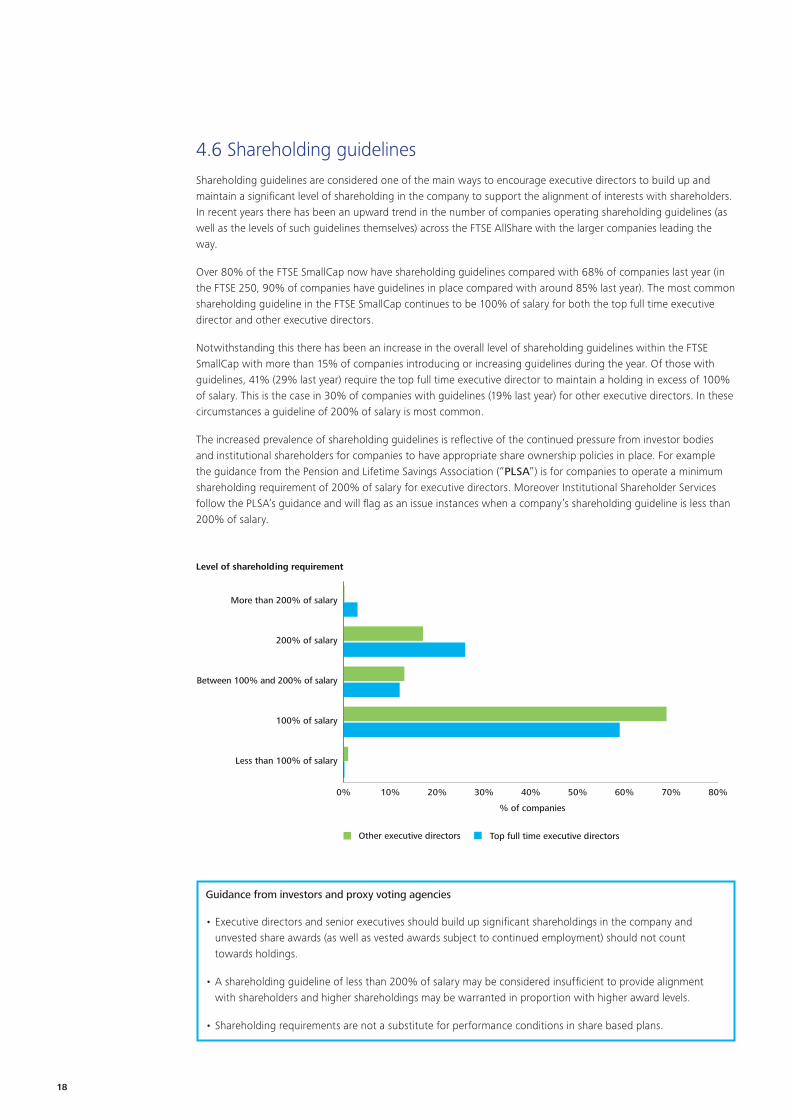
4.6 Shareholding guidelinesShareholding guidelines are considered one of the main ways to encourage executive directors to build up and maintain a significant level of shareholding in the company to support the alignment of interests with shareholders. In recent years there has been an upward trend in the number of companies operating shareholding guidelines (as well as the levels of such guidelines themselves) across the FTSE AllShare with the larger companies leading the way.
Over 80% of the FTSE SmallCap now have shareholding guidelines compared with 68% of companies last year (in the FTSE 250, 90% of companies have guidelines in place compared with around 85% last year). The most common shareholding guideline in the FTSE SmallCap continues to be 100% of salary for both the top full time executive director and other executive directors.
Notwithstanding this there has been an increase in the overall level of shareholding guidelines within the FTSE SmallCap with more than 15% of companies introducing or increasing guidelines during the year. Of those with guidelines, 41% (29% last year) require the top full time executive director to maintain a holding in excess of 100% of salary. This is the case in 30% of companies with guidelines (19% last year) for other executive directors. In these circumstances a guideline of 200% of salary is most common.
The increased prevalence of shareholding guidelines is reflective of the continued pressure from investor bodies and institutional shareholders for companies to have appropriate share ownership policies in place. For example the guidance from the Pension and Lifetime Savings Association (“PLSA”) is for companies to operate a minimum shareholding requirement of 200% of salary for executive directors. Moreover Institutional Shareholder Services follow the PLSA’s guidance and will flag as an issue instances when a company’s shareholding guideline is less than 200% of salary.
Level of shareholding requirement
0% 10% 20% 30% 40% 50% 60% 70% 80%
Less than 100% of salary
100% of salary
Between 100% and 200% of salary
200% of salary
More than 200% of salary
Other executive directors
% of companies
Top full time executive directors
Guidance from investors and proxy voting agencies
• Executive directors and senior executives should build up significant shareholdings in the company and unvested share awards (as well as vested awards subject to continued employment) should not count towards holdings.
• A shareholding guideline of less than 200% of salary may be considered insufficient to provide alignment with shareholders and higher shareholdings may be warranted in proportion with higher award levels.
• Shareholding requirements are not a substitute for performance conditions in share based plans.
18
To start a new section, hold down the apple+shift keys and click
to release this object and type the section title in the box below.
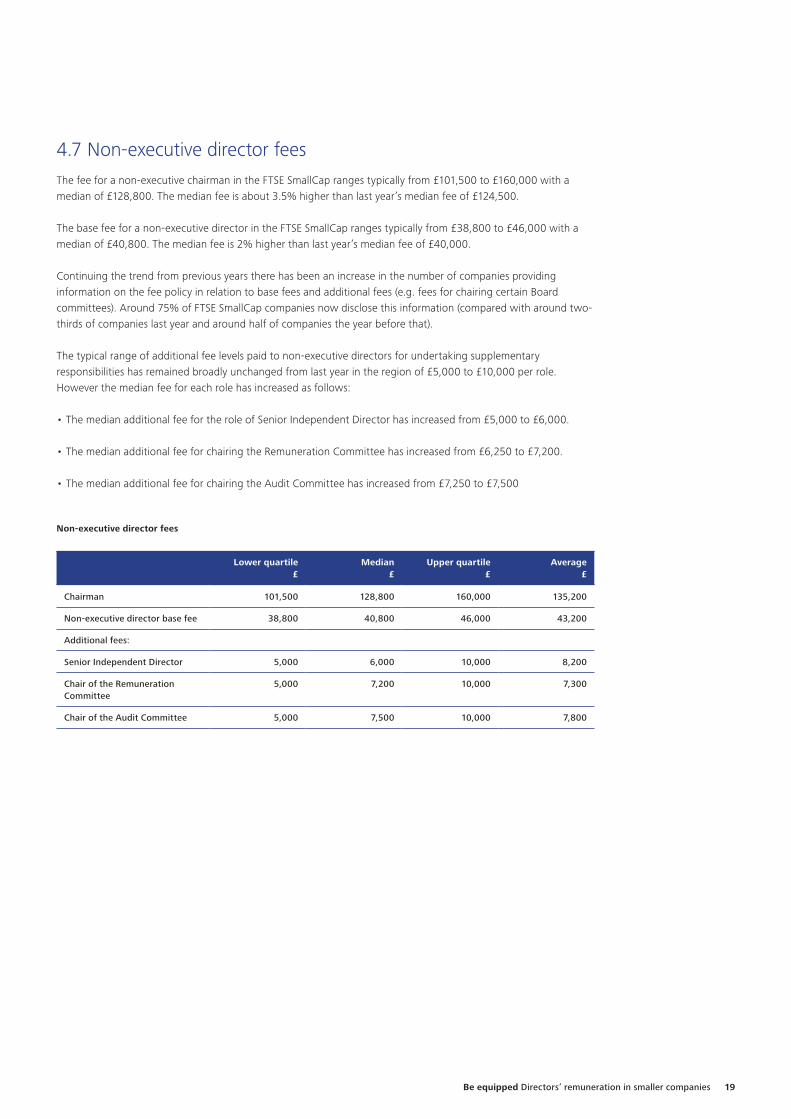
4.7 Non-executive director feesThe fee for a non-executive chairman in the FTSE SmallCap ranges typically from £101,500 to £160,000 with a median of £128,800. The median fee is about 3.5% higher than last year’s median fee of £124,500.
The base fee for a non-executive director in the FTSE SmallCap ranges typically from £38,800 to £46,000 with a median of £40,800. The median fee is 2% higher than last year’s median fee of £40,000.
Continuing the trend from previous years there has been an increase in the number of companies providing information on the fee policy in relation to base fees and additional fees (e.g. fees for chairing certain Board committees). Around 75% of FTSE SmallCap companies now disclose this information (compared with around two-thirds of companies last year and around half of companies the year before that).
The typical range of additional fee levels paid to non-executive directors for undertaking supplementary responsibilities has remained broadly unchanged from last year in the region of £5,000 to £10,000 per role. However the median fee for each role has increased as follows:
• The median additional fee for the role of Senior Independent Director has increased from £5,000 to £6,000.
• The median additional fee for chairing the Remuneration Committee has increased from £6,250 to £7,200.
• The median additional fee for chairing the Audit Committee has increased from £7,250 to £7,500
Non-executive director fees
Lower quartile£
Median£
Upper quartile £
Average £
Chairman 101,500 128,800 160,000 135,200
Non-executive director base fee 38,800 40,800 46,000 43,200
Additional fees:
Senior Independent Director 5,000 6,000 10,000 8,200
Chair of the Remuneration Committee
5,000 7,200 10,000 7,300
Chair of the Audit Committee 5,000 7,500 10,000 7,800
Be equipped Directors’ remuneration in smaller companies 19
To start a new section, hold down the apple+shift keys and click
to release this object and type the section title in the box below.
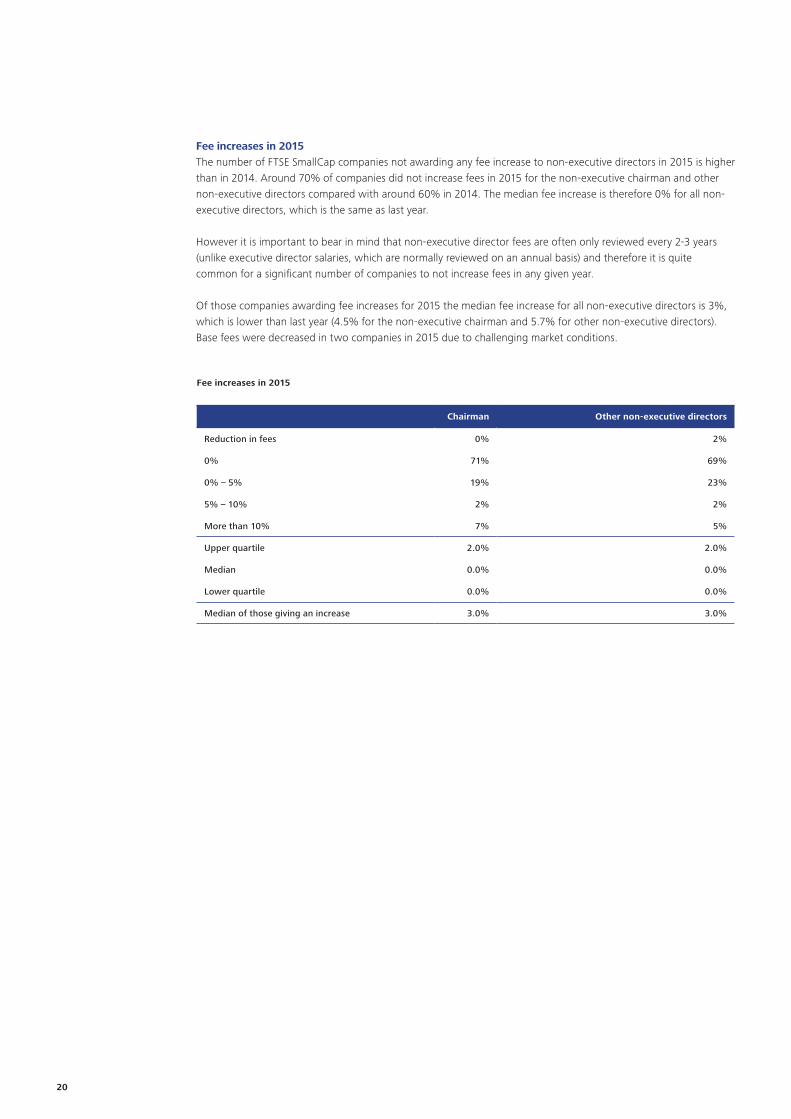
Fee increases in 2015The number of FTSE SmallCap companies not awarding any fee increase to non-executive directors in 2015 is higher than in 2014. Around 70% of companies did not increase fees in 2015 for the non-executive chairman and other non-executive directors compared with around 60% in 2014. The median fee increase is therefore 0% for all non-executive directors, which is the same as last year.
However it is important to bear in mind that non-executive director fees are often only reviewed every 2-3 years (unlike executive director salaries, which are normally reviewed on an annual basis) and therefore it is quite common for a significant number of companies to not increase fees in any given year.
Of those companies awarding fee increases for 2015 the median fee increase for all non-executive directors is 3%, which is lower than last year (4.5% for the non-executive chairman and 5.7% for other non-executive directors). Base fees were decreased in two companies in 2015 due to challenging market conditions.
Fee increases in 2015
Chairman Other non-executive directors
Reduction in fees 0% 2%
0% 71% 69%
0% – 5% 19% 23%
5% – 10% 2% 2%
More than 10% 7% 5%
Upper quartile 2.0% 2.0%
Median 0.0% 0.0%
Lower quartile 0.0% 0.0%
Median of those giving an increase 3.0% 3.0%
20
To start a new section, hold down the apple+shift keys and click
to release this object and type the section title in the box below.
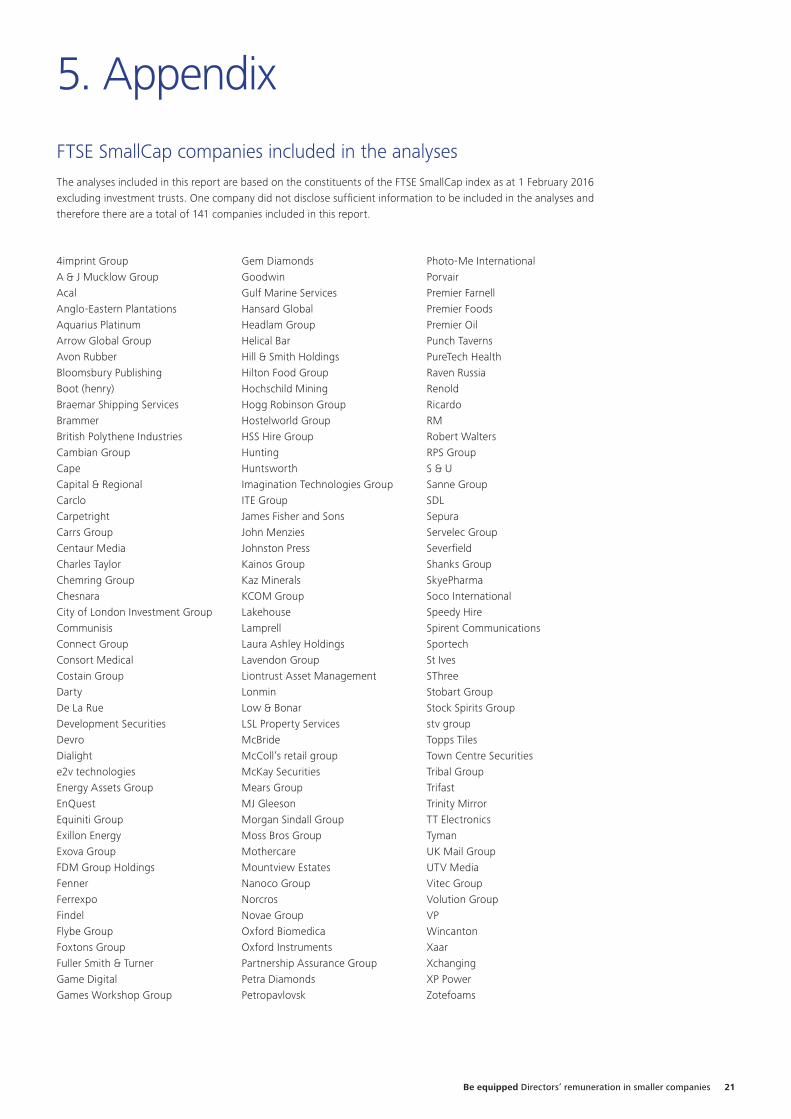
FTSE SmallCap companies included in the analysesThe analyses included in this report are based on the constituents of the FTSE SmallCap index as at 1 February 2016 excluding investment trusts. One company did not disclose sufficient information to be included in the analyses and therefore there are a total of 141 companies included in this report.
5. Appendix
4imprint GroupA & J Mucklow GroupAcalAnglo-Eastern PlantationsAquarius PlatinumArrow Global GroupAvon RubberBloomsbury PublishingBoot (henry)Braemar Shipping ServicesBrammerBritish Polythene IndustriesCambian GroupCapeCapital & RegionalCarcloCarpetrightCarrs GroupCentaur MediaCharles TaylorChemring GroupChesnaraCity of London Investment GroupCommunisisConnect GroupConsort MedicalCostain GroupDartyDe La RueDevelopment SecuritiesDevroDialighte2v technologiesEnergy Assets GroupEnQuestEquiniti GroupExillon EnergyExova GroupFDM Group HoldingsFennerFerrexpoFindelFlybe GroupFoxtons GroupFuller Smith & TurnerGame DigitalGames Workshop Group
Gem DiamondsGoodwinGulf Marine ServicesHansard GlobalHeadlam GroupHelical BarHill & Smith HoldingsHilton Food GroupHochschild MiningHogg Robinson GroupHostelworld GroupHSS Hire GroupHuntingHuntsworthImagination Technologies GroupITE GroupJames Fisher and SonsJohn MenziesJohnston PressKainos GroupKaz MineralsKCOM GroupLakehouseLamprellLaura Ashley HoldingsLavendon GroupLiontrust Asset ManagementLonminLow & BonarLSL Property ServicesMcBrideMcColl’s retail groupMcKay SecuritiesMears GroupMJ GleesonMorgan Sindall GroupMoss Bros GroupMothercareMountview EstatesNanoco GroupNorcrosNovae GroupOxford BiomedicaOxford InstrumentsPartnership Assurance GroupPetra DiamondsPetropavlovsk
Photo-Me InternationalPorvairPremier FarnellPremier FoodsPremier OilPunch TavernsPureTech HealthRaven RussiaRenoldRicardoRMRobert WaltersRPS GroupS & USanne GroupSDLSepuraServelec GroupSeverfieldShanks GroupSkyePharmaSoco InternationalSpeedy HireSpirent CommunicationsSportechSt IvesSThreeStobart GroupStock Spirits Groupstv groupTopps TilesTown Centre SecuritiesTribal GroupTrifastTrinity MirrorTT ElectronicsTymanUK Mail GroupUTV MediaVitec GroupVolution GroupVPWincantonXaarXchangingXP PowerZotefoams
Be equipped Directors’ remuneration in smaller companies 21

Deloitte refers to one or more of Deloitte Touche Tohmatsu Limited (“DTTL”), a UK private company limited by guarantee, and its network of member firms, each of which is a legally separate and independent entity. Please see www.deloitte.co.uk/about for a detailed description of the legal structure of DTTL and its member firms.
Deloitte LLP is the United Kingdom member firm of DTTL.
This publication has been written in general terms and therefore cannot be relied on to cover specific situations; application of the principles set out will depend upon the particular circumstances involved and we recommend that you obtain professional advice before acting or refraining from acting on any of the contents of this publication. Deloitte LLP would be pleased to advise readers on how to apply the principles set out in this publication to their specific circumstances. Deloitte LLP accepts no duty of care or liability for any loss occasioned to any person acting or refraining from action as a result of any material in this publication.
© 2016 Deloitte LLP. All rights reserved.
Deloitte LLP is a limited liability partnership registered in England and Wales with registered number OC303675 and its registered office at 2 New Street Square, London EC4A 3BZ, United Kingdom. Tel: +44 (0) 20 7936 3000 Fax: +44 (0) 20 7583 1198.
Designed and produced by The Creative Studio at Deloitte, London. J5365