Be a Good Steward of Our Environment - mdot.maryland.gov · working to address pollution sources...
28
209 Be a Good Steward of Our Environment TANGIBLE RESULT #9 MDOT will be accountable to customers for the wise use of resources and impacts on the environment when designing, building, operang and maintaining a transportaon system. RESULT DRIVER: Dorothy Morrison The Secretary’s Office (TSO)
Transcript of Be a Good Steward of Our Environment - mdot.maryland.gov · working to address pollution sources...

209
Be a Good Steward of Our Environment
TANGIBLE RESULT #9
MDOT will be accountable to customers for the wise use of resources and impacts on the environment when designing, building, operating and maintaining a transportation system.
RESULT DRIVER:
Dorothy Morrison The Secretary’s Office (TSO)

210
Be a Good Steward of Our Environment
PERFORMANCE MEASURE 9.1ABay Restoration Program SpendingThe Chesapeake Bay has been referred to as “Maryland’s National Treasure.” It provides countless environmental, social, and economic benefits for the citizens of our State. For decades, water quality in the Bay has been impaired by pollution. Maryland, along with Delaware, New York, Pennsylvania, Virginia, West Virginia, and the District of Columbia, is working to address pollution sources entering the Bay.
Along with the impervious surface restoration efforts that are required by the National Pollutant Discharge Elimination System (NPDES) Municipal Separate Storm Sewer System (MS4) permit, MDOT contributes annually to statewide Chesapeake Bay restoration activities. Since 2011, total spending has been tracked statewide based on 10 restoration categories: land preservation, septic systems, wastewater treatment, urban stormwater, agricultural best management practices (BMPs), oyster restoration, transit and sustainable transportation alternatives, living resources, education and research, and other. This information is shared annually within the Governor’s Fiscal Year Budget Highlights document. Historically, MDOT contributions have been incorrectly categorized as transit and sustainable transportation alternatives, which diminished our involvement in urban stormwater, living resources, and other restoration categories. This measure will help quantify our relative contribution to Bay restoration and will improve reporting at a State level.
TANGIBLE RESULT DRIVER:Dorothy Morrison The Secretary’s Office (TSO)
PERFORMANCE MEASURE DRIVER:Sandy Hertz The Secretary’s Office (TSO)
PURPOSE OF MEASURE:To better communicate MDOT’s contribution toward Chesapeake Bay Restoration efforts and improve reporting at the State level.
FREQUENCY:Semi-Annually
DATA COLLECTION METHODOLOGY:MDOT TBUs track Bay Restoration project expenditures to be incorporated into Appendix S of the Governor’s Annual Budget Book.
NATIONAL BENCHMARK:N/A

211
Be a Good Steward of Our Environment
PERFORMANCE MEASURE 9.1ABay Restoration Program Spending
Chart 9.1A.1: Bay Restoration Program Spending FY2011-FY2018
$140 $177 $180 $172
$338
$230
$299 $340
$534 $589
$732 $719
$871
$990
$796
26%30%
25%24%
39%
23%
38%
0%
10%
20%
30%
40%
50%
60%
70%
80%
90%
100%
$-
$100
$200
$300
$400
$500
$600
$700
$800
$900
$1,000
FY2011 FY2012 FY2013 FY2014 FY2015 FY2016 FY2017 FY2018
Perc
ent
Spen
ding
(in
mill
ions
)
Fiscal Year
Chart 9.1A.1: Bay Restoration Program Spending FY2011-FY2018
MDOT State %MDOT

212
Be a Good Steward of Our Environment
PERFORMANCE MEASURE 9.1BWater Quality Treatment to Protect and Restore the Chesapeake BayThe fastest growing source of pollution in the Chesapeake Bay is stormwater runoff. Urbanization intensifies runoff by increasing paved surfaces and decreasing areas where rainfall can seep into the ground. Stormwater runoff increases delivery of pollutants including trash, organic debris, and sediment from impervious areas to urban streams.
Restoration efforts for 20 percent of MDOT’s existing impervious surfaces will increase infiltration and reduce stormwater runoff. MDOT uses restoration practices such as installing new and upgrading existing stormwater management facilities, stream restoration, tree planting, and operations like street sweeping and inlet cleaning. This will improve conditions in urban streams, and reduce pollution in the Chesapeake Bay.
Chart 9.1B.1 compares the total sediment reduction accomplished by each TBU. Chart 9.1B.2 compares the total nitrogen and total phosphorus reduction accomplished by each TBU.
Approaching the 20 percent restoration requirements with a holistic One-MDOT strategy. This includes:
• Increased collaboration and data sharing between TBUs;
• Intelligent analysis of cost and restoration strategy to determine the most economical opportunities for impervious restoration across all MDOT; and
• Close coordination and collaboration to ensure all TBUs are adequately tracking and implementing Bay restoration projects and impervious surface treatment.
TANGIBLE RESULT DRIVER:Dorothy Morrison The Secretary’s Office (TSO)
PERFORMANCE MEASURE DRIVER:Sonal Ram State Highway Administration (SHA)
PURPOSE OF MEASURE:To evaluate the health of the Chesapeake Bay by measuring how well MDOT is achieving compliance with impervious surface restoration as required by the NPDES MS4 permit.
FREQUENCY:Annually (in October)
DATA COLLECTION METHODOLOGY:MDOT is tracking all Bay restoration projects and impervious surface treatment associated with those projects to determine overall progress toward the 20 percent goal during their five-year permit term.
NATIONAL BENCHMARK:N/A

213
Be a Good Steward of Our Environment
PERFORMANCE MEASURE 9.1BWater Quality Treatment to Protect and Restore the Chesapeake Bay
992
4,638
1,38176 0
23,850
2401,340
348 11 0
3,659
0
5,000
10,000
15,000
20,000
25,000
30,000
MAA MDTA MPA MTA MVA SHA
Poun
ds
TBU
Chart 9.1B.2: Total Nitrogen and Phosphorus Reduction Q4 CY2017-Q3 CY2018
Total Nitrogen Total Phosphorus
99,387
518,991
142,8447,706 0
2,176,734
0
500,000
1,000,000
1,500,000
2,000,000
2,500,000
MAA MDTA MPA MTA MVA SHA
Poun
ds
TBU
Chart 9.1B.3: Total Suspended Solids Reduction Q4 CY2017-Q3 CY2018
Chart 9.1B.1: Total Nitrogen and Phosphorus Reduction Q4 CY2017-Q3 CY2018
Chart 9.1B.2: Total Suspended Solids Reduction Q4 CY2017-Q3 CY2018

214
Be a Good Steward of Our Environment
PERFORMANCE MEASURE 9.1CStormwater Cleanup – Street Sweeping and Inlet CleaningStreet sweeping and inlet cleaning are operational activities performed by MAA, MPA, SHA, and MDTA. Street sweeping and inlet cleaning remove trash and other debris from roadways, ramp areas, and runways, providing for safe operation of our transportation system. In addition, these activities remove pollutants such as suspended solids (i.e., sediment), nitrogen, and phosphorous from impervious surfaces before they can enter Maryland’s rivers, streams, and the Chesapeake Bay.
Street sweeping and inlet cleaning are valuable because they are considered an alternative stormwater treatment by the Maryland Department of Environment (MDE), which allows “Impervious Surface Area Treatment” credits for these ongoing activities. These credits help MDOT meet its 20 percent restoration compliance requirement mandated by the MS4 permits.
Chart 9.1C.1: Total Dry Weight of Street Sweeping Material Collected CY2017
TANGIBLE RESULT DRIVER:Dorothy Morrison The Secretary’s Office (TSO)
PERFORMANCE MEASURE DRIVER:Mark Williams Maryland Aviation Administration (MAA)
PURPOSE OF MEASURE:To measure and track the amount of stormwater pollution reduction achieved from street sweeping and inlet cleaning operational activities
FREQUENCY:Semi-Annually (January and July)
DATA COLLECTION METHODOLOGY:Data is collected and reported manually by the TBUs
NATIONAL BENCHMARK:N/A
231
1,070
222
- - 13 -
200
400
600
800
1,000
1,200
MAA MDTA MPA MTA MVA SHA
Poun
ds (i
n th
ousa
nds)
TBU
Chart 9.1B.1: Total Dry Weight of Street Sweeping Material Collected CY2017

215
Be a Good Steward of Our Environment
PERFORMANCE MEASURE 9.1CStormwater Cleanup – Street Sweeping and Inlet Cleaning
Chart 9.1C.2: Total Nitrogen & Phosphorus Reduction CY2017
Chart 9.1C.3: Total Suspended Solids Reduction CY2017
992
4,638
1,38176 0
23,850
2401,340
348 11 0
3,659
0
5,000
10,000
15,000
20,000
25,000
30,000
MAA MDTA MPA MTA MVA SHA
Poun
ds
TBU
Chart 9.1B.2: Total Nitrogen and Phosphorus Reduction Q4 CY2017-Q3 CY2018
Total Nitrogen Total Phosphorus
99,387
518,991
142,8447,706 0
2,176,734
0
500,000
1,000,000
1,500,000
2,000,000
2,500,000
MAA MDTA MPA MTA MVA SHA
Poun
ds
TBU
Chart 9.1B.3: Total Suspended Solids Reduction Q4 CY2017-Q3 CY2018

216
TANGIBLE RESULT DRIVER:Dorothy Morrison The Secretary’s Office (TSO)
PERFORMANCE MEASURE DRIVER:Hargurpreet Singh, P.E. Motor Vehicle Administration (MVA)
PURPOSE OF MEASURE:To track the percentage of office waste diverted from the landfill or incineration through recycling.
FREQUENCY:Annually (in April)
DATA COLLECTION METHODOLOGY:Maryland Department of the Environment All State Agency Recycling (All StAR) reporting.
NATIONAL BENCHMARK:N/A
PERFORMANCE MEASURE 9.2AOffice Waste RecycledWhy this Performance Measure Matters?
Recycling helps protect the environment and reduces the amount of waste sent to landfills. It conserves resources, saves energy, reduces greenhouse gas emissions, and our carbon footprint.
And, it is the right thing to do!
Office Waste Includes:
• Commingled containers (glass, metal, and plastic);
• Glass (fluorescent light tubes, mixed glass containers);
• Metals (mixed cans, and tin/steel cans);
• Paper (corrugated cardboard, mixed paper, shredded paper and newspaper);
• Plastic (mixed plastic bottles, other plastics);
• Electronics; and
• Printer cartridges.
What is the Status of this Performance Measure?
CY RECYCLED OFFICE WASTE
2016 30%2017 26%
What is Being Done to Affect Change?
• Continuing awareness training;
• Continuing to evaluate dumpster size and frequency of trash collection services; and
• Single stream recycling.
Be a Good Steward of Our Environment

217
PERFORMANCE MEASURE 9.2AOffice Waste Recycled
Chart 9.2A.1: Percent of Office Waste Recycled by TBU CY2016-CY2017
Be a Good Steward of Our Environment
19%16%
39%
32%
9% 10%
6%
13%
29% 30%27%
25%
21%19%
30%
26%
0%
5%
10%
15%
20%
25%
30%
35%
40%
45%
CY2016 CY2017
Percen
t of W
aste
Year
Chart 9.2A.1: Percent of Office Waste Recycled by TBU CY2016‐CY2017
TSO SHA MDTA MTA MVA MAA MPA MDOT‐Wide

218
TANGIBLE RESULT DRIVER:Dorothy Morrison The Secretary’s Office (TSO)
PERFORMANCE MEASURE DRIVER:Hargurpreet Singh, P.E. Motor Vehicle Administration (MVA)
PURPOSE OF MEASURE:To track the percentage of non-office waste diverted from the landfill or incineration through recycling.
FREQUENCY:Annually (in April)
DATA COLLECTION METHODOLOGY:Maryland Department of the Environment All State Agency Recycling (All StAR) reporting.
NATIONAL BENCHMARK:N/A
PERFORMANCE MEASURE 9.2BNon-Office Waste RecycledWhy this Performance Measure Matters?
Recycling helps protect the environment. It reduces the amount of waste sent to landfills, conserve resources, saves energy, reduces greenhouse gas emissions, and our carbon footprint.
And, it is the right thing to do!
Non-Office Waste Includes:
• Lead-acid batteries (vehicle);
• Compostables (grass, leaves, brush, branches, mixed yard trimmings, food waste, and other);
• Metals (white goods - refrigerators, stoves, washing machines, dryers, water heaters, and air conditioners);
• Animal protein/solid fat;
• Tires;
• Antifreeze;
• Industrial fluids;
• Motor oil;
• Scrap automobiles; and
• Scrap metals.
What is the Status of this Performance Measure?
CY RECYCLED NON-OFFICE WASTE
2016 47%2017 53%
What is Being Done to Affect Change?
• Continuing awareness training;
• Continuing to evaluate dumpster size and frequency of trash collection services; and
• Single stream recycling.
Be a Good Steward of Our Environment

219
PERFORMANCE MEASURE 9.2BNon-Office Waste Recycled
Chart 9.2B.1: Percent of Non-Office Waste Recycled by TBU CY2016-CY2017
Be a Good Steward of Our Environment
1% 1%
56%
76%
64%
34%
59%55%
19% 16%
3%
13%
97%
72%
47%53%
0%
10%
20%
30%
40%
50%
60%
70%
80%
90%
100%
CY2016 CY2017
Percen
t of W
aste
Year
Chart 9.2B.1: Percent of Non‐Office Waste Recycled by TBU CY2016‐CY2017
TSO SHA MDTA MTA MVA MAA MPA MDOT‐Wide

220
Be a Good Steward of Our Environment
TANGIBLE RESULT DRIVER:Dorothy Morrison The Secretary’s Office (TSO)
PERFORMANCE MEASURE DRIVER:Chandra Chithaluru Maryland Port Administration (MPA)
PURPOSE OF MEASURE:To reduce TBU impact on solid waste landfill through recycling/ reuse of metal, asphalt and concrete.
FREQUENCY:Annually (in April)
DATA COLLECTION METHODOLOGY:The data collection methodology will include disposal weights (via bill of ladings) by TBUs’ Facility Maintenance and Engineering Departments. The data are reported on the annual Non-Maryland Recycling Act Report.
NATIONAL BENCHMARK:N/A
PERFORMANCE MEASURE 9.2CRecycled/Reused Materials from Maintenance Activities and Construction/ Demolition ProjectsMDOT is committed to reducing its impact on solid waste, non-hazardous landfills, potentially resulting in reduction of the number of waste disposal facilities in Maryland as stated in the Maryland Department of the Environment’s “Zero Waste” Action Plan. The TBUs established plans to recycle and/or reuse their solid waste: metal, asphalt and concrete. These materials are to be collected, weighed and recycled/reused. Benefits include saving energy and natural resources, preserving the capacity of landfills, reducing waste disposal costs, generating revenue for materials and reducing pollutants generated by the landfill process.
Due to the number and type construction/demolition activities and projects, we recognize that there may be variability among reporting periods and TBUs, but positive change can still occur by implementing some or all the following:
• Establish central data collection mechanisms and procedures in each TBU;
• Require contractors to segregate, collect, weigh and recycle these materials and provide information to each TBU; and
• Ensure commitment to this goal and its positive impact on the environment by making employees and contractors aware of this performance measure.

221
Be a Good Steward of Our Environment
PERFORMANCE MEASURE 9.2CRecycled/Reused Materials from Maintenance Activities and Construction/Demolition Projects
Chart 9.2C.1: Recycled/Reused Materials from Maintenance Activities & Construction/Demolition Projects CY2015-CY2017
5,382
18,662 16,679
28,508
59,901
25,454
0
10,000
20,000
30,000
40,000
50,000
60,000
70,000
80,000
90,000
CY2015 CY2016 CY2017
Tons
Year
Chart 9.2C.2: Recycled/Reused Materials from Maintenance Activities & Construction/Demolition Projects CY2015‐CY2017
Metals Concrete
Chart 9.2C.2: Recycled/Reused Materials from Maintenance Activities & Construction/Demolition Projects CY2015-CY2017
370,590
479,089 505,456
0
100,000
200,000
300,000
400,000
500,000
600,000
CY2015 CY2016 CY2017
Tons
Year
Chart 9.2C.1: Recycled/Reused Materials from Maintenance Activities & Construction/Demolition Projects CY2015‐CY2017
Asphalt

222
Be a Good Steward of Our Environment
TANGIBLE RESULT DRIVER:Dorthy Morrison The Secretary’s Office (TSO)
PERFORMANCE MEASURE DRIVER:Robert Frazier Maryland Transit Administration (MTA)
PURPOSE OF MEASURE:To determine the positive impact MDOT has on the statewide litter problem and the cost associated with the collection efforts.
FREQUENCY:Semi-Annually (April and October)
DATA COLLECTION METHODOLOGY:Data collection methodology will be limited to polling of the TBUs that gather data from various sources.
NATIONAL BENCHMARK:N/A
PERFORMANCE MEASURE 9.2DLitter PickupLitter has been a persistent problem world-wide. MDOT is focusing on litter across its transportation system. Litter has multiple effects not only on the cleanliness of transportation routes and transportation equipment, but public perception of the system and the environment as well.
Litter, an environmental pollutant, has a visible macro effect clogging stormwater conveyances and streams, and wildlife ingests undigestible litter. Unseen micro effects are caused by leached chemicals from litter into the environment. The most recent litter-caused environmental issue is the creation of nano-plastic which is ingested at the smallest level of the food chain and accumulates up through the chain.
Each MDOT TBU has differing litter issues and methods to manage litter. While all the TBUs have facilities that accumulate litter from internal sources, such as open dumpsters or overfull trash receptacles, wind blown litter contributes to the accumulation. SHA addresses roadside litter with internal forces, correctional personnel, and Adopt a Highway efforts. MPA manages a “trash wheel” helping to clean up the Baltimore inner harbor waterway. MAA must keep litter from the runways so that aircraft are not damaged. MDTA and MTA remove litter from tunnels.

223
Be a Good Steward of Our Environment
PERFORMANCE MEASURE 9.2DLitter Pickup
Chart 9.2D.1: Litter Pickup Weight and Cost Q2-Q3 CY2018
Pounds Cost Pounds CostQ2 CY2018 Q3 CY2018
SHA 739,062 $2,400,000 673,181 $1,800,000MVA 1,620 $3,976 1,620 $3,976MTA 331,020 $555,087 257,820 $601,810MPA 21,000 $3,600 25,381 $3,600MDTA 5,649 $14,348 10,969 $27,861MAA 17,024 $61,115 21,049 $61,592
-
500,000
1,000,000
1,500,000
2,000,000
2,500,000
3,000,000
3,500,000
Wei
ght (
lbs.
) & C
ost (
$)
Chart 9.2D.1: Litter Pickup Weight and Cost Q2-Q3 CY2018

224
PERFORMANCE MEASURE 9.3AFuel Efficiency: Miles Per GallonReduced fuel costs and conservation of petroleum-based resources are the direct results of a more fuel-efficient fleet (as determined through increases in vehicle miles per gallon [MPG] calculations). Efforts with Mansfield Oil Company (statewide fueling vendor) have resulted in developing a means of tracking MPG data for our light-duty fleet throughout all TBUs. MPG data for CY2015 thru CY2017 has been calculated and presented on Chart 9.3A.1. In the three years of data presented, MDOT’s fuel efficiency has increased by 1.0 MPG from 2015 (16.9 MPG) to 2017 (17.9 MPG). Vehicle replacement practices represent the largest factor affecting change to this measure. At pre-determined age or mileage thresholds, our fleet vehicles are replaced. Since the presumption is that newer models are more fuel efficient than their predecessors, MPG calculations for each TBU and the Agency as a whole should increase from year-to-year through fleet replacement. However, in addition to fleet replacement, strategies such as encouraging carpooling to meetings and other functions and modifying State vehicle purchasing contract requirements are being evaluated as additional means of improving fleet MPG.
Be a Good Steward of Our Environment
TANGIBLE RESULT DRIVER:Dorothy Morrison The Secretary’s Office (TSO)
PERFORMANCE MEASURE DRIVER:Paul Truntich, Jr. Maryland Transportation Authority (MDTA)
PURPOSE OF MEASURE:To track overall fuel economy of fleet vehicles and ensure better air quality through the use of State vehicles. It is important to track MPG in a meaningful manner to ensure that State vehicles are fuel efficient and not detrimental to our State air quality. Fuel economy data will be used to evaluate driving patterns as well as when the procurement of new fleet vehicles is considered.
FREQUENCY:Annually (in April)
DATA COLLECTION METHODOLOGY:Fleet MPG data will be obtained from the State of Maryland’s fuel service vendor.
NATIONAL BENCHMARK:N/A

225
PERFORMANCE MEASURE 9.3AFuel Efficiency: Miles Per Gallon
Chart 9.3A.1: MDOT TBU Light-Duty Vehicle Average MPG CY2015-CY2017
Be a Good Steward of Our Environment
26.6
25.5
17.3
13.3
11.5 13
.4
10.9
16.9
27.7
26.0
17.1
13.6
12.8 13.5
11.3
17.4
28.2
26.9
17.8
14.1
12.9 13.8
11.5
17.9
0.0
5.0
10.0
15.0
20.0
25.0
30.0
MVA TSO SHA MTA MPA MDTA MAA MDOT
Miles P
er Gallon
TBU
Chart 9.3A.1: MDOT TBU Light‐Duty Vehicle Average MPG CY2015‐CY2017
2015 2016 2017
226
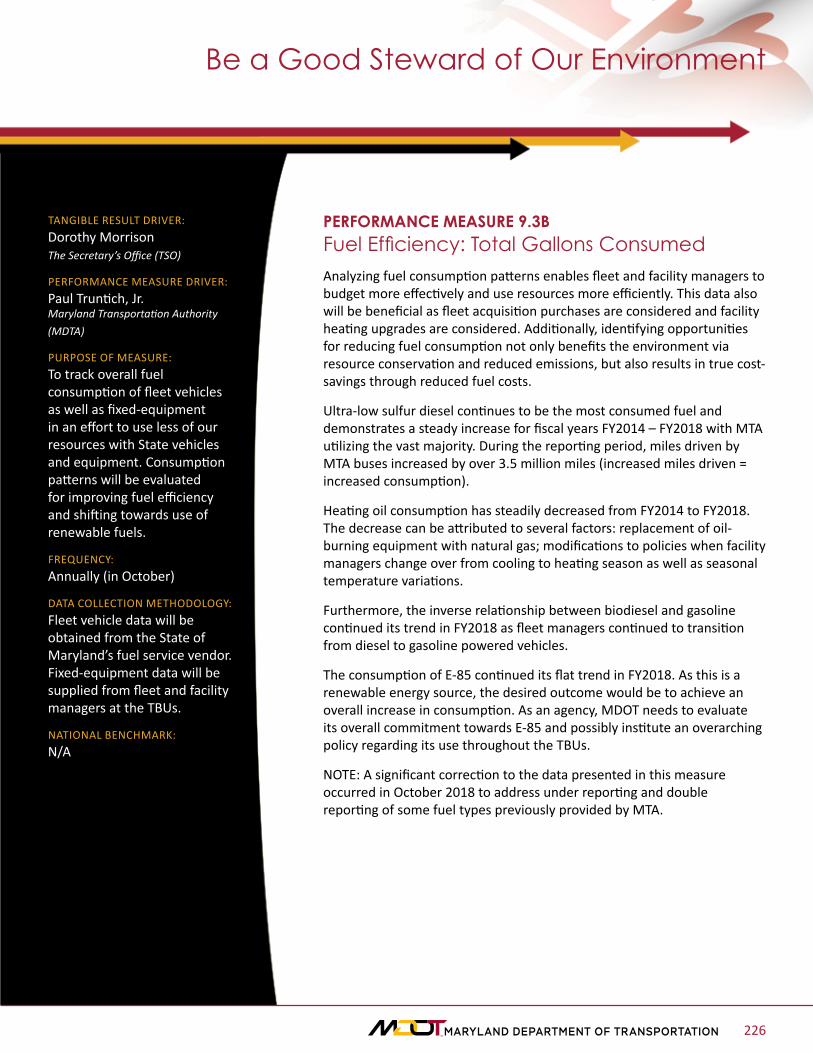
PERFORMANCE MEASURE 9.3BFuel Efficiency: Total Gallons ConsumedAnalyzing fuel consumption patterns enables fleet and facility managers to budget more effectively and use resources more efficiently. This data also will be beneficial as fleet acquisition purchases are considered and facility heating upgrades are considered. Additionally, identifying opportunities for reducing fuel consumption not only benefits the environment via resource conservation and reduced emissions, but also results in true cost-savings through reduced fuel costs.
Ultra-low sulfur diesel continues to be the most consumed fuel and demonstrates a steady increase for fiscal years FY2014 – FY2018 with MTA utilizing the vast majority. During the reporting period, miles driven by MTA buses increased by over 3.5 million miles (increased miles driven = increased consumption).
Heating oil consumption has steadily decreased from FY2014 to FY2018. The decrease can be attributed to several factors: replacement of oil-burning equipment with natural gas; modifications to policies when facility managers change over from cooling to heating season as well as seasonal temperature variations.
Furthermore, the inverse relationship between biodiesel and gasoline continued its trend in FY2018 as fleet managers continued to transition from diesel to gasoline powered vehicles.
The consumption of E-85 continued its flat trend in FY2018. As this is a renewable energy source, the desired outcome would be to achieve an overall increase in consumption. As an agency, MDOT needs to evaluate its overall commitment towards E-85 and possibly institute an overarching policy regarding its use throughout the TBUs.
NOTE: A significant correction to the data presented in this measure occurred in October 2018 to address under reporting and double reporting of some fuel types previously provided by MTA.
Be a Good Steward of Our Environment
TANGIBLE RESULT DRIVER:Dorothy Morrison The Secretary’s Office (TSO)
PERFORMANCE MEASURE DRIVER:Paul Truntich, Jr. Maryland Transportation Authority (MDTA)
PURPOSE OF MEASURE:To track overall fuel consumption of fleet vehicles as well as fixed-equipment in an effort to use less of our resources with State vehicles and equipment. Consumption patterns will be evaluated for improving fuel efficiency and shifting towards use of renewable fuels.
FREQUENCY:Annually (in October)
DATA COLLECTION METHODOLOGY:Fleet vehicle data will be obtained from the State of Maryland’s fuel service vendor. Fixed-equipment data will be supplied from fleet and facility managers at the TBUs.
NATIONAL BENCHMARK:N/A

227
PERFORMANCE MEASURE 9.3BFuel Efficiency: Total Gallons Consumed
Chart 9.3B.1: Total Gallons of Fuel Consumed FY2014-FY2018
Be a Good Steward of Our Environment
Biodiesel Ultra-Low SulfurDiesel Gasoline E-85 Heating Oil
FY 2014 2,136,296 8,938,557 2,237,431 46,725 2,011,236FY 2015 1,947,374 9,078,235 2,377,930 47,025 1,785,087FY 2016 1,577,631 9,789,665 2,628,437 38,745 1,490,472FY 2017 1,440,903 9,963,079 2,614,529 28,994 782,620FY 2018 1,524,695 10,338,386 2,759,007 37,664 714,015
0
2,000,000
4,000,000
6,000,000
8,000,000
10,000,000
12,000,000
Gallo
ns
Chart 9.3B.1: Total Gallons of Fuel Consumed FY2014-FY2018
228
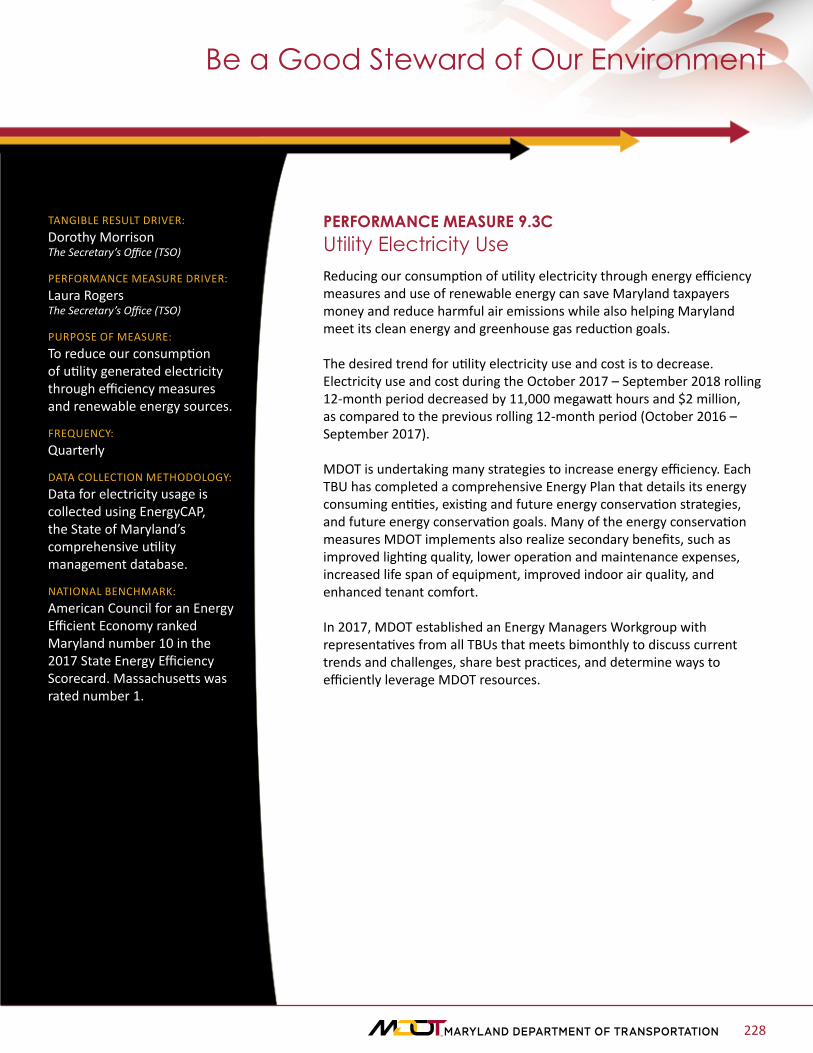
PERFORMANCE MEASURE 9.3CUtility Electricity Use Reducing our consumption of utility electricity through energy efficiency measures and use of renewable energy can save Maryland taxpayers money and reduce harmful air emissions while also helping Maryland meet its clean energy and greenhouse gas reduction goals.
The desired trend for utility electricity use and cost is to decrease. Electricity use and cost during the October 2017 – September 2018 rolling 12-month period decreased by 11,000 megawatt hours and $2 million, as compared to the previous rolling 12-month period (October 2016 – September 2017).
MDOT is undertaking many strategies to increase energy efficiency. Each TBU has completed a comprehensive Energy Plan that details its energy consuming entities, existing and future energy conservation strategies, and future energy conservation goals. Many of the energy conservation measures MDOT implements also realize secondary benefits, such as improved lighting quality, lower operation and maintenance expenses, increased life span of equipment, improved indoor air quality, and enhanced tenant comfort.
In 2017, MDOT established an Energy Managers Workgroup with representatives from all TBUs that meets bimonthly to discuss current trends and challenges, share best practices, and determine ways to efficiently leverage MDOT resources.
Be a Good Steward of Our Environment
TANGIBLE RESULT DRIVER:Dorothy Morrison The Secretary’s Office (TSO)
PERFORMANCE MEASURE DRIVER:Laura Rogers The Secretary’s Office (TSO)
PURPOSE OF MEASURE:To reduce our consumption of utility generated electricity through efficiency measures and renewable energy sources.
FREQUENCY:Quarterly
DATA COLLECTION METHODOLOGY:Data for electricity usage is collected using EnergyCAP, the State of Maryland’s comprehensive utility management database.
NATIONAL BENCHMARK:American Council for an Energy Efficient Economy ranked Maryland number 10 in the 2017 State Energy Efficiency Scorecard. Massachusetts was rated number 1.

229
PERFORMANCE MEASURE 9.3CUtility Electricity Use
Chart 9.3C.1: Total MDOT Utility Electricity Use and Cost Q4 CY2013-Q3 CY2018 (Rolling 12-Month)
Be a Good Steward of Our Environment
394 395
384
376
365
$41
$42
$40
$37
$35
$30
$32
$34
$36
$38
$40
$42
$44
350
355
360
365
370
375
380
385
390
395
400
Oct '13-Sep '14 Oct '14-Sep '15 Oct '15-Sep '16 Oct '16-Sep '17 Oct '17-Sep '18
Cost
(in
mill
ions
)
Meg
awat
t Hou
rs (i
n th
ousa
nds)
Time Period
Chart 9.3C.1: Total MDOT Utility Electricity Use and Cost Q4 CY2013-Q3 CY2018 (Rolling 12-Month)
Electricity Use Cost

230
PERFORMANCE MEASURE 9.3DRenewable Energy GenerationReducing our conventional energy consumption through energy efficiency measures and use of renewable energy can generate revenue, save Maryland taxpayers money, and reduce harmful air emissions while also helping Maryland meet its clean energy and greenhouse gas reduction goals.
The desired trend for renewable energy generation and cost avoidance is to increase. Renewable energy generation and cost avoidance during the January 2018 – December 2018 rolling 12-month period decreased by 369 megawatt hours and $41,000 as compared to the previous rolling 12-month period (January 2017 – December 2017). The decrease was due to the significant amount of rain Maryland received during the summer and fall of 2018.
MDOT released a Renewable Energy Development Request for Proposal on June 20, 2017 and received proposals on August 17, 2017. MDOT recommended award to six master contractors. The Board of Public Works approved the project on February 7, 2018. MDOT is evaluating ~35 locations throughout the State for development under Phase I of the project.
Be a Good Steward of Our Environment
TANGIBLE RESULT DRIVER:Dorothy Morrison The Secretary’s Office (TSO)
PERFORMANCE MEASURE DRIVER:Laura Rogers The Secretary’s Office (TSO)
PURPOSE OF MEASURE:To reduce our consumption of utility electricity through use of renewable energy sources.
FREQUENCY:Quarterly
DATA COLLECTION METHODOLOGY:Data for renewable energy sources collected from Pepco Energy Services ABB Plant Portfolio Manager and from TBU Energy Managers.
NATIONAL BENCHMARK:Renewable Energy Consumption as a share of state total (2014): Oregon, 49.3 percent; Washington, 47.1 percent; Maine, 38.3 percent

231
PERFORMANCE MEASURE 9.3DRenewable Energy Generation
Chart 9.3D.1: Total MDOT Renewable Energy Generation and Cost Savings Q1 CY2014-Q4 CY2018 (Rolling 12-Month)
Be a Good Steward of Our Environment
1,719
1,648
1,835
1,944
1,670 $188
$180
$198
$210
$181
$165
$170
$175
$180
$185
$190
$195
$200
$205
$210
$215
1,500
1,550
1,600
1,650
1,700
1,750
1,800
1,850
1,900
1,950
2,000
Jan '14-Dec '14 Jan '15-Dec '15 Jan '16-Dec '16 Jan '17-Dec '17 Jan '18-Dec '18
Cost
Sav
ings
(in
thou
sand
s)
Meg
awat
t Hou
rs
Time Period
Chart 9.3D.1: Total MDOT Renewable Energy Generation and Cost Savings Q1 CY2014-Q4 CY2018 (Rolling 12-Month)
Renewable Energy Generation Cost Savings

232
PERFORMANCE MEASURE 9.4APublicly Available Electric Vehicle Charging Infrastructure & Total Electric Vehicles Registered in MarylandThe widespread introduction of Electric Vehicles (EVs) into the light-duty fleet can have significant benefits, including the reduction of fossil fuel consumption, resulting in decreased emissions of greenhouse gases (GHG) and other harmful air pollutants. Vehicle technology improvements, including EV technology, will be critical to reducing air pollution in Maryland and helping the State meet its environmental goals.
While the State has made significant progress in the past several years, our goals have been some of the most ambitious in the country from the beginning: 60,000 EVs by 2020, approximately 300,000 by 2025 (6.1 percent of fleet), and the infrastructure to support these numbers.
The number of EVs registered in Maryland has increased by almost 12 percent since the previous quarter to over 16,000 EVs. Also, over the past two years (Q4 CY2016 – Q4 CY2018), the number of EVs registered in Maryland has almost doubled (91 percent increase).
The number of EV charging outlets in Maryland has increased by over 9 percent since the previous quarter to almost 1,600 outlets. Also, over the past three years (Q4 CY2015 – Q4 CY2018), the number of EV charging outlets in Maryland has increased by over 40 percent including a 120 percent increase in the number of DC fast charging outlets publicly available.
TANGIBLE RESULT DRIVER:Dorothy Morrison The Secretary’s Office (TSO)
PERFORMANCE MEASURE DRIVER:Colleen Turner The Secretary’s Office (TSO)
PURPOSE OF MEASURE:To increase EV adoption throughout the State of Maryland.
FREQUENCY:Quarterly
DATA COLLECTION METHODOLOGY:EVSE data will be collected from the National Renewable Energy Laboratory Alternative Fueling Station Locator quarterly.
EV registration data will be collected monthly from MVA.
NATIONAL BENCHMARK:California, 1.5 million zero-emission vehicles (ZEVs) by 2025 (4.2 percent of fleet)
New York, 10,000 charging stations by 2021, 800,000 EVs by 2025 (6.1 percent of fleet)
Be a Good Steward of Our Environment

233
PERFORMANCE MEASURE 9.4APublicly Available Electric Vehicle Charging Infrastructure & Total Electric Vehicles Registered in Maryland
Chart 9.4A.1: Electric Vehicles Registered in Maryland Q2 CY2016-Q4 CY2018
Be a Good Steward of Our Environment
Chart 9.4A.2: Electric Vehicle Charging Outlets Q1 CY2015-Q4 CY2018
2,395 2,761 3,126 3,433 3,745 4,119 4,568 5,032 5,495 6,543
8,129 4,079 4,679
5,279 5,487 5,624 5,700 5,787
6,750 7,712
7,873
7,964
-
2,000
4,000
6,000
8,000
10,000
12,000
14,000
16,000
18,000
Q2 Q3 Q4 Q1 Q2 Q3 Q4 Q1 Q2 Q3 Q4
CY2016 CY2017 CY2018
Num
ber o
f Reg
ister
ed E
vs
Quarter/Year
Chart 9.4A.1: Electric Vehicles Registered in Maryland Q2 CY2016-Q4 CY2018
Electric PHEV
64 64 64 64 64 64 64 64 64 64 64 64 64 64 64 57
877 884 895 933 985 1,004 1,017 1,049 1,058 1,059 1,094 1,111 1,132 1,150 1,179 1,272
118 118 118 118 121 122 125 141 146 146 148 154 154 154
216
263
-
200
400
600
800
1,000
1,200
1,400
1,600
1,800
Q1 Q2 Q3 Q4 Q1 Q2 Q3 Q4 Q1 Q2 Q3 Q4 Q1 Q2 Q3 Q4
CY2015 CY2016 CY2017 CY2018
Num
ber o
f EV
Char
ging
Out
lets
Quarter/Year
Chart 9.4A.2: Electric Vehicle Charging Outlets Q1 CY2015-Q4 CY2018
EV Level 1 Outlets EV Level 2 Outlets DC Fast Outlets

234
Be a Good Steward of Our Environment
PERFORMANCE MEASURE 9.4BAir Quality EmissionsMaryland has made substantial progress in combating air pollution and greenhouse gas (GHG) emissions, with transportation policies and investments playing a key role in these improvements. MDOT is committed to improving air quality and reducing GHG emissions by reducing energy use through more efficient vehicles and building materials, as well as switching to cleaner fuels and renewable energy.
The desired trend for emissions from utility electricity is to decrease. CO2 emissions during the October 2017 – September 2018 rolling 12-month period decreased by almost 7,000 metric tons (nearly 3 percent) as compared to the previous rolling 12-month period (October 2016 – September 2017). Over the past five 12-month periods, CO2 emissions have decreased by about 18,000 metric tons.
TANGIBLE RESULT DRIVER:Dorothy Morrison The Secretary’s Office (TSO)
PERFORMANCE MEASURE DRIVER:Colleen Turner The Secretary’s Office (TSO)
PURPOSE OF MEASURE:To reduce our emissions through efficiency measures and renewable energy sources.
FREQUENCY:Quarterly
DATA COLLECTION METHODOLOGY:Data for electricity usage is collected using EnergyCAP, the State of Maryland’s comprehensive utility management database. Fleet vehicle data is obtained from the State of Maryland’s fuel service vendor. Fixed-equipment data is supplied from fleet and facility managers at the TBUs.
NATIONAL BENCHMARK:Washington D.C., reduce GHG emissions from 2006 levels 50 percent by 2032, 80 percent by 2050
New York, reduce GHG emissions from 1990 levels 40 percent by 2030, 80 percent by 2050
California, reduce GHG emissions from 1990 levels 80 percent by 2050

235
PERFORMANCE MEASURE 9.4BAir Quality Emissions
Chart 9.4B.1: CO2 Emissions per Year by Fuel Type FY2014-FY2018
Be a Good Steward of Our Environment
17 16 13 12 12
93 92 99 101 105
19 20 23 22
24 24 21
18 9 8
Total: 153.3 Total: 149.6 Total: 152.8 Total: 144.8 Total: 149.7
-
20
40
60
80
100
120
140
160
180
FY2014 FY2015 FY2016 FY2017 FY2018
Met
ric T
ons C
O2
(in th
ousa
nds)
Fiscal Year
Chart 9.4B.1: CO2 Emissions per Year by Fuel Type FY2014-FY2018
Biodiesel Ultra-Low Sulfur Diesel Gasoline E-85 Heating Oil Total

236
PERFORMANCE MEASURE 9.4BAir Quality Emissions
Chart 9.4B.2: CO2e Emissions from MDOT Electricity Use Q3 CY2013-Q3 CY2018 (Rolling 12-Month)
Be a Good Steward of Our Environment
242.76 242.94
236.65
231.28
224.49
215.00
220.00
225.00
230.00
235.00
240.00
245.00
Oct '13-Sep '14 Oct '14-Sep '15 Oct '15-Sep '16 Oct '16-Sep '17 Oct '17-Sep '18
Met
ric T
ons C
O2e
(per
thou
sand
)
Time Period
Chart 9.4B.2: CO2e Emissions from MDOT Electricity Use Q3 CY2013-Q3 CY2018 (Rolling 12-Month)