BDO, The Annual Survey of Football Finance Directors (2014)
40
focusing on the polarisation of football finances and the impact of ffp the annual survey of football club finance directors 2014
-
Upload
tifoso-bilanciato -
Category
Documents
-
view
231 -
download
0
description
BDO, The Annual Survey of Football Finance Directors (2014)
Transcript of BDO, The Annual Survey of Football Finance Directors (2014)

focusing on the polarisation of football finances and the impact of ffpthe annual survey of football club finance directors 2014

CONTENTSEXECUTIVE SUMMARY 2
METHODOLOGY 3
ANALYSIS OF KEY FINDINGS 4
BDO PROFESSIONAL SPORTS GROUP 32

The top six or seven clubs in the English Premier League will be able to consolidate their superiority whilst the rest of the league are in a relegation battle.
Similarly, the impact of high parachute payments and FFP may have the same polarising effect in the Football League Championship as we see in the Premier League.
However, the number of clubs reporting an interest from third party investors has increased from 21% last year to 29% this year, with the Football League Championship and Football League 1 clubs having had the most approaches (41% and 43% respectively).
Financial performance is improving, and there is still demand for football clubs, though the preference still seems to focus on taking on Football League clubs and investing in seeking promotion to the English Premier League rather than investing in a English Premier League club. Possible reasons for this might be the combination of the lower initial capital outlay, the revenue gap and the application of FFP rules preventing investors from buying success.
We would like to thank all our contributors for taking the time to participate and wish every club a prosperous season ahead. For every completed survey we have made a donation to the PFA Benevolent Fund.
CHARLES BARNETT, TREVOR BIRCH and IAN CLAYDEN.
In many areas we continue to see divergence between the English Premier League and the Football Leagues and, at the same time, increased polarisations within the English Premier League and within the Football League Championship:
• 94% of respondents believe the gap between larger and smaller clubs is widening; 79% of English Premier League (EPL) respondents and 76% of Football League Championship (FLC) respondents see the gap within their own league widening
• economic recovery has had an overall positive impact across all revenue streams for English Premier League clubs whereas Championship clubs have experienced an overall negative impact across all revenue streams
• there is a wide variation in confidence levels between leagues – ranging from the English Premier League and Scottish Premiership (SP), where 86% and 83% of respondents respectively are expecting to make a profit (before player trading), to the Football League where 35% of Football League Championship, 21% of Football League 1 (FL1) and 19% of Football League 2 (FL2) expect to make a profit
• 79% of English Premier League clubs are seeing sponsorship revenues increasing whereas in all other leagues the majority of clubs are either seeing decreasing sponsorship revenues or no change.
As this disparity widens, are we seeing other factors, such as enhanced TV revenues, increased parachute payments, Financial Fair
Play (in its many guises) and globalisation, effectively locking-in this differential?
• loss of income through relegation is the primary concern for English Premier League clubs whereas the other leagues are more concerned with inflexible player salaries (presumably impacting on their ability to invest in search of promotion), attendances and their ability to attract sponsorship revenues
• 90% of respondents say they have complied with Financial Fair Play (FFP) requirements, and the Scottish clubs believe the Scottish Premiership should adopt something similar.
However, is an unexpected consequence of improved financial security/performance that owner investment is being stifled?
• 21% of English Premier League respondents believe that their owners are considering a full or partial exit in the next 12-18 months compared with none in 2013
• 57% of English Premier League and almost half (47%) of Football League Championship respondents would be prepared to invest more were it not for FFP
• where clubs are expecting to reduce or hold constant playing squad payroll costs in the next season, 43% of Football League 1 respondents’ and 35% of Football League Championship respondents’ decisions have been influenced by FFP to some or a considerable extent.
FOREWORD

FD FOOTBALL SURVEY | 201402
EXECUTIVE SUMMARY
financing the club
• For the third year running, a third of respondents consider their club’s current financial position to be very healthy; 42% say that their situation could be better but is not bad while 25% of respondents’ finances need attention or are a cause for grave concern
• While more than eight out of ten (84%) respondents deny that owners are considering an exit, 21% of EPL respondents believe that their owners are considering a full or partial exit in the next 12-18 months compared with none in 2013
• 29% of clubs have been approached in the last 12 months by external parties with a view to taking an equity stake – up from 21% in 2013. The FLC and FL1 clubs have had the most approaches (41% and 43% respectively).
club revenue and profitability trends
• 40% of respondents expect to make a profit after player trading and amortisation compared with just 29% in 2013.
• There is an overall increase in confidence this year with 43% of respondents expecting to the make a profit before player trading and amortisation in their next accounting period – up from 36% in 2013
• There is clear evidence that the resurgence of the UK economy over the last 12 months has had a positive impact on all revenue streams. The EPL is the biggest beneficiary of this improvement. However, for all revenue streams investigated, the majority of FLC respondents have seen a decline rather than no movement or an increase.
• Finance directors are cautiously optimistic that a strengthening economy will positively affect revenue streams in the forthcoming 2014/15 season
• Almost half (49%) of respondents are using the wages to turnover ratio as a KPI of their club’s financial health this year – up slightly from 44% in 2013.
club operations
• The two top concerns of football finance directors are the same as in previous years - the loss of income if the club is relegated and the inflexibility of players’ salaries – albeit the order has changed from 2013
• More than six out of ten (61%) of respondents think that the wealth gap in their division is widening with the gap being most evident in the EPL and FLC clubs (79% and 76% respectively)
• Confidence among respondents that their tax position on payments to players was robust and defendable to HMRC rose slightly from 77% in 2013 to 82%
• The percentage of respondents who were late making their tax payments fell to 13% from 20% in 2013.
financial fair play
• There were high levels of compliance this year – 90% - with the requirements of the financial fair play and cost control and sustainability rules (collectively FFP) during the season. All respondents will comply in 2014/15 – up from 85% in 2013 with only 9% needing to make significant changes to achieve compliance.
• Only 38% agree that FFP regulations meet their principal objective of promoting sustainability but a further 46% say they are a step in the right direction.
player costs, transfers and youth development
• More than half (57%) of respondents have a higher budget for youth development this year while 39% will maintain the same level as last year
• Over half (58%) of respondents do not think that liquidity in the transfer market has changed and only 13% think that it has improved
• The trend for clubs to put clauses in players’ contracts stipulating a wage cut if the club is relegated continues to rise – 89% of respondents in 2014 up from 84% in 2013 and 79% in 2012
• 41% of respondents will be reducing the size of the first team squad compared with 53% last year. Almost a quarter (23%) of EPL clubs are increasing squad size whereas for FLC and FL1 this falls to only 6% and 0% respectively.
• Seven out of ten EPL respondents will be spending more on their first team payroll next season – up from 42% in 2013. Conversely, nearly 6 out of 10 FLC and FL1 respondents will be reducing first team payroll.
• Over half (52%) of respondents will keep their transfer budget the same as last year compared with 64% in 2013. Only a quarter (27%) of respondents will reduce their transfer budgets this year compared with 24% in 2013. SP has the most stable transfer market with 83% citing no change year on year.
• More than two thirds of respondents who are reducing or keeping their transfer budget the same deny that their decision has been driven by the fair play rules.

2014 | FD FOOTBALL SURVEY 03
governance and propriety
• One in five respondents has a remunerated non-executive independent director on their club’s board, a slight increase on the 2013 figure of 15%
• Nearly three quarters (73%) of respondents - up from 64% in 2013 - agreed that they manage with a higher level of corporate governance than they would for a similar sized non-football business.
national and international issues
• Over half (51%) of respondents have a policy to support international teams by making their players available
• More than half of respondents do not feel appropriately compensated for the disruption caused by players’ international duty
• Preferred means of compensations for disruption caused by players’ international duties were insurance for injuries (80%) and full salary reimbursement (54%)
• There appears to be little support for the FA Commission’s proposals for a Football League 3 (populated with EPL B teams) and an increase in home-grown player requirements with 42% saying that they will have a negative financial impact; 28% saying that they will have no impact; 13% saying that they will have a positive financial impact; and 14% believing that the proposals will not be implemented.
methodology
BDO UK’s Professional Sports Group commissioned an independent researcher in May and June 2014 to undertake structured telephone interviews with finance directors of football clubs.
A total of 67 interviews were completed with finance directors in the English Premier League (EPL), English Football League Championship (FLC), Football Leagues One (FL1) and Two (FL2) and the Scottish Premiership (SP).
Throughout this survey, results are presented as column percentages rounded to the nearest whole and arithmetic means, unless otherwise stated. League abbreviations are used in the report to aid brevity.
league number of clubs % respondents
English Premier League 14 70%
Football League Championship 17 71%
Football League 1 14 58%
Football League 2 16 67%
Scottish Premiership 6 50%
FD FOOTBALL SURVEY | 201404
01: FINANCING THE CLUBanalysis of findings
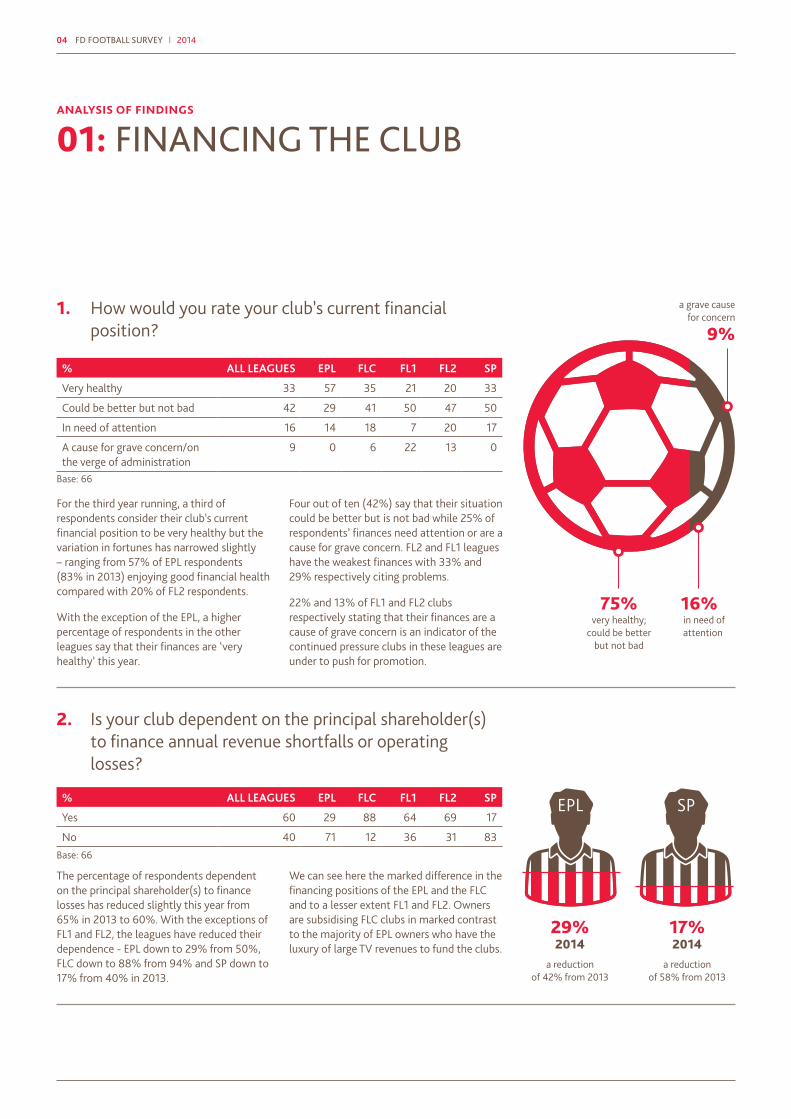
1. How would you rate your club’s current financial position?
2. Is your club dependent on the principal shareholder(s) to finance annual revenue shortfalls or operating losses?
% ALL LEAGUES EPL FLC FL1 FL2 SP
Very healthy 33 57 35 21 20 33
Could be better but not bad 42 29 41 50 47 50
In need of attention 16 14 18 7 20 17
A cause for grave concern/on the verge of administration
9 0 6 22 13 0
% ALL LEAGUES EPL FLC FL1 FL2 SP
Yes 60 29 88 64 69 17
No 40 71 12 36 31 83
For the third year running, a third of respondents consider their club’s current financial position to be very healthy but the variation in fortunes has narrowed slightly – ranging from 57% of EPL respondents (83% in 2013) enjoying good financial health compared with 20% of FL2 respondents.
With the exception of the EPL, a higher percentage of respondents in the other leagues say that their finances are ‘very healthy’ this year.
The percentage of respondents dependent on the principal shareholder(s) to finance losses has reduced slightly this year from 65% in 2013 to 60%. With the exceptions of FL1 and FL2, the leagues have reduced their dependence - EPL down to 29% from 50%, FLC down to 88% from 94% and SP down to 17% from 40% in 2013.
Four out of ten (42%) say that their situation could be better but is not bad while 25% of respondents’ finances need attention or are a cause for grave concern. FL2 and FL1 leagues have the weakest finances with 33% and 29% respectively citing problems.
22% and 13% of FL1 and FL2 clubs respectively stating that their finances are a cause of grave concern is an indicator of the continued pressure clubs in these leagues are under to push for promotion.
We can see here the marked difference in the financing positions of the EPL and the FLC and to a lesser extent FL1 and FL2. Owners are subsidising FLC clubs in marked contrast to the majority of EPL owners who have the luxury of large TV revenues to fund the clubs.
Base: 66
Base: 66
EPL
29%2014
a reduction of 42% from 2013
a grave cause for concern
very healthy; could be better
but not bad
in need of attention
a reduction of 58% from 2013
SP
17%2014
75% 16%
9%

This result is very encouraging with 75% of respondents saying they are relatively happy with their financial position, reflecting the continuing effect of financial regulation rules, the impact of an improving UK economy and the more responsible view taken by many owners in operating clubs in the last few years.
trevor birchpartner, professional sports

FD FOOTBALL SURVEY | 201406
01: FINANCING THE CLUB
3. Has your club used funding from a secondary source (i.e. not main bankers) secured on any of the following in the last year?
4. Are the current owners of the club considering a full or partial exit within the next 12-18 months?
% ALL LEAGUES EPL FLC FL1 FL2 SP
Advance on season tickets – one year
Yes: 3 No: 97
0 100
12 88
0 100
0 100
0 100
Advance on season tickets – two or more years
Yes: 0 No: 100
0 100
0 100
0 100
0 100
0 100
Player transfer fee receivables Yes: 3 No: 97
0 100
0 100
14 86
0 100
0 100
Other receivables Yes: 7 No: 93
21 79
12 88
0 100
0 100
0 100
% ALL LEAGUES EPL FLC FL1 FL2 SP
Yes 16 21 18 29 6 0
No 84 79 82 71 94 100
The use of funding from secondary sources continued to reduce in 2014 with only 3% of clubs taking an advance on season tickets, all of which were in FLC, and only 3% of clubs securitising player transfer fees receivable; all of whom were in FL1. However, 21% of EPL
While the overall picture is the same as 2013, with more than eight out of ten (84%) saying that owners are not considering an exit, the significant change is that 21% of EPL respondents believe that their owners are considering a full or partial exit in the next 12-18 months compared with none in 2013.
and 12% of FLC respondents are securitising ‘other receivables’ to secure their debt.
These numbers again add weight to the view that clubs are increasingly showing financial restraint.
It might be likely that there will be some EPL owners seeking to maximise the return on their investment with the new TV deal and taking the view the club’s performance last season was as good as it is going to get.
Base: 67
Base: 67
3%of clubs used
secondary source funding on player
transfer fee receivables and season tickets
Only
0% 21%2013 2014
EPL respondents who believe that their owners are considering a
full or partial exit in the next 12-18 months
analysis of findings

2014 | FD FOOTBALL SURVEY 07
7. If the club has given a fixed charge over the stadium as a security for a loan, what was the purpose of the loan?
% ALL LEAGUES EPL FLC FL1 FL2 SP
Build or expand the stadium 7 0 2 1 3 1
Provide cash flow for the club 12 4 3 3 1 1
Of the 19 clubs who have given a fixed charge over the stadium as security, 12 of them have used the loan to provide cash flow for the club while the other seven have used the money positively to build or expand their stadium.
6. Has your club given a fixed charge over the stadium as a security for a loan?
% ALL LEAGUES EPL FLC FL1 FL2 SP
Yes 28 29 29 29 25 33
No 72 71 71 71 75 67
Just over a quarter (28%) of clubs have given a fixed charge over the stadium as security for a loan. There is little change this year in the overall picture and little variation in the responses across the leagues.
28% of clubs leveraging their stadium has always been a concern. However, it is encouraging that this position has not worsened.
Base: 67
Base: 19
5. As far as you are aware, within the last 12 months has the club been subject to an informal or formal approach from interested external parties with a view to taking an equity stake in the club?
% ALL LEAGUES EPL FLC FL1 FL2 SP
Yes 29 8 41 43 31 0
No 71 92 59 57 69 100
29% of clubs have been approached by external parties – up from one in five in 2013.
The FLC and FL1 clubs have had the most approaches (41% and 43% respectively).
There is still demand for football clubs and the preference remains to take on Football League clubs and invest in seeking promotion to the EPL.
Base: 67

FD FOOTBALL SURVEY | 201408
02: CLUB REVENUE AND PROFITABILITY TRENDS
8. Do you expect to make a profit before player trading and amortisation in your next accounting period?
9. Do you expect to make a profit after player trading and amortisation in your next accounting period?
% ALL LEAGUES EPL FLC FL1 FL2 SP
Yes 43 86 35 21 19 83
No 49 14 59 72 63 17
Don’t know 8 0 6 7 18 0
% ALL LEAGUES EPL FLC FL1 FL2 SP
Yes 40 42 29 43 31 83
No 42 29 65 43 38 17
Don’t know 18 29 6 14 31 0
The overall results reveal an overall increase in confidence this year with 43% of respondents expecting to make a profit in their next accounting period – up from 36% in 2013.
However, there is a wide variation in confidence levels between leagues – ranging from the EPL (86%) and SP (83%) expecting to make a profit compared with just 21% of FL1 and 19% of FL2 respondents.
The profit outlook for the next financial year is brighter than 2013 with 40% of respondents expecting to make a profit after player trading and amortisation compared with just 29% in 2013.
The percentage of respondents not expecting to make a profit has fallen sharply from 65% to 42%.
While two thirds (65%) of FLC respondents expect to make a loss, this is still a decrease from 88% in 2013.
The greatest increase in confidence is from FLC finance directors with 35% expecting to make a profit – up from just 17% in 2013.
Overall these results are encouraging with the EPL understandably showing the greatest confidence on the back of increased TV revenues. However, the FLC and FL1 continues to be a cause for concern which is why FFP rules have been embraced by these divisions.
The 83% of SP expecting to make a profit seems very high and encouraging, particularly when it is not reliant on transfer fees. Overall the responses to this and the prior question suggest that transfer fees have no marked impact on profits in the FLC or SP, unlike all other divisions.
However in the EPL we can see that around half of profits before player trading and amortisation convert to losses after player trading and amortisation. Despite profitability and sustainability rules in the EPL there is clearly still a need and scope for shareholder support (through allowable losses of up to £35m per season).
Base: 67
Base: 67
86%EPL
83%SP
43%ALL
40%ALL
35%FLC
42%EPL
83%SP
43%FL1
19%FL2
29%FLC
21%FL1
31%FL2
profit before player trading and amortisation?
profit after player trading and amortisation?
analysis of findings

2014 | FD FOOTBALL SURVEY 09
10. What has been the impact of the economic conditions on the following revenue streams in the current financial year?
% ALL LEAGUES EPL FLC FL1 FL2 SP
Match tickets
Reduced 39 0 64 65 26 33
No impact 27 42 18 7 44 17
Improved 34 58 18 29 31 50
Merchandising
Reduced 30 14 47 35 25 17
No impact 36 22 35 36 50 33
Improved 34 64 18 29 25 50
Match day catering
Reduced 30 0 42 21 12 66
No impact 45 42 36 50 69 17
Improved 30 58 18 29 19 17
Corporate entertaining packages
Reduced 39 0 53 50 44 50
No impact 30 36 24 21 38 33
Improved 31 64 24 29 18 17
Season ticket sales
Reduced 27 0 53 35 25 0
No impact 37 50 18 29 56 33
Improved 36 50 29 36 19 67
Sponsorship
Reduced 31 14 59 21 31 33
No impact 34 28 17 43 50 33
Improved 33 58 24 36 19 34
The polarisation of the game between the EPL and the rest is clearly shown in these numbers. The strength of the league means customers and sponsors alike are still willing to pay a premium to be associated with it.
The most noticeable trend seen in these results is that for all revenue streams ‘improved revenues’ was the most common response from the EPL clubs whereas ‘reduced revenues’ was the most common response from FLC clubs.
Improved economic conditions have driven a very positive impact on corporate hospitality revenues in the EPL (64% seeing an increase with no respondents seeing a decrease). However, this appears to be at the expense of other leagues, each of which is reporting reduced revenue as the most common response.
Sponsorship revenue is increasing within the EPL (58% reporting an increase with only 14% showing a decrease). However, this is unique to the EPL as the highest positive response of the other leagues was FL1 with only 36% and the least positive response was the FL2 with only 19%.
Base: 67

FD FOOTBALL SURVEY | 201410
02: CLUB REVENUE AND PROFITABILITY TRENDS
11. What effect do you expect the state of the economy to have on your 2014/15 revenue streams compared with the season just ended?
% ALL LEAGUES EPL FLC FL1 FL2 SP
Match tickets
Reduced 24 14 42 28 19 0
No impact 51 50 42 50 62 50
Improved 25 36 18 22 19 50
Merchandising
Reduced 15 7 24 14 19 0
No impact 49 43 47 57 56 34
Improved 36 50 29 29 25 66
Match day catering
Reduced 13 14 24 14 6 0
No impact 60 50 58 64 75 34
Improved 27 36 18 22 19 66
Corporate entertaining packages
Reduced 20 7 30 29 19 0
No impact 46 43 35 50 50 66
Improved 34 50 35 21 31 34
Season ticket sales
Reduced 25 14 42 35 19 0
No impact 45 57 29 29 56 66
Improved 30 29 29 36 25 34
Sponsorship
Reduced 18 7 36 14 19 0
No impact 45 22 29 64 56 66
Improved 37 51 35 22 25 34
Finance directors appear to be cautiously optimistic that a strengthening economy will positively affect revenue streams in the forthcoming 2014/15 season with EPL and FL2 and SP respondents anticipating net improvement across all revenue streams.
FLC respondents are expecting a net decline in match day and season ticket revenues but no major changes in other revenue streams.
On balance, FL2 respondents are not expecting any major changes to their revenues in the forthcoming season.
Base: 67
analysis of findings

£2014 | FD FOOTBALL SURVEY 11
12. Do you use the wages to turnover ratio as a key performance indicator of the club’s financial health?
13. If ‘yes’ in which range is your benchmark?
14. What wages to turnover ratio do you currently operate in?
% ALL LEAGUES EPL FLC FL1 FL2 SP
Yes 49 57 41 64 38 50
No 51 43 59 36 62 50
NUMBER OF CLUBS ALL LEAGUES EPL FLC FL1 FL2 SP
<50% 6 2 1 1 1 1
51-55% 12 3 0 5 4 0
56-60% 5 1 0 3 0 1
61-65% 3 1 1 0 0 1
>66% 7 1 5 0 1 0
% ALL LEAGUES EPL FLC FL1 FL2 SP
<50% 10 22 6 7 6 17
51-55% 13 7 0 36 19 0
56-60% 9 7 0 21 6 16
61-65% 3 7 0 0 0 17
>66% 14 14 29 0 6 0
Not applicable 51 43 65 36 63 50
Almost half (49%) of respondents are using the wages to turnover ratio as a KPI of their club’s financial health this year – up slightly from 44% in 2013. Given the increased impact of financial regulation rules, we may have expected a more significant increase in focus on this ratio.
The percentage of FL1 respondents using wage to turnover as a KPI has risen markedly from 43% in 2013 to 64% this year.
While 18 of the 33 clubs have a benchmark of not more than 55% this year – an increase on 12 clubs (54%) in 2013 – there are also more clubs with a benchmark of more than 66% - up to seven clubs from just two in 2013. Unsurprisingly, five of these are in the FLC, where salary pressure remains high and revenues remain comparably low.
A smaller percentage of clubs are operating below 55% - down from 42% in 2013 to just 23% in 2014. However, the percentage of clubs operating above 61% has also fallen sharply from 38% to just 17%.
Compared with 2013 results where 42% of EPL and 66% of FLC respondents were operating above 66%, these result may indicate that clubs are more focused on building a sustainable financial foundation for their clubs rather than taking a gamble on either promotion or maintaining their place in their leagues.
Base: 67
Base: 33
Base: 67

FD FOOTBALL SURVEY | 201412
03: CLUB OPERATIONS
15. What is the projected level of your non-player capital spend during the next two years?
16. What are your two biggest concerns for your club over the next 12 months?
% ALL LEAGUES EPL FLC FL1 FL2 SP
<£2.5m 61 14 58 79 81 83
£2.5-£10m 19 42 24 14 0 17
£10-£25m 9 22 6 0 13 0
>£25m-£50m 3 0 0 7 6 0
More than £50m 8 22 12 0 0 0
% OF MENTIONS ALL LEAGUES EPL FLC FL1 FL2 SP
1. Loss of income due to relegation 43 % 1 2 2 1=
2. Inflexible players’ salaries 38% 2 1 3= 2=
3. Falling attendances due to current economic environment 28 % 1 3 1
4. Ability to attract sponsorship 28 % 3 1= 2=
5. Ability to raise new capital 21 % 3 3=
6. Other 21 %
7. Potential fall in TV income 11 %
8. Compliance with financial fair play regulations 9 %
9. Season ticket pricing 3 %
While the majority of clubs continue to spend less than £2.5 million on non-player investment, there is some evidence of increasing levels of investment.
Fewer respondents are spending less than £2.5 million – down from three quarters of
The top two concerns of football finance directors are the same as in previous years - the loss of income if the club is relegated and the inflexibility of players’ salaries – albeit the order has changed from 2013, most likely due to the widening gap in central league revenues between the leagues.
Falling attendances due to the current economic environment is the main concern for FL1 and SP clubs for the second year running. The ability to attract sponsorship is a major concern for FL2 clubs.
Compliance with fair play regulations was only mentioned by 9% of respondents while season ticket pricing was only an issue for 3%.
Again we see the spectre of relegation haunting EPL clubs which reflects the gulf in revenues between the EPL and FLC, even with parachute payments.
respondents in 2013 to 61% this year – and a small handful of clubs are spending more than £50 million compared with just one club last year.
One in five (22%) EPL clubs plans to spend more than £50 million (up from 8% in 2013)
Base: 67
Base 67: (The numbers 1-3 relate to the ranking of each league’s concerns.)
while a quarter (24%) of FLC respondents plan to spend between £2.5 million and £10 million (up from 6% in 2013). Two FLC clubs are planning to spend more than £50 million which represents significant long term investment at that level.
spending less than £2.5m
(down from 75%)
spending more than £50m
(up from 1.5%)
analysis of findings
61%
8%

2014 | FD FOOTBALL SURVEY 13
The concern over falling attendances in the Scottish Premiership is almost certainly due to the continuing impact of Rangers being out of the top division, exacerbated by Hearts and Hibs both having been relegated at the end of last season. The teams in the Scottish Premiership may actually have lower match attendances than the second tier in Scotland next season.
charles barnettpartner, professional sports

FD FOOTBALL SURVEY | 201414
03: CLUB OPERATIONS
17. Are your revenues from key commercial contracts such as sponsorships:
18. Do you think suitable sponsors are:
% ALL LEAGUES EPL FLC FL1 FL2 SP
Increasing 39 79 35 14 31 33
Largely unchanged 40 7 41 64 44 50
Falling 21 14 24 22 25 17
% ALL LEAGUES EPL FLC FL1 FL2 SP
Becoming easier to find 7 14 18 0 0 0
Becoming harder to find 63 57 58 64 56 100
No real change 30 29 24 36 44 0
Although four out of ten (39%) of respondents report increasing revenues from sponsorship, the EPL is the only league where a large majority (79%) of respondents have increasing revenues from sponsorship contracts.
Nearly two thirds (63%) of respondents think that suitable sponsors are becoming harder to find, including 100% of SP respondents. Only 14% and 18% of EPL and FLC respondents think that sponsors are becoming easier to find, albeit this is better than the experiences of FL1, FL2 and SP.
Only 14% of FL1 respondents reported an increase. Outside of the EPL the SP is showing the least instances of declining commercial revenues. The polarisation continues. Sponsors want to be associated with success and large multinational brands, seeking to target a wider and more accessible international audience.
Sponsors are becoming more discerning and sophisticated moving more towards a partnership arrangement with omnichannel brand activation.
Base: 67
Base: 67
analysis of findings
79%
63% 0% 0%
the polarisation continues
14%
EPLFL1
increasing revenues from key commercial
contracts
of all respondents think suitable sponsors are
becoming harder to find
think suitable sponsors are becoming
easier to find
increasing revenues from key commercial
contracts
FL1 FL2

2014 | FD FOOTBALL SURVEY 15
19. Do you think the wealth gap in your division is:
20. Do you think the wealth gap between larger clubs and smaller clubs in general is:
% ALL LEAGUES EPL FLC FL1 FL2 SP
Widening 61 79 76 50 38 66
Narrowing 12 14 6 14 13 17
Unchanged 27 7 18 36 49 17
% ALL LEAGUES EPL FLC FL1 FL2 SP
Widening 94 100 82 93 100 100
Narrowing 0 0 0 0 0 0
Unchanged 6 0 18 7 0 0
More than six out of ten (61%) of respondents think that the wealth gap in their division is widening with the gap being most evident in the EPL and FLC clubs (79% and 76% respectively).
More than nine out of ten (94%) of respondents think that the wealth gap between larger and smaller clubs is widening with 100% agreement from the EPL, FL2 and SP.
This polarisation will continue to have a major impact on the smaller clubs who will face increasing difficulties in attracting fans, investors and sponsors.
Even though the EPL as a whole is a global success, we see here that within the league clubs believe the gap between top and bottom is widening which might ultimately be detrimental to the overall quality of the league.
Responses to questions 17 to 20 raise the question as to whether FFP regulations limit the opportunity for FL1, FLC and the smaller of the EPL clubs to bridge the gap? A locking in of this differential could be an unintentional consequence of FFP rules, combined with the highest commercial revenues tending towards the largest club brands.
Base: 67
Base: 67
61%
94%
12%
widening
widening
narrowingthe wealth gap in my division is:
the wealth gap in general is:

FD FOOTBALL SURVEY | 201416
03: CLUB OPERATIONS
21. HMRC has major on-going projects challenging complex salary structures including certain image rights payments and employee benefit trusts. This could lead to a potentially large PAYE bill for affected clubs. Which of following statement best reflects your view?
22. Was your club late on more than one occasion during the year with payment of any tax (i.e. corporation tax, PAYE/NIC, VAT) due to HMRC?
% ALL LEAGUES EPL FLC FL1 FL2 SP
Not concerned, the tax position on payments to our players is robust and very defendable 82 57 88 71 100 100
Somewhat uncertain give the pace of change of HMRC enquiries 5 22 0 0 0 0
Somewhat concerned that a sizeable challenge could create a problem 13 21 12 29 0 0
Very concerned that a sizeable challenge would create a problem 0 0 0 0 0 0
% ALL LEAGUES EPL FLC FL1 FL2 SP
Yes 13 0 29 7 19 0
No 87 100 71 93 81 100
Confidence among respondents that their tax position on payments to players was robust and very defendable to HMRC rose slightly from 77% in 2013 to 82% this year.
However, only 57% of EPL respondents are confident that their tax position is defendable with 22% somewhat uncertain and 21% concerned that a sizeable HMRC challenge could create a problem.
Almost a third (29%) of FL1 respondents are also concerned that an HMRC challenge would create a problem.
The percentage of respondents who were late making their tax payments fell from 20% in 2013 to 13%. FLC clubs are most likely to be late (29%) – compared with no EPL or SP clubs.
Of the clubs which paid late, six of them had taken a risk in not formally agreeing the delay with HMRC in advance.
Base: 67
Base: 67
analysis of findings
13%More than one late tax payment
Clubs who are confident in their robust and defendable tax position
82% 77%2014
2013

2014 | FD FOOTBALL SURVEY 17
23. Have you noticed any changes in HMRC’s attitude to pressing for the collection of tax due?
% ALL LEAGUES EPL FLC FL1 FL2 SP
Yes, it is contacting us earlier and/or more often 39 29 29 50 44 50
Yes, it is taking them longer to get in touch 4 7 12 0 0 0
No 57 64 59 50 56 50
There has been a fall in the percentage of clubs that have been contacted earlier or more often by HMRC from 52% in 2013 to 39% this year. However, this is still a clear indication that the football sector remains a high interest area for HMRC.
Only 4% of clubs said that HMRC was taking longer to get in touch.
Base: 67
52%39%
2013
2014
the percentage of clubs which have been contacted earlier or more often by HMRC
We will continue to see HMRC focus on player remuneration and broaden this to include examining the tax position on agents fees paid by clubs. This is a complex area and the tax position is not always clear, as demonstrated by the decision in the Glasgow Rangers appeal which, whilst lost by HMRC, is not the end of the matter. The general hardening in attitude towards perceived tax evasion and increased Government focus on tax planning in general may lead to respondents seeing increased activity in this area.
shawn healyemployment tax principal, professional sports

FD FOOTBALL SURVEY | 201418
04: FINANCIAL FAIR PLAY
24. Financial sustainability rules are now in force in UEFA club competitions and the top four tiers of English football. Do you believe that similar rules should be introduced by the SPFL?
25. Did your club comply with the requirements of applicable financial fair play and cost control and sustainability rules (collectively FFP) in the 2013/14 season?
% ALL LEAGUES EPL FLC FL1 FL2
Yes 90 86 94 93 100
No 10 14 6 7 0
All six SP clubs who responded to the survey believed that the SPFL should introduce similar rules.
There were high levels of compliance – 90% - with the requirements of the FFP rules during last season.
compliance with the requirements of the FFP rules
Base: 66
analysis of findings
90%10%yesno

2014 | FD FOOTBALL SURVEY 19
27. Do you believe FFP rules to be broadly workable as they currently stand?
26. Domestic and/or UEFA fair play rules are in operation. Do you expect that for next season your club will:
% ALL LEAGUES EPL FLC FL1 FL2 SP
Yes 86 86 76 93 87 100
No 14 14 24 7 13 0
% ALL LEAGUES EPL FLC FL1 FL2 SP
Comply with these rules with minimal change to the business model
91 93 88 86 100 83
Only manage to comply by making significant changes to the business model
9 7 12 14 0 17
Will not comply, but plan to be compliant within the next 2-3 years
0 0 0 0 0 0
Will not comply and have not yet addressed the steps necessary to become compliant
0 0 0 0 0 0
Almost nine out of ten (86%) respondents believe that the FFP rules are broadly workable as they currently stand. However, a quarter of FLC clubs do not agree.
More than nine out of ten (91%) clubs will comply with the FFP rules in 2014/15 with only minimal changes to their business model – up from 85% in 2013, with only 9% needing to make significant changes to achieve compliance.
Base: 66
Base: 66
Although clubs are broadly complying and think they are workable, as seen from this and the two previous questions, the real cause for concern is the FLC where clubs are divided as to whether the rules are workable.
100%all clubs will comply
with the FFP rules
86% 24%believe that the
FFP rules are broadly workable
of FLC clubs do not agree
Clearly there is transition required for some clubs in order to achieve compliance with FFP rules. However, on the basis of these responses we can say that very positive progress is being made.

FD FOOTBALL SURVEY | 201420
04: FINANCIAL FAIR PLAY
28. Do you believe the structure of the financial fair play rules, applicable to your division, to be appropriate?
29. Do you feel well represented by your league with regards to financial fair play/sustainability rules?
% ALL LEAGUES EPL FLC FL1 FL2 SP
Yes 56 50 29 71 75 50
Not yet, some refinement required 30 22 47 21 19 50
No, a lot needs to change 14 28 24 7 0 0
% ALL LEAGUES EPL FLC FL1 FL2 SP
Yes 76 64 65 93 96 50
No 24 36 35 7 6 50
Over half (56%) of the respondents agree that the structure of the financial fair play rules, as applicable to their division, are appropriate.
More than three quarters (76%) of respondents feel well represented by their league regarding the FFP rules with the FL1 and FL2 respondents being the most satisfied (93% and 83%).
Base: 66
Base: 66
However, 71% of FLC respondents think that either some refinement is needed or a lot needs to change. Significantly 28% of EPL clubs say that a lot needs to change.
More than a third of EPL and FLC respondents, however, do not feel well represented.
There is a reasonably high level of concern amongst clubs, particularly FLC clubs, that the rules are not appropriate.
The effect of parachute payments, which are not caught by the rules, has a distorting effect on the relative revenue levels of the clubs in the FLC and this, together with some club owners not wanting to be fettered by what they can spend in order to achieve promotion to the EPL, is causing tensions.
analysis of findings
76% 36%feel well represented
by their leagueof EPL teams do not feel well represented
by their league

30. Do you believe that the FFP regulations meet the principal objective of promoting sustainability?
% ALL LEAGUES EPL FLC FL1 FL2 SP
Yes 38 14 41 43 53 34
No, but they are a step in the right direction 46 50 24 57 47 66
No , there are better ways to ensure sustainability 15 29 35 0 0 0
Regulation is not necessary 1 7 0 0 0 0
Opinions are split on whether FFP regulations meet their principal objective of promoting sustainability. Overall, 38% agree that it does and a further 46% say they are a step in the right direction. There is varying opinion across the leagues.
Base: 66
Only 14% of EPL respondents agree that the objective has been met compared with 53% of FL2. Just under a third (29%) of EPL and 35% of FLC respondents think that there are better ways to ensure sustainability.
These responses show that clearly there is some work to do on the rules to ensure that the majority of clubs are satisfied that they operate effectively.
38% 46% 15%Yes No, but they
are a step in the right direction
No, there are better ways
to ensure sustainability

FD FOOTBALL SURVEY | 201422
31. In the absence of FFP regulations, would you or your owner invest more money into trying to realise the club’s ambition?
% ALL LEAGUES EPL FLC FL1 FL2 SP
Yes, to a significant degree 7 0 18 0 13 0
Yes, to some extent 26 57 29 14 0 34
No, the amount we are allowed to invest is sufficient 38 29 41 50 40 17
No, there is no more to invest 29 14 12 36 47 50
While a third (33%) would be prepared to invest more money, the remaining two thirds are split between saying that the amount they are allowed to invest is sufficient (38%) or that there is no more money to invest (29%).
However, 57% of EPL and almost half (47%) of FLC respondents would be prepared to invest more.
Base: 66
These responses seem to reflect the view that with some further revisions reflecting the ability of owners to increase their subsidies the rules may be acceptable to a majority of the clubs. The debate continues on how to promote sustainability without stifling investment.
yes
significantly: 7%
to some extent: 26%
the amount we are allowed is sufficient: 38%
there is no more to invest: 29% £
no

The threat of sanctions is going a long way to ensuring compliance with FFP rules. However, our research suggests that this should not be confused with wide-reaching levels of satisfaction, particularly within the EPL and FLC.
Almost half of all clubs (44%) do not believe the rules to be appropriate, a quarter of clubs do not feel well represented by their league, only 38% believe the rules meet the objective of sustainability (albeit most that do not, admit that they are a step in the right direction) and a third feel that the rules are stifling the investment of ambitious owners.
ian claydenpartner, professional sports

FD FOOTBALL SURVEY | 201424
05: YOUTH DEVELOPMENT
32. For financial year 2014/15, how does your youth development budget compare to financial year 2013/14?
33. If there is a change in the youth development budget, is this directly due to financial fair play/cost control and sustainability rules?
% ALL LEAGUES EPL FLC FL1 FL2 SP
Significantly higher 18 22 12 14 19 34
Higher 39 50 29 50 31 33
The same 39 28 47 36 44 33
Slightly lower 1 0 0 0 6 0
Significantly lower 3 0 12 0 0 0
% ALL LEAGUES EPL FLC FL1 FL2 SP
Yes 6 0 0 14 12 0
No 55 78 53 50 44 66
Not applicable 39 22 47 36 44 34
More than half (57%) of respondents have a higher budget for youth development this year while 39% will maintain it at the same level as last year and 4% have a lower budget.
More than half (55%) of respondents deny that any changes in the youth development budget are directly due to FFP, rising to 78% of EPL respondents.
A larger percentage of the premier leagues (EPL 72% and SP 67%) will be spending more on their youth development budgets than last year.
Base: 67
Base: 67
analysis of findings
57%
6%
39%
55%
4%
39%
Higher
yes
Youth development budget 2014/15 vs 2013/14
The same
no
Lower
Not applicable
The new Elite Player Performance Plans (EPPP) are driving this increased investment. It is hoped that these will lead to better coaching and improved quality of players.

2014 | FD FOOTBALL SURVEY 25
06: PLAYER COSTS AND TRANSFERS
34. Is liquidity in the transfer market?
35. Do any of your players have clauses in their contracts stipulating that their wages will be cut if the club is relegated?
36. In your budget for 2014/15 will your first team squad size be larger, the same or smaller than the season just ended?
% ALL LEAGUES EPL FLC FL1 FL2 SP
Improving 13 22 18 14 6 0
Worsening 29 14 29 57 19 17
Unchanged 58 64 53 29 75 83
% ALL LEAGUES EPL FLC FL1 FL2 SP
Yes 89 83 94 93 94 66
No 11 17 6 7 6 34
% ALL LEAGUES EPL FLC FL1 FL2 SP
Greater 11 23 6 0 12 17
Same 48 69 35 57 38 66
Smaller 41 8 59 43 50 17
More than half (58%) of respondents do not think that liquidity in the transfer market has changed and only 13% think that it has improved.
More than half (57%) of FL1 respondents think that liquidity has worsened.
The trend for clubs to put clauses in players’ contract stipulating a wage cut if the club is relegated continues to rise – up to 89% of respondents in 2014 from 84% in 2013 and 79% in 2012.
The FLC, FL1 and FL2 clubs continue to be the most likely leagues to have relegation clauses in players’ contracts.
The trend towards reducing the size of the first team squad appears to have slowed this year with only 39% planning to reduce the numbers compared with 53% last year. Almost a quarter (23%) of EPL clubs will be increasing the size of their first team.
Base: 67
Base: 65
Base: 66
The FLC has the highest percentage of clubs (59%) that will reduce their squad size and the FL1 is the only league where no respondents will be increasing the size of their first team squad.
Half of respondents (48%) will maintain their squads at the same level as last year – including 69% of EPL and 66% of SP respondents.
analysis of findings
41% 59%planning to reduce
the numbers this yearFLC clubs reducing
squad size compared with last year

FD FOOTBALL SURVEY | 201426
06: PLAYER COSTS AND TRANSFERS
37. In your budget for 2014/15 will you spend more, the same or less on the payroll cost of the first team squad than the season just ended?
38. If your club plans to spend the same or less on payroll costs of the first team squad in the 2104/15 season, to what extent has this decision been driven by FFP rules?
% ALL LEAGUES EPL FLC FL1 FL2 SP
More 30 70 18 14 25 34
Same 30 15 24 29 44 50
Less 40 15 59 57 31 17
% ALL LEAGUES EPL FLC FL1 FL2 SP
Not at all 65 67 60 46 75 100
Yes, to some extent 22 33 34 18 17 0
Yes, to a considerable extent 13 0 6 36 8 0
Across all the leagues, almost one in three (30%) clubs will be spending more compared with 17% last year. This figure is distorted however by seven out of ten EPL respondents who will be spending more on their first team payroll next season - up from 42% in 2013. This is unsurprising given the increase in TV revenues. However, clubs will need to manage this carefully in order to comply with FFP rules.
Over a third (35%) of respondents admit that their decision to spend less on first team payroll costs has been partly or largely driven by the FFP rules.
Overall, 65% the respondents have not taken FFP into consideration when spending the same or less on payroll.
However, 54% of FL1 respondents’ and 40% of FLC respondents’ decisions have been influenced by the FFP to some or a considerable extent.
Base: 66
Base: 45
The most budget conscious leagues are the FLC and FL1 with 59% and 57% respectively spending less on payroll. This is a continuation of the trend seen in previous years and would appear to be a result of the bedding in of FFP and further pressures on league and commercial revenues.
The percentage of clubs planning to spend less has fallen from 56% in last year’s survey to 40% this year.
analysis of findings
30% 17%clubs will be
spending morecompared with
last year

2014 | FD FOOTBALL SURVEY 27
39. Will you increase/reduce your transfer budget this year?
40. If your transfer budget for 2014/15 will reduce or remain the same, to what extent has this decision been driven by FFP rules?
% ALL LEAGUES EPL FLC FL1 FL2 SP
Increase 21 24 41 0 19 17
Same 52 38 35 64 56 83
Reduce 27 38 24 36 25 0
% ALL LEAGUES EPL FLC FL1 FL2 SP
Not at all 80 70 70 79 92 100
Yes, to some extent 18 30 30 14 8 0
Yes, to a considerable extent 2 0 0 7 0 0
Responses to the above question are largely mixed with around one in five increasing transfer budgets and one in three reducing transfer budgets. Around half have an unchanged budget.
This year’s results are very similar to last year’s. 80% of respondents who are reducing or keeping their transfer budget the same deny that their decision has been driven by FFP rules.
Base: 66
Base: 51
Only a quarter (24%) of FLC respondents will reduce their transfer budgets this year compared with 44% in 2013.
Only 20% say that FFP rules have had an impact on their decision.
The percentage of clubs increasing their transfer budget has risen from 12% in 2013 to 21%. The most notable increase is in the FLC where 41% are increasing their transfer budgets compared with 6% in 2013.
deny that their decision has been driven by the FFP rules
claim FFP rules have had an impact on their decision
80%
20%

FD FOOTBALL SURVEY | 201428
07: GOVERNANCE AND PROPRIETY
41. Does your board include remunerated non-executive independent directors?
42. Do you regard yourself as a public interest business with higher degrees of scrutiny?
43. Does the level of public interest in your club lead you to manage the club with heightened corporate governance in comparison to similar sized companies outside of the football sector?
% ALL LEAGUES EPL FLC FL1 FL2 SP
Yes 20 30 18 21 13 17
No 80 70 82 79 87 83
% ALL LEAGUES EPL FLC FL1 FL2 SP
Yes 90 100 88 93 87 66
No 10 0 12 7 13 34
% ALL LEAGUES EPL FLC FL1 FL2 SP
Yes 73 86 65 71 69 87
No 27 14 35 29 31 13
One in five (20%) respondents have remunerated non-executive independent directors on their club’s board, a slight increase on the 2013 figure of 15%.
Governance continues to be an issue within the game but reflects the ownership model. An increase in paid independent non-executive directorships is a positive move however.
Almost all (90%) respondents regard their football club as a public interest business with high degrees of scrutiny.
Nearly three quarters (73%) agreed that the level of public interest in their club leads them to manage the club with a higher level of corporate governance than they would for a similar sized business outside the football sector.
The findings of our survey suggests a high level of governance in the sector.
Base: 66
Base: 67
Base: 67
analysis of findings
90%
73%

2014 | FD FOOTBALL SURVEY 29
08: NATIONAL AND INTERNATIONAL ISSUES
44. As a club, do you have an explicit or implicit policy to support international teams through availability of players?
45. As a club, do you feel appropriately compensated for the disruption caused by players’ international duty?
46. Do you think appropriate compensations should include:
% ALL LEAGUES EPL FLC FL1 FL2 SP
Yes 51 50 72 36 38 66
No 7 0 12 14 6 0
No policy either way 27 50 18 29 13 34
Not applicable 15 0 0 21 44 0
% ALL LEAGUES EPL FLC FL1 FL2 SP
Yes 23 29 24 21 13 33
No 52 71 65 50 31 50
Not applicable 25 7 12 29 56 17
% OF RESPONDENTS ALL LEAGUES
Full insurance for injuries on international duty 80
Full salary reimbursement for period of international duty 54
Fixed fee per day of international duty 41
Partial salary reimbursement for period of international duty 28
Just over half (51%) of respondents have a policy to support international teams by making their players available. The FLC has the highest percentage of respondents with a positive support policy (72%). Half of EPL clubs do not have a policy either way.
More than half of all respondents do not feel appropriately compensated for the disruption caused by players’ international duty. Not surprisingly, given that EPL and
Whilst salary reimbursement is a popular choice amongst respondents, clearly the greater concern is the medium/long term impact of injuries. Better security in this area would not appear to be an unreasonable request.
Base: 67
Base: 67
Base: 39 (52% who said ‘no’)
analysis of findings
FLC clubs are most affected by international call ups, this rises to 71% of EPL and 65% of FLC respondents.
inappropriately compensated for international call ups
inappropriately compensated for international call ups
71%EPL
65% FLC

FD FOOTBALL SURVEY | 201430
08: NATIONAL AND INTERNATIONAL ISSUES
47. What impact do you expect the World Cup to have on your summer 2014 player trading?
On average we expect like-for-like player prices to be:
% ALL LEAGUES EPL FLC FL1 FL2 SP
Higher 34 50 47 29 6 50
Lower 0 0 0 0 0 0
No change 66 50 53 71 94 50
A third anticipated higher player prices during the 2014 player trading period while two thirds thought there would be no change.
Base: 67
analysis of findings
Clearly a world cup year is expected to cause some player inflation pressure, increasingly so at the higher league levels.
anticipate higher player prices during the 2014 trading period
one third

2014 | FD FOOTBALL SURVEY 31
48. Greg Dyke recently announced English FA Commission proposals for the introduction of a newly created League 3, populated with Premier League B teams, and an increase in the minimum home grown player requirement for match day squads.
For English clubs: What do you expect to be the net financial impact of these proposals on your club?
For Scottish clubs: Would you welcome similar proposals from the Scottish FA?
% ALL LEAGUES EPL FLC FL1 FL2
High negative impact 14 5 6 0 44
Low negative impact 28 50 18 36 19
No impact 28 29 41 29 19
Small positive impact 8 0 18 14 0
High positive impact 5 0 6 7 6
Proposals won’t happen/work 14 14 6 21 13
No views 3 0 12 7 6
% SP
Yes, similar 17
Yes, in principal but with variation 50
No 33
Based on the financial impact alone, the results indicate little support for Greg Dykes’ proposals with 42% saying that they will have a negative financial impact and 28% say they will have no impact. Only 13% say they will have a positive financial impact. Interestingly 14% do not believe that the proposals will be implemented.
Almost two thirds (63%) of FL2 respondents say that the proposals will have a negative financial impact, clearly a response to the proposed new League 3 including Premier League B teams and the perceived impact that this will have on their league award, attendance, and other commercial revenues.
Two thirds of SP clubs surveyed welcomed similar proposals from the Scottish FA.
Base: 61
Base: 6
saying that they will have a negative financial impact
say they will have no impact
say they will have a positive
financial impact
do not believe that the
proposals will be implemented
42% 28%
13% 14%

FD FOOTBALL SURVEY | 201432
BDO PROFESSIONAL SPORTS GROUP
Our Professional Sports Group client base extends across major professional sports including football, horse racing, rugby, golf, cricket, and motor racing, as well as other health and fitness businesses.
In professional football we have worked for an array of high profile football clubs and governing bodies providing specialist services ranging from audit and accounting to tax advice on image rights and agents’ fees to insolvency assignments.
Our team of sector experts which includes partners with experience of managing and running top flight football clubs, can provide football clubs with a complete range of business advisory services including:
• External and internal audit
• Corporate tax
• Corporate finance and financial modelling
• Business restructuring
• Specialist VAT consultancy
• Employment tax
• Corporate governance
• Forensic and fraud investigations.
professional sports group key contacts
For more information on any of our services for the football industry, contact the relevant BDO expert in your region.
scotland
LONDON NORTH
south
charles barnettAudit/Corp Finance
ian claydenAudit
brian lovieTax
trevor birchBusiness Restructuring
james robertsAudit/Corp Finance
andy mcnamara Audit
ian cooperCorporate Finance
julien ryeAudit
stuart lisleTax
bryan jackson Business Restructuring
tim ferrisCorporate Tax
billy cairnsTax
andy goodmanEmployment Tax
chris heatlieCorporate Finance
jim geeForensic
0141 249 5203
020 7893 2372 0113 204 1306020 7893 3437 0161 833 8362
020 7893 28300141 249 5249
020 7893 2678 0161 817 7505
023 8088 18610131 347 0366
020 7893 3733
01293 591 0870141 249 5233
020 7893 3612

2014 | FD FOOTBALL SURVEY 33
our specialist services include:
Corporate finance and financial modellingWe have significant experience providing transaction advisory and investigative services across professional sports and professional leagues to a number of clubs for both vendors and acquirers. Our specialist transaction services team performs due diligence for potential investors and for FFP planning and compliance, and our advisory team specialises in leading sale processes and procuring investment.
Business restructuringWe have been appointed administrators of a number of clubs including Motherwell, Oldham Athletic, Dundee, Portsmouth, Dunfermline and Hearts. All completed appointments have led to a successful outcome whereby a dividend was accepted by creditors under a Company Voluntary Arrangement (CVA). All companies survived following the CVAs and are continuing to trade.
Specialist VAT consultancySome of our recent assignments have included providing extensive VAT input on the following:
• Affinity card agreements
• Overseas sponsorship issues
• Testimonial/benefit games for current and former players
• Stadium refurbishments and alternative uses, catering issues, retail sales
• Agents’ fees.
We have produced a VAT overview guide for clients in connection with a number of rules and treatments, including the place of supply of goods & services, plus certain VAT reporting requirements and a matrix relating to the key income streams.
employment tax
Over the last twelve months our team of specialists has provided advice in connection with the complex area of reward. This is in the light of heightened HMRC interest into the use of complex remuneration structures, sometimes involving Employer Financed Retirement Benefit Schemes (EFRBs), Employee Benefit Trusts (EBT’s), contracts for difference and the use of Image Rights Companies. We have also assisted clubs with investigations into the use of such structures by HMRC Specialist Investigations. Obviously, in their day to day business, many clubs make payments to sports agents and we have advised clubs on how these should be correctly dealt with for income tax and national insurance purposes.
corporate governance
Good corporate governance is essential if clubs are to be managed effectively by executive directors and legal obligations discharged properly by non-executive directors. Procedural issues include:
• Transfer policy – aquisitions and disposals
• Disciplining regulations and rules – players and directors
• Fraud protection
• Anti-money laundering
• Cost control regulation
• Transparency measures
• Diversity and community. forensic and fraud investigations
We provide forensic accountancy, investigatory and expert witness services to a number of clubs. Working in a partnership with the ‘Centre for Counter Fraud Studies’ at the University of Portsmouth, we are also able to help organisations to measure and reduce the cost of fraud. We deliver real financial benefits often achieving a 12:1 return on the cost of the work.

FD FOOTBALL SURVEY | 201434
BDO LEISURE AND HOSPITALITY
Alongside the Professional Sports Group, our team works with international businesses across the leisure industries, including betting & gaming, hotels, restaurants, bars & pubs, and travel & tourism.
betting & gaming
BDO has acted as auditors, tax advisers and consultants to many UK and international betting and gaming businesses, both private and publicly quoted. Our clients range from many of the major ‘bricks & mortar’ bookmaking and casino operators to major offshore telephone and internet sports books, casinos, poker and other online gaming activities. As well as the more traditional forms of betting and gaming, we also act for FCA regulated businesses in the financial trading, financial spread betting and CFD sector.
Specialist advice we can provide to the sector includes:
• Audit and assurance
• International tax planning and structuring
• Corporate financing and flotations
• Property and corporate acquisitions and disposals
• Financial Services Act regulations and compliance
• Installation of management reporting and controls and internal audit functions
• IT controls, environment reviews and systems improvement advice.
hotels
Our expertise covers the entire spectrum of investment and operating activities and our involvement brings credibility, competence and independence to any project. In short, if you are active in the hotel industry then you should be talking to BDO, the industry experts.
Specialist advice we can provide to the sector includes:
• Audit and assurance
• Feasibility studies
• Business valuations
• Litigation support and expert witness services
• Mergers and acquisitions including MBOs, MBIs and flotations
• Fund raising and refinancing
• Financial investigations and dispute resolutions
• Systems reviews
• Turnaround and distressed situations.
john barker stuart collins
020 7893 3980 [email protected]
020 7893 [email protected]

2014 | FD FOOTBALL SURVEY 35
restaurants, bars & pubs
BDO can help realise opportunities and value, and minimise the challenges associated within roll-out growth – just as we have helped numerous clients to do during our long established history as a leading adviser in this sector.
We have advised clients as diverse as international brands and national chains, to owner managed businesses and outlets looking to expand and/or diversify. Our expertise will assist whether you are the individual restaurateur, the group operator, the restaurant franchisor or franchisee.
Specialist advice we can provide for your sector includes:
• Audit and assurance
• BERR report, TRONCS, minimum wage legislation
• Tax efficient employee incentive plans
• Property issues and the associated stamp duty and capital allowances
• Business acquisitions
• Raising finance for business expansion – public and private, equity and debt
• Franchise advice.
travel & tourism
The travel sector has undergone some of the biggest changes we have witnessed to one particular industry over the last few years. It has been a roller-coaster ride of new entrants and new technology, consolidation and unpredicted new challenges to business, such as SARS and terrorism. BDO has helped its travel clients turn a turbulent time into one of opportunity.
Our commitment to this sector has seen us attract some of the best known names in the business – from owner managed private businesses through to large listed companies with international networks. BDO is an ABTA Travel Industry Partner and provides the section on Travel Agents and Tour Operators for Butterworth’s Financial Reporting and Accounting for Specialised Sectors. We have members on the ICAEW/ABTA Working Group instigated by ABTA and also on the ICAEW/CAA Working Group instigated by the CAA.
Specialist advice we can provide for your sector includes:
• Audit and assurance
• ATOL applications
• Tour Operator Margin Scheme
• Industry regulation and compliance
• Flotations, acquisitions and disposals
• Tax planning and compliance for the travel industry
• Business continuity planning.
david campbell dominic stammers
020 7893 [email protected]
020 7893 [email protected]


14-0
389
For more information please contact:
CHARLES BARNETT Partner, Professional Sports(SCOTLAND)
t: 0141 249 5233e: [email protected]
IAN CLAYDENPartner, Professional Sports(ENGLAND)
t: 020 7893 3612e: [email protected]
TREVOR BIRCHPartner, Professional Sports(BUSINESS RESTRUCTURING)
t: 020 7893 3733e: [email protected]
(See full of contacts on page 32)
This publication has been carefully prepared, but it has been written in general terms and should be seen as broad guidance only. The publication cannot be relied upon to cover specific situations and you should not act, or refrain from acting, upon the information contained therein without obtaining specific professional advice. Please contact BDO LLP to discuss these matters in the context of your particular circumstances. BDO LLP, its partners, employees and agents do not accept or assume any liability or duty of care for any loss arising from any action taken or not taken by anyone in reliance on the information in this publication or for any decision based on it.
BDO LLP, a UK limited liability partnership registered in England and Wales under number OC305127, is a member of BDO International Limited, a UK company limited by guarantee, and forms part of the international BDO network of independent member firms. A list of members’ names is open to inspection at our registered office, 55 Baker Street, London W1U 7EU. BDO LLP is authorised and regulated by the Financial Conduct Authority to conduct investment business.
BDO is the brand name of the BDO network and for each of the BDO Member Firms.
BDO Northern Ireland, a partnership formed in and under the laws of Northern Ireland, is licensed to operate within the international BDO network of independent member firms.
© August 2014 BDO LLP. All rights reserved.
www.bdo.co.uk