
BD OneFlow LST Application Guide
38
23-16165-01 9/2016 IVD Becton, Dickinson and Company BD Biosciences 2350 Qume Drive San Jose, CA 95131 USA Benex Limited Pottery Road, Dun Laoghaire, Co. Dublin, Ireland Tel +353.1.202.5222 Fax +353.1.202.5388 BD Biosciences European Customer Support Tel +32.2.400.98.95 Fax +32.2.401.70.94 [email protected] Becton Dickinson Pty Ltd. 4 Research Park Drive Macquarie University Research Park North Ryde, NSW 2113 Australia Becton Dickinson Limited, 8 Pacific Rise, Mt. Wellington, Auckland, New Zealand bdbiosciences.com [email protected] REP EC BD OneFlow™ LST Application Guide
Transcript of BD OneFlow LST Application Guide

23-16165-019/2016
IVD
Becton, Dickinson and Company BD Biosciences2350 Qume Drive San Jose, CA 95131 USA
Benex LimitedPottery Road, Dun Laoghaire, Co. Dublin, Ireland Tel +353.1.202.5222 Fax +353.1.202.5388
BD Biosciences European Customer SupportTel +32.2.400.98.95 Fax +32.2.401.70.94 [email protected]
Becton Dickinson Pty Ltd.4 Research Park Drive Macquarie University Research Park North Ryde, NSW 2113 Australia
Becton Dickinson Limited,8 Pacific Rise, Mt. Wellington, Auckland, New Zealand
REPEC
BD OneFlow™ LST Application Guide
Copyrights
© 2016, Becton, Dickinson and Company. All rights reserved. No part of this publication may be reproduced, transmitted, transcribed, stored in retrieval systems, or translated into any language or computer language, in any form or by any means: electronic, mechanical, magnetic, optical, chemical, manual, or otherwise, without prior written permission from BD Biosciences.
The information in this guide is subject to change without notice. BD Biosciences reserves the right to change its products and services at any time to incorporate the latest technological developments. Although this guide has been prepared with every precaution to ensure accuracy, BD Biosciences assumes no liability for any errors or omissions, nor for any damages resulting from the application or use of this information. BD Biosciences welcomes customer input on corrections and suggestions for improvement.
Trademarks
The EuroFlow trademark and logo and the EuroFlow™ antibody panels are property of the EuroFlow Consortium and cannot be reproduced or published without prior written permission from the EuroFlow coordinator (www.euroflow.org).
© 2016 BD. BD, the BD Logo and all other trademarks are property of Becton, Dickinson and Company.
Regulatory information
The BD FACSCanto II flow cytometer is a Class 1 Laser Product.
For In Vitro Diagnostic Use.
History
Revision Date Change made
23-16165-00 7/2014 Initial release
23-16165-01 9/2016 Updated with the LST v2.0 acquisition and analysis worksheets
Contents
Chapter 1: Overview 5
Overview of the BD OneFlow system . . . . . . . . . . . . . . . . . . . . . . . . . . . . . . . . . . 6
Workflows for the BD OneFlow LST . . . . . . . . . . . . . . . . . . . . . . . . . . . . . . . . . . 7
Chapter 2: Specimen preparation 9
Washing the specimen . . . . . . . . . . . . . . . . . . . . . . . . . . . . . . . . . . . . . . . . . . . . . 10
Staining the specimen . . . . . . . . . . . . . . . . . . . . . . . . . . . . . . . . . . . . . . . . . . . . . 11
Chapter 3: Sample acquisition 13
Setting up the experiment . . . . . . . . . . . . . . . . . . . . . . . . . . . . . . . . . . . . . . . . . . 14
Acquiring the stained sample . . . . . . . . . . . . . . . . . . . . . . . . . . . . . . . . . . . . . . . 20
Chapter 4: Data analysis 25
Analyzing the data using BD FACSDiva software . . . . . . . . . . . . . . . . . . . . . . . . 26
Chapter 5: Troubleshooting 35


1 Overview
This chapter covers the following topics:
• Overview of the BD OneFlow system (page 6)
• Workflows for the BD OneFlow LST (page 7)

BD OneFlow LST Application Guide6
Overview of the BD OneFlow systemAbout the system The BD OneFlow™ system provides a comprehensive set of
reagents and protocols to reproducibly set up the flow cytometer and stain patient specimens. The consistent instrument setup and sample staining enable you to acquire and analyze patient specimens for immunophenotyping of normal and aberrant cell populations in a manner compatible with that prescribed by the EuroFlow™ Consortium.
The BD OneFlow™ LST tube is used to stain patient specimens. The stained samples are acquired on the cytometer and then analyzed to identify normal and aberrant mature lymphocyte populations of B, T, and NK lineages.
Materials needed • BD OneFlow LST
– Catalog No. 658619
• BD FACSDiva™ CS&T IVD beads (CS&T IVD beads)
– Catalog No. 656046 or 656047
• BD OneFlow™ Setup Beads
– Catalog No. 658620
• BD™ FC Beads 8-color kit for BD OneFlow™ Assays (BD FC beads)
– Catalog No. 658621
• Templates installer CD for BD OneFlow™ Assays
– Catalog No. 659305
• BD FACS™ lysing solution
– Catalog No. 349202
• BD FACSCanto™ II flow cytometer with a 3-laser, 8-color, 4-2H-2V BD default optical configuration, running BD FACSDiva™ software v8.0.1 or later

Chapter 1: Overview 7
Workflows for the BD OneFlow LSTSpecimen preparation
Sample acquisition
TaskReagents or materials
Template needed Outcome
Washing the specimen
Patient specimen
Wash buffer
None Washed patient specimen is ready for staining.
Staining the specimen
BD OneFlow LST
BD FACS lysing solution
Wash buffer
None Stained patient specimen is ready for acquisition.
TaskReagents or materials
Template needed Outcome
Import the OneFlow LST template.
None OneFlow LST The OneFlow LST template is imported into an experiment and application settings are applied.
Acquiring the stained sample
Stained patient sample
BD OneFlow LST Acquisition worksheet
The FCS file is generated.

BD OneFlow LST Application Guide8
Data analysis
TaskReagents or materials
Template needed Outcome
Analyzing the data using BD FACSDiva software
FCS file for patient sample
BD OneFlow LST Analysis worksheet
Patient lymphocyte populations are identified.

2Specimen preparation
This chapter covers the following topics:
• Washing the specimen (page 10)
• Staining the specimen (page 11)

BD OneFlow LST Application Guide10
Washing the specimenAbout the specimens
This procedure works for peripheral blood (PB), bone marrow (BM), and lymph node (LN) specimens. Collect PB and BM specimens in EDTA- or heparin-containing blood collection tubes (for example, BD Vacutainer® tubes). For LN tissue, follow your current lab protocol to prepare a single-cell suspension. Staining from 3 × 10⁴ to 4 × 10⁶ white blood cells using BD OneFlow LST gives equivalent results.
BD OneFlow LST contains antibodies which recognize Igκ and Igλ found on the surface of B cells. Therefore, to avoid interference from serum antibodies found in the specimen, you must prewash the specimen three times before you stain it using BD OneFlow LST.
Washing the specimen
1. For each specimen, label a 15-mL conical tube with the specimen ID.
2. Invert the specimen in the collection tube 10 times to mix well.
3. Add 300 µL of the patient specimen to the labeled conical tube.
4. Add 10 mL of wash buffer (filtered PBS + 0.5% BSA + 0.09% or 0.1% sodium azide).
5. Invert the tube 3–5 times to mix well.
6. Centrifuge at 540g for 5 minutes at 20°C–25°C.
7. Remove the supernatant without disturbing the cell pellet.
8. Vortex the tube until no cell aggregates remain before adding wash buffer.
9. Repeat steps 4–8 twice for a total of three washes.

Chapter 2: Specimen preparation 11
10. Resuspend the cell pellet in 200 µL of wash buffer to give a final volume of approximately 300 µL.
Note: Start staining the specimen using the BD OneFlow LST within 30 minutes of the last wash. Store the washed specimen at 20°C–25°C until you stain it.
Staining the specimenAbout the dried reagent
BD OneFlow LST is very sensitive to moisture. To avoid condensation, open the pouch only if it is at room temperature. Ensure the pouch is completely resealed after removing a tube. Do not remove the desiccant from the reagent pouch.
Write the current date on the pouch label when it is first opened. Use all of the tubes from that pouch before opening the next one.
Diluting BD FACS lysing solution
Dilute the 10X concentrate 1:10 with room temperature (20°C–25°C) deionized water. The prepared solution is stable for 1 month when stored in a glass or high density polyethylene (HDPE) container at room temperature.
Staining the specimen
1. If the pouch is stored refrigerated, allow it to reach room temperature before opening it.
2. Open the pouch and remove a tube for each patient specimen.
3. Place the tubes in a rack, protected from light.
4. Immediately reseal the pouch with any unused tubes.
5. Write the patient ID on the BD OneFlow LST label within the area provided.
6. Vortex the washed specimen 3–5 seconds to mix well.
7. Add 100 µL of washed patient specimen to the tube. Vortex vigorously 3–5 seconds to mix well.

BD OneFlow LST Application Guide12
If less than 100 µL of specimen is used, add wash buffer to a final volume of 100 µL.
Note: Do not wipe the outside of the tube with ethanol or isopropanol because the ink on the printed label can run.
8. Incubate for 30 minutes at 20°C–25°C, protected from light.
9. Add 2 mL of 1X BD FACS lysing solution to each tube. Vortex 3–5 seconds to mix well.
10. Incubate for 10 minutes at 20°C–25°C, protected from light.
11. Centrifuge at 540g for 5 minutes at 20°C–25°C.
12. Remove the supernatant without disturbing the cell pellet, leaving approximately 50 µL of residual liquid in the tube.
13. Vortex vigorously until the cell pellet is completely resuspended.
14. Add 2 mL of wash buffer (filtered PBS + 0.5% BSA + 0.09% or 0.1% sodium azide) to each tube. Vortex 3–5 seconds to mix well.
15. Centrifuge at 540g for 5 minutes at 20°C–25°C.
16. Remove the supernatant without disturbing the cell pellet, leaving approximately 50 µL of residual liquid in the tube.
17. Vortex 3–5 seconds to resuspend the cell pellet.
18. Add 200 µL of wash buffer to each tube. Vortex 3–5 seconds to mix well.
Next step Specimens should be acquired immediately after staining. If a longer period of time is desired, each laboratory should validate that stained specimens acquired after being held under their storage conditions produce equivalent results to specimens acquired immediately after staining. Protect stained specimens from light until they are acquired.

3Sample acquisition
This chapter covers the following topics:
• Setting up the experiment (page 14)
• Acquiring the stained sample (page 20)

BD OneFlow LST Application Guide14
Setting up the experimentAbout linking and unlinking compensation
When you create a new experiment you must apply the correct application settings. Before applying the correct application settings you first link the appropriate compensation matrix to it and then unlink the compensation matrix. Unlinking the compensation matrix allows updated application settings to be applied, thus giving photomultiplier tube voltages (PMTVs) that will result in correct target median fluorescence intensity (MFI) values, while retaining compensation values. When you apply the application settings you keep the compensation value.
Before you begin 1. In BD FACSDiva software v.8.0.1, or later, ensure that cytometer warmup is complete, fluidics startup has been performed, and that the cytometer is in the default 4-2H-2V configuration.
2. Verify that the daily performance check was completed and passed for the default 4-2H-2V configuration using CS&T IVD beads within the past 24 hours. See the Instrument Setup Guide for BD OneFlow™ Assays.
3. Recommended: confirm that the PMTVs are still within their daily target ranges. See the chapter for daily setup in the Instrument Setup Guide for BD OneFlow™ Assays.
4. Make sure that you have installed the OneFlow LST template. See the Instrument Setup Guide for BD OneFlow™ Assays or the BD OneFlow™ LST Instructions for Use.
Setting up the experiment
1. Create a new experiment.
a. From the menu bar, select Experiment > New Experiment > Blank Experiment. Click OK.
Note: Alternatively, create an experiment using the Experiment icon in the Browser.
b. If prompted by the CST Mismatch window, select Use CST Settings.

Chapter 3: Sample acquisition 15
c. Rename the experiment according to your laboratory practice.
2. Link compensation.
a. In the Browser, right-click Cytometer Settings.
b. From the menu, select Link Setup.
c. Select the appropriate compensation matrix created using BD FC beads within the past 31 days. Click Link.
d. If prompted by the Cytometer Settings Mismatch window, select Overwrite.
3. Unlink compensation.
a. In the Browser, right-click Cytometer Settings.

BD OneFlow LST Application Guide16
b. From the menu, select Unlink From and select the previously linked compensation setup.
c. From the Confirm dialog that opens, click OK to unlink from the previously linked compensation setup.
4. Apply application settings.
a. In the Browser, right-click Cytometer Settings.
b. From the menu, select Application Settings > Apply.
c. Select the most recent application settings. Click Apply.
Note: Confirm that the most recent application settings were created within the past 31 days using the BD OneFlow Setup beads. They are created in the monthly setup as described in the Instrument Setup Guide for BD OneFlow™ Assays.

Chapter 3: Sample acquisition 17
d. When prompted by the Confirm dialog, select Keep the compensation value.
e. If prompted by the Confirm Cytometer Changes dialog, click Yes to overwrite the cytometer values for FSC Area Scaling.
5. Import the OneFlow LST template.
a. Select the experiment in the Browser and then select Experiment > New Specimen from the menu bar.
The Panel Templates dialog opens.
b. Navigate to the BD Panels tab and select the OneFlow LST template.

BD OneFlow LST Application Guide18
c. Indicate the number of patient specimens you want to acquire using the Copies field.
d. Click OK.
e. Rename each specimen, for example, with the appropriate patient ID in front of the specimen name.
Note: If you have to rerun a particular patient specimen, set the current tube pointer to the OneFlow LST tube you wish to rerun. Click Next Tube in the Acquisition Dashboard to create another tube for that patient. Do not use the new tube icon to create the additional tube.

Chapter 3: Sample acquisition 19
z 6. Confirm that all of the voltages are the same as those set as application settings.
a. In the Browser, select the application settings that you want to confirm.
b. In the Inspector, navigate to the Parameters tab to view the voltages in the application settings.
c. From the menu bar, select Cytometer > Catalogs.
The Catalogs dialog opens.
d. Navigate to the Application Settings tab.
e. Select the application settings used in the current experiment. Click View.
f. Confirm that the voltages in the catalog are the same as those in the application settings.
g. Click Close in the Catalogs dialog.
Note: If you want to acquire additional patient samples in the experiment, repeat step 5 to add new specimens. Two Confirm dialogs will open asking if you want to create another LST Acquisition worksheet or another LST Analysis worksheet. Click Cancel in each dialog.
7. Scan the barcode on the tube label into the Product ID keyword field.
a. From the menu bar, select Experiment > Experiment Layout and navigate to the Keywords tab.

BD OneFlow LST Application Guide20
b. Highlight the Product ID keyword for the appropriate tube, and scan the barcode on the BD OneFlow LST tube label.
Note: If you cannot scan the barcode on the tube label, see Troubleshooting.
c. Manually add the appropriate information to the remaining keywords, as needed.
d. Click OK to close the Experiment Layout.
Acquiring the stained sampleAcquiring the tube 1. In the Browser, expand the appropriate specimen and set the
current tube pointer to that tube.
2. Select the BD OneFlow LST Acquisition worksheet tab.
3. Vortex the stained tube 3–5 seconds at low speed.
4. Install the tube on the cytometer. Adjust the flow rate to Medium in the Acquisition Dashboard. Click Acquire Data.
5. Verify that the population is on scale and adjust the gate in the first plot of the LST acquisition worksheet to exclude debris, if needed.

Chapter 3: Sample acquisition 21
6. Click Record Data in the Acquisition Dashboard to collect total events.
Note: The template automatically collects 100,000 total events. Use the menu in the Acquisition Dashboard to select a different number of events to acquire, if needed. Collecting total events from 3 ×10⁴ to 4 ×10⁶ stained cells gives equivalent results.
Inspecting the LST acquisition worksheet
1. Select the BD OneFlow LST Acquisition worksheet tab.
2. Inspect the dot plots on the LST acquisition worksheet and adjust the gates as needed.
The FSC-A vs SSC-A dot plot is used to identify cells.
The CD45 V500-A vs SSC-A dot plot contains two gates to identify leukocytes and lymphocytes. T cells and B cells are identified in the CD3 APC-A vs CD19+TCRgd PE-Cy7-A dot plot from the lymphocyte population.
T cells are divided into TCRγ/δ+ and TCRγ/δ– populations in the CD3 APC-A vs CD19+TCRgd PE-Cy7-A dot plot from the T-cell population. TCRγ/δ– cells are divided into CD8+CD4– and CD4+CD8– populations in the CD20+CD4 V450-A vs CD8+IgL FITC-A dot plot.
Igλ- and Igκ-expressing B cells are identified in the CD56+IgK PE-A vs CD8+IgL FITC-A dot plot from the B-cell population.
NK cells are identified from the NOT(T cells OR B cells) population in the CD45 V500-A vs CD56+IgK PE-A dot plot.

BD OneFlow LST Application Guide22
The remaining dot plots do not contain gates and are included to ensure that the antibodies can stain cells in the specimen, therefore serving as an internal quality control for the tube.
3. Continue until all of the tubes have been acquired.

Chapter 3: Sample acquisition 23
4. From the menu bar, select File > Export > Experiments, and select the Directory Export option. Click OK.

This page intentionally left blank

4Data analysis
This chapter covers the following topic:
• Analyzing the data using BD FACSDiva software (page 26)

BD OneFlow LST Application Guide26
Analyzing the data using BD FACSDiva softwareAbout the dot plots Some of the dot plots might look different from those in other
experiments. The initial FSC-A vs SSC-A dot plot to identify cells and eliminate debris may appear compressed. This is due to the FSC and SSC target values used to create the application settings. The values are specified by the EuroFlow Consortium.
Analyzing BD OneFlow LST
1. From the menu bar, select File > Import > Experiments.
2. Select the experiment that you want to analyze. Click Import.
The experiment with the associated acquisition and analysis worksheets opens.
3. Select the BD OneFlow LST Analysis worksheet tab.
4. Inspect the plots on page 1 of the LST analysis worksheet and adjust the gates as needed.
Note: Enlarge the plot while adjusting the gates so you can more readily see the populations of interest.
The first three dot plots on page 1 of the analysis worksheet identify cells, FSC singlets, and SSC singlets. Debris and doublets are excluded by adjusting the gates.
Examine the leukocyte and lymphocyte populations in the CD45 V500-A vs SSC-A dot plot.
Examine the B-cell and T-cell populations in the CD3 APC-A vs CD19+TCRgd PE-Cy7-A dot plot from the lymphocyte population. Examine the TCRγ/δ+ and TCRγ/δ– populations in the CD3 APC-A vs CD19+TCRgd PE-Cy7-A dot plot from the T-cell population. The CD38 FITC-A vs SSC-A dot plot is included for informational purposes to allow for the visualization of CD38+ cells.
Chapter 4: Data analysis 27
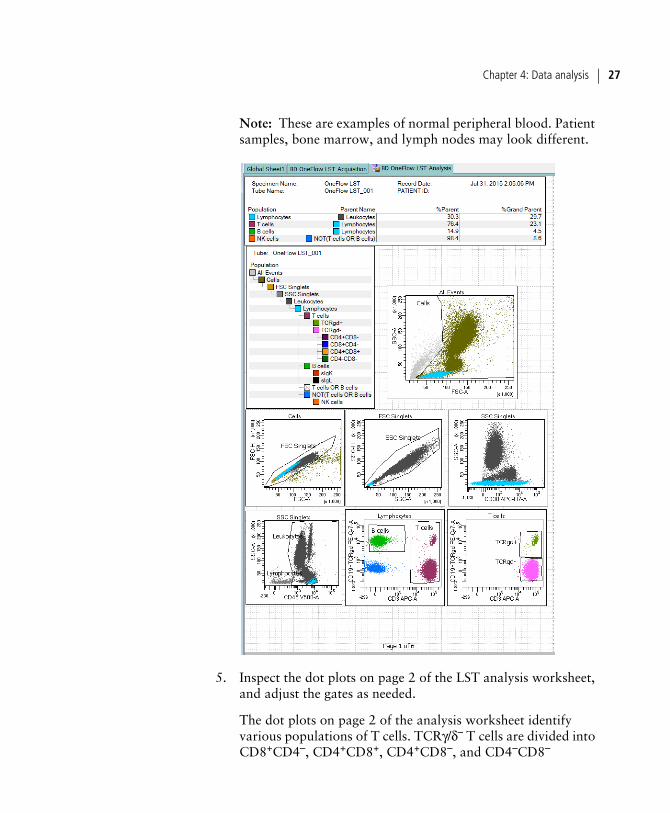
Note: These are examples of normal peripheral blood. Patient samples, bone marrow, and lymph nodes may look different.
5. Inspect the dot plots on page 2 of the LST analysis worksheet, and adjust the gates as needed.
The dot plots on page 2 of the analysis worksheet identify various populations of T cells. TCRγ/δ– T cells are divided into CD8+CD4–, CD4+CD8+, CD4+CD8–, and CD4–CD8–

BD OneFlow LST Application Guide28
populations in the CD20+CD4 V450-A vs CD8+IgL FITC-A dot plot.
Note: The CD4+ and CD8+ populations of T cells might trail into the double positive quadrant instead of being discrete populations. This is a consequence of the panel of antibodies present in BD OneFlow LST.

Chapter 4: Data analysis 29
The remaining dot plots further characterize TCRγ/δ– and TCRγ/δ+ cells using various markers.
6. Inspect the dot plots on page 3 of the LST analysis worksheet and adjust the gates as needed.
The dot plots on page 3 of the analysis worksheet identify B cells. B cells are initially identified as being CD3–CD19+.

BD OneFlow LST Application Guide30
Examine the level of CD20 expression in the CD19+TCRgd PE-Cy7-A vs CD20+CD4 V450-A dot plot.
Examine the ratio of Igκ- to Igλ-expressing B cells in the CD56+IgK PE-A vs CD8+IgL FITC-A dot plot.
The remaining dot plots further characterize B cells using various markers.

Chapter 4: Data analysis 31
7. Inspect the dot plots on page 4 of the LST analysis worksheet and adjust the gates as needed.
The dot plots on page 4 of the analysis worksheet identify NK cells. NK cells are identified from the NOT(T cells OR B cells) population in the CD45 V500-A vs CD56+IgK PE-A dot plot.

BD OneFlow LST Application Guide32
The remaining dot plots further characterize NK cells using various markers.
8. Examine the results in the statistics box on page 5 of the LST analysis worksheet.
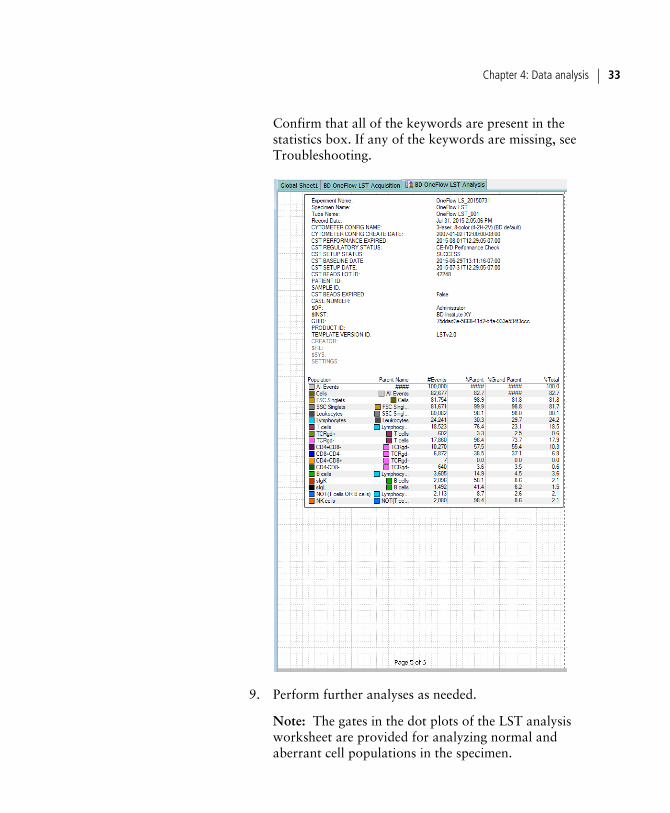
Chapter 4: Data analysis 33
Confirm that all of the keywords are present in the statistics box. If any of the keywords are missing, see Troubleshooting.
9. Perform further analyses as needed.
Note: The gates in the dot plots of the LST analysis worksheet are provided for analyzing normal and aberrant cell populations in the specimen.

BD OneFlow LST Application Guide34
10. Save the LST analysis worksheet as a PDF.
Note: The LST analysis worksheet is a global worksheet. Any gates that are adjusted when analyzing a sample on a global worksheet will be changed in previously analyzed files. Previously saved PDFs won’t change, but if you go back to a previously analyzed global worksheet, you will have to readjust the gates so they match what they were before.
11. (Optional) Click Print to print the LST analysis worksheet.
12. Analyze the next sample.
5Troubleshooting
This chapter covers the following topics:
• Templates do not import correctly (page 36)
• Problems using BD OneFlow LST (page 36)

BD OneFlow LST Application Guide36
Templates do not import correctly
You may observe that templates do not import correctly. For example, there might not be dot plots in the global worksheet, the plots from the wrong worksheet appear when you import a panel template, or the imported panel template does not include tubes.
If you suspect that the templates did not import correctly:
1. Close the current experiment.
2. Create a new experiment.
3. Re-import the panel template.
Problems using BD OneFlow LST Problem Possible cause Solution
The resolution between debris and lymphocytes is poor.
Specimen was poorly lysed.
Prepare and stain another specimen.
Specimen is of poor quality.
Check cell viability.
Specimen is too old. Obtain a new specimen and stain it immediately.
Instrument settings are inappropriate.
Follow proper instrument setup procedures. See the Instrument Setup Guide for BD OneFlow™ Assays.
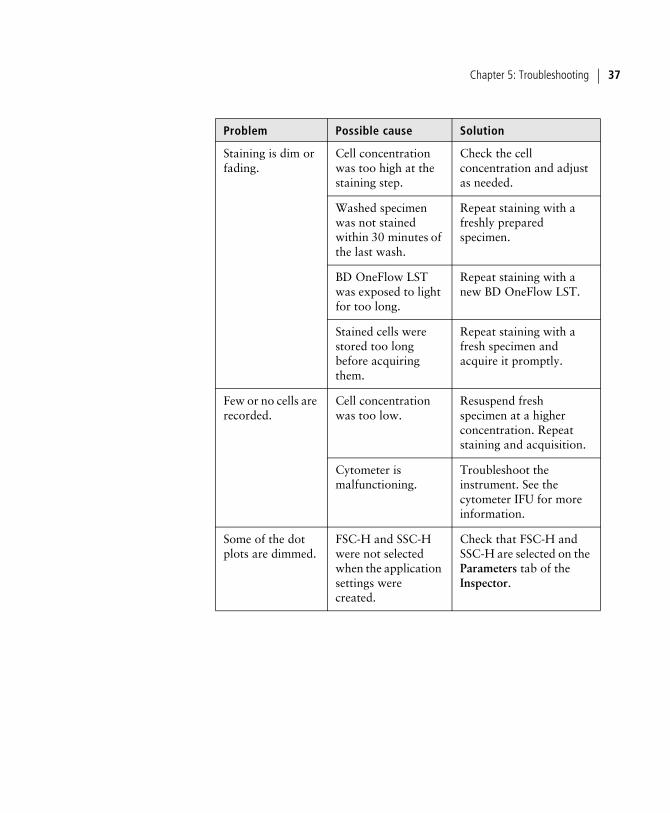
Chapter 5: Troubleshooting 37
Staining is dim or fading.
Cell concentration was too high at the staining step.
Check the cell concentration and adjust as needed.
Washed specimen was not stained within 30 minutes of the last wash.
Repeat staining with a freshly prepared specimen.
BD OneFlow LST was exposed to light for too long.
Repeat staining with a new BD OneFlow LST.
Stained cells were stored too long before acquiring them.
Repeat staining with a fresh specimen and acquire it promptly.
Few or no cells are recorded.
Cell concentration was too low.
Resuspend fresh specimen at a higher concentration. Repeat staining and acquisition.
Cytometer is malfunctioning.
Troubleshoot the instrument. See the cytometer IFU for more information.
Some of the dot plots are dimmed.
FSC-H and SSC-H were not selected when the application settings were created.
Check that FSC-H and SSC-H are selected on the Parameters tab of the Inspector.
Problem Possible cause Solution

BD OneFlow LST Application Guide38
The barcode on the tube label cannot be scanned.
The barcode on the tube label has been compromised.
Scan the barcode on the BD OneFlow pouch label into the Product ID keyword field in the Experiment Layout. Next, after the last digit of the barcode, manually enter a semicolon (;) followed by the six-digit tube-specific ID, found adjacent to the barcode on the tube label.
Some of the keywords are missing from the statistics box in the analysis worksheet.
BD FACSDiva software did not import all of the keywords into the panel template.
1. Navigate to the analysis worksheet.
2. Right-click the statistics box and select Edit Stats View.
3. In the Header tab, select the All checkbox.
4. Click OK.
The statement, For in vitro diagnostic use, does not appear in the footer of the analysis worksheet when it is printed.
The paper margins in the printer settings were changed.
1. From the BD FACSDiva software menu bar, select File > Page Setup.
2. Ensure that all of the margins are set to 2.54 cm or 1 inch, depending on your default standards.
3. Click OK.
Problem Possible cause Solution


