BD FACSDiVa Option - BD Biosciences · 1B 1. Introduction The BD FACSDiVa option for the BD...
22
Author Ben Verwer BD FACSDiVa Option White Paper BD Biosciences Clontech Discovery Labware Immunocytometry Systems Pharmingen
Transcript of BD FACSDiVa Option - BD Biosciences · 1B 1. Introduction The BD FACSDiVa option for the BD...
Author Ben Verwer
BD FACSDiVa Option
White Paper
BD BiosciencesClontechDiscovery LabwareImmunocytometry SystemsPharmingen
1Bwww.bdbiosciences.com
1. Introduction
The BD FACSDiVa option for the BD FACSVantage SE flow cytometer
digitizes the amount of light created by particles passing through one
or more laser beams. However, the BD FACSDiVa option does this earlier
and more directly than any other commercial flow cytometer.
The BD FACSDiVa option digitizes signals at a rate of 10 million times per
second into 16,384 discrete levels. As a result, logarithmic amplifiers and
the traditional analog peak-and-hold circuits are no longer required. This has
two main advantages: inaccuracies introduced by the logarithmic amplifiers
are eliminated (noise and deviations from a perfectly logarithmic response),
and there is no longer any electronic dead time, the time during which the
cytometer is processing data and cannot digitize any additional particles.
The BD FACSDiVa option was designed as an integrated hardware/soft-
ware platform and introduces a number of additional benefits not direct-
ly related to the digital nature of the system: compensation between any
two channels from any two lasers, ratio calculations between any two
channels from any two lasers, four-way sorting, and a completely new
software platform and graphical user interface.
This white paper describes the hardware architecture, how the electronics
digitize the data (Section 2), the compensation methodology (Section 3),
and how the electronics process data during sorting (Section 4). Illustrative
data is presented in Sections 3 and 4.
1 www.bdbiosciences.com
2. Digitization
2.1 Sampling
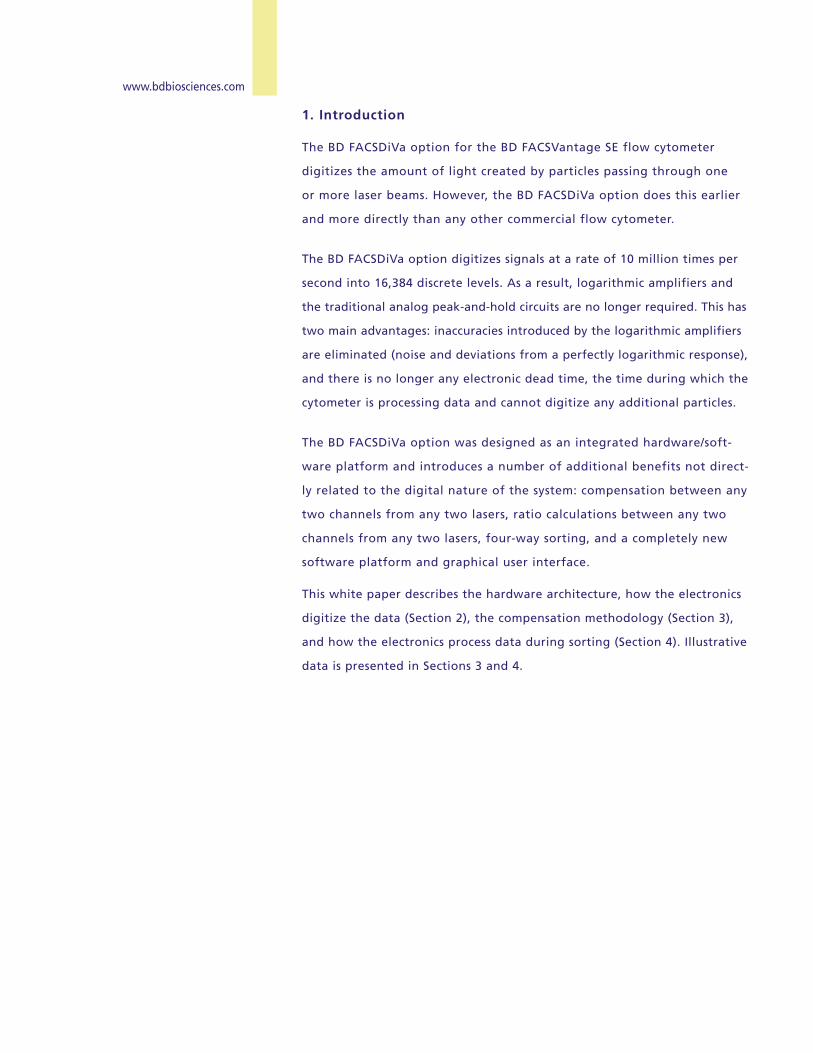
Figure 1 shows analog signals from two spatially separated lasers: three channels (FSC/SSC/FITC) from a blue laser and a fourth channel (APC) from a red laser at a later point in time. The voltage corresponding to each signal is digitized into one of 16,384 possible levels 10 million times per second byanalog-to-digital (A/D) converters. Signals are continuously digitized duringnormal operation, whether a pulse is present or not, and all digitized signalsare represented as numbers in memory.
BD FACSDiVa electronics create an enormous amount of data, about 1,000 MBof data every minute. Therefore, new data continuously displaces old data and is kept in memory only for a short amount of time (approximately 0.5 msec).
To process signals from a single event passing sequentially through two ormore lasers, data from the earlier lasers is delayed with respect to the lastlaser. When a single event is processed, the data in different channels isaligned even when acquired at different times.
Figure 1
Signal generation and processing:
digitization, lower left, sampling,
lower right. Number of lines for
illustration only (16,384 levels
and 1 sample every 0.1 µsec)
2www.bdbiosciences.com
FL1
FL2
FL3
FL4
FL5
SSC
FL6
FL7
FL8
FSC SSC FL1 FL2
A/D A/D A/D A/D
RAM RAM RAM RAM
FPGA FPGA FPGA FPGA
DSP
acquisition board
FL7 FL8 (FL9) (FL10)
A/D A/D A/D A/D
RAM RAM RAM RAM
FPGA FPGA FPGA FPGA
DSP
acquisition board
FL3 FL4 FL5 FL6
A/D A/D A/D A/D
RAM RAM RAM RAM
FPGA FPGA FPGA FPGA
DSP
acquisition board
master board
sort head workstation
droplet board
embedded computer
DSP2 gating
DSP3 sorting
DSP1 comp
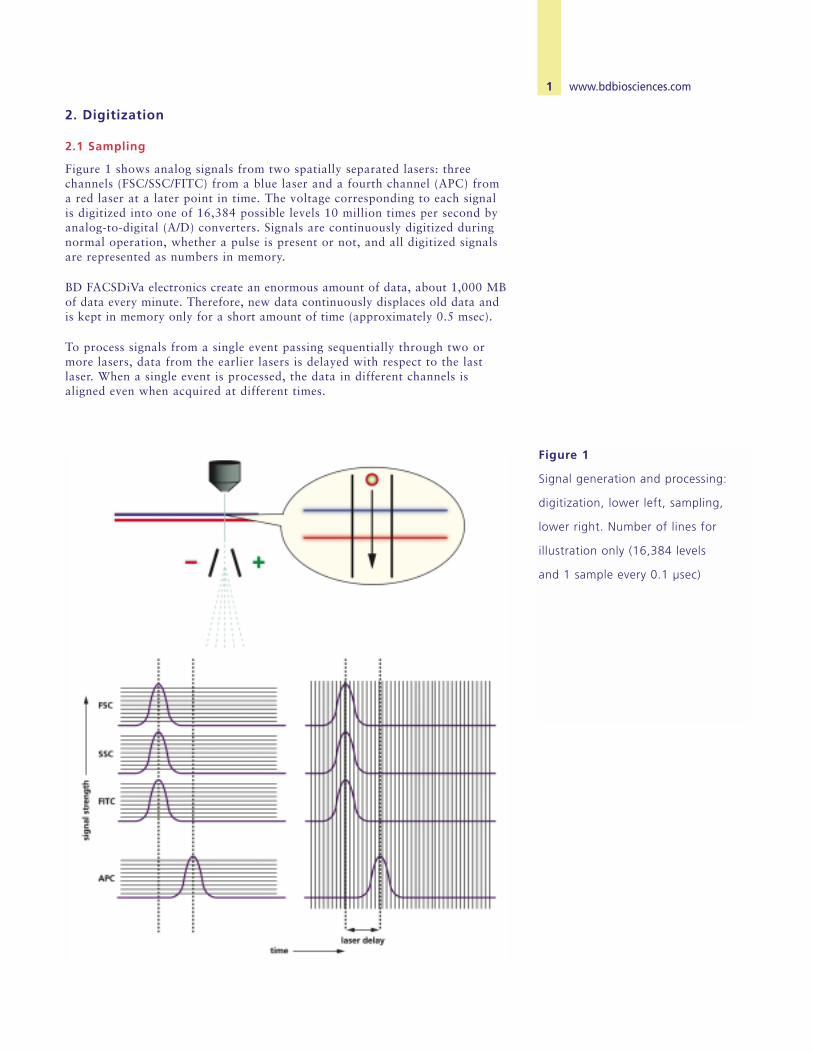
Figure 2
Data flow
3 www.bdbiosciences.com
2.2 Data Flow
Figure 2 shows the hardware architecture that implementsdigital processing. Signals from the photomultiplier tubes(PMTs) travel to acquisition boards. Each acquisition board can handle up to four input channels. For every inputchannel there is an A/D converter running continuously at10 MHz that converts the input into digital data and storesthe data in memory (dual-port RAM).
Digital data is first processed by field programmable gatearrays (FPGA) that compute area and height for each pulsebased on a global thresholding circuit. Area and heightmeasurements are relayed to a single digital signal processor (DSP) on each acquisition board. This DSP is indirect contact with the first of three additional DSPs thatreside on the master board.
The first DSP on the master board collects the data from all the input channels, performs compensation, calculatesratios, and sends the data to a second DSP for sorting andto an embedded computer for transfer to the host computer.The embedded computer communicates with the host computer and controls the system hardware (PMT voltages,droplet generation).
Sorting is performed by the second and third DSPs. The second performs log lookup and gating; the thirdclassifies drops. Once a drop is classified, the system will wait an appropriate amount of time (the drop delay)before charging the drop packet containing the event ofinterest (see Section 4).
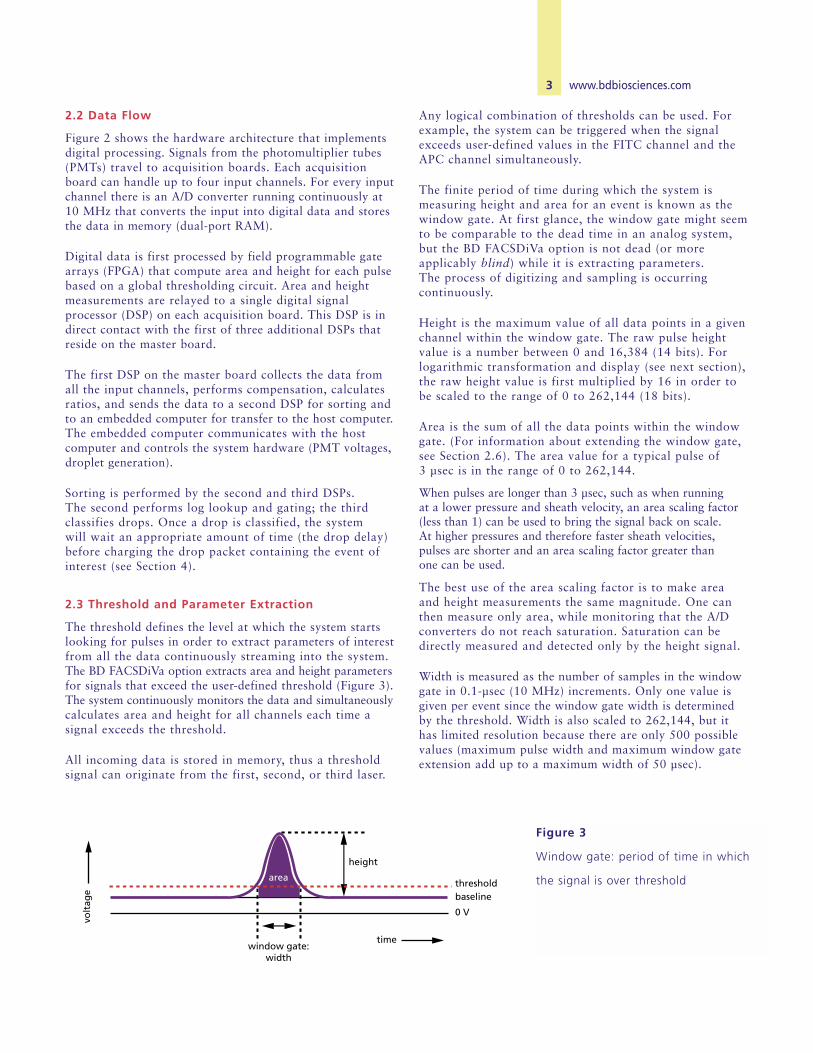
2.3 Threshold and Parameter Extraction
The threshold defines the level at which the system startslooking for pulses in order to extract parameters of interestfrom all the data continuously streaming into the system.The BD FACSDiVa option extracts area and height parametersfor signals that exceed the user-defined threshold (Figure 3).The system continuously monitors the data and simultaneouslycalculates area and height for all channels each time a signal exceeds the threshold.
All incoming data is stored in memory, thus a thresholdsignal can originate from the first, second, or third laser.
Any logical combination of thresholds can be used. Forexample, the system can be triggered when the signalexceeds user-defined values in the FITC channel and theAPC channel simultaneously.
The finite period of time during which the system is measuring height and area for an event is known as thewindow gate. At first glance, the window gate might seemto be comparable to the dead time in an analog system,but the BD FACSDiVa option is not dead (or more applicably blind) while it is extracting parameters. The process of digitizing and sampling is occurring continuously.
Height is the maximum value of all data points in a givenchannel within the window gate. The raw pulse heightvalue is a number between 0 and 16,384 (14 bits). Forlogarithmic transformation and display (see next section),the raw height value is first multiplied by 16 in order tobe scaled to the range of 0 to 262,144 (18 bits).
Area is the sum of all the data points within the windowgate. (For information about extending the window gate,see Section 2.6). The area value for a typical pulse of 3 µsec is in the range of 0 to 262,144.
When pulses are longer than 3 µsec, such as when running at a lower pressure and sheath velocity, an area scaling factor(less than 1) can be used to bring the signal back on scale. At higher pressures and therefore faster sheath velocities, pulses are shorter and an area scaling factor greater than one can be used.
The best use of the area scaling factor is to make areaand height measurements the same magnitude. One canthen measure only area, while monitoring that the A/Dconverters do not reach saturation. Saturation can bedirectly measured and detected only by the height signal.
Width is measured as the number of samples in the windowgate in 0.1-µsec (10 MHz) increments. Only one value isgiven per event since the window gate width is determinedby the threshold. Width is also scaled to 262,144, but ithas limited resolution because there are only 500 possiblevalues (maximum pulse width and maximum window gateextension add up to a maximum width of 50 µsec).
Figure 3
Window gate: period of time in which
the signal is over threshold
timewindow gate:
width
area
volt
age
height
thresholdbaseline
0 V
4www.bdbiosciences.com
2.4 Log Lookup
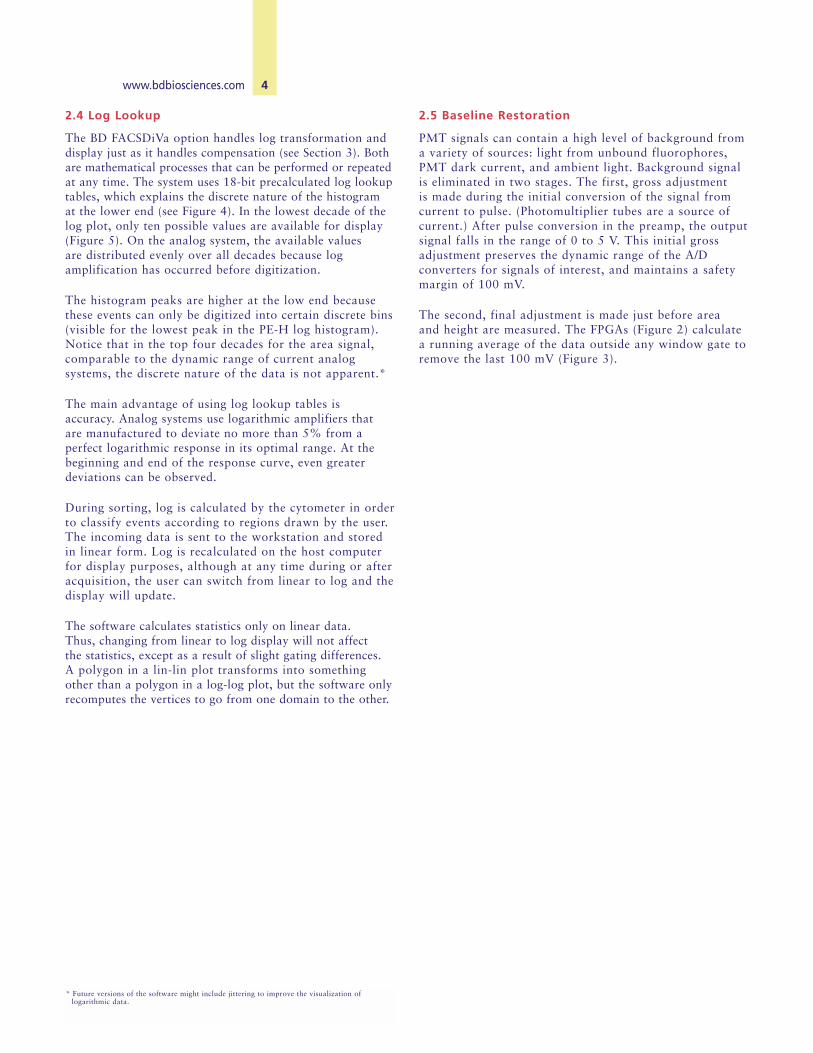
The BD FACSDiVa option handles log transformation and display just as it handles compensation (see Section 3). Bothare mathematical processes that can be performed or repeatedat any time. The system uses 18-bit precalculated log lookuptables, which explains the discrete nature of the histogram at the lower end (see Figure 4). In the lowest decade of thelog plot, only ten possible values are available for display(Figure 5). On the analog system, the available values are distributed evenly over all decades because log amplification has occurred before digitization.
The histogram peaks are higher at the low end because these events can only be digitized into certain discrete bins (visible for the lowest peak in the PE-H log histogram).Notice that in the top four decades for the area signal,comparable to the dynamic range of current analog systems, the discrete nature of the data is not apparent.*
The main advantage of using log lookup tables is accuracy. Analog systems use logarithmic amplifiers that are manufactured to deviate no more than 5% from a perfect logarithmic response in its optimal range. At thebeginning and end of the response curve, even greater deviations can be observed.
During sorting, log is calculated by the cytometer in orderto classify events according to regions drawn by the user.The incoming data is sent to the workstation and storedin linear form. Log is recalculated on the host computerfor display purposes, although at any time during or afteracquisition, the user can switch from linear to log and thedisplay will update.
The software calculates statistics only on linear data. Thus, changing from linear to log display will not affect the statistics, except as a result of slight gating differences. A polygon in a lin-lin plot transforms into something other than a polygon in a log-log plot, but the software onlyrecomputes the vertices to go from one domain to the other.
2.5 Baseline Restoration
PMT signals can contain a high level of background froma variety of sources: light from unbound fluorophores,PMT dark current, and ambient light. Background signalis eliminated in two stages. The first, gross adjustment is made during the initial conversion of the signal fromcurrent to pulse. (Photomultiplier tubes are a source ofcurrent.) After pulse conversion in the preamp, the outputsignal falls in the range of 0 to 5 V. This initial grossadjustment preserves the dynamic range of the A/D converters for signals of interest, and maintains a safetymargin of 100 mV.
The second, final adjustment is made just before area and height are measured. The FPGAs (Figure 2) calculatea running average of the data outside any window gate toremove the last 100 mV (Figure 3).
* Future versions of the software might include jittering to improve the visualization of logarithmic data.
5 www.bdbiosciences.com
105102 103 104
PE-A
Log
Co
un
t1
20
34
5
105102 103 104
PE-H
Log
Co
un
t50
010
000
1,50
02,
000
2,50
03,
000
3,50
0
200 25050 100 150
PE-A
Lin
Co
un
t1
20
34
56
7
PE-H
Lin
Co
un
t1
20
34
5
200 25050 100 150
Figure 5
On the digital system, data is digitized before log transformation and display.
At the low end, fewer possible values can be measured.
Figure 4
Linear and log display of height and area signals
max: 262,144
1 10 102
103
104
105
1 10 102
103
104
shown on plots
digital system analog system
9 va
lues
90 v
alue
s
900
valu
es
9,00
0 va
lues
90,0
00 v
alue
s
256
valu
es
256
valu
es
256
valu
es
256
valu
es
6www.bdbiosciences.com
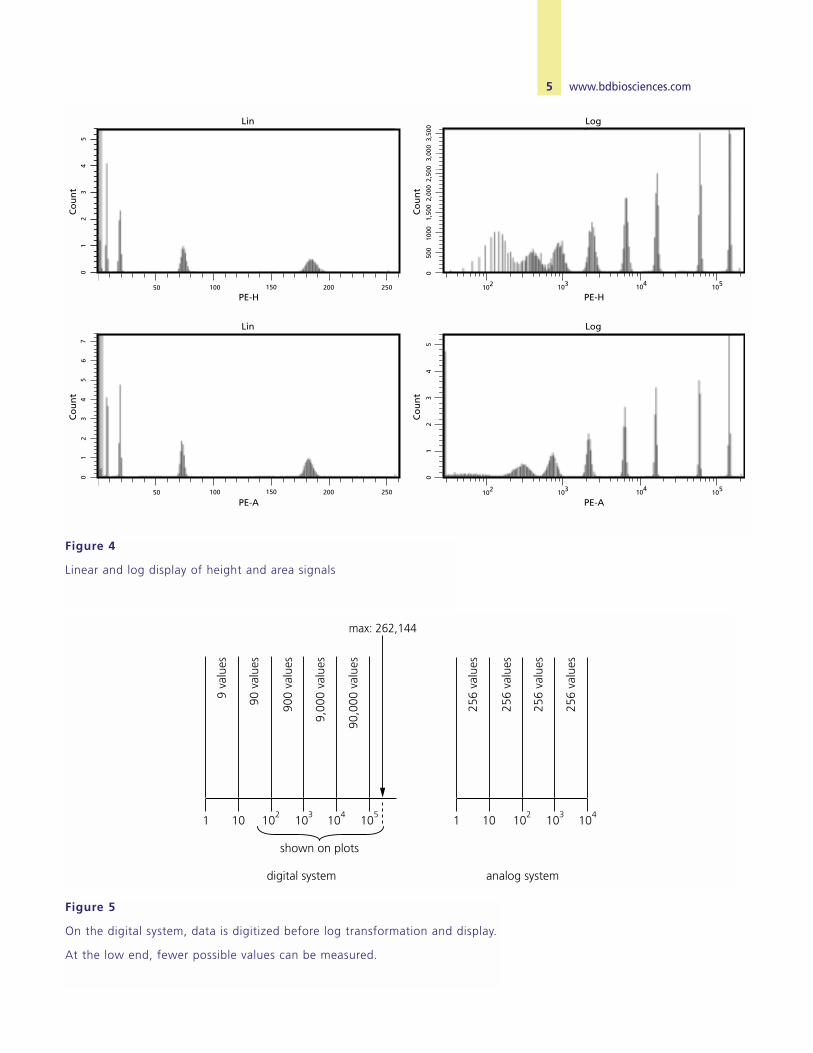
2.6 Window Gate Extension
The window gate can be too narrow to capture the entirepulse (Figure 6a), especially if the threshold is high. Tocorrect this, a user-defined window gate extension can be used to increase the window gate by a fixed amount oftime at both ends of the pulse (Figure 6b). The increasedwindow gate allows the entire pulse to be processed.
A window gate extension is one of the two possible reasons the system can abort an event. When two eventsarrive so close together that their window gate extensionsoverlap, both events will be aborted (Figure 6c). Settingthe window gate extension at zero ensures that this typeof abort does not occur. The second reason for an abort is when the event rate becomes too high. This is describedin more detail in the next section.
2.7 Event rate
The BD FACSDiVa option does not exhibit electronic dead time.* Because all raw data streams through memory whether or not a pulse is present, all pulses
can be discriminated, even when a pulse arrives while thesystem is still processing an earlier pulse. With traditionalflow cytometers, the system holds the peak signal electronicallyfor a fixed amount of time. If another particle arrives during this time, both events are aborted.
BD FACSDiVa electronics process events sequentially. Evenif events arrive in rapid succession (see Figure 7), the systemwill process them sequentially. Note that all parts of thesystem work in parallel. While one DSP is classifying anevent, another DSP is working on compensating the nextevent, and the acquisition boards are already acquiring theevent after that.
There is a limit to how much the system can buffer. If processing falls more than four events behind, the systemwill start aborting events as required in order to keep up(see Figure 8). (Aborted events require less processingtime.) The limit of four events prevents the system fromfalling so far behind that the drop to sort will havealready broken off. When events are aborted, drops willnot be sorted during a purity sort.
Figure 6
a. Initial window gate on the basis of threshold; missing
area circled
b.Window gate extended; area measured correctly
c. Rare case: extended window gates overlap;
pulses aborted
threshold
sig
nal
str
eng
th
time
Figure 7
Event 2 arrives before processing of event 1 is finished;
event 3 arrives before processing of event 2 is finished.
The system is then idle until the data from event 4 is in.
Processing of event 5 has to wait until event 4 is finished.
All events are processed and none are aborted.
1 2 3 4 5
event data transfer
processing event 1
processing event 2
processing event 3
processing event 4
processing event 5idle idle
time
* There is a minimum pulse width that can be set in the firmware. It is currently 1.2 µsec.The absolute minimum is 0.1 µsec, the sampling rate.
7 www.bdbiosciences.com
0
0
10000
20000
30000
40000
50000
60000
70000
90000030000 600006 1200000 1500001 0 1800001 0 2100002
Event Rate
Pro
cess
ed
Ev
en
ts
peakpeakpeakpeakpeak
BD FACSDiVa no comp
Analog 5.5 usec dead time
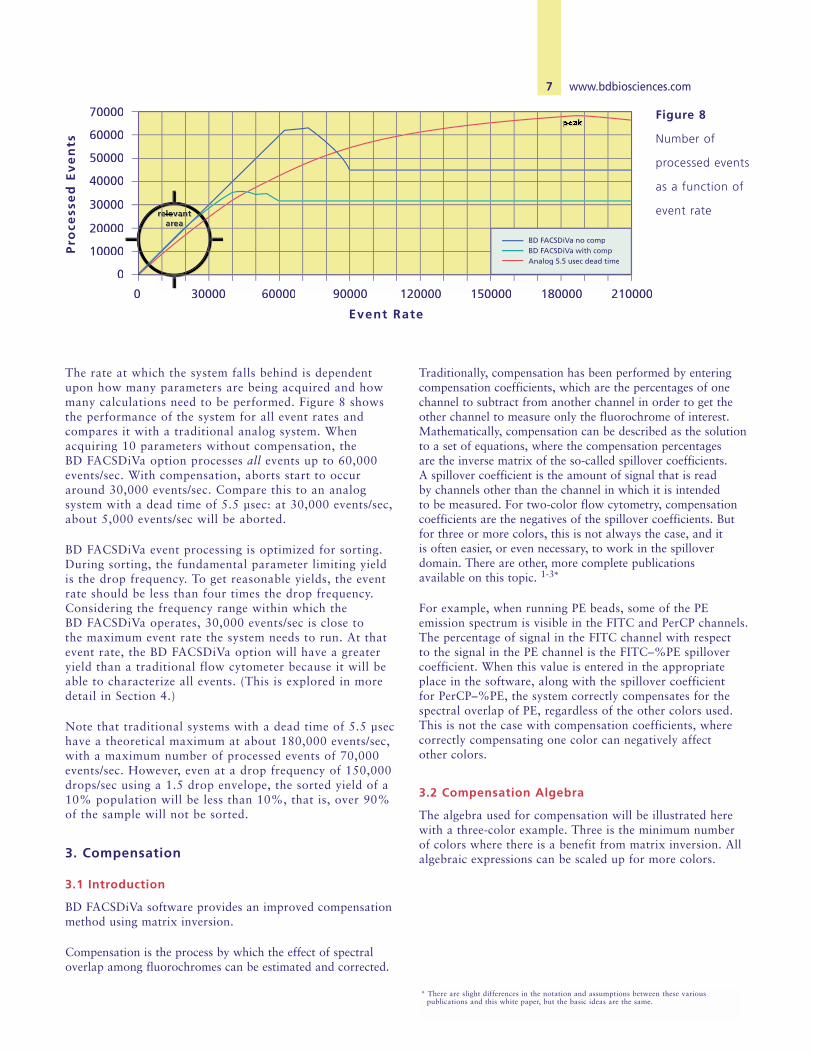
The rate at which the system falls behind is dependentupon how many parameters are being acquired and howmany calculations need to be performed. Figure 8 showsthe performance of the system for all event rates andcompares it with a traditional analog system. Whenacquiring 10 parameters without compensation, the BD FACSDiVa option processes all events up to 60,000events/sec. With compensation, aborts start to occuraround 30,000 events/sec. Compare this to an analog system with a dead time of 5.5 µsec: at 30,000 events/sec,about 5,000 events/sec will be aborted.
BD FACSDiVa event processing is optimized for sorting.During sorting, the fundamental parameter limiting yieldis the drop frequency. To get reasonable yields, the eventrate should be less than four times the drop frequency.Considering the frequency range within which the BD FACSDiVa operates, 30,000 events/sec is close to the maximum event rate the system needs to run. At thatevent rate, the BD FACSDiVa option will have a greateryield than a traditional flow cytometer because it will beable to characterize all events. (This is explored in moredetail in Section 4.)
Note that traditional systems with a dead time of 5.5 µsechave a theoretical maximum at about 180,000 events/sec,with a maximum number of processed events of 70,000events/sec. However, even at a drop frequency of 150,000drops/sec using a 1.5 drop envelope, the sorted yield of a10% population will be less than 10%, that is, over 90%of the sample will not be sorted.
3. Compensation
3.1 Introduction
BD FACSDiVa software provides an improved compensationmethod using matrix inversion.
Compensation is the process by which the effect of spectraloverlap among fluorochromes can be estimated and corrected.
Traditionally, compensation has been performed by enteringcompensation coefficients, which are the percentages of onechannel to subtract from another channel in order to get theother channel to measure only the fluorochrome of interest.Mathematically, compensation can be described as the solutionto a set of equations, where the compensation percentages are the inverse matrix of the so-called spillover coefficients. A spillover coefficient is the amount of signal that is read by channels other than the channel in which it is intended to be measured. For two-color flow cytometry, compensationcoefficients are the negatives of the spillover coefficients. Butfor three or more colors, this is not always the case, and it is often easier, or even necessary, to work in the spilloverdomain. There are other, more complete publications available on this topic. 1-3*
For example, when running PE beads, some of the PE emission spectrum is visible in the FITC and PerCP channels.The percentage of signal in the FITC channel with respect to the signal in the PE channel is the FITC–%PE spillovercoefficient. When this value is entered in the appropriateplace in the software, along with the spillover coefficient for PerCP–%PE, the system correctly compensates for thespectral overlap of PE, regardless of the other colors used.This is not the case with compensation coefficients, wherecorrectly compensating one color can negatively affect other colors.
3.2 Compensation Algebra
The algebra used for compensation will be illustrated herewith a three-color example. Three is the minimum numberof colors where there is a benefit from matrix inversion. Allalgebraic expressions can be scaled up for more colors.
Figure 8
Number of
processed events
as a function of
event rate
* There are slight differences in the notation and assumptions between these various publications and this white paper, but the basic ideas are the same.
3.2.1 Spillover Matrix
Let P represent each of the stains on a particle. P is a collection of numbers, since there can be multiple stains on a particle. A vector is an often-used mathematicalabstraction for such a collection. Thus, P = (P1,P2,P3),where the subscripts 1, 2 and 3 represent FITC, PE and PerCP.*
Let F be the fluorescence measured. F is a vector as well,since fluorescence is measured in multiple channels: F = (F1,F2,F3).
F is linked to P by the following formulas, where sij are the spillover coefficients:
F1 = S11 * P1 + S12 * P2 + S13 * P3
F2 = S21 * P1 + S22 * P2 + S23 * P3 (1)
F3 = S31 * P1 + S32 * P2 + S33 * P3
In other words, the fluorescence measured in PE (F2) isdetermined by the amount of all three fluorochromes on the particle passing through the laser beam. The biggestcontributor to F2 is the PE stain P2. However, other fluorochromes, when present on a particle, can also emitlight in the PE channel. Thus, P1 and P3 will contribute to F2 via s21 and s23.
Matrix algebra was created as a convenient notation toexpress the formulas in [1]:
F = M * P (2)
Where M is the matrix:
3.2.2 Compensation Matrix
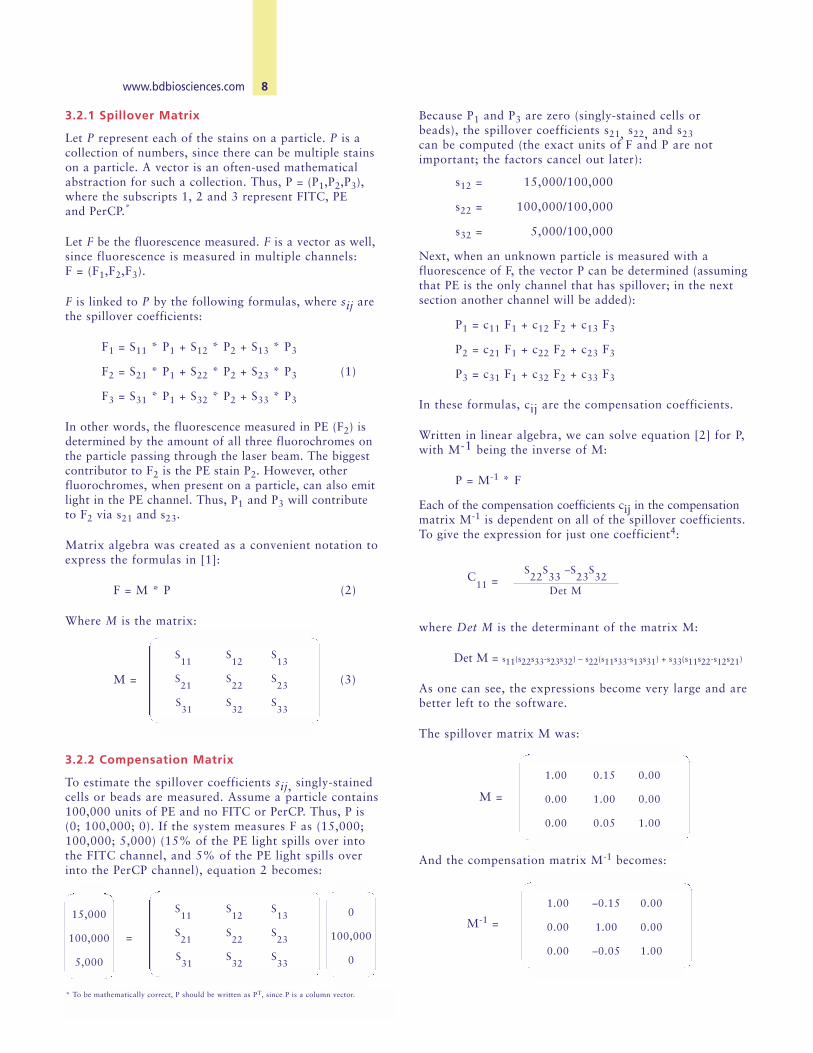
To estimate the spillover coefficients sij, singly-stainedcells or beads are measured. Assume a particle contains100,000 units of PE and no FITC or PerCP. Thus, P is (0; 100,000; 0). If the system measures F as (15,000;100,000; 5,000) (15% of the PE light spills over into the FITC channel, and 5% of the PE light spills over into the PerCP channel), equation 2 becomes:
Because P1 and P3 are zero (singly-stained cells or beads), the spillover coefficients s21, s22, and s23can be computed (the exact units of F and P are notimportant; the factors cancel out later):
s12 = 15,000/100,000
s22 = 100,000/100,000
s32 = 5,000/100,000
Next, when an unknown particle is measured with a fluorescence of F, the vector P can be determined (assumingthat PE is the only channel that has spillover; in the nextsection another channel will be added):
P1 = c11 F1 + c12 F2 + c13 F3
P2 = c21 F1 + c22 F2 + c23 F3
P3 = c31 F1 + c32 F2 + c33 F3
In these formulas, cij are the compensation coefficients.
Written in linear algebra, we can solve equation [2] for P,with M-1 being the inverse of M:
P = M-1 * F
Each of the compensation coefficients cij in the compensationmatrix M-1 is dependent on all of the spillover coefficients.To give the expression for just one coefficient4:
C11 =
where Det M is the determinant of the matrix M:
Det M = s11(s22s33-s23s32) – s22(s11s33-s13s31) + s33(s11s22-s12s21)
As one can see, the expressions become very large and arebetter left to the software.
The spillover matrix M was:
M =
And the compensation matrix M-1 becomes:
M-1 =
8www.bdbiosciences.com
M = (3)
S11
S12
S13
S21
S22
S23
S31
S32
S33
= (3)
S11
S12
S13
S21
S22
S23
S31
S32
S33
0
100,000
0
15,000
100,000
5,000
S22
S33
–S23
S32
Det M
1.00 –0.15 0.00
0.00 1.00 0.00
0.00 –0.05 1.00
1.00 0.15 0.00
0.00 1.00 0.00
0.00 0.05 1.00
* To be mathematically correct, P should be written as PT, since P is a column vector.
In this case, the compensation matrix looks very similarto the spillover matrix. This will change in the next section when we add a second color.
To calculate the original stains P, given the measured fluorescence F:
P1 = F1 – 0.15 F2
P2 = F2
P3 = F3 – 0.05 F2
These formulas express the traditional compensation principle, where the original stains P are recovered bysubtracting percentages of the channel that spilled over.
3.2.3 A Second Color Spills Over
Now, let’s take into account PerCP spillover. When fluorescence is measured for PerCP beads, 2% of thePerCP signal spills over into the FITC channel and 18%of the PerCP signal spills over into the PE channel.
The new matrix M becomes:
M =
The inverse of M is now:
M–1 =
This leads to a revised estimate of the original stains P,given measured fluorescence F:
P1 = 1.0000 F1 – 0.1504 F2 + 0.0071 F3
P2 = 1.0091 F2 – 0.1816 F3
P3 = 1.0091 F3 – 0.0505 F2
Notice the differences between the old and the new M-1. First, the PE coefficients have slightly changed and are no longer simply the negatives of the spillovercoefficients. Furthermore, the compensation coefficientc13 is positive 0.7%, although PerCP spills over 2% intothe FITC channel. Thus, we have to add part of the PerCPchannel to the FITC channel to calculate the correctamount of FITC fluorescence.
Although the differences are minor in this case (and therefore most often neglected in three- or four-colorcytometry), they can become quite large when more colors are used.
BD FACSDiVa software requires only that the spillovercoefficients be entered; the application computes theinverse matrix before applying compensation.* One canthen correct for spillover one color at a time, withouthaving to worry about interactions between the differentfluorochromes.
3.3 Compensation in Practice
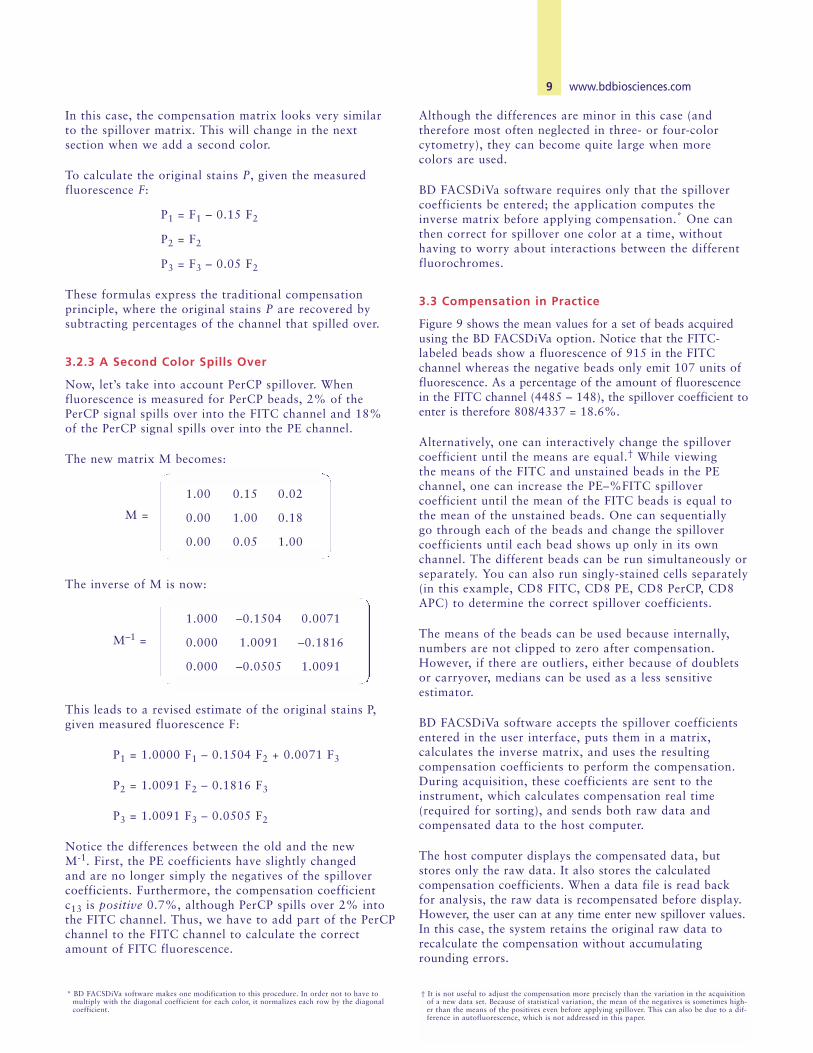
Figure 9 shows the mean values for a set of beads acquiredusing the BD FACSDiVa option. Notice that the FITC-labeled beads show a fluorescence of 915 in the FITCchannel whereas the negative beads only emit 107 units offluorescence. As a percentage of the amount of fluorescencein the FITC channel (4485 – 148), the spillover coefficient toenter is therefore 808/4337 = 18.6%.
Alternatively, one can interactively change the spillovercoefficient until the means are equal.† While viewing the means of the FITC and unstained beads in the PEchannel, one can increase the PE–%FITC spillover coefficient until the mean of the FITC beads is equal tothe mean of the unstained beads. One can sequentially go through each of the beads and change the spillovercoefficients until each bead shows up only in its ownchannel. The different beads can be run simultaneously orseparately. You can also run singly-stained cells separately(in this example, CD8 FITC, CD8 PE, CD8 PerCP, CD8APC) to determine the correct spillover coefficients.
The means of the beads can be used because internally,numbers are not clipped to zero after compensation.However, if there are outliers, either because of doubletsor carryover, medians can be used as a less sensitive estimator.
BD FACSDiVa software accepts the spillover coefficientsentered in the user interface, puts them in a matrix, calculates the inverse matrix, and uses the resulting compensation coefficients to perform the compensation.During acquisition, these coefficients are sent to theinstrument, which calculates compensation real time(required for sorting), and sends both raw data and compensated data to the host computer.
The host computer displays the compensated data, butstores only the raw data. It also stores the calculated compensation coefficients. When a data file is read backfor analysis, the raw data is recompensated before display.However, the user can at any time enter new spillover values.In this case, the system retains the original raw data torecalculate the compensation without accumulating rounding errors.
9 www.bdbiosciences.com
1.00 0.15 0.02
0.00 1.00 0.18
0.00 0.05 1.00
1.000 –0.1504 0.0071
0.000 1.0091 –0.1816
0.000 –0.0505 1.0091
* BD FACSDiVa software makes one modification to this procedure. In order not to have to multiply with the diagonal coefficient for each color, it normalizes each row by the diagonalcoefficient.
† It is not useful to adjust the compensation more precisely than the variation in the acquisitionof a new data set. Because of statistical variation, the mean of the negatives is sometimes high-er than the means of the positives even before applying spillover. This can also be due to a dif-ference in autofluorescence, which is not addressed in this paper.
10www.bdbiosciences.com
(before compensation)
(after compensation)
Figure 9
BD CaliBRITE™ beads before and after compensation.
Negatives defined as P1 AND P2
Singlets
PE
FITC
PerCPAPC20
025
050
100
150
200 25050 100 150FSC-A
All Events
SSC-
A(x
1,0
00)
(x 1,000)105102 103 104
105
102
103
104
FITC-A
Singlets
PE-A
105102 103 104
105
102
103
104
PE-A
Singlets
PerC
P-A
105102 103 104
105
102
103
104
PerCP-A
Singlets
APC
-A
P1 P2
Singlets
PE
P1
FITC
PerCPAPC20
025
050
100
150
200 25050 100 150FSC-A
All Events
SSC-
A(x
1,0
00)
(x 1,000)105102 103 104
105
102
103
104
FITC-A
Singlets
PE-A
105102 103 104
105
102
103
104
PE-A
Singlets
PerC
P-A
105102 103 104
105
102
103
104
PerCP-A
Singlets
PE-A
P2
FITC-A PE-A PerCP-A APC-APopulaton #Events Mean Mean Mean Mean
Negatives 16,648 148 107 144 63FITC 8,591 4,485 915 215 50PE 10,595 181 3,982 746 80PerCP 9672 127 94 2,015 285APC 6,003 93 56 285 3,065
FITC-A PE-A PerCP-A APC-APopulaton #Events Mean Mean Mean Mean
Negatives 16,657 147 79 127 50FITC 8,591 4,478 79 127 39PE 10,591 147 3,949 127 50PerCP 9,637 126 70 1,993 50APC 6,005 93 39 127 3,041
11 www.bdbiosciences.com
4. Sorting
4.1 Conflict Resolution
The BD FACSDiVa option adds new sorting capabilitiesto the BD FACSVantage SE flow cytometer. It enablesfour-way sorting and expands flexibility in making sortdecisions. The option also allows more particles to besorted, because there is no dead time.
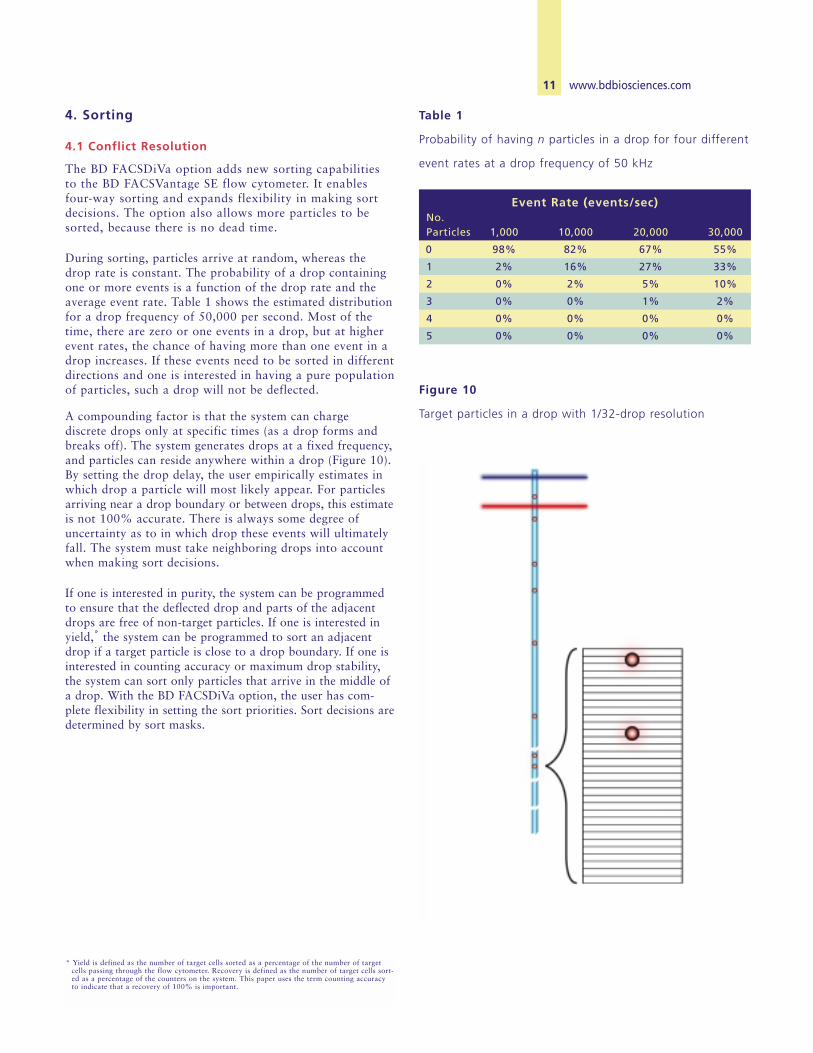
During sorting, particles arrive at random, whereas thedrop rate is constant. The probability of a drop containingone or more events is a function of the drop rate and theaverage event rate. Table 1 shows the estimated distributionfor a drop frequency of 50,000 per second. Most of thetime, there are zero or one events in a drop, but at higherevent rates, the chance of having more than one event in adrop increases. If these events need to be sorted in differentdirections and one is interested in having a pure populationof particles, such a drop will not be deflected.
A compounding factor is that the system can charge discrete drops only at specific times (as a drop forms andbreaks off). The system generates drops at a fixed frequency,and particles can reside anywhere within a drop (Figure 10).By setting the drop delay, the user empirically estimates inwhich drop a particle will most likely appear. For particlesarriving near a drop boundary or between drops, this estimateis not 100% accurate. There is always some degree ofuncertainty as to in which drop these events will ultimatelyfall. The system must take neighboring drops into accountwhen making sort decisions.
If one is interested in purity, the system can be programmedto ensure that the deflected drop and parts of the adjacentdrops are free of non-target particles. If one is interested inyield,* the system can be programmed to sort an adjacentdrop if a target particle is close to a drop boundary. If one isinterested in counting accuracy or maximum drop stability,the system can sort only particles that arrive in the middle ofa drop. With the BD FACSDiVa option, the user has com-plete flexibility in setting the sort priorities. Sort decisions aredetermined by sort masks.
Table 1
Probability of having n particles in a drop for four different
event rates at a drop frequency of 50 kHz
Figure 10
Target particles in a drop with 1/32-drop resolution
Event Rate (events/sec) No. Particles 1,000 10,000 20,000 30,000
0 98% 82% 67% 55%
1 2% 16% 27% 33%
2 0% 2% 5% 10%
3 0% 0% 1% 2%
4 0% 0% 0% 0%
5 0% 0% 0% 0%
* Yield is defined as the number of target cells sorted as a percentage of the number of targetcells passing through the flow cytometer. Recovery is defined as the number of target cells sort-ed as a percentage of the counters on the system. This paper uses the term counting accuracyto indicate that a recovery of 100% is important.
12www.bdbiosciences.com
4.2 Sort Masks
BD FACSDiVa software provides
three mask settings to determine sort
results: a yield mask, a purity mask,
and a phase mask.
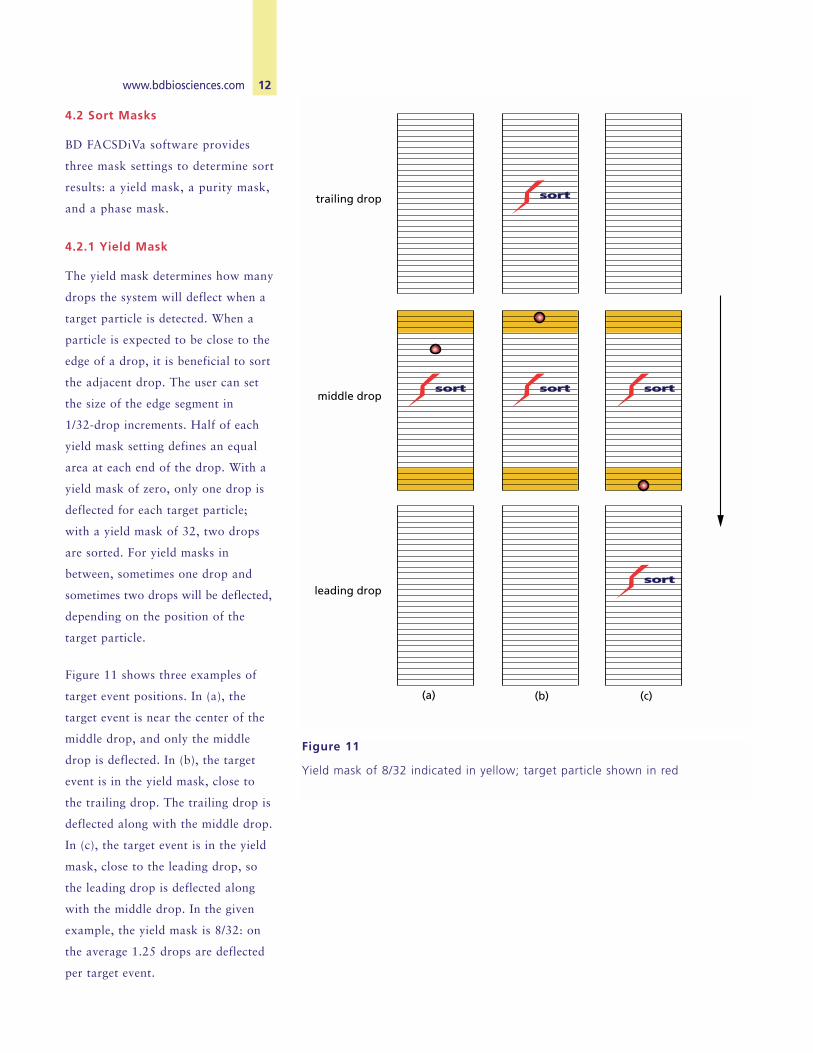
4.2.1 Yield Mask
The yield mask determines how many
drops the system will deflect when a
target particle is detected. When a
particle is expected to be close to the
edge of a drop, it is beneficial to sort
the adjacent drop. The user can set
the size of the edge segment in
1/32-drop increments. Half of each
yield mask setting defines an equal
area at each end of the drop. With a
yield mask of zero, only one drop is
deflected for each target particle;
with a yield mask of 32, two drops
are sorted. For yield masks in
between, sometimes one drop and
sometimes two drops will be deflected,
depending on the position of the
target particle.
Figure 11 shows three examples of
target event positions. In (a), the
target event is near the center of the
middle drop, and only the middle
drop is deflected. In (b), the target
event is in the yield mask, close to
the trailing drop. The trailing drop is
deflected along with the middle drop.
In (c), the target event is in the yield
mask, close to the leading drop, so
the leading drop is deflected along
with the middle drop. In the given
example, the yield mask is 8/32: on
the average 1.25 drops are deflected
per target event.
(a) (b) (c)
trailing drop
middle drop
leading drop
sortsort
sortsortsortsort sortsort
sortsort
Figure 11
Yield mask of 8/32 indicated in yellow; target particle shown in red
13 www.bdbiosciences.com
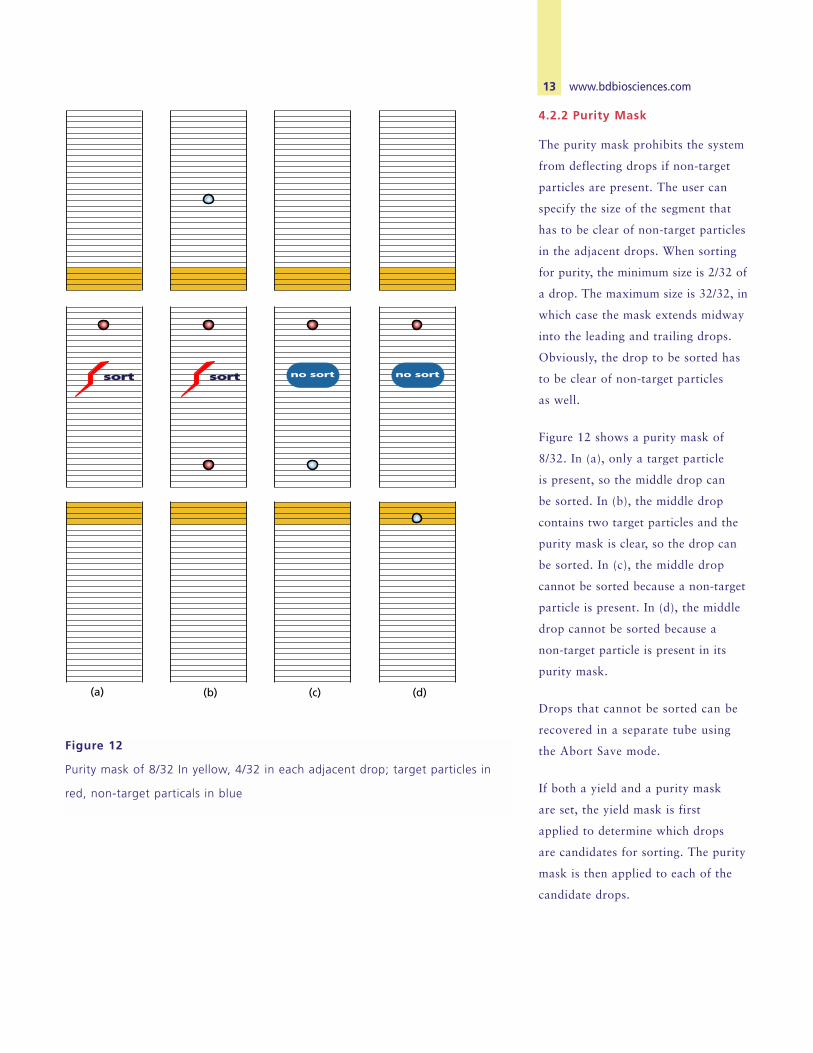
4.2.2 Purity Mask
The purity mask prohibits the system
from deflecting drops if non-target
particles are present. The user can
specify the size of the segment that
has to be clear of non-target particles
in the adjacent drops. When sorting
for purity, the minimum size is 2/32 of
a drop. The maximum size is 32/32, in
which case the mask extends midway
into the leading and trailing drops.
Obviously, the drop to be sorted has
to be clear of non-target particles
as well.
Figure 12 shows a purity mask of
8/32. In (a), only a target particle
is present, so the middle drop can
be sorted. In (b), the middle drop
contains two target particles and the
purity mask is clear, so the drop can
be sorted. In (c), the middle drop
cannot be sorted because a non-target
particle is present. In (d), the middle
drop cannot be sorted because a
non-target particle is present in its
purity mask.
Drops that cannot be sorted can be
recovered in a separate tube using
the Abort Save mode.
If both a yield and a purity mask
are set, the yield mask is first
applied to determine which drops
are candidates for sorting. The purity
mask is then applied to each of the
candidate drops.
Figure 12
Purity mask of 8/32 In yellow, 4/32 in each adjacent drop; target particles in
red, non-target particals in blue
(d)(a) (b) (c)
sortsort sortsort no sortno sort
14www.bdbiosciences.com
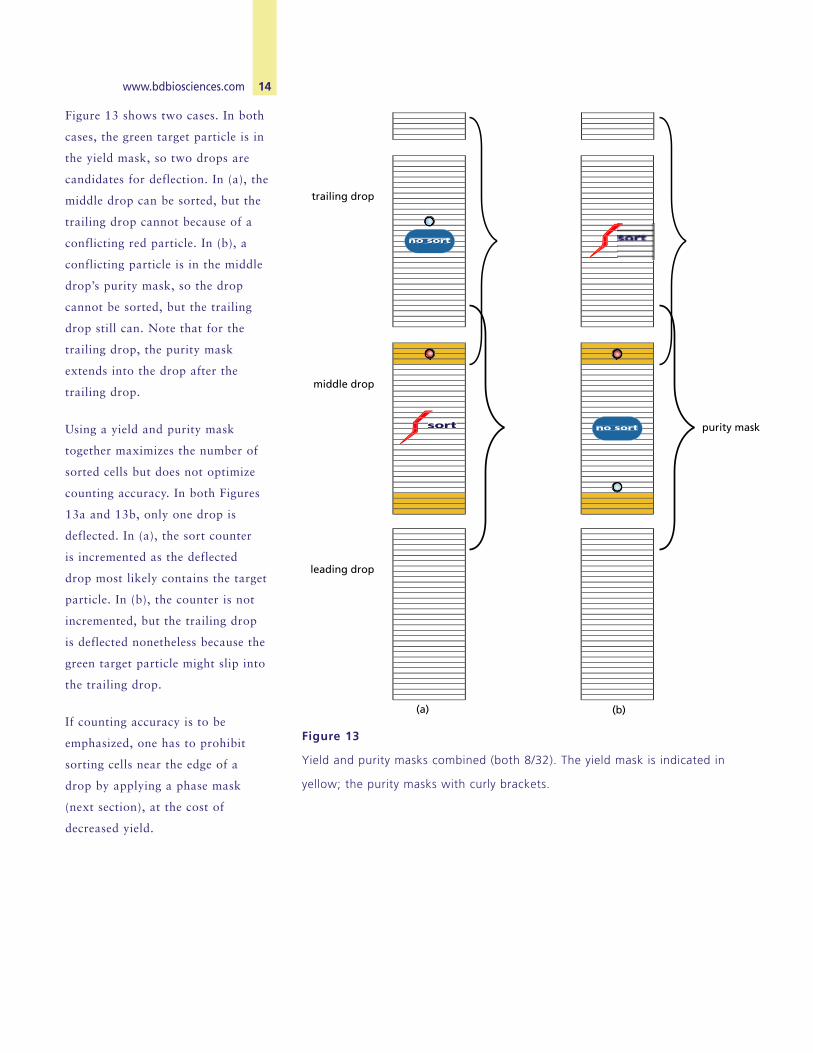
Figure 13 shows two cases. In both
cases, the green target particle is in
the yield mask, so two drops are
candidates for deflection. In (a), the
middle drop can be sorted, but the
trailing drop cannot because of a
conflicting red particle. In (b), a
conflicting particle is in the middle
drop’s purity mask, so the drop
cannot be sorted, but the trailing
drop still can. Note that for the
trailing drop, the purity mask
extends into the drop after the
trailing drop.
Using a yield and purity mask
together maximizes the number of
sorted cells but does not optimize
counting accuracy. In both Figures
13a and 13b, only one drop is
deflected. In (a), the sort counter
is incremented as the deflected
drop most likely contains the target
particle. In (b), the counter is not
incremented, but the trailing drop
is deflected nonetheless because the
green target particle might slip into
the trailing drop.
If counting accuracy is to be
emphasized, one has to prohibit
sorting cells near the edge of a
drop by applying a phase mask
(next section), at the cost of
decreased yield.
(a) (b)
trailing drop
middle drop
leading drop
purity maskttsortsortso tttttoooosssssortoooss rrsortrsorssorttttrr
no sortno sortno sortno sort
no sort
Figure 13
Yield and purity masks combined (both 8/32). The yield mask is indicated in
yellow; the purity masks with curly brackets.

15 www.bdbiosciences.com
4.2.3 Phase Mask
A phase mask ensures that only
drops that have no particles near
their edges are deflected. The edges
of the adjacent drops must be empty
as well (Figure 14). This ensures
accurate sort counters, but sacrifices
yield. An additional benefit is that
side streams are stabilized, since
particles near the edges of drops can
modify the drop breakoff. A phase
mask is often applied to improve the
side stream quality during single cell
sorting into plates or when sorting
larger particles.
A phase mask cannot be used with
a yield mask, but it can be used with
a purity mask. When used with a
purity mask, the purity mask ensures
that there are no conflicting particles
that can contaminate the sort.
(a) (b) (c)
no sort no sort
Figure 14
Phase mask of 8/32 shown in blue. In (a), the middle drop is deflected;
in (b) and (c), the middle drop is not deflected.
16www.bdbiosciences.com
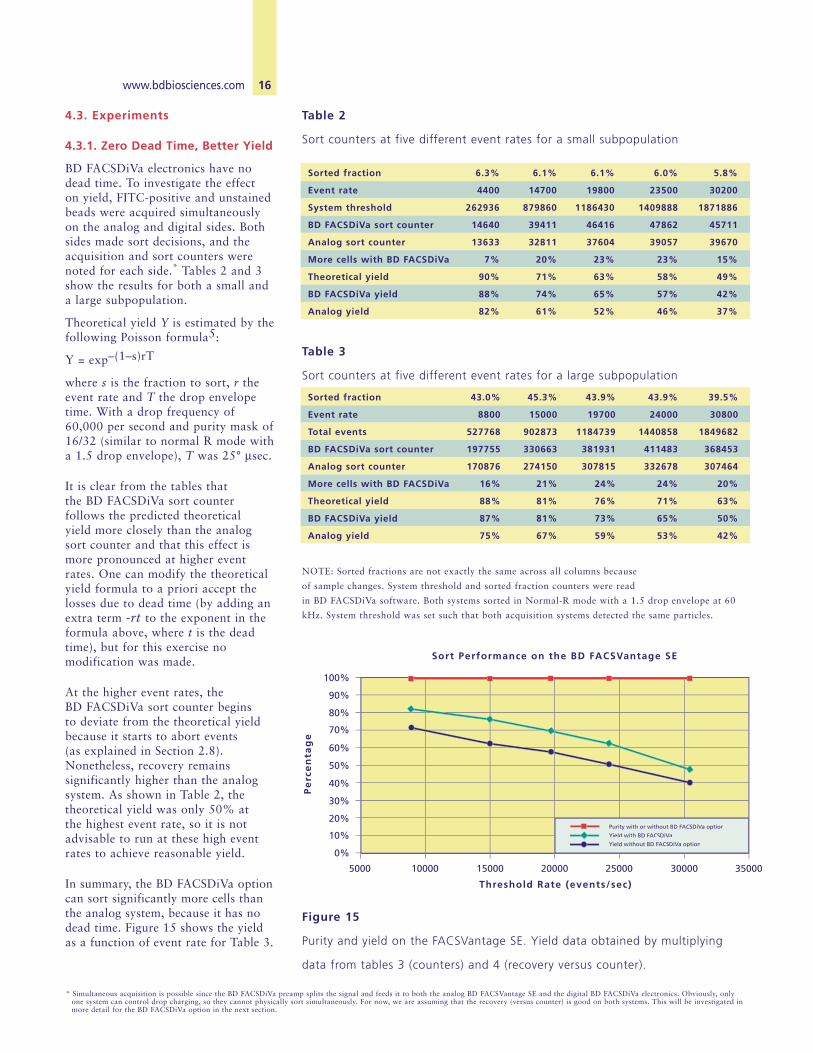
Table 2
Sort counters at five different event rates for a small subpopulation
Table 3
Sort counters at five different event rates for a large subpopulation
NOTE: Sorted fractions are not exactly the same across all columns because
of sample changes. System threshold and sorted fraction counters were read
in BD FACSDiVa software. Both systems sorted in Normal-R mode with a 1.5 drop envelope at 60
kHz. System threshold was set such that both acquisition systems detected the same particles.
5000 10000 15000 20000 25000 30000 35000
0%
10%
20%
30%
40%
50%
60%
70%
80%
90%
100%
Threshold Rate (events/sec)
Sort Performance on the BD FACSVantage SE
Pe
rce
nta
ge
Yield without BD FACSDiVa option
Purity with or without BD FACSDiVa option
Yield with BD FACSDiVa
Figure 15
Purity and yield on the FACSVantage SE. Yield data obtained by multiplying
data from tables 3 (counters) and 4 (recovery versus counter).
4.3. Experiments
4.3.1. Zero Dead Time, Better Yield
BD FACSDiVa electronics have nodead time. To investigate the effect on yield, FITC-positive and unstainedbeads were acquired simultaneouslyon the analog and digital sides. Bothsides made sort decisions, and theacquisition and sort counters werenoted for each side.* Tables 2 and 3show the results for both a small anda large subpopulation.
Theoretical yield Y is estimated by thefollowing Poisson formula5:
Y = exp–(1–s)rT
where s is the fraction to sort, r theevent rate and T the drop envelopetime. With a drop frequency of60,000 per second and purity mask of16/32 (similar to normal R mode witha 1.5 drop envelope), T was 25° µsec.
It is clear from the tables that the BD FACSDiVa sort counter follows the predicted theoretical yield more closely than the analogsort counter and that this effect ismore pronounced at higher eventrates. One can modify the theoreticalyield formula to a priori accept thelosses due to dead time (by adding anextra term -rt to the exponent in the formula above, where t is the deadtime), but for this exercise no modification was made.
At the higher event rates, the BD FACSDiVa sort counter begins to deviate from the theoretical yieldbecause it starts to abort events (as explained in Section 2.8).Nonetheless, recovery remains significantly higher than the analogsystem. As shown in Table 2, the theoretical yield was only 50% at the highest event rate, so it is notadvisable to run at these high eventrates to achieve reasonable yield.
In summary, the BD FACSDiVa optioncan sort significantly more cells thanthe analog system, because it has nodead time. Figure 15 shows the yieldas a function of event rate for Table 3.
Sorted fraction 43.0% 45.3% 43.9% 43.9% 39.5%
Event rate 8800 15000 19700 24000 30800
Total events 527768 902873 1184739 1440858 1849682
BD FACSDiVa sort counter 197755 330663 381931 411483 368453
Analog sort counter 170876 274150 307815 332678 307464
More cells with BD FACSDiVa 16% 21% 24% 24% 20%
Theoretical yield 88% 81% 76% 71% 63%
BD FACSDiVa yield 87% 81% 73% 65% 50%
Analog yield 75% 67% 59% 53% 42%
* Simultaneous acquisition is possible since the BD FACSDiVa preamp splits the signal and feeds it to both the analog BD FACSVantage SE and the digital BD FACSDiVa electronics. Obviously, onlyone system can control drop charging, so they cannot physically sort simultaneously. For now, we are assuming that the recovery (versus counter) is good on both systems. This will be investigated inmore detail for the BD FACSDiVa option in the next section.
Sorted fraction 6.3% 6.1% 6.1% 6.0% 5.8%
Event rate 4400 14700 19800 23500 30200
System threshold 262936 879860 1186430 1409888 1871886
BD FACSDiVa sort counter 14640 39411 46416 47862 45711
Analog sort counter 13633 32811 37604 39057 39670
More cells with BD FACSDiVa 7% 20% 23% 23% 15%
Theoretical yield 90% 71% 63% 58% 49%
BD FACSDiVa yield 88% 74% 65% 57% 42%
Analog yield 82% 61% 52% 46% 37%
17 www.bdbiosciences.com
4.3.2 Recovery
In the previous section, we showed that the yield asdetermined by the counters is better on the BD FACSDiVaoption than on the standard system. To demonstratecounter fidelity, we sorted beads and verified the countunder a microscope. We sorted with a purity mask of 16and a yield mask of 16, which are recommended valuesfor a bulk sort. These settings minimize the number ofcells that go to waste, yet ensure a pure result (more onpurity in the next section). Note for depositing an exactnumber of particles on a slide, a phase mask would alsobe used (as explained in Section 4.2.3 and as will beshown in the next section), but the purpose of this experiment was to simulate the conditions during a typical bulk sort where purity is most important, followed by yield, and then counting accuracy.
At 35 psi and 50 kHz, 100 YellowBrite beads (12% target population) were sorted into five spots on a slide.Beads were sorted in Normal-R mode at a rate of 8,000events/sec with a purity mask of 16, a yield mask of 16,and no phase mask. The sorted beads were then countedunder a fluorescence microscope. Results are shown inTable 4.
The actual recovery as a function of the system counterwas in all cases >95%. A small percentage of beads arelost because of variations in the time of flight between thelaser intercept and the point at which a drop is charged.The system will try to sort two drops in order to catch atarget particle if the particle is near the edge (yield mask),but it is not always able to because the adjacent drop can contain a non-target particle.
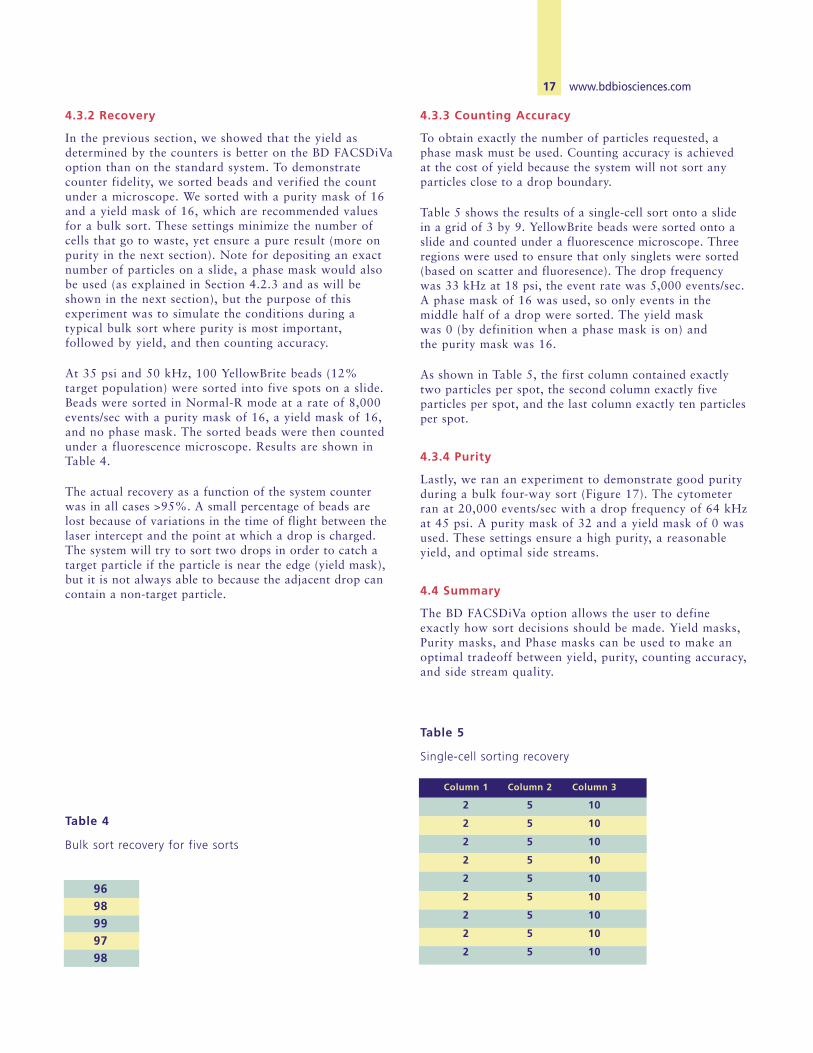
4.3.3 Counting Accuracy
To obtain exactly the number of particles requested, aphase mask must be used. Counting accuracy is achieved at the cost of yield because the system will not sort anyparticles close to a drop boundary.
Table 5 shows the results of a single-cell sort onto a slide in a grid of 3 by 9. YellowBrite beads were sorted onto aslide and counted under a fluorescence microscope. Threeregions were used to ensure that only singlets were sorted(based on scatter and fluoresence). The drop frequency was 33 kHz at 18 psi, the event rate was 5,000 events/sec.A phase mask of 16 was used, so only events in the middle half of a drop were sorted. The yield mask was 0 (by definition when a phase mask is on) and the purity mask was 16.
As shown in Table 5, the first column contained exactlytwo particles per spot, the second column exactly five particles per spot, and the last column exactly ten particlesper spot.
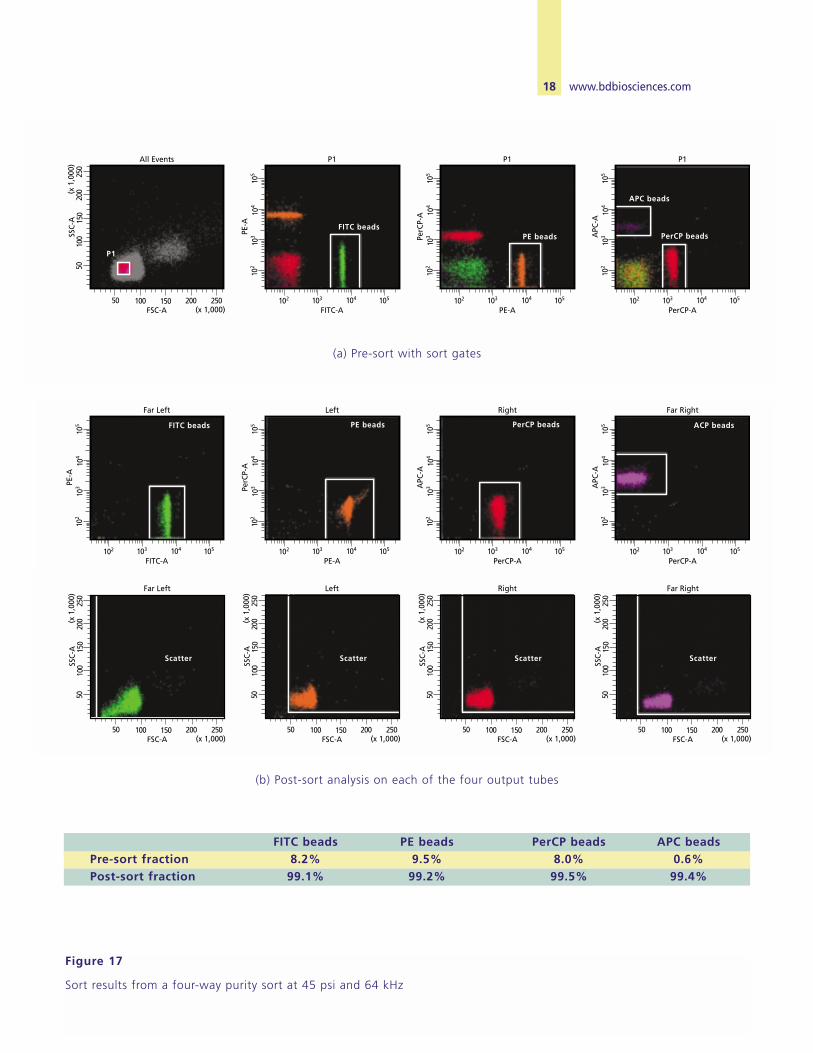
4.3.4 Purity
Lastly, we ran an experiment to demonstrate good purityduring a bulk four-way sort (Figure 17). The cytometerran at 20,000 events/sec with a drop frequency of 64 kHzat 45 psi. A purity mask of 32 and a yield mask of 0 wasused. These settings ensure a high purity, a reasonableyield, and optimal side streams.
4.4 Summary
The BD FACSDiVa option allows the user to define exactly how sort decisions should be made. Yield masks,Purity masks, and Phase masks can be used to make an optimal tradeoff between yield, purity, counting accuracy,and side stream quality.
9698999798
Column 1 Column 2 Column 3
2 5 10
2 5 10
2 5 10
2 5 10
2 5 10
2 5 10
2 5 10
2 5 10
2 5 10
Table 5
Single-cell sorting recovery
Table 4
Bulk sort recovery for five sorts
18 www.bdbiosciences.com20
025
050
100
150
200 25050 100 150FSC-A
All Events
SSC-
A(x
1,0
00)
(x 1,000)105102 103 104
105
102
103
104
FITC-A
P1
PE-A
105102 103 104
105
102
103
104
PE-A
P1
PerC
P-A
105102 103 104
105
102
103
104
PerCP-A
P1
APC
-A
PerCP beads
P1
FITC beadsPE beads
APC beads
105102 103 104
105
102
103
104
PE-A
Left
PerC
P-A
105102 103 104
105
102
103
104
PerCP-A
RightA
PC-A
105102 103 104
105
102
103
104
PerCP-A
Far Right
APC
-A
ACP beadsPE beads
105102 103 104
105
102
103
104
FITC-A
Far Left
PE-A
FITC beads PerCP beads
200
250
5010
015
0
200 25050 100 150FSC-A
Far Left
SSC-
A(x
1,0
00)
(x 1,000)
Scatter Scatter Scatter Scatter
200
250
5010
015
0
200 25050 100 150FSC-A
Left
SSC-
A(x
1,0
00)
(x 1,000)
200
250
5010
015
0
200 25050 100 150FSC-A
Right
SSC-
A(x
1,0
00)
(x 1,000)
200
250
5010
015
0
200 25050 100 150FSC-A
Far RightSS
C-A
(x 1
,000
)
(x 1,000)
(a) Pre-sort with sort gates
(b) Post-sort analysis on each of the four output tubes
Figure 17
Sort results from a four-way purity sort at 45 psi and 64 kHz
FITC beads PE beads PerCP beads APC beadsPre-sort fraction 8.2% 9.5% 8.0% 0.6%Post-sort fraction 99.1% 99.2% 99.5% 99.4%
19 www.bdbiosciences.com
The creation of the BD FACSDiVa option was the work of a large group of
people from all parts of the BD Biosciences organization and from a large
number of beta customers. Thanks to all of them. The author would also like
to thank all the reviewers of this white paper, which has benefitted greatly
from the time they invested.
References
[1] Bagwell CB, Adams EG.
Fluorescence spectral overlap
compensation for any number of flow
cytometry parameters. Ann
NY Acad Sci. 1993;677:167-184.
[2] Roederer M, Derosa S, Gerstein R,
Anderson MT, Bigos M, Stovel RT,
Nozaki T, Parks DR, Herzenberg LA,
Herzenberg La. 8 color, 10-parameter
flow cytometry to elucidate complex
leukocyte heterogeneity. Cytometry.
1997;29;328-339.
[3] Bigos M, Baumgarth N, Jager GC,
Herman OC, Nozaki T, Stovel RT, Parks
DR, Herzenberg LA. Nine color eleven
parameter immunophenotyping using
three laser flow cytometry. Cytometry.
1999;36;36-45.
[4] Lang S. Linear Algebra. 2nd ed.
Reading, Massachusetts: Addison-
Wesley. 1980.
[5] Hoffman RA, Houck DW. High
speed sorting efficiency and recovery:
theory and experiment. Cytometry.
1998;9;142.
BD BiosciencesClontechDiscovery LabwareImmunocytometry SystemsPharmingen
JapanNippon Becton Dickinson
Tel 81.24.593.5405
Fax 81.24.593.5761
EuropeBecton Dickinson European HQ
Tel (32) 53-720211
Fax (32) 53-720450
Asia PacificBD Singapore
Tel 65.6861.0633
Fax 65.6860.1590
CanadaBD Biosciences
Toll free 888.259.0187
Tel 905.542.8028
Fax 905.542.9391
United StatesBD Biosciences
Clontech
Fax 650.354.0775
Discovery Labware
Fax 978.901.7493
Immunocytometry Systems
Fax 408.954.2347
Pharmingen
Fax 858.812.8888
Customer/Technical Service
Toll free 877.232.8995
www.bdbiosciences.com
AfricaBecton Dickinson
Worldwide Inc
Kenya
Tel (254) 2 449 608
Fax (254) 2 449 619
AustraliaBecton Dickinson Pty Ltd
Tel (612) 9978-6800
Fax (612) 9978-6850
AustriaBecton Dickinson Austria
Tel (43) 1 706 36 60-0
Fax (43) 1 706 36 60-11
BeneluxN.V. Becton Dickinson S.A.
Belgium:
Tel (32) 53 720211
Fax (32) 53 720200
The Netherlands:
Tel (31) 76 5037720
Fax (31) 76 5014133
ChinaBecton Dickinson Asia Ltd.
Tel 8610-6593 3072-77
Fax 8610 6593 3070
DenmarkBecton Dickinson AS
Tel (45) 43 434566
Fax (45) 43 434166
Eastern EuropeBecton Dickinson International
Germany
Tel (49) 6221 3050
Fax (49) 6221 305 388
FranceBecton Dickinson SA
Division Immunocytométrie
Tel (33) 476 683730
Fax (33) 476 683544
GermanyBecton Dickinson GmbH
Tel (49) 6221 3050
Fax (49) 6221 303798
GreeceBecton Dickinson Hellas SA
Tel (30) 1 940 77 41
Fax (30) 1 940 77 40
Hong KongBecton Dickinson Asia Ltd
Tel (852) 2575-8668
Fax (852) 2803-5320
HungaryBecton Dickinson
Tel (36) 1 216 48 93
Fax (36) 1 216 48 93
IcelandIcelantic American Trad Co
Tel (354) 168 27 00
IndiaBecton Dickinson India Pvt Ltd
Tel (91-11) 6913092
Fax (91-11) 6831783
IndonesiaBecton Dickinson Asia Ltd
Tel (6221) 577 1920
Fax (6221) 577 1925
IrelandBecton Dickinson
Diagnostic Systems
Tel (353) 1 285 48 00
Fax (353) 1 285 43 32
IsraelBactlab Diagnostics Ltd.
Tel (972) 6-6309600
Fax (972) 6-6230777
ItalyBecton Dickinson
Italia SpA
Tel (39) 02 482401
Fax (39) 02 48200323
KoreaBecton Dickinson
Korea Inc
Tel (822) 5694030
Fax (822) 5694048/9
Latin AmericaBecton Dickinson
Immunocytometry
Systems USA
Tel (408) 954-2157
Fax (408) 526-1804
MalaysiaBecton Dickinson Sdn
Bhd
Tel (0203) 7571323
Fax (0203) 7571153
Middle EastBecton Dickinson
Tel (971) 4 379525
Fax (971) 4 379551
NorwayLaborel A/S
Tel (47) 23 05 19 30
Fax (47) 22 63 07 51
PhilippinesBecton Dickinson
Philippines, Inc
Tel (632) 818 9727
Fax (632) 810 5687
PolandBecton Dickinson Polska
Tel (48) 22 6517921
Fax (48) 22 6517924
PortugalENZIfarma, Diagnostica
e Farmaceutica
Tel (351) 1 4420100
Fax (351) 1 4420110
South AfricaBD Immunocytometry
Systems
Tel (27) 11 807 1531
Fax (27) 11 807 1953
SpainBecton Dickinson España SA
Tel (34) 91 8488100
Fax (34) 91 8488104
SwedenBecton Dickinson AB
Tel (46) 8 775 5100
Fax (46) 8 645 08 08
SwitzerlandBecton Dickinson AG
Tel (41) 61 385 44 22
Fax (41) 61 385 44 00
TaiwanBecton Dickinson
Worldwide Inc
Tel (8862) 722-5660
Fax (8862) 725-1772
ThailandBecton Dickinson Thailand Ltd
Tel (662) 643 1371-80
Fax (662) 643 1381
TurkeyBD Turkey
Tel (90) 212 222 87 77
Fax (90) 212222 87 76
United KingdomBecton Dickinson UK Ltd
Tel (44) 1865 748844
Fax (44) 1865 781635
03/02 23-6579-00
PE: US Patent Nos. 4, 520,110; 4,859,582, and 5,055,556; European Patent No. 76,695; and Canadian Patent No. 1,179,942
PerCP: US Patent No. 4,876,190
PerCP-Cy5.5: US Patent Nos. 5,268,486; 5,486,616; 5,569,587; 5,569,766; and 5,627,027
APC-Cy7: Cy7 is licensed under US Patent Nos. 5,268,486; 5,486,616; 5,569,587; 5,569,766; and 5,627,027. APC-Cy7 is licensed under US Patent No. 5,714,386.
The BD FACSVantage SE flow cytometer and the BD FACSDiVa option are For Research Use Only. Not for use in diagnostic or therapeutic procedures.
© 2002 Becton, Dickinson and Company.