
BCSSE Grand Frequencies and Means - Publicbcsse.indiana.edu/pdf/BCSSE08 Institutional Report...
29
BCSSE Grand Frequencies and Means - Public BCSSE Institutional Report 2008
-
Upload
trinhkhanh -
Category
Documents
-
view
218 -
download
0
Transcript of BCSSE Grand Frequencies and Means - Publicbcsse.indiana.edu/pdf/BCSSE08 Institutional Report...
BCSSE Grand Frequencies and
Means - Public
BCSSE
Institutional Report 2008

Guide to Your Report
Student Comparisons
Students enter your campus with a variety of backgrounds and experiences that relate to their academic
engagement and success. The purpose of BCSSE is to provide your campus with valuable and timely
information that will allow you to positively impact the first-year experiences of your students.
The BCSSE Institutional Report 2008 contains three sections that highlight important characteristics
related to your incoming first-year class. The first section of this report describes the background
characteristics of your first-year students who responded to the survey. The second section contains the
frequency distributions for all questions on the survey. Overall results for your institution are presented,
as well as results by gender and first-generation status. The third section contains the overall
institutional means for six BCSSE scales. These scales provide important information regarding high
school academic engagement, expected first-year academic engagement, as well as an assessment of
expected first-year academic performance. Similar to the frequency distributions, the mean differences
are also reported by gender and first-generation status. In total, this report provides your institution with
the best estimates of your incoming first-year student academic characteristics.
To see a sample of the BCSSE 2008-NSSE 2009 Report, go to: www.bcsse.iub.edu. More information
about NSSE, including regsitration deadline, can be found at www.nsse.iub.edu.
BCSSE Institutional Report 2008
Introduction
As described above, your BCSSE Institutional Report 2008 contains results by gender and first-
generation status. The results are presented by student subgroup because of the importance to better
understand the diversity of student experiences within each campus. With a better understanding of
student variation, you may more effectively target important academic resources to the students who are
in the most need. Though this report only examines group differences by gender and first-generation
status, there are many other important subgroups to consider depending on the unique circumstances of
your campus.
Don't forget that this Institutional Report is one of two reports. BCSSE was designed as a companion to
the National Survey of Student Engagement (NSSE). By participating in NSSE in the spring of 2009,
you will also receive a BCSSE 2008-NSSE 2009 Report that provides a detailed longitudinal analysis of
your first-year students.
Where to Find More Information
BCSSE Reports
Beginning College Survey ofStudent Engagement
Count %
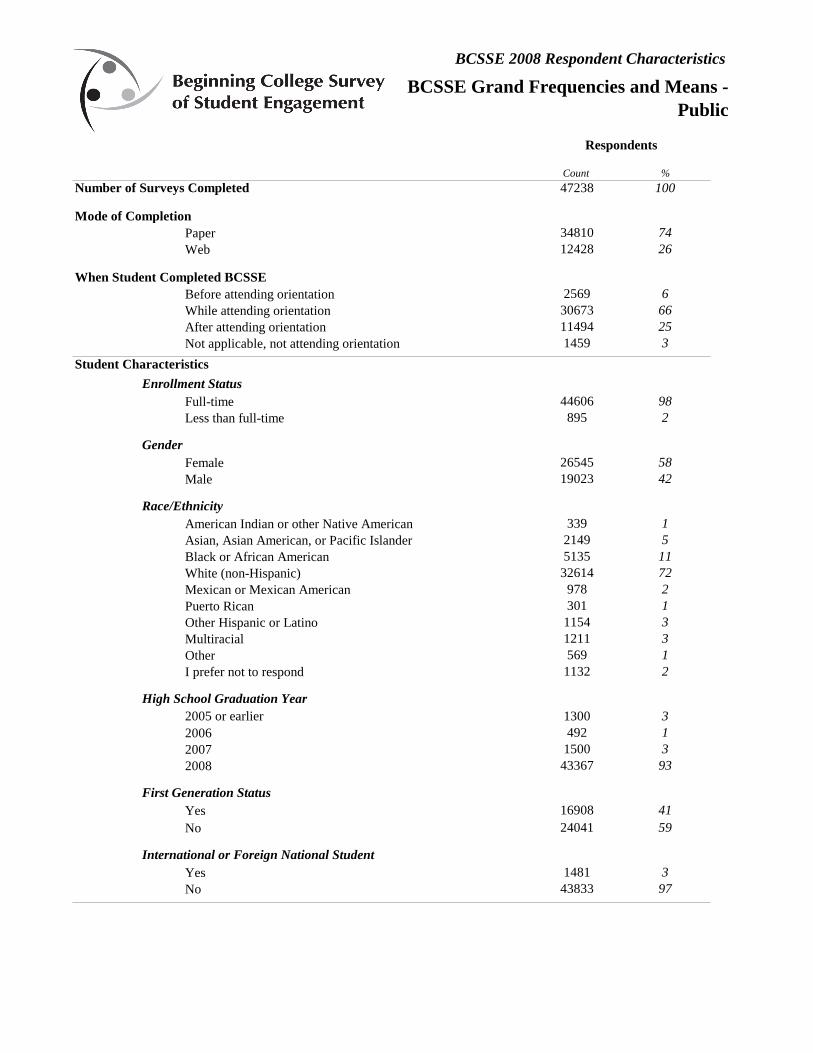
Number of Surveys Completed 47238 100
Mode of Completion
Paper 34810 74
Web 12428 26
When Student Completed BCSSE
Before attending orientation 2569 6
While attending orientation 30673 66
After attending orientation 11494 25
Not applicable, not attending orientation 1459 3
Student Characteristics
Enrollment Status
Full-time 44606 98
Less than full-time 895 2
Gender
Female 26545 58
Male 19023 42
Race/Ethnicity
American Indian or other Native American 339 1
Asian, Asian American, or Pacific Islander 2149 5
Black or African American 5135 11
White (non-Hispanic) 32614 72
Mexican or Mexican American 978 2
Puerto Rican 301 1
Other Hispanic or Latino 1154 3
Multiracial 1211 3
Other 569 1
I prefer not to respond 1132 2
High School Graduation Year
2005 or earlier 1300 3
2006 492 1
2007 1500 3
2008 43367 93
First Generation Status
Yes 16908 41
No 24041 59
International or Foreign National Student
Yes 1481 3
No 43833 97
Respondents
BCSSE 2008 Respondent Characteristics
BCSSE Grand Frequencies and Means -
Public
BCSSE Grand Frequencies and
Means - Public
BCSSE 2008
Frequency Distributions

Variables
Variable Name
Institution-Level
Response Options Count
Scale Name
Results for each item for
the institution overall.
The variable name as it
appears in the data file and
codebook.
Interpreting the Frequency Distributions
BCSSE Grand Frequencies and Means - Public
The actual number of
students who answered
within each response
category.
Column Percentage (%)
The percentage of students
responding to the
particular option in each
question.
Indicates which scale includes this item (if
applicable).
HSE=High School Academic Engagement
EAE=Expected Academic Engagement
EAP=Expected Academic Perseverance
EAD=Expected Academic Difficulty
PAP=Perceived Academic Preparation
ICE=Importance of Campus Environment
Response options
presented as they appear
on the survey.
The items from the BCSSE survey
appear in the left column of the
report with the same wording as
they appear on the instrument.Selected Student Comparisons
Results for each item by gender and first-
generation status.
Variable Scale Response Options Count % Count % Count % Count % Count %
Before attending orientation 171 12 110 14 60 10 97 24 56 6
While attending orientation 1,009 70 531 66 471 77 186 45 769 83
After attending orientation 240 17 155 19 78 13 119 29 96 10
N/A, not attending orientation 13 1 10 1 3 0 8 2 5 1
Total 1,433 100 806 100 612 100 410 100 926 100
Gender
You are taking this survey: tksrvy
BCSSE 2008 Frequency Distributions
NSSEville State University
YesMaleFemaleAll Students
First Generationa
No

Variable Scale Response Options Count % Count % Count % Count % Count %
Before attending orientation 2,569 6 1,474 6 949 5 842 5 1,323 6
While attending orientation 30,673 66 17,314 67 12,533 67 10,610 64 16,286 69
After attending orientation 11,494 25 6,421 25 4,572 25 4,494 27 5,399 23
N/A, not attending orientation 1,459 3 794 3 562 3 572 3 629 3
Total 46,195 100 26,003 100 18,616 100 16,518 100 23,637 100
1. 2005 and earlier 1,300 3 567 2 658 3 608 4 453 2
2006 492 1 230 1 242 1 203 1 211 1
2007 1,500 3 758 3 686 4 595 4 607 3
2008 43,367 93 24,770 94 17,215 92 15,348 92 22,548 95
Total 46,659 100 26,325 100 18,801 100 16,754 100 23,819 100
2. Public 40,860 87 23,358 88 16,179 85 15,419 91 20,029 83
Private, religiously-affiliated 4,272 9 2,157 8 1,961 10 946 6 2,856 12
Private, independent 1,195 3 607 2 530 3 232 1 806 3
Home school 309 1 160 1 131 1 78 0 196 1
Other (e.g., GED) 382 1 199 1 161 1 188 1 100 0
Total 47,018 100 26,481 100 18,962 100 16,863 100 23,987 100
3. C- or lower 156 0 51 0 101 1 78 0 46 0
C 785 2 306 1 455 2 322 2 287 1
C+ 1,716 4 712 3 944 5 672 4 684 3
B- 3,123 7 1,366 5 1,644 9 1,134 7 1,438 6
B 10,432 22 5,465 21 4,625 25 3,831 23 5,175 22
B+ 10,022 21 5,636 21 4,026 21 3,584 21 5,070 21
A- 9,497 20 5,661 22 3,506 19 3,312 20 5,141 22
A 10,867 23 7,044 27 3,509 19 3,771 23 6,000 25
Grades not used 118 0 50 0 58 0 44 0 32 0
Total 46,716 100 26,291 100 18,868 100 16,748 100 23,873 100
4. To date, in which of the following math classes did you earn a passing grade?
a. Did not pass 552 1 275 1 264 1 232 1 226 1
Passed 31,139 67 17,265 66 12,883 69 10,446 63 17,119 72
Did not take 14,697 32 8,637 33 5,555 30 5,986 36 6,384 27
Total 46,388 100 26,177 100 18,702 100 16,664 100 23,729 100
b. Did not pass 412 1 184 1 206 1 171 1 166 1
Passed 10,281 24 5,268 21 4,714 27 3,211 20 6,067 27
Did not take 32,981 76 19,226 78 12,664 72 12,334 78 16,107 72
Total 43,674 100 24,678 100 17,584 100 15,716 100 22,340 100
Yes NoMaleAll Students
BCSSE 2008 Frequency Distributions
BCSSE Grand Frequencies and Means - Public
Gender First Generationa
Female
You are taking this survey: tksrvy
hcalc
Pre-calculus/Trigonometry hprecalc
Calculus
Please write in the year you
graduated from high school.
(for example, "2008"):
hgradyr_r
From which type of high
school did you graduate?
(Select only one.)
htype
What were most of your high
school grades?
(Select only one.)
hgrades
a First generation is defined as no parent or guardian having graduated with a 4-year college degree. 6
Variable Scale Response Options Count % Count % Count % Count % Count %
Yes NoMaleAll Students
BCSSE 2008 Frequency Distributions
BCSSE Grand Frequencies and Means - Public
Gender First Generationa
Female
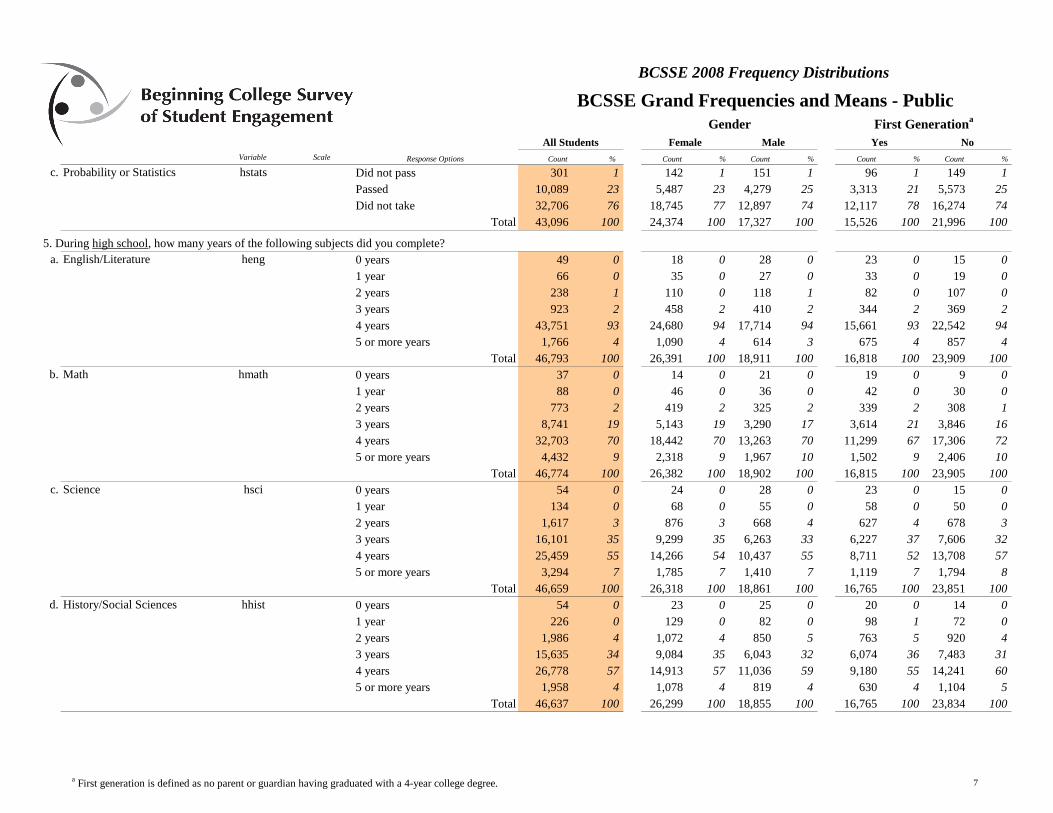
c. Did not pass 301 1 142 1 151 1 96 1 149 1
Passed 10,089 23 5,487 23 4,279 25 3,313 21 5,573 25
Did not take 32,706 76 18,745 77 12,897 74 12,117 78 16,274 74
Total 43,096 100 24,374 100 17,327 100 15,526 100 21,996 100
5. During high school, how many years of the following subjects did you complete?
a. 0 years 49 0 18 0 28 0 23 0 15 0
1 year 66 0 35 0 27 0 33 0 19 0
2 years 238 1 110 0 118 1 82 0 107 0
3 years 923 2 458 2 410 2 344 2 369 2
4 years 43,751 93 24,680 94 17,714 94 15,661 93 22,542 94
5 or more years 1,766 4 1,090 4 614 3 675 4 857 4
Total 46,793 100 26,391 100 18,911 100 16,818 100 23,909 100
b. 0 years 37 0 14 0 21 0 19 0 9 0
1 year 88 0 46 0 36 0 42 0 30 0
2 years 773 2 419 2 325 2 339 2 308 1
3 years 8,741 19 5,143 19 3,290 17 3,614 21 3,846 16
4 years 32,703 70 18,442 70 13,263 70 11,299 67 17,306 72
5 or more years 4,432 9 2,318 9 1,967 10 1,502 9 2,406 10
Total 46,774 100 26,382 100 18,902 100 16,815 100 23,905 100
c. 0 years 54 0 24 0 28 0 23 0 15 0
1 year 134 0 68 0 55 0 58 0 50 0
2 years 1,617 3 876 3 668 4 627 4 678 3
3 years 16,101 35 9,299 35 6,263 33 6,227 37 7,606 32
4 years 25,459 55 14,266 54 10,437 55 8,711 52 13,708 57
5 or more years 3,294 7 1,785 7 1,410 7 1,119 7 1,794 8
Total 46,659 100 26,318 100 18,861 100 16,765 100 23,851 100
d. 0 years 54 0 23 0 25 0 20 0 14 0
1 year 226 0 129 0 82 0 98 1 72 0
2 years 1,986 4 1,072 4 850 5 763 5 920 4
3 years 15,635 34 9,084 35 6,043 32 6,074 36 7,483 31
4 years 26,778 57 14,913 57 11,036 59 9,180 55 14,241 60
5 or more years 1,958 4 1,078 4 819 4 630 4 1,104 5
Total 46,637 100 26,299 100 18,855 100 16,765 100 23,834 100
English/Literature heng
Probability or Statistics hstats
Math hmath
Science hsci
History/Social Sciences hhist
a First generation is defined as no parent or guardian having graduated with a 4-year college degree. 7

Variable Scale Response Options Count % Count % Count % Count % Count %
Yes NoMaleAll Students
BCSSE 2008 Frequency Distributions
BCSSE Grand Frequencies and Means - Public
Gender First Generationa
Female
e. 0 years 1,522 3 657 2 788 4 698 4 511 2
1 year 2,861 6 1,482 6 1,269 7 1,225 7 1,133 5
2 years 20,127 43 10,760 41 8,753 46 7,715 46 9,787 41
3 years 13,468 29 7,946 30 5,128 27 4,532 27 7,291 31
4 years 7,522 16 4,722 18 2,557 14 2,271 14 4,453 19
5 or more years 1,209 3 769 3 391 2 355 2 696 3
Total 46,709 100 26,336 100 18,886 100 16,796 100 23,871 100
6. During high school, how many of the following types of classes did you complete?
a. 0 classes 19,700 44 10,720 42 8,316 46 7,719 48 8,972 39
1 class 8,224 18 4,746 19 3,204 18 2,948 18 4,207 18
2 classes 5,906 13 3,456 14 2,259 12 1,990 12 3,268 14
3 classes 3,881 9 2,299 9 1,474 8 1,254 8 2,237 10
4 classes 2,675 6 1,569 6 1,033 6 817 5 1,593 7
5 or more classes 4,510 10 2,563 10 1,839 10 1,352 8 2,789 12
Total 44,896 100 25,353 100 18,125 100 16,080 100 23,066 100
b. 0 classes 15,801 35 8,348 33 6,910 38 6,235 39 7,060 30
1 class 4,553 10 2,540 10 1,852 10 1,633 10 2,279 10
2 classes 4,343 10 2,573 10 1,630 9 1,615 10 2,171 9
3 classes 3,375 7 1,930 8 1,340 7 1,167 7 1,804 8
4 classes 2,953 7 1,761 7 1,104 6 1,067 7 1,550 7
5 or more classes 14,079 31 8,373 33 5,349 29 4,476 28 8,300 36
Total 45,104 100 25,525 100 18,185 100 16,193 100 23,164 100
7. During your last year of high school, about how much reading and writing did you do?
a. HSE None 401 1 160 1 228 1 162 1 173 1
Very little 3,705 8 1,758 7 1,822 10 1,389 8 1,828 8
Some 13,731 29 6,908 26 6,365 34 5,041 30 6,770 28
Quite a bit 17,196 37 9,821 37 6,877 36 6,213 37 8,845 37
Very much 11,623 25 7,706 29 3,584 19 3,968 24 6,273 26
Total 46,656 100 26,353 100 18,876 100 16,773 100 23,889 100
b. HSE None 271 1 130 0 129 1 116 1 96 0
Very little 3,004 6 1,602 6 1,313 7 1,228 7 1,362 6
Some 11,934 26 6,154 23 5,378 28 4,438 26 5,828 24
Quite a bit 17,684 38 9,791 37 7,366 39 6,300 37 9,160 38
Very much 13,826 30 8,706 33 4,720 25 4,720 28 7,469 31
Total 46,719 100 26,383 100 18,906 100 16,802 100 23,915 100
Honors classes (not AP) taught
at your high school
hhonor
Foreign Language hforlan
Advanced Placement (AP)
classes
hapcl
Assigned reading (textbooks or
other course materials)
hreadasg
Writing short papers or reports
(5 or fewer pages)
hwrite5
a First generation is defined as no parent or guardian having graduated with a 4-year college degree. 8
Variable Scale Response Options Count % Count % Count % Count % Count %
Yes NoMaleAll Students
BCSSE 2008 Frequency Distributions
BCSSE Grand Frequencies and Means - Public
Gender First Generationa
Female
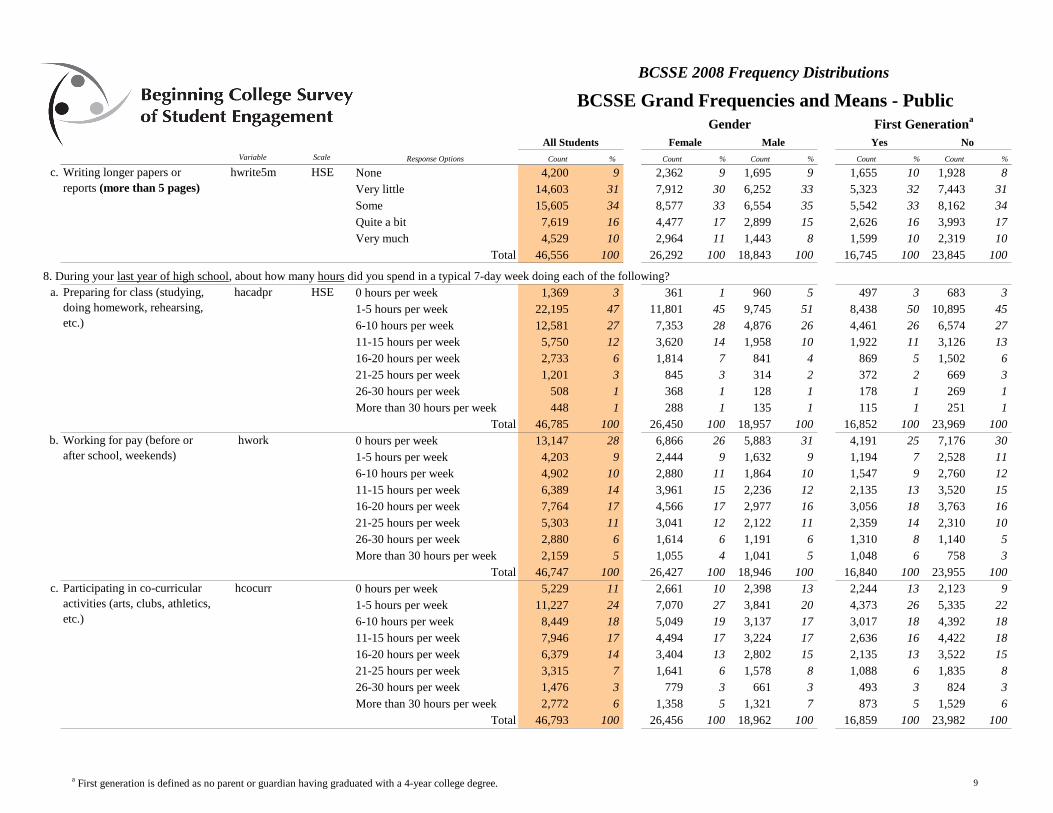
c. HSE None 4,200 9 2,362 9 1,695 9 1,655 10 1,928 8
Very little 14,603 31 7,912 30 6,252 33 5,323 32 7,443 31
Some 15,605 34 8,577 33 6,554 35 5,542 33 8,162 34
Quite a bit 7,619 16 4,477 17 2,899 15 2,626 16 3,993 17
Very much 4,529 10 2,964 11 1,443 8 1,599 10 2,319 10
Total 46,556 100 26,292 100 18,843 100 16,745 100 23,845 100
8. During your last year of high school, about how many hours did you spend in a typical 7-day week doing each of the following?
a. HSE 0 hours per week 1,369 3 361 1 960 5 497 3 683 3
1-5 hours per week 22,195 47 11,801 45 9,745 51 8,438 50 10,895 45
6-10 hours per week 12,581 27 7,353 28 4,876 26 4,461 26 6,574 27
11-15 hours per week 5,750 12 3,620 14 1,958 10 1,922 11 3,126 13
16-20 hours per week 2,733 6 1,814 7 841 4 869 5 1,502 6
21-25 hours per week 1,201 3 845 3 314 2 372 2 669 3
26-30 hours per week 508 1 368 1 128 1 178 1 269 1
More than 30 hours per week 448 1 288 1 135 1 115 1 251 1
Total 46,785 100 26,450 100 18,957 100 16,852 100 23,969 100
b. 0 hours per week 13,147 28 6,866 26 5,883 31 4,191 25 7,176 30
1-5 hours per week 4,203 9 2,444 9 1,632 9 1,194 7 2,528 11
6-10 hours per week 4,902 10 2,880 11 1,864 10 1,547 9 2,760 12
11-15 hours per week 6,389 14 3,961 15 2,236 12 2,135 13 3,520 15
16-20 hours per week 7,764 17 4,566 17 2,977 16 3,056 18 3,763 16
21-25 hours per week 5,303 11 3,041 12 2,122 11 2,359 14 2,310 10
26-30 hours per week 2,880 6 1,614 6 1,191 6 1,310 8 1,140 5
More than 30 hours per week 2,159 5 1,055 4 1,041 5 1,048 6 758 3
Total 46,747 100 26,427 100 18,946 100 16,840 100 23,955 100
c. 0 hours per week 5,229 11 2,661 10 2,398 13 2,244 13 2,123 9
1-5 hours per week 11,227 24 7,070 27 3,841 20 4,373 26 5,335 22
6-10 hours per week 8,449 18 5,049 19 3,137 17 3,017 18 4,392 18
11-15 hours per week 7,946 17 4,494 17 3,224 17 2,636 16 4,422 18
16-20 hours per week 6,379 14 3,404 13 2,802 15 2,135 13 3,522 15
21-25 hours per week 3,315 7 1,641 6 1,578 8 1,088 6 1,835 8
26-30 hours per week 1,476 3 779 3 661 3 493 3 824 3
More than 30 hours per week 2,772 6 1,358 5 1,321 7 873 5 1,529 6
Total 46,793 100 26,456 100 18,962 100 16,859 100 23,982 100
Participating in co-curricular
activities (arts, clubs, athletics,
etc.)
hcocurr
Writing longer papers or
reports (more than 5 pages)
hwrite5m
Preparing for class (studying,
doing homework, rehearsing,
etc.)
hacadpr
Working for pay (before or
after school, weekends)
hwork
a First generation is defined as no parent or guardian having graduated with a 4-year college degree. 9

Variable Scale Response Options Count % Count % Count % Count % Count %
Yes NoMaleAll Students
BCSSE 2008 Frequency Distributions
BCSSE Grand Frequencies and Means - Public
Gender First Generationa
Female
d. 0 hours per week 203 0 125 0 73 0 87 1 72 0
1-5 hours per week 8,476 18 5,702 22 2,491 13 3,333 20 3,919 16
6-10 hours per week 12,288 26 7,536 28 4,408 23 4,588 27 6,215 26
11-15 hours per week 9,501 20 5,333 20 3,882 20 3,304 20 5,056 21
16-20 hours per week 6,947 15 3,540 13 3,197 17 2,348 14 3,716 16
21-25 hours per week 3,734 8 1,825 7 1,803 10 1,293 8 1,991 8
26-30 hours per week 1,731 4 892 3 803 4 561 3 975 4
More than 30 hours per week 3,895 8 1,494 6 2,304 12 1,333 8 2,023 8
Total 46,775 100 26,447 100 18,961 100 16,847 100 23,967 100
9. During your last year of high school, about how often did you do each of the following?
a. HSE Never 682 1 328 1 335 2 244 1 327 1
Sometimes 11,999 26 6,394 24 5,244 28 4,409 26 5,913 25
Often 17,620 38 9,837 37 7,287 39 6,181 37 9,217 39
Very often 16,384 35 9,894 37 6,027 32 6,006 36 8,457 35
Total 46,685 100 26,453 100 18,893 100 16,840 100 23,914 100
b. HSE Never 945 2 504 2 411 2 365 2 413 2
Sometimes 22,435 48 12,200 46 9,619 51 8,151 48 11,503 48
Often 17,150 37 9,863 37 6,775 36 6,092 36 8,943 37
Very often 6,081 13 3,836 15 2,074 11 2,211 13 3,026 13
Total 46,611 100 26,403 100 18,879 100 16,819 100 23,885 100
c. Never 13,780 30 9,030 34 4,374 23 5,110 30 7,026 29
Sometimes 28,285 61 15,620 59 11,861 63 10,215 61 14,427 60
Often 3,301 7 1,284 5 1,912 10 1,117 7 1,737 7
Very often 1,242 3 471 2 727 4 374 2 695 3
Total 46,608 100 26,405 100 18,874 100 16,816 100 23,885 100
d. HSE Never 2,026 4 1,020 4 950 5 749 4 1,015 4
Sometimes 19,801 43 11,272 43 7,957 42 6,854 41 10,526 44
Often 17,324 37 9,613 37 7,234 38 6,287 38 8,907 37
Very often 7,313 16 4,417 17 2,674 14 2,872 17 3,369 14
Total 46,464 100 26,322 100 18,815 100 16,762 100 23,817 100
e. HSE Never 882 2 491 2 355 2 310 2 427 2
Sometimes 15,713 34 8,705 33 6,581 35 5,543 33 8,277 35
Often 21,843 47 12,292 47 8,927 47 7,841 47 11,232 47
Very often 8,132 17 4,908 19 2,989 16 3,122 19 3,924 16
Total 46,570 100 26,396 100 18,852 100 16,816 100 23,860 100
Worked with other students
on projects during class
hclassgr
Relaxing and socializing
(watching TV, partying, etc.)
hsocial
Asked questions in class or
contributed to class
discussions
hclquest
Discussed grades or
assignments with a teacher
hfacgrad
Came to class without
completing readings or
assignments
hclunpre
Made a class presentation hclprese
a First generation is defined as no parent or guardian having graduated with a 4-year college degree. 10
Variable Scale Response Options Count % Count % Count % Count % Count %
Yes NoMaleAll Students
BCSSE 2008 Frequency Distributions
BCSSE Grand Frequencies and Means - Public
Gender First Generationa
Female
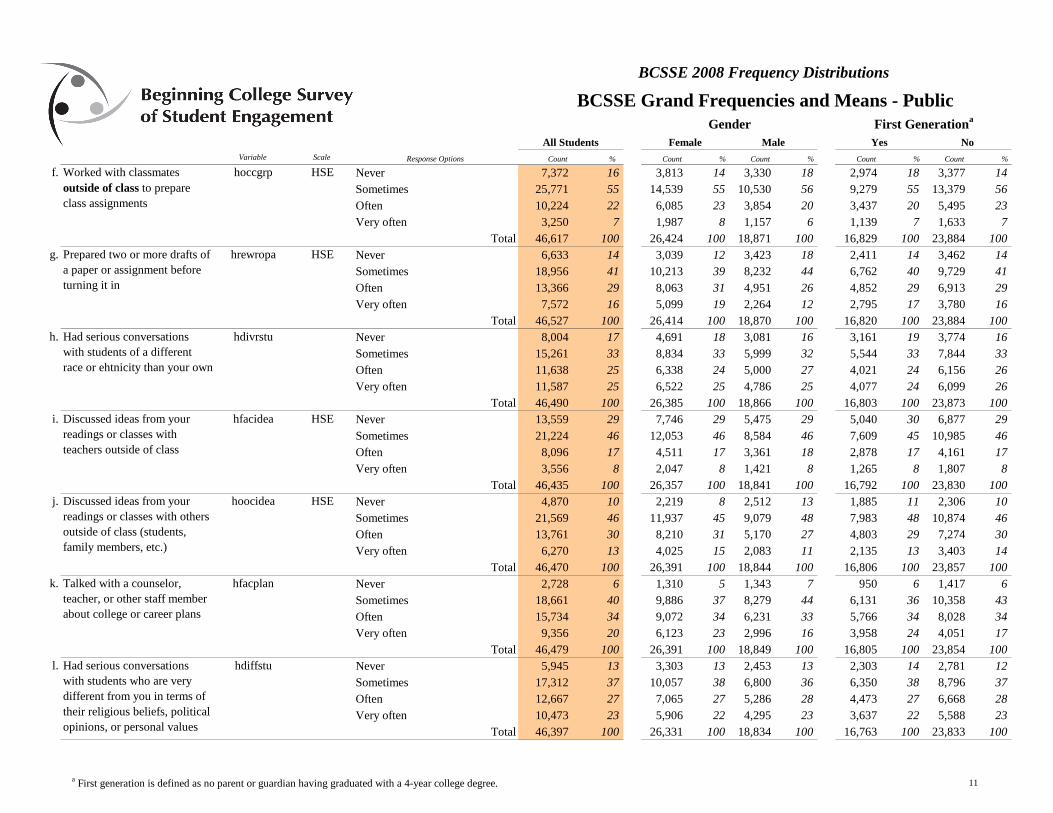
f. HSE Never 7,372 16 3,813 14 3,330 18 2,974 18 3,377 14
Sometimes 25,771 55 14,539 55 10,530 56 9,279 55 13,379 56
Often 10,224 22 6,085 23 3,854 20 3,437 20 5,495 23
Very often 3,250 7 1,987 8 1,157 6 1,139 7 1,633 7
Total 46,617 100 26,424 100 18,871 100 16,829 100 23,884 100
g. HSE Never 6,633 14 3,039 12 3,423 18 2,411 14 3,462 14
Sometimes 18,956 41 10,213 39 8,232 44 6,762 40 9,729 41
Often 13,366 29 8,063 31 4,951 26 4,852 29 6,913 29
Very often 7,572 16 5,099 19 2,264 12 2,795 17 3,780 16
Total 46,527 100 26,414 100 18,870 100 16,820 100 23,884 100
h. Never 8,004 17 4,691 18 3,081 16 3,161 19 3,774 16
Sometimes 15,261 33 8,834 33 5,999 32 5,544 33 7,844 33
Often 11,638 25 6,338 24 5,000 27 4,021 24 6,156 26
Very often 11,587 25 6,522 25 4,786 25 4,077 24 6,099 26
Total 46,490 100 26,385 100 18,866 100 16,803 100 23,873 100
i. HSE Never 13,559 29 7,746 29 5,475 29 5,040 30 6,877 29
Sometimes 21,224 46 12,053 46 8,584 46 7,609 45 10,985 46
Often 8,096 17 4,511 17 3,361 18 2,878 17 4,161 17
Very often 3,556 8 2,047 8 1,421 8 1,265 8 1,807 8
Total 46,435 100 26,357 100 18,841 100 16,792 100 23,830 100
j. HSE Never 4,870 10 2,219 8 2,512 13 1,885 11 2,306 10
Sometimes 21,569 46 11,937 45 9,079 48 7,983 48 10,874 46
Often 13,761 30 8,210 31 5,170 27 4,803 29 7,274 30
Very often 6,270 13 4,025 15 2,083 11 2,135 13 3,403 14
Total 46,470 100 26,391 100 18,844 100 16,806 100 23,857 100
k. Never 2,728 6 1,310 5 1,343 7 950 6 1,417 6
Sometimes 18,661 40 9,886 37 8,279 44 6,131 36 10,358 43
Often 15,734 34 9,072 34 6,231 33 5,766 34 8,028 34
Very often 9,356 20 6,123 23 2,996 16 3,958 24 4,051 17
Total 46,479 100 26,391 100 18,849 100 16,805 100 23,854 100
l. Never 5,945 13 3,303 13 2,453 13 2,303 14 2,781 12
Sometimes 17,312 37 10,057 38 6,800 36 6,350 38 8,796 37
Often 12,667 27 7,065 27 5,286 28 4,473 27 6,668 28
Very often 10,473 23 5,906 22 4,295 23 3,637 22 5,588 23
Total 46,397 100 26,331 100 18,834 100 16,763 100 23,833 100
Talked with a counselor,
teacher, or other staff member
about college or career plans
hfacplan
Worked with classmates
outside of class to prepare
class assignments
hoccgrp
Prepared two or more drafts of
a paper or assignment before
turning it in
hrewropa
Had serious conversations
with students of a different
race or ehtnicity than your own
hdivrstu
Discussed ideas from your
readings or classes with
teachers outside of class
hfacidea
Discussed ideas from your
readings or classes with others
outside of class (students,
family members, etc.)
hoocidea
Had serious conversations
with students who are very
different from you in terms of
their religious beliefs, political
opinions, or personal values
hdiffstu
a First generation is defined as no parent or guardian having graduated with a 4-year college degree. 11
Variable Scale Response Options Count % Count % Count % Count % Count %
Yes NoMaleAll Students
BCSSE 2008 Frequency Distributions
BCSSE Grand Frequencies and Means - Public
Gender First Generationa
Female
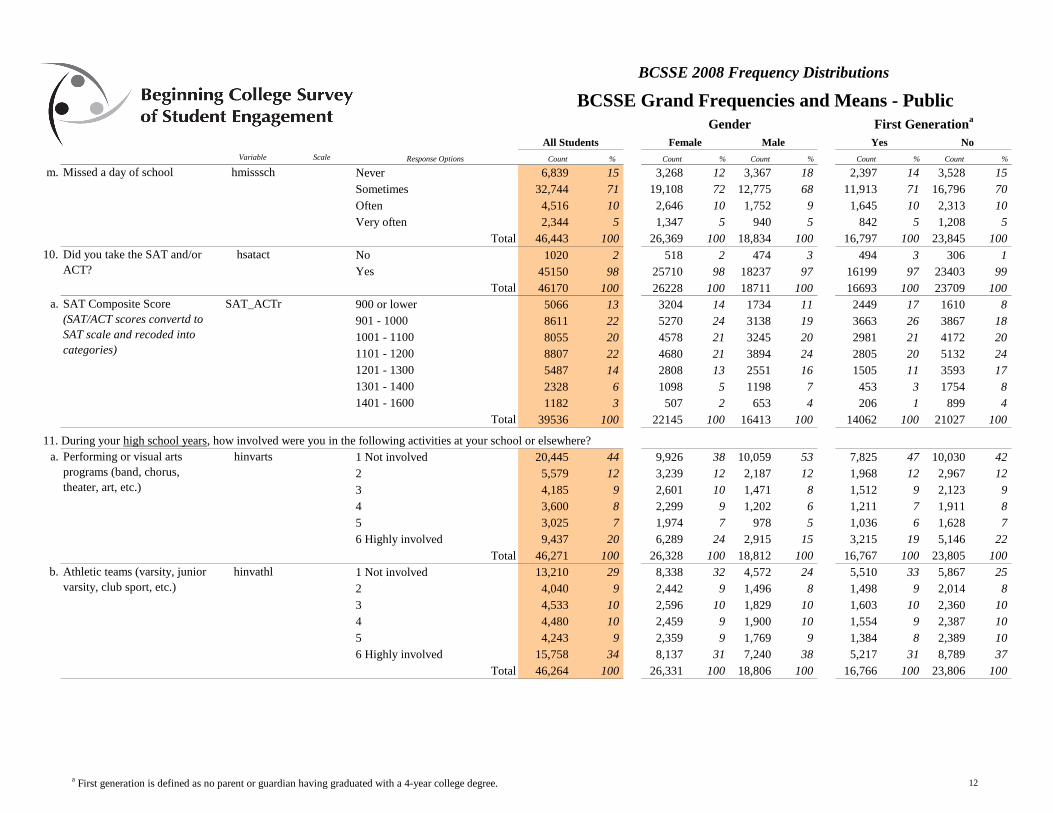
m. Never 6,839 15 3,268 12 3,367 18 2,397 14 3,528 15
Sometimes 32,744 71 19,108 72 12,775 68 11,913 71 16,796 70
Often 4,516 10 2,646 10 1,752 9 1,645 10 2,313 10
Very often 2,344 5 1,347 5 940 5 842 5 1,208 5
Total 46,443 100 26,369 100 18,834 100 16,797 100 23,845 100
10. hsatact No 1020 2 518 2 474 3 494 3 306 1
Yes 45150 98 25710 98 18237 97 16199 97 23403 99
Total 46170 100 26228 100 18711 100 16693 100 23709 100
a. SAT_ACTr 900 or lower 5066 13 3204 14 1734 11 2449 17 1610 8
901 - 1000 8611 22 5270 24 3138 19 3663 26 3867 18
1001 - 1100 8055 20 4578 21 3245 20 2981 21 4172 20
1101 - 1200 8807 22 4680 21 3894 24 2805 20 5132 24
1201 - 1300 5487 14 2808 13 2551 16 1505 11 3593 17
1301 - 1400 2328 6 1098 5 1198 7 453 3 1754 8
1401 - 1600 1182 3 507 2 653 4 206 1 899 4
Total 39536 100 22145 100 16413 100 14062 100 21027 100
11. During your high school years, how involved were you in the following activities at your school or elsewhere?
a. 1 Not involved 20,445 44 9,926 38 10,059 53 7,825 47 10,030 42
2 5,579 12 3,239 12 2,187 12 1,968 12 2,967 12
3 4,185 9 2,601 10 1,471 8 1,512 9 2,123 9
4 3,600 8 2,299 9 1,202 6 1,211 7 1,911 8
5 3,025 7 1,974 7 978 5 1,036 6 1,628 7
6 Highly involved 9,437 20 6,289 24 2,915 15 3,215 19 5,146 22
Total 46,271 100 26,328 100 18,812 100 16,767 100 23,805 100
b. 1 Not involved 13,210 29 8,338 32 4,572 24 5,510 33 5,867 25
2 4,040 9 2,442 9 1,496 8 1,498 9 2,014 8
3 4,533 10 2,596 10 1,829 10 1,603 10 2,360 10
4 4,480 10 2,459 9 1,900 10 1,554 9 2,387 10
5 4,243 9 2,359 9 1,769 9 1,384 8 2,389 10
6 Highly involved 15,758 34 8,137 31 7,240 38 5,217 31 8,789 37
Total 46,264 100 26,331 100 18,806 100 16,766 100 23,806 100
Missed a day of school hmisssch
Did you take the SAT and/or
ACT?
SAT Composite Score
(SAT/ACT scores convertd to
SAT scale and recoded into
categories)
Performing or visual arts
programs (band, chorus,
theater, art, etc.)
hinvarts
Athletic teams (varsity, junior
varsity, club sport, etc.)
hinvathl
a First generation is defined as no parent or guardian having graduated with a 4-year college degree. 12

Variable Scale Response Options Count % Count % Count % Count % Count %
Yes NoMaleAll Students
BCSSE 2008 Frequency Distributions
BCSSE Grand Frequencies and Means - Public
Gender First Generationa
Female
c. 1 Not involved 31,398 68 17,019 65 13,643 73 11,479 69 16,008 68
2 5,044 11 2,873 11 2,051 11 1,777 11 2,646 11
3 3,325 7 2,019 8 1,204 6 1,209 7 1,693 7
4 2,196 5 1,411 5 733 4 778 5 1,164 5
5 1,311 3 925 4 356 2 450 3 726 3
6 Highly involved 2,756 6 1,972 8 710 4 1,001 6 1,457 6
Total 46,030 100 26,219 100 18,697 100 16,694 100 23,694 100
d. 1 Not involved 32,312 70 17,151 65 14,391 77 11,705 70 16,633 70
2 4,368 9 2,597 10 1,640 9 1,508 9 2,299 10
3 2,908 6 1,841 7 1,006 5 1,046 6 1,501 6
4 1,956 4 1,304 5 602 3 728 4 974 4
5 1,312 3 919 4 360 2 504 3 659 3
6 Highly involved 3,260 7 2,435 9 741 4 1,228 7 1,664 7
Total 46,116 100 26,247 100 18,740 100 16,719 100 23,730 100
e. 1 Not involved 23,531 51 12,016 46 10,939 58 8,870 53 11,375 48
2 4,234 9 2,279 9 1,850 10 1,436 9 2,248 9
3 4,551 10 2,551 10 1,867 10 1,587 10 2,423 10
4 4,313 9 2,609 10 1,601 9 1,490 9 2,393 10
5 3,837 8 2,662 10 1,098 6 1,259 8 2,237 9
6 Highly involved 5,581 12 4,082 16 1,372 7 2,036 12 3,038 13
Total 46,047 100 26,199 100 18,727 100 16,678 100 23,714 100
f. 1 Not involved 30,212 66 17,027 65 12,463 66 11,181 67 15,090 64
2 4,876 11 2,731 10 2,023 11 1,649 10 2,683 11
3 4,065 9 2,306 9 1,652 9 1,394 8 2,206 9
4 2,797 6 1,593 6 1,127 6 977 6 1,529 6
5 1,657 4 1,044 4 578 3 585 4 917 4
6 Highly involved 2,510 5 1,545 6 909 5 925 6 1,309 6
Total 46,117 100 26,246 100 18,752 100 16,711 100 23,734 100
g. 1 Not involved 31,214 68 17,681 67 12,789 68 11,112 66 16,278 69
2 4,014 9 2,196 8 1,708 9 1,385 8 2,148 9
3 3,589 8 1,901 7 1,594 8 1,269 8 1,863 8
4 2,623 6 1,488 6 1,063 6 966 6 1,330 6
5 1,657 4 1,007 4 606 3 656 4 822 3
6 Highly involved 3,059 7 1,982 8 1,017 5 1,349 8 1,316 6
Total 46,156 100 26,255 100 18,777 100 16,737 100 23,757 100
Student government hstugov
Publications (student
newspaper, yearbook, etc.)
hinvpubs
Academic honor societies hinvhono
Vocational clubs (business,
health, technology, etc.)
hinvvccl
Academic clubs (debate,
mathematics, science, etc.)
hinvaccl
a First generation is defined as no parent or guardian having graduated with a 4-year college degree. 13
Variable Scale Response Options Count % Count % Count % Count % Count %
Yes NoMaleAll Students
BCSSE 2008 Frequency Distributions
BCSSE Grand Frequencies and Means - Public
Gender First Generationa
Female
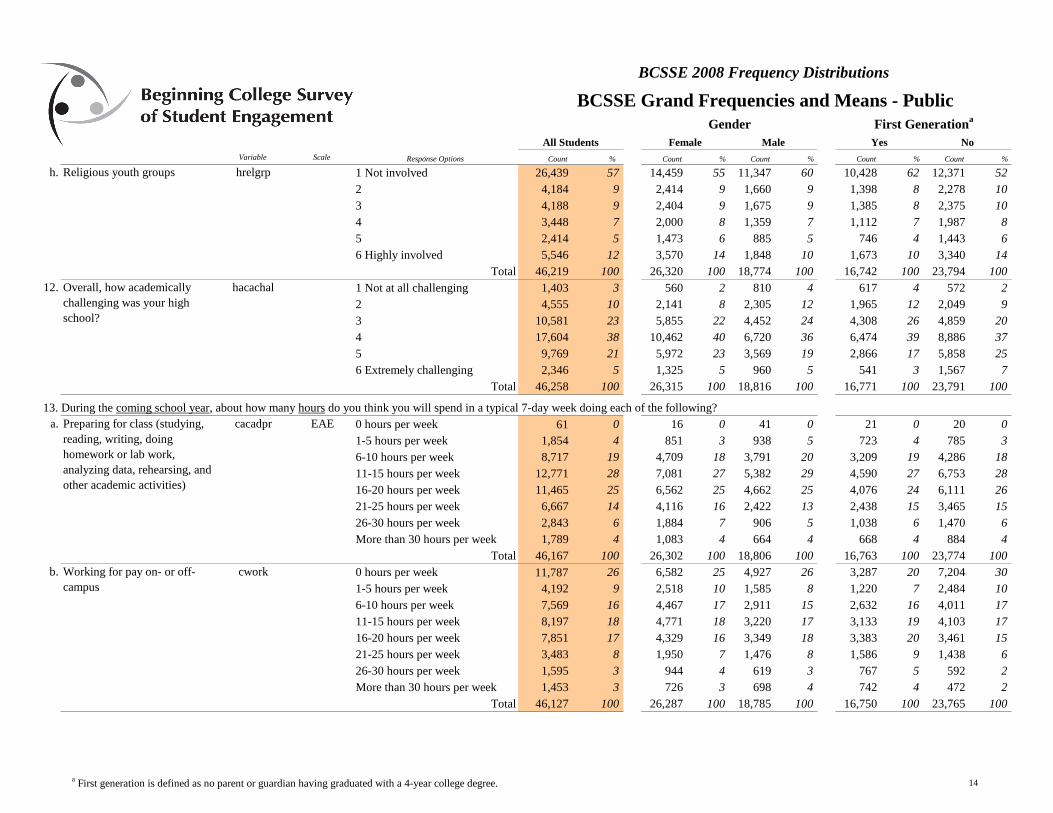
h. 1 Not involved 26,439 57 14,459 55 11,347 60 10,428 62 12,371 52
2 4,184 9 2,414 9 1,660 9 1,398 8 2,278 10
3 4,188 9 2,404 9 1,675 9 1,385 8 2,375 10
4 3,448 7 2,000 8 1,359 7 1,112 7 1,987 8
5 2,414 5 1,473 6 885 5 746 4 1,443 6
6 Highly involved 5,546 12 3,570 14 1,848 10 1,673 10 3,340 14
Total 46,219 100 26,320 100 18,774 100 16,742 100 23,794 100
12. 1 Not at all challenging 1,403 3 560 2 810 4 617 4 572 2
2 4,555 10 2,141 8 2,305 12 1,965 12 2,049 9
3 10,581 23 5,855 22 4,452 24 4,308 26 4,859 20
4 17,604 38 10,462 40 6,720 36 6,474 39 8,886 37
5 9,769 21 5,972 23 3,569 19 2,866 17 5,858 25
6 Extremely challenging 2,346 5 1,325 5 960 5 541 3 1,567 7
Total 46,258 100 26,315 100 18,816 100 16,771 100 23,791 100
13. During the coming school year, about how many hours do you think you will spend in a typical 7-day week doing each of the following?
a. EAE 0 hours per week 61 0 16 0 41 0 21 0 20 0
1-5 hours per week 1,854 4 851 3 938 5 723 4 785 3
6-10 hours per week 8,717 19 4,709 18 3,791 20 3,209 19 4,286 18
11-15 hours per week 12,771 28 7,081 27 5,382 29 4,590 27 6,753 28
16-20 hours per week 11,465 25 6,562 25 4,662 25 4,076 24 6,111 26
21-25 hours per week 6,667 14 4,116 16 2,422 13 2,438 15 3,465 15
26-30 hours per week 2,843 6 1,884 7 906 5 1,038 6 1,470 6
More than 30 hours per week 1,789 4 1,083 4 664 4 668 4 884 4
Total 46,167 100 26,302 100 18,806 100 16,763 100 23,774 100
b. 0 hours per week 11,787 26 6,582 25 4,927 26 3,287 20 7,204 30
1-5 hours per week 4,192 9 2,518 10 1,585 8 1,220 7 2,484 10
6-10 hours per week 7,569 16 4,467 17 2,911 15 2,632 16 4,011 17
11-15 hours per week 8,197 18 4,771 18 3,220 17 3,133 19 4,103 17
16-20 hours per week 7,851 17 4,329 16 3,349 18 3,383 20 3,461 15
21-25 hours per week 3,483 8 1,950 7 1,476 8 1,586 9 1,438 6
26-30 hours per week 1,595 3 944 4 619 3 767 5 592 2
More than 30 hours per week 1,453 3 726 3 698 4 742 4 472 2
Total 46,127 100 26,287 100 18,785 100 16,750 100 23,765 100
Overall, how academically
challenging was your high
school?
hacachal
Religious youth groups hrelgrp
Preparing for class (studying,
reading, writing, doing
homework or lab work,
analyzing data, rehearsing, and
other academic activities)
cacadpr
Working for pay on- or off-
campus
cwork
a First generation is defined as no parent or guardian having graduated with a 4-year college degree. 14
Variable Scale Response Options Count % Count % Count % Count % Count %
Yes NoMaleAll Students
BCSSE 2008 Frequency Distributions
BCSSE Grand Frequencies and Means - Public
Gender First Generationa
Female
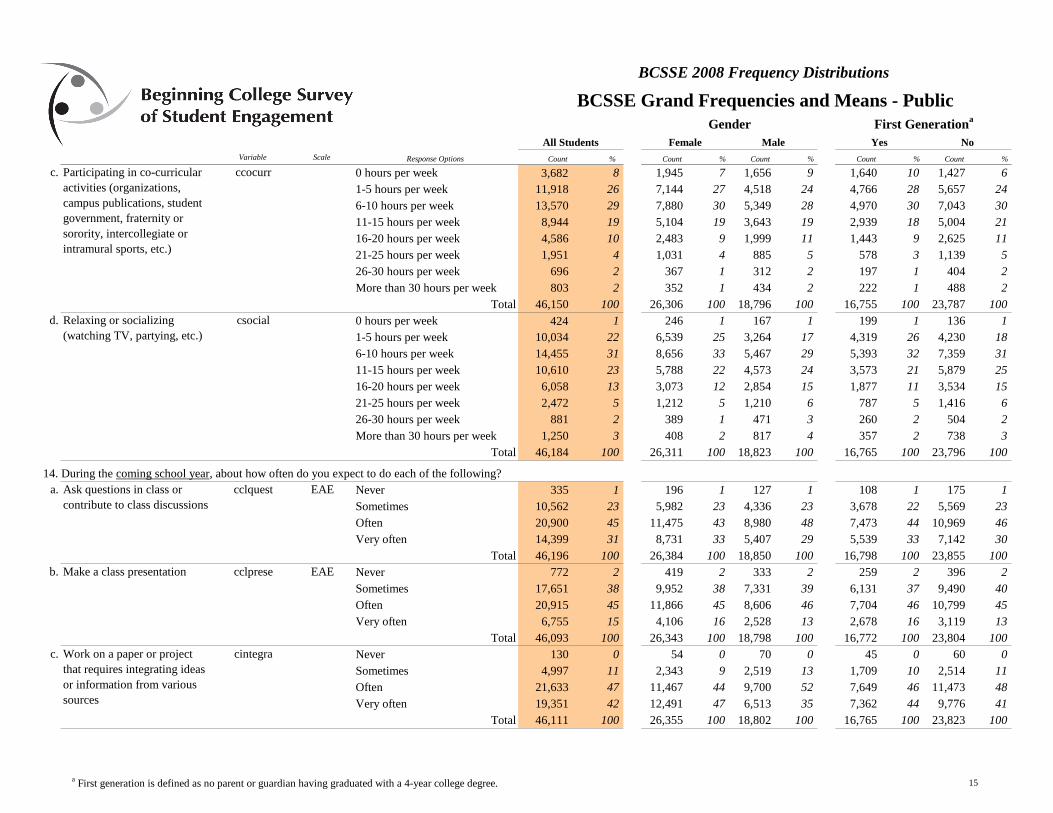
c. 0 hours per week 3,682 8 1,945 7 1,656 9 1,640 10 1,427 6
1-5 hours per week 11,918 26 7,144 27 4,518 24 4,766 28 5,657 24
6-10 hours per week 13,570 29 7,880 30 5,349 28 4,970 30 7,043 30
11-15 hours per week 8,944 19 5,104 19 3,643 19 2,939 18 5,004 21
16-20 hours per week 4,586 10 2,483 9 1,999 11 1,443 9 2,625 11
21-25 hours per week 1,951 4 1,031 4 885 5 578 3 1,139 5
26-30 hours per week 696 2 367 1 312 2 197 1 404 2
More than 30 hours per week 803 2 352 1 434 2 222 1 488 2
Total 46,150 100 26,306 100 18,796 100 16,755 100 23,787 100
d. 0 hours per week 424 1 246 1 167 1 199 1 136 1
1-5 hours per week 10,034 22 6,539 25 3,264 17 4,319 26 4,230 18
6-10 hours per week 14,455 31 8,656 33 5,467 29 5,393 32 7,359 31
11-15 hours per week 10,610 23 5,788 22 4,573 24 3,573 21 5,879 25
16-20 hours per week 6,058 13 3,073 12 2,854 15 1,877 11 3,534 15
21-25 hours per week 2,472 5 1,212 5 1,210 6 787 5 1,416 6
26-30 hours per week 881 2 389 1 471 3 260 2 504 2
More than 30 hours per week 1,250 3 408 2 817 4 357 2 738 3
Total 46,184 100 26,311 100 18,823 100 16,765 100 23,796 100
14. During the coming school year, about how often do you expect to do each of the following?
a. EAE Never 335 1 196 1 127 1 108 1 175 1
Sometimes 10,562 23 5,982 23 4,336 23 3,678 22 5,569 23
Often 20,900 45 11,475 43 8,980 48 7,473 44 10,969 46
Very often 14,399 31 8,731 33 5,407 29 5,539 33 7,142 30
Total 46,196 100 26,384 100 18,850 100 16,798 100 23,855 100
b. EAE Never 772 2 419 2 333 2 259 2 396 2
Sometimes 17,651 38 9,952 38 7,331 39 6,131 37 9,490 40
Often 20,915 45 11,866 45 8,606 46 7,704 46 10,799 45
Very often 6,755 15 4,106 16 2,528 13 2,678 16 3,119 13
Total 46,093 100 26,343 100 18,798 100 16,772 100 23,804 100
c. Never 130 0 54 0 70 0 45 0 60 0
Sometimes 4,997 11 2,343 9 2,519 13 1,709 10 2,514 11
Often 21,633 47 11,467 44 9,700 52 7,649 46 11,473 48
Very often 19,351 42 12,491 47 6,513 35 7,362 44 9,776 41
Total 46,111 100 26,355 100 18,802 100 16,765 100 23,823 100
Make a class presentation cclprese
Participating in co-curricular
activities (organizations,
campus publications, student
government, fraternity or
sorority, intercollegiate or
intramural sports, etc.)
ccocurr
Relaxing or socializing
(watching TV, partying, etc.)
csocial
Ask questions in class or
contribute to class discussions
cclquest
Work on a paper or project
that requires integrating ideas
or information from various
sources
cintegra
a First generation is defined as no parent or guardian having graduated with a 4-year college degree. 15

Variable Scale Response Options Count % Count % Count % Count % Count %
Yes NoMaleAll Students
BCSSE 2008 Frequency Distributions
BCSSE Grand Frequencies and Means - Public
Gender First Generationa
Female
d. EAE Never 2,420 5 1,464 6 894 5 817 5 1,357 6
Sometimes 17,409 38 10,206 39 6,838 36 6,136 37 9,385 39
Often 18,231 40 9,957 38 7,905 42 6,655 40 9,315 39
Very often 8,007 17 4,695 18 3,156 17 3,143 19 3,745 16
Total 46,067 100 26,322 100 18,793 100 16,751 100 23,802 100
e. EAE Never 906 2 466 2 413 2 335 2 419 2
Sometimes 13,309 29 7,342 28 5,688 30 4,858 29 6,799 29
Often 20,624 45 11,594 44 8,593 46 7,345 44 10,938 46
Very often 11,303 24 6,959 26 4,133 22 4,243 25 5,681 24
Total 46,142 100 26,361 100 18,827 100 16,781 100 23,837 100
f. Never 534 1 292 1 230 1 198 1 248 1
Sometimes 10,934 24 5,730 22 4,965 26 3,961 24 5,567 23
Often 22,321 48 12,430 47 9,415 50 8,028 48 11,714 49
Very often 12,307 27 7,889 30 4,197 22 4,577 27 6,284 26
Total 46,096 100 26,341 100 18,807 100 16,764 100 23,813 100
g. EAE Never 541 1 261 1 267 1 171 1 293 1
Sometimes 14,879 32 8,167 31 6,412 34 5,146 31 8,040 34
Often 19,337 42 10,877 41 8,047 43 6,994 42 10,095 42
Very often 11,346 25 7,048 27 4,080 22 4,462 27 5,386 23
Total 46,103 100 26,353 100 18,806 100 16,773 100 23,814 100
h. EAE Never 3,309 7 2,021 8 1,225 7 1,252 7 1,664 7
Sometimes 21,613 47 12,320 47 8,839 47 7,710 46 11,476 48
Often 14,650 32 8,074 31 6,285 33 5,256 31 7,590 32
Very often 6,549 14 3,950 15 2,468 13 2,549 15 3,113 13
Total 46,121 100 26,365 100 18,817 100 16,767 100 23,843 100
i. Never 1,002 2 587 2 397 2 358 2 501 2
Sometimes 15,015 33 8,492 32 6,221 33 5,310 32 7,969 33
Often 20,683 45 11,569 44 8,740 46 7,443 44 10,860 46
Very often 9,320 20 5,697 22 3,464 18 3,678 22 4,482 19
Total 46,020 100 26,345 100 18,822 100 16,789 100 23,812 100
j. Never 3,764 8 1,992 8 1,703 9 1,448 9 1,854 8
Sometimes 22,567 49 12,683 48 9,484 50 8,047 48 12,038 51
Often 14,425 31 8,394 32 5,738 30 5,250 31 7,443 31
Very often 5,234 11 3,254 12 1,893 10 2,029 12 2,469 10
Total 45,990 100 26,323 100 18,818 100 16,774 100 23,804 100
Discuss ideas from your
readings or classes with faculty
members outside of class
cfacidea
Work with other students on
projects during class
cclassgr
Work with classmates outside
of class to prepare class
assignments
coccgrp
Receive prompt feedback from
faculty on your academic
performance (written or oral)
cfacfeed
Work with faculty members on
activities other than
coursework (committees,
orientation, student life
activities, etc.)
cfacothe
Put together ideas or concepts
from different courses when
completing assignments or
during class discussions
cintidea
Discuss grades or assignments
with an instructor
cfacgrad
a First generation is defined as no parent or guardian having graduated with a 4-year college degree. 16
Variable Scale Response Options Count % Count % Count % Count % Count %
Yes NoMaleAll Students
BCSSE 2008 Frequency Distributions
BCSSE Grand Frequencies and Means - Public
Gender First Generationa
Female
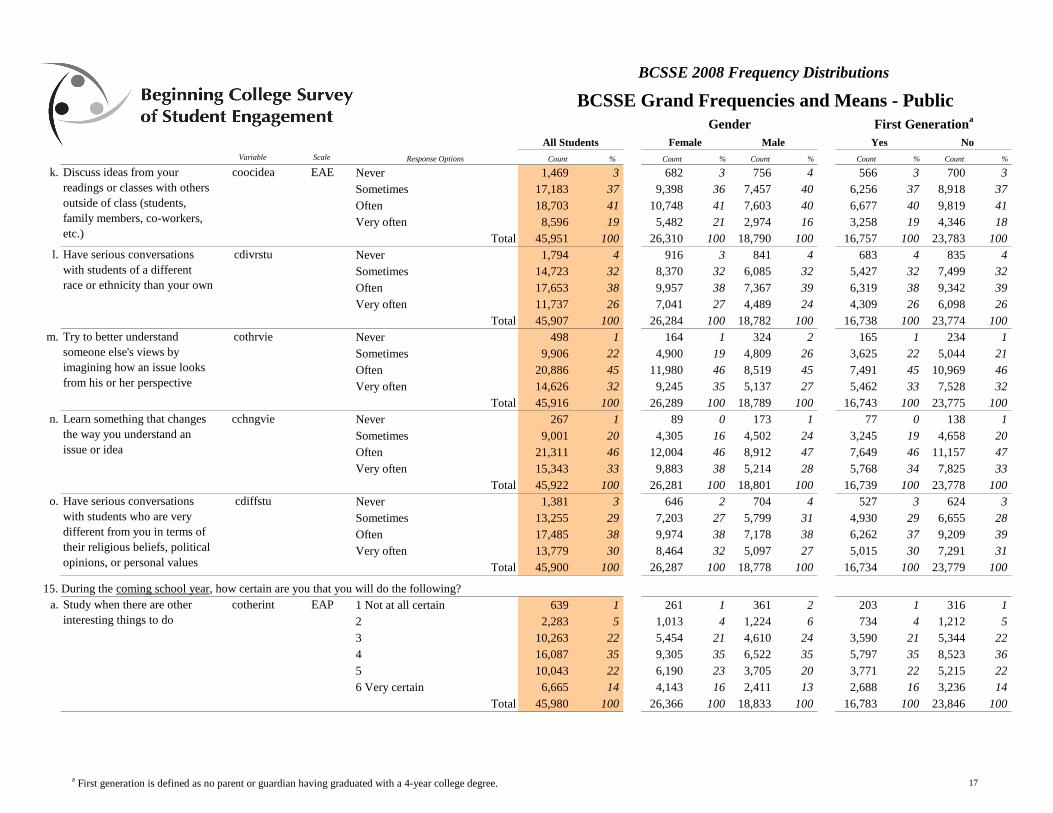
k. EAE Never 1,469 3 682 3 756 4 566 3 700 3
Sometimes 17,183 37 9,398 36 7,457 40 6,256 37 8,918 37
Often 18,703 41 10,748 41 7,603 40 6,677 40 9,819 41
Very often 8,596 19 5,482 21 2,974 16 3,258 19 4,346 18
Total 45,951 100 26,310 100 18,790 100 16,757 100 23,783 100
l. Never 1,794 4 916 3 841 4 683 4 835 4
Sometimes 14,723 32 8,370 32 6,085 32 5,427 32 7,499 32
Often 17,653 38 9,957 38 7,367 39 6,319 38 9,342 39
Very often 11,737 26 7,041 27 4,489 24 4,309 26 6,098 26
Total 45,907 100 26,284 100 18,782 100 16,738 100 23,774 100
m. Never 498 1 164 1 324 2 165 1 234 1
Sometimes 9,906 22 4,900 19 4,809 26 3,625 22 5,044 21
Often 20,886 45 11,980 46 8,519 45 7,491 45 10,969 46
Very often 14,626 32 9,245 35 5,137 27 5,462 33 7,528 32
Total 45,916 100 26,289 100 18,789 100 16,743 100 23,775 100
n. Never 267 1 89 0 173 1 77 0 138 1
Sometimes 9,001 20 4,305 16 4,502 24 3,245 19 4,658 20
Often 21,311 46 12,004 46 8,912 47 7,649 46 11,157 47
Very often 15,343 33 9,883 38 5,214 28 5,768 34 7,825 33
Total 45,922 100 26,281 100 18,801 100 16,739 100 23,778 100
o. Never 1,381 3 646 2 704 4 527 3 624 3
Sometimes 13,255 29 7,203 27 5,799 31 4,930 29 6,655 28
Often 17,485 38 9,974 38 7,178 38 6,262 37 9,209 39
Very often 13,779 30 8,464 32 5,097 27 5,015 30 7,291 31
Total 45,900 100 26,287 100 18,778 100 16,734 100 23,779 100
15. During the coming school year, how certain are you that you will do the following?
a. EAP 1 Not at all certain 639 1 261 1 361 2 203 1 316 1
2 2,283 5 1,013 4 1,224 6 734 4 1,212 5
3 10,263 22 5,454 21 4,610 24 3,590 21 5,344 22
4 16,087 35 9,305 35 6,522 35 5,797 35 8,523 36
5 10,043 22 6,190 23 3,705 20 3,771 22 5,215 22
6 Very certain 6,665 14 4,143 16 2,411 13 2,688 16 3,236 14
Total 45,980 100 26,366 100 18,833 100 16,783 100 23,846 100
Learn something that changes
the way you understand an
issue or idea
cchngvie
Try to better understand
someone else's views by
imagining how an issue looks
from his or her perspective
cothrvie
Have serious conversations
with students of a different
race or ethnicity than your own
cdivrstu
Discuss ideas from your
readings or classes with others
outside of class (students,
family members, co-workers,
etc.)
coocidea
Have serious conversations
with students who are very
different from you in terms of
their religious beliefs, political
opinions, or personal values
cdiffstu
Study when there are other
interesting things to do
cotherint
a First generation is defined as no parent or guardian having graduated with a 4-year college degree. 17
Variable Scale Response Options Count % Count % Count % Count % Count %
Yes NoMaleAll Students
BCSSE 2008 Frequency Distributions
BCSSE Grand Frequencies and Means - Public
Gender First Generationa
Female
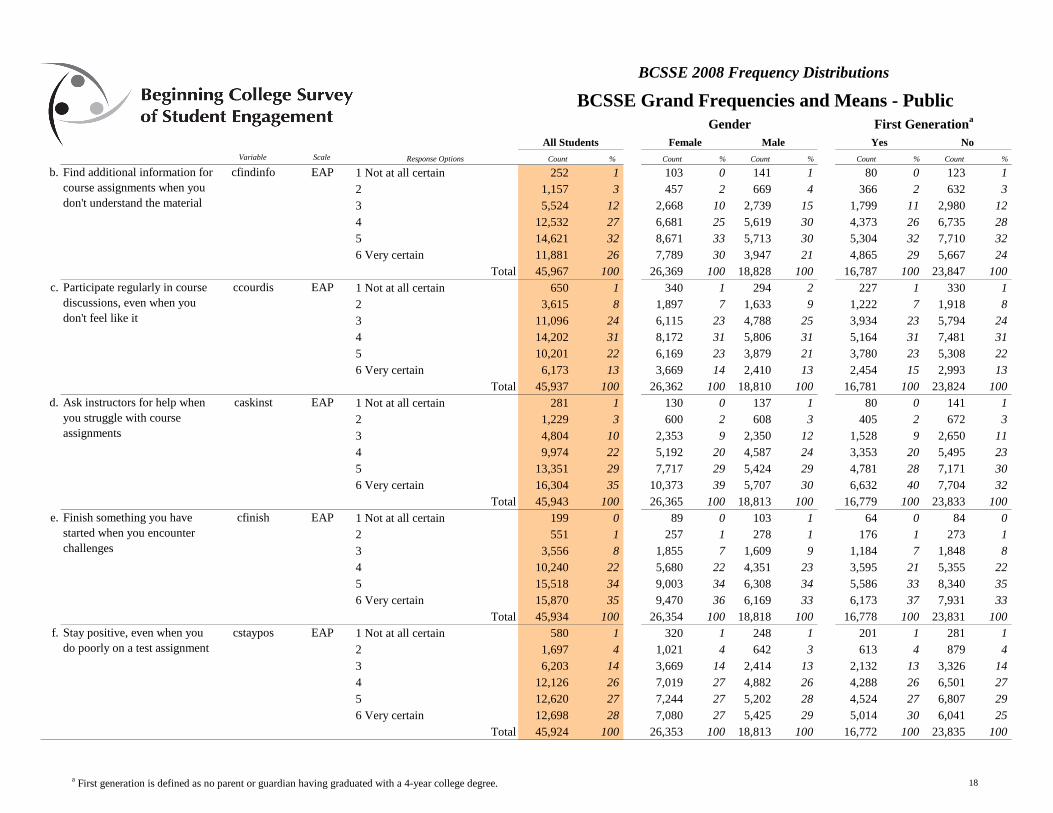
b. EAP 1 Not at all certain 252 1 103 0 141 1 80 0 123 1
2 1,157 3 457 2 669 4 366 2 632 3
3 5,524 12 2,668 10 2,739 15 1,799 11 2,980 12
4 12,532 27 6,681 25 5,619 30 4,373 26 6,735 28
5 14,621 32 8,671 33 5,713 30 5,304 32 7,710 32
6 Very certain 11,881 26 7,789 30 3,947 21 4,865 29 5,667 24
Total 45,967 100 26,369 100 18,828 100 16,787 100 23,847 100
c. EAP 1 Not at all certain 650 1 340 1 294 2 227 1 330 1
2 3,615 8 1,897 7 1,633 9 1,222 7 1,918 8
3 11,096 24 6,115 23 4,788 25 3,934 23 5,794 24
4 14,202 31 8,172 31 5,806 31 5,164 31 7,481 31
5 10,201 22 6,169 23 3,879 21 3,780 23 5,308 22
6 Very certain 6,173 13 3,669 14 2,410 13 2,454 15 2,993 13
Total 45,937 100 26,362 100 18,810 100 16,781 100 23,824 100
d. EAP 1 Not at all certain 281 1 130 0 137 1 80 0 141 1
2 1,229 3 600 2 608 3 405 2 672 3
3 4,804 10 2,353 9 2,350 12 1,528 9 2,650 11
4 9,974 22 5,192 20 4,587 24 3,353 20 5,495 23
5 13,351 29 7,717 29 5,424 29 4,781 28 7,171 30
6 Very certain 16,304 35 10,373 39 5,707 30 6,632 40 7,704 32
Total 45,943 100 26,365 100 18,813 100 16,779 100 23,833 100
e. EAP 1 Not at all certain 199 0 89 0 103 1 64 0 84 0
2 551 1 257 1 278 1 176 1 273 1
3 3,556 8 1,855 7 1,609 9 1,184 7 1,848 8
4 10,240 22 5,680 22 4,351 23 3,595 21 5,355 22
5 15,518 34 9,003 34 6,308 34 5,586 33 8,340 35
6 Very certain 15,870 35 9,470 36 6,169 33 6,173 37 7,931 33
Total 45,934 100 26,354 100 18,818 100 16,778 100 23,831 100
f. EAP 1 Not at all certain 580 1 320 1 248 1 201 1 281 1
2 1,697 4 1,021 4 642 3 613 4 879 4
3 6,203 14 3,669 14 2,414 13 2,132 13 3,326 14
4 12,126 26 7,019 27 4,882 26 4,288 26 6,501 27
5 12,620 27 7,244 27 5,202 28 4,524 27 6,807 29
6 Very certain 12,698 28 7,080 27 5,425 29 5,014 30 6,041 25
Total 45,924 100 26,353 100 18,813 100 16,772 100 23,835 100
Finish something you have
started when you encounter
challenges
cfinish
Find additional information for
course assignments when you
don't understand the material
cfindinfo
Participate regularly in course
discussions, even when you
don't feel like it
ccourdis
Ask instructors for help when
you struggle with course
assignments
caskinst
Stay positive, even when you
do poorly on a test assignment
cstaypos
a First generation is defined as no parent or guardian having graduated with a 4-year college degree. 18

Variable Scale Response Options Count % Count % Count % Count % Count %
Yes NoMaleAll Students
BCSSE 2008 Frequency Distributions
BCSSE Grand Frequencies and Means - Public
Gender First Generationa
Female
16. During the coming school year, how difficult do you expect the following to be?
a. EAD 1 Not at all difficult 983 2 398 2 563 3 361 2 471 2
2 3,190 7 1,530 6 1,595 8 1,131 7 1,667 7
3 10,864 24 5,938 23 4,753 25 3,903 23 5,606 24
4 18,684 41 10,808 41 7,605 40 6,737 40 9,911 42
5 9,532 21 5,942 23 3,453 18 3,612 22 4,923 21
6 Very difficult 2,650 6 1,747 7 856 5 1,050 6 1,249 5
Total 45,903 100 26,363 100 18,825 100 16,794 100 23,827 100
b. EAD 1 Not at all difficult 1,318 3 727 3 565 3 506 3 644 3
2 3,735 8 2,219 8 1,450 8 1,366 8 1,898 8
3 7,911 17 4,668 18 3,108 17 2,901 17 3,976 17
4 11,974 26 6,916 26 4,856 26 4,301 26 6,315 27
5 12,042 26 6,767 26 5,113 27 4,341 26 6,445 27
6 Very difficult 8,902 19 5,056 19 3,725 20 3,379 20 4,538 19
Total 45,882 100 26,353 100 18,817 100 16,794 100 23,816 100
c. 1 Not at all difficult 6,212 14 3,248 12 2,877 15 1,654 10 4,000 17
2 6,549 14 3,519 13 2,924 16 1,916 11 4,008 17
3 7,438 16 4,022 15 3,288 17 2,449 15 4,119 17
4 7,912 17 4,510 17 3,273 17 2,899 17 4,061 17
5 7,772 17 4,654 18 2,984 16 3,090 18 3,723 16
6 Very difficult 9,939 22 6,353 24 3,457 18 4,751 28 3,887 16
Total 45,822 100 26,306 100 18,803 100 16,759 100 23,798 100
d. EAD 1 Not at all difficult 5,625 12 3,378 13 2,171 12 2,207 13 2,754 12
2 11,739 26 6,795 26 4,763 25 4,126 25 6,379 27
3 14,275 31 8,006 30 6,067 32 5,103 30 7,590 32
4 9,730 21 5,503 21 4,051 22 3,571 21 4,982 21
5 3,352 7 1,971 7 1,331 7 1,286 8 1,636 7
6 Very difficult 1,115 2 661 3 432 2 471 3 453 2
Total 45,836 100 26,314 100 18,815 100 16,764 100 23,794 100
e. 1 Not at all difficult 13,593 30 7,488 28 5,894 31 4,973 30 7,026 29
2 12,719 28 7,342 28 5,179 28 4,562 27 6,873 29
3 9,554 21 5,638 21 3,793 20 3,545 21 4,873 20
4 5,735 13 3,365 13 2,267 12 2,066 12 2,988 13
5 2,738 6 1,630 6 1,063 6 1,034 6 1,367 6
6 Very difficult 1,541 3 894 3 617 3 612 4 692 3
Total 45,880 100 26,357 100 18,813 100 16,792 100 23,819 100
Making new friends cmakefr
Learning course material clearnma
Managing your time cmantime
Paying college expenses cpaycoll
Getting help with school work cgethelp
a First generation is defined as no parent or guardian having graduated with a 4-year college degree. 19
Variable Scale Response Options Count % Count % Count % Count % Count %
Yes NoMaleAll Students
BCSSE 2008 Frequency Distributions
BCSSE Grand Frequencies and Means - Public
Gender First Generationa
Female
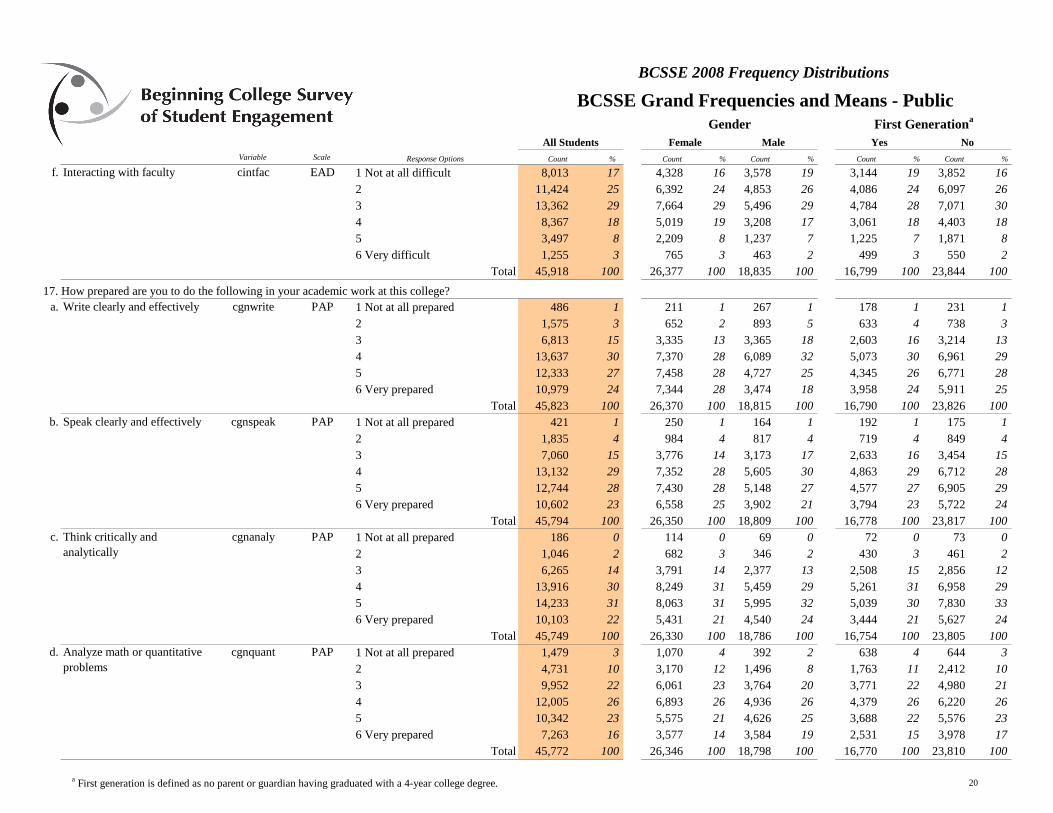
f. EAD 1 Not at all difficult 8,013 17 4,328 16 3,578 19 3,144 19 3,852 16
2 11,424 25 6,392 24 4,853 26 4,086 24 6,097 26
3 13,362 29 7,664 29 5,496 29 4,784 28 7,071 30
4 8,367 18 5,019 19 3,208 17 3,061 18 4,403 18
5 3,497 8 2,209 8 1,237 7 1,225 7 1,871 8
6 Very difficult 1,255 3 765 3 463 2 499 3 550 2
Total 45,918 100 26,377 100 18,835 100 16,799 100 23,844 100
17. How prepared are you to do the following in your academic work at this college?
a. PAP 1 Not at all prepared 486 1 211 1 267 1 178 1 231 1
2 1,575 3 652 2 893 5 633 4 738 3
3 6,813 15 3,335 13 3,365 18 2,603 16 3,214 13
4 13,637 30 7,370 28 6,089 32 5,073 30 6,961 29
5 12,333 27 7,458 28 4,727 25 4,345 26 6,771 28
6 Very prepared 10,979 24 7,344 28 3,474 18 3,958 24 5,911 25
Total 45,823 100 26,370 100 18,815 100 16,790 100 23,826 100
b. PAP 1 Not at all prepared 421 1 250 1 164 1 192 1 175 1
2 1,835 4 984 4 817 4 719 4 849 4
3 7,060 15 3,776 14 3,173 17 2,633 16 3,454 15
4 13,132 29 7,352 28 5,605 30 4,863 29 6,712 28
5 12,744 28 7,430 28 5,148 27 4,577 27 6,905 29
6 Very prepared 10,602 23 6,558 25 3,902 21 3,794 23 5,722 24
Total 45,794 100 26,350 100 18,809 100 16,778 100 23,817 100
c. PAP 1 Not at all prepared 186 0 114 0 69 0 72 0 73 0
2 1,046 2 682 3 346 2 430 3 461 2
3 6,265 14 3,791 14 2,377 13 2,508 15 2,856 12
4 13,916 30 8,249 31 5,459 29 5,261 31 6,958 29
5 14,233 31 8,063 31 5,995 32 5,039 30 7,830 33
6 Very prepared 10,103 22 5,431 21 4,540 24 3,444 21 5,627 24
Total 45,749 100 26,330 100 18,786 100 16,754 100 23,805 100
d. PAP 1 Not at all prepared 1,479 3 1,070 4 392 2 638 4 644 3
2 4,731 10 3,170 12 1,496 8 1,763 11 2,412 10
3 9,952 22 6,061 23 3,764 20 3,771 22 4,980 21
4 12,005 26 6,893 26 4,936 26 4,379 26 6,220 26
5 10,342 23 5,575 21 4,626 25 3,688 22 5,576 23
6 Very prepared 7,263 16 3,577 14 3,584 19 2,531 15 3,978 17
Total 45,772 100 26,346 100 18,798 100 16,770 100 23,810 100
Interacting with faculty cintfac
Write clearly and effectively cgnwrite
Analyze math or quantitative
problems
cgnquant
Think critically and
analytically
cgnanaly
Speak clearly and effectively cgnspeak
a First generation is defined as no parent or guardian having graduated with a 4-year college degree. 20
Variable Scale Response Options Count % Count % Count % Count % Count %
Yes NoMaleAll Students
BCSSE 2008 Frequency Distributions
BCSSE Grand Frequencies and Means - Public
Gender First Generationa
Female
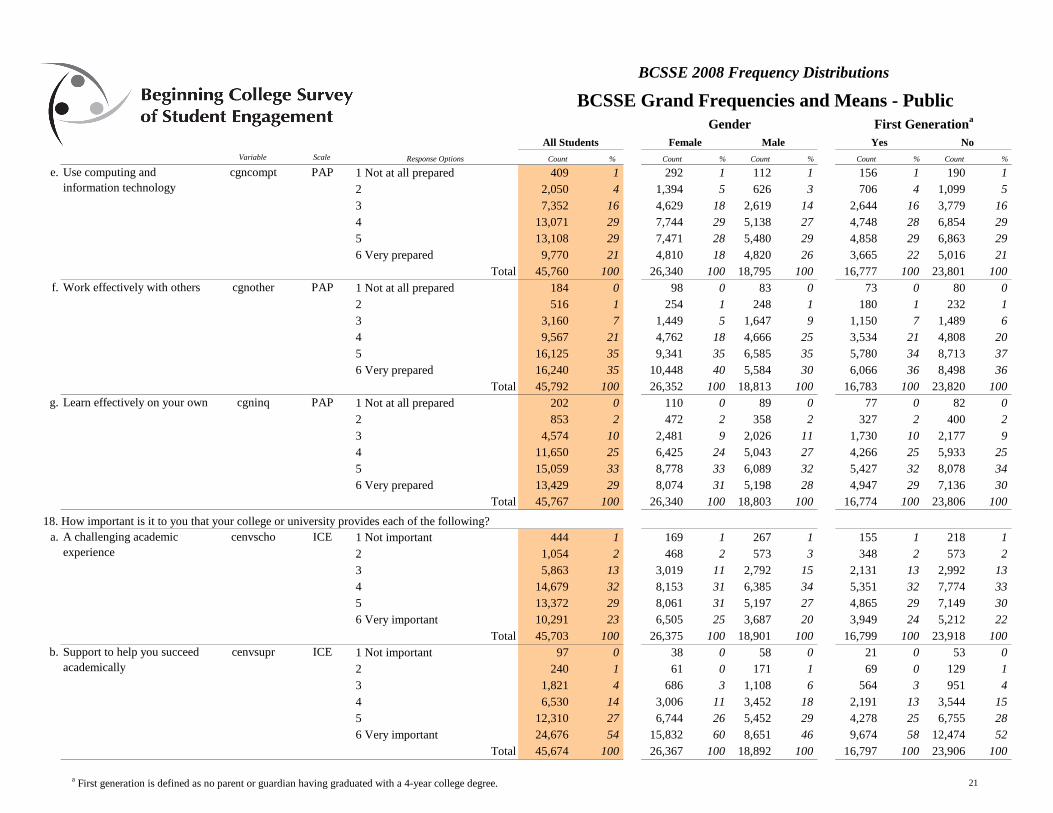
e. PAP 1 Not at all prepared 409 1 292 1 112 1 156 1 190 1
2 2,050 4 1,394 5 626 3 706 4 1,099 5
3 7,352 16 4,629 18 2,619 14 2,644 16 3,779 16
4 13,071 29 7,744 29 5,138 27 4,748 28 6,854 29
5 13,108 29 7,471 28 5,480 29 4,858 29 6,863 29
6 Very prepared 9,770 21 4,810 18 4,820 26 3,665 22 5,016 21
Total 45,760 100 26,340 100 18,795 100 16,777 100 23,801 100
f. PAP 1 Not at all prepared 184 0 98 0 83 0 73 0 80 0
2 516 1 254 1 248 1 180 1 232 1
3 3,160 7 1,449 5 1,647 9 1,150 7 1,489 6
4 9,567 21 4,762 18 4,666 25 3,534 21 4,808 20
5 16,125 35 9,341 35 6,585 35 5,780 34 8,713 37
6 Very prepared 16,240 35 10,448 40 5,584 30 6,066 36 8,498 36
Total 45,792 100 26,352 100 18,813 100 16,783 100 23,820 100
g. PAP 1 Not at all prepared 202 0 110 0 89 0 77 0 82 0
2 853 2 472 2 358 2 327 2 400 2
3 4,574 10 2,481 9 2,026 11 1,730 10 2,177 9
4 11,650 25 6,425 24 5,043 27 4,266 25 5,933 25
5 15,059 33 8,778 33 6,089 32 5,427 32 8,078 34
6 Very prepared 13,429 29 8,074 31 5,198 28 4,947 29 7,136 30
Total 45,767 100 26,340 100 18,803 100 16,774 100 23,806 100
18. How important is it to you that your college or university provides each of the following?
a. ICE 1 Not important 444 1 169 1 267 1 155 1 218 1
2 1,054 2 468 2 573 3 348 2 573 2
3 5,863 13 3,019 11 2,792 15 2,131 13 2,992 13
4 14,679 32 8,153 31 6,385 34 5,351 32 7,774 33
5 13,372 29 8,061 31 5,197 27 4,865 29 7,149 30
6 Very important 10,291 23 6,505 25 3,687 20 3,949 24 5,212 22
Total 45,703 100 26,375 100 18,901 100 16,799 100 23,918 100
b. ICE 1 Not important 97 0 38 0 58 0 21 0 53 0
2 240 1 61 0 171 1 69 0 129 1
3 1,821 4 686 3 1,108 6 564 3 951 4
4 6,530 14 3,006 11 3,452 18 2,191 13 3,544 15
5 12,310 27 6,744 26 5,452 29 4,278 25 6,755 28
6 Very important 24,676 54 15,832 60 8,651 46 9,674 58 12,474 52
Total 45,674 100 26,367 100 18,892 100 16,797 100 23,906 100
Use computing and
information technology
cgncompt
Work effectively with others cgnother
Learn effectively on your own cgninq
A challenging academic
experience
cenvscho
Support to help you succeed
academically
cenvsupr
a First generation is defined as no parent or guardian having graduated with a 4-year college degree. 21

Variable Scale Response Options Count % Count % Count % Count % Count %
Yes NoMaleAll Students
BCSSE 2008 Frequency Distributions
BCSSE Grand Frequencies and Means - Public
Gender First Generationa
Female
c. ICE 1 Not important 728 2 249 1 474 3 265 2 386 2
2 1,696 4 678 3 999 5 575 3 964 4
3 5,728 13 2,719 10 2,950 16 2,017 12 3,051 13
4 11,002 24 5,940 23 4,958 26 4,018 24 5,771 24
5 12,245 27 7,388 28 4,745 25 4,535 27 6,415 27
6 Very important 14,271 31 9,393 36 4,762 25 5,376 32 7,326 31
Total 45,670 100 26,367 100 18,888 100 16,786 100 23,913 100
d. ICE 1 Not important 1,420 3 599 2 812 4 459 3 826 3
2 3,463 8 1,671 6 1,766 9 1,183 7 1,966 8
3 8,448 19 4,455 17 3,907 21 2,925 17 4,603 19
4 12,500 27 6,976 26 5,397 29 4,518 27 6,628 28
5 10,323 23 6,365 24 3,868 20 3,851 23 5,326 22
6 Very important 9,486 21 6,289 24 3,122 17 3,849 23 4,545 19
Total 45,640 100 26,355 100 18,872 100 16,785 100 23,894 100
e. ICE 1 Not important 1,382 3 596 2 772 4 498 3 737 3
2 2,898 6 1,370 5 1,508 8 1,063 6 1,541 6
3 6,949 15 3,731 14 3,153 17 2,566 15 3,618 15
4 11,636 26 6,466 25 5,059 27 4,227 25 6,151 26
5 11,700 26 7,008 27 4,587 24 4,171 25 6,334 27
6 Very important 11,054 24 7,160 27 3,795 20 4,245 25 5,513 23
Total 45,619 100 26,331 100 18,874 100 16,770 100 23,894 100
f. ICE 1 Not important 678 1 297 1 372 2 278 2 306 1
2 1,466 3 644 2 804 4 563 3 725 3
3 4,518 10 2,243 9 2,235 12 1,699 10 2,213 9
4 9,997 22 5,266 20 4,637 25 3,689 22 5,207 22
5 13,208 29 7,796 30 5,291 28 4,818 29 7,056 30
6 Very important 15,761 35 10,104 38 5,531 29 5,742 34 8,379 35
Total 45,628 100 26,350 100 18,870 100 16,789 100 23,886 100
19. About how much of your college expenses (tuition, fees, books, room & board) this year will be provided by each of the following sources?
a. None 12,541 28 6,783 26 5,655 30 3,689 22 7,565 32
Less than half 14,905 33 8,900 34 5,884 31 5,468 33 8,124 34
Half or more 7,535 17 4,495 17 2,979 16 3,057 18 3,635 15
All or nearly all 7,564 17 4,504 17 3,010 16 3,440 21 3,253 14
Do not know 2,842 6 1,578 6 1,242 7 1,087 6 1,203 5
Total 45,387 100 26,260 100 18,770 100 16,741 100 23,780 100
Assistance coping with your
non-academic responsibilities
(work, family, etc.)
cenvnaca
Opportunities to interact with
students from different
economic, social, and racial or
ethnic backgrounds
cenvdivr
Support to help you thrive
socially
cenvsoca
Opportunities to attend
campus events and activities
cenveven
Scholarships and grants cschgr
a First generation is defined as no parent or guardian having graduated with a 4-year college degree. 22
Variable Scale Response Options Count % Count % Count % Count % Count %
Yes NoMaleAll Students
BCSSE 2008 Frequency Distributions
BCSSE Grand Frequencies and Means - Public
Gender First Generationa
Female
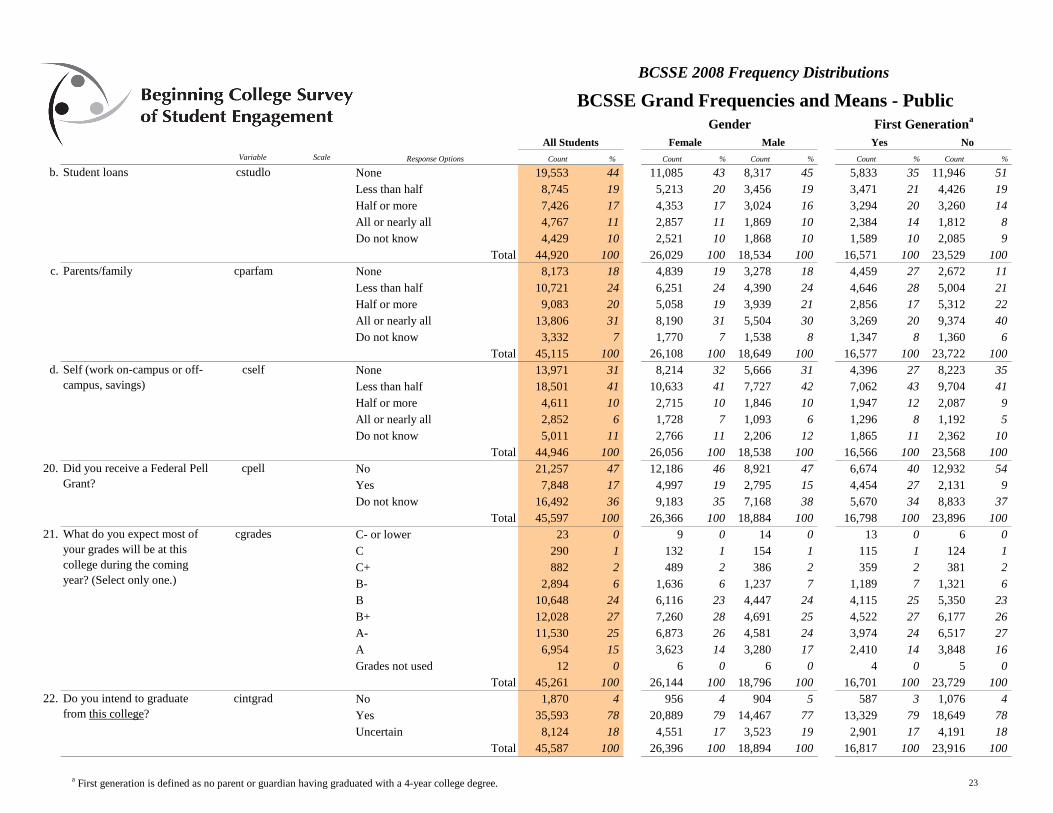
b. None 19,553 44 11,085 43 8,317 45 5,833 35 11,946 51
Less than half 8,745 19 5,213 20 3,456 19 3,471 21 4,426 19
Half or more 7,426 17 4,353 17 3,024 16 3,294 20 3,260 14
All or nearly all 4,767 11 2,857 11 1,869 10 2,384 14 1,812 8
Do not know 4,429 10 2,521 10 1,868 10 1,589 10 2,085 9
Total 44,920 100 26,029 100 18,534 100 16,571 100 23,529 100
c. None 8,173 18 4,839 19 3,278 18 4,459 27 2,672 11
Less than half 10,721 24 6,251 24 4,390 24 4,646 28 5,004 21
Half or more 9,083 20 5,058 19 3,939 21 2,856 17 5,312 22
All or nearly all 13,806 31 8,190 31 5,504 30 3,269 20 9,374 40
Do not know 3,332 7 1,770 7 1,538 8 1,347 8 1,360 6
Total 45,115 100 26,108 100 18,649 100 16,577 100 23,722 100
d. None 13,971 31 8,214 32 5,666 31 4,396 27 8,223 35
Less than half 18,501 41 10,633 41 7,727 42 7,062 43 9,704 41
Half or more 4,611 10 2,715 10 1,846 10 1,947 12 2,087 9
All or nearly all 2,852 6 1,728 7 1,093 6 1,296 8 1,192 5
Do not know 5,011 11 2,766 11 2,206 12 1,865 11 2,362 10
Total 44,946 100 26,056 100 18,538 100 16,566 100 23,568 100
20. cpell No 21,257 47 12,186 46 8,921 47 6,674 40 12,932 54
Yes 7,848 17 4,997 19 2,795 15 4,454 27 2,131 9
Do not know 16,492 36 9,183 35 7,168 38 5,670 34 8,833 37
Total 45,597 100 26,366 100 18,884 100 16,798 100 23,896 100
21. C- or lower 23 0 9 0 14 0 13 0 6 0
C 290 1 132 1 154 1 115 1 124 1
C+ 882 2 489 2 386 2 359 2 381 2
B- 2,894 6 1,636 6 1,237 7 1,189 7 1,321 6
B 10,648 24 6,116 23 4,447 24 4,115 25 5,350 23
B+ 12,028 27 7,260 28 4,691 25 4,522 27 6,177 26
A- 11,530 25 6,873 26 4,581 24 3,974 24 6,517 27
A 6,954 15 3,623 14 3,280 17 2,410 14 3,848 16
Grades not used 12 0 6 0 6 0 4 0 5 0
Total 45,261 100 26,144 100 18,796 100 16,701 100 23,729 100
22. cintgrad No 1,870 4 956 4 904 5 587 3 1,076 4
Yes 35,593 78 20,889 79 14,467 77 13,329 79 18,649 78
Uncertain 8,124 18 4,551 17 3,523 19 2,901 17 4,191 18
Total 45,587 100 26,396 100 18,894 100 16,817 100 23,916 100
Self (work on-campus or off-
campus, savings)
cself
Student loans cstudlo
Parents/family cparfam
Did you receive a Federal Pell
Grant?
What do you expect most of
your grades will be at this
college during the coming
year? (Select only one.)
cgrades
Do you intend to graduate
from this college?
a First generation is defined as no parent or guardian having graduated with a 4-year college degree. 23

Variable Scale Response Options Count % Count % Count % Count % Count %
Yes NoMaleAll Students
BCSSE 2008 Frequency Distributions
BCSSE Grand Frequencies and Means - Public
Gender First Generationa
Female
23 Associate's degree 855 2 477 2 369 2 380 2 328 1
Bachelor's degree 14,180 31 8,100 31 5,997 32 5,767 34 6,897 29
Master's degree 15,589 34 9,130 35 6,354 34 5,453 33 8,772 37
Doctoral degree 7,931 17 4,724 18 3,173 17 2,790 17 4,351 18
Uncertain 6,875 15 3,862 15 2,957 16 2,385 14 3,481 15
Total 45,430 100 26,293 100 18,850 100 16,775 100 23,829 100
24. cmajor No 11,107 25 5,699 22 5,336 29 3,759 23 6,081 26
Yes 33,826 75 20,287 78 13,350 71 12,778 77 17,575 74
Total 44,933 100 25,986 100 18,686 100 16,537 100 23,656 100
xmajrcol Arts and Humanities 3,306 10 2,162 11 1,120 9 1,083 9 1,921 12
Biological Sciences 2,738 9 1,755 9 972 8 1,006 8 1,465 9
Business 5,508 17 2,724 14 2,761 22 2,036 17 2,856 17
Education 3,594 11 2,858 15 711 6 1,485 12 1,763 11
Engineering 2,220 7 371 2 1,841 15 706 6 1,323 8
Physical Science 864 3 444 2 414 3 319 3 466 3
Professional 6,245 19 4,953 26 1,259 10 2,654 22 2,914 18
Social Science 2,889 9 2,019 10 854 7 1,139 9 1,452 9
Other 4,708 15 2,031 10 2,644 21 1,787 15 2,377 14
Undecided 49 0 28 0 21 0 19 0 25 0
Total 32,121 100 19,345 100 12,597 100 12,234 100 16,562 100
25. cenrlmen No 895 2 465 2 427 2 369 2 380 2
Yes 44,606 98 25,937 98 18,481 98 16,451 98 23,520 98
Total 45,501 100 26,402 100 18,908 100 16,820 100 23,900 100
26. None 14,218 31 8,696 33 5,468 29 5,126 30 7,579 32
1 8,107 18 5,017 19 3,064 16 3,098 18 4,165 17
2 6,731 15 3,966 15 2,735 14 2,605 15 3,418 14
3 4,372 10 2,488 9 1,866 10 1,671 10 2,264 9
4 or more 12,136 27 6,289 24 5,793 31 4,351 26 6,516 27
Total 45,564 100 26,456 100 18,926 100 16,851 100 23,942 100
27. csex Male 19,023 42 0 0 19,023 100 6,257 37 10,648 44
Female 26,545 58 26,545 100 0 0 10,598 63 13,318 56
Total 45,568 100 26,545 100 19,023 100 16,855 100 23,966 100
28. cinterna No 43,833 97 25,491 97 18,211 97 16,279 97 23,136 97
Yes 1,481 3 829 3 648 3 487 3 724 3
Total 45,314 100 26,320 100 18,859 100 16,766 100 23,860 100
How many of your close
friends will attend this college
during the coming year?
cfriends
Your sex:
Are you an international
student or foreign national?
What is the highest academic
degree you intend to obtain at
this or any college?
chighdeg
Do you know what your major
will be?
Recoded variable xmajcod1
into one of ten major
categories listed at right
Are you, or will you be, a full-
time student this fall term?
a First generation is defined as no parent or guardian having graduated with a 4-year college degree. 24

Variable Scale Response Options Count % Count % Count % Count % Count %
Yes NoMaleAll Students
BCSSE 2008 Frequency Distributions
BCSSE Grand Frequencies and Means - Public
Gender First Generationa
Female
29. crace American Indian or other Native
American339 1 217 1 120 1 138 1 144 1
Asian, Asian American, or
Pacific Islander2,149 5 1,092 4 1,051 6 719 4 1,082 5
Black or African American 5,135 11 3,285 12 1,830 10 2,282 14 1,683 7
White (non-Hispanic) 32,614 72 18,726 71 13,781 73 11,357 67 18,826 78
Mexican or Mexican American 978 2 587 2 386 2 627 4 233 1
Puerto Rican 301 1 192 1 108 1 144 1 116 0
Other Hispanic or Latino 1,154 3 720 3 427 2 556 3 439 2
Multiracial 1,211 3 752 3 457 2 501 3 536 2
Other 569 1 315 1 253 1 207 1 275 1
I prefer not to respond 1,132 2 579 2 546 3 332 2 651 3
Total 45,582 100 26,465 100 18,959 100 16,863 100 23,985 100
30. Please indicate whether your parents completed a 4-year college degree.
a. Did not complete 4-year degree 23,519 52 14470 55 8,968 48 16908 100 5,657 24
Completed 4-year degree 19,376 43 10624 40 8,684 46 0 0 18,384 76
Do not know 2,520 6 1280 5 1,224 6 0 0 0 0
Total 45,415 100 26374 100 18,876 100 16908 100 24,041 100
b. Did not complete 4-year degree 22,514 50 13871 53 8,575 46 16908 100 5,258 22
Completed 4-year degree 19,392 43 10535 40 8,789 47 0 0 18,783 78
Do not know 3,314 7 1844 7 1,447 8 0 0 0 0
Total 45,220 100 26250 100 18,811 100 16908 100 24,041 100
31. cdistanc 20 miles or less 12,167 27 6,795 26 5,322 28 4,891 29 5,740 24
21-50 miles 9,008 20 5,352 20 3,619 19 3,885 23 4,129 17
51-100 miles 7,073 16 4,219 16 2,834 15 2,641 16 3,727 16
101-200 miles 8,153 18 4,711 18 3,406 18 2,773 17 4,673 20
201-400 miles 5,734 13 3,323 13 2,392 13 1,758 10 3,502 15
more than 400 miles 3,222 7 1,887 7 1,324 7 851 5 2,108 9
Total 45,357 100 26,287 100 18,897 100 16,799 100 23,879 100
How far is your home from
this college?
What is your racial or ethnic
identification?
(Select only one.)
Father (or guardian) cfathred
Mother (or guardian) cmothred
a First generation is defined as no parent or guardian having graduated with a 4-year college degree. 25
BCSSE Grand Frequencies and
Means - Public
BCSSE 2008 Mean Scale Scores
and Selected Student Comparisons
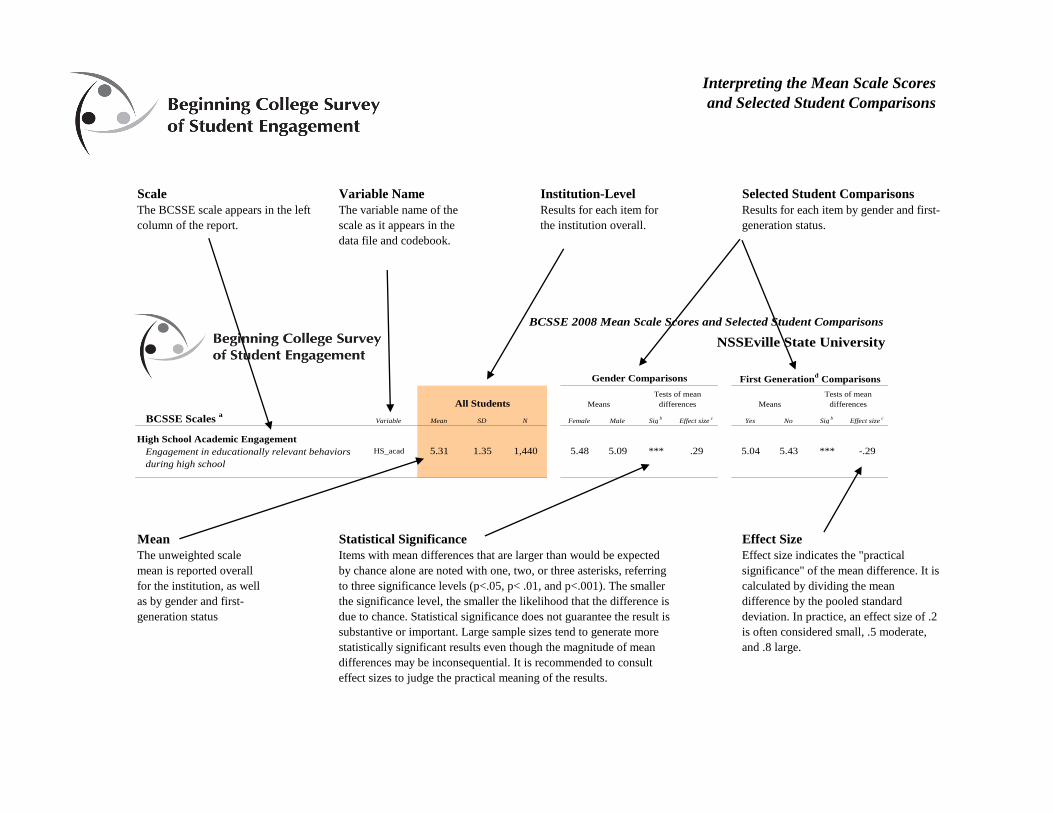
Scale Variable Name Institution-Level
Mean Statistical Significance Effect Size
Interpreting the Mean Scale Scores
and Selected Student Comparisons
Effect size indicates the "practical
significance" of the mean difference. It is
calculated by dividing the mean
difference by the pooled standard
deviation. In practice, an effect size of .2
is often considered small, .5 moderate,
and .8 large.
The unweighted scale
mean is reported overall
for the institution, as well
as by gender and first-
generation status
The BCSSE scale appears in the left
column of the report.
Results for each item for
the institution overall.
Items with mean differences that are larger than would be expected
by chance alone are noted with one, two, or three asterisks, referring
to three significance levels (p<.05, p< .01, and p<.001). The smaller
the significance level, the smaller the likelihood that the difference is
due to chance. Statistical significance does not guarantee the result is
substantive or important. Large sample sizes tend to generate more
statistically significant results even though the magnitude of mean
differences may be inconsequential. It is recommended to consult
effect sizes to judge the practical meaning of the results.
Selected Student Comparisons
Results for each item by gender and first-
generation status.
The variable name of the
scale as it appears in the
data file and codebook.
BCSSE Scales a
Variable Mean SD N Female Male Sigb
Effect sizec
Yes No Sigb
Effect sizec
High School Academic Engagement
Engagement in educationally relevant behaviors
during high school
1.355.31HS_acad 5.43
Means
5.48 5.09 *** 5.04.29 ***1,440 -.29
BCSSE 2008 Mean Scale Scores and Selected Student Comparisons
NSSEville State University
Tests of mean
differences
Tests of mean
differencesAll Students
Gender Comparisons First Generationd Comparisons
Means
BCSSE Scales a
Variable Mean SD N Female Male Sigb
Effect sizec
FG Non-FG Sigb
Effect sizec
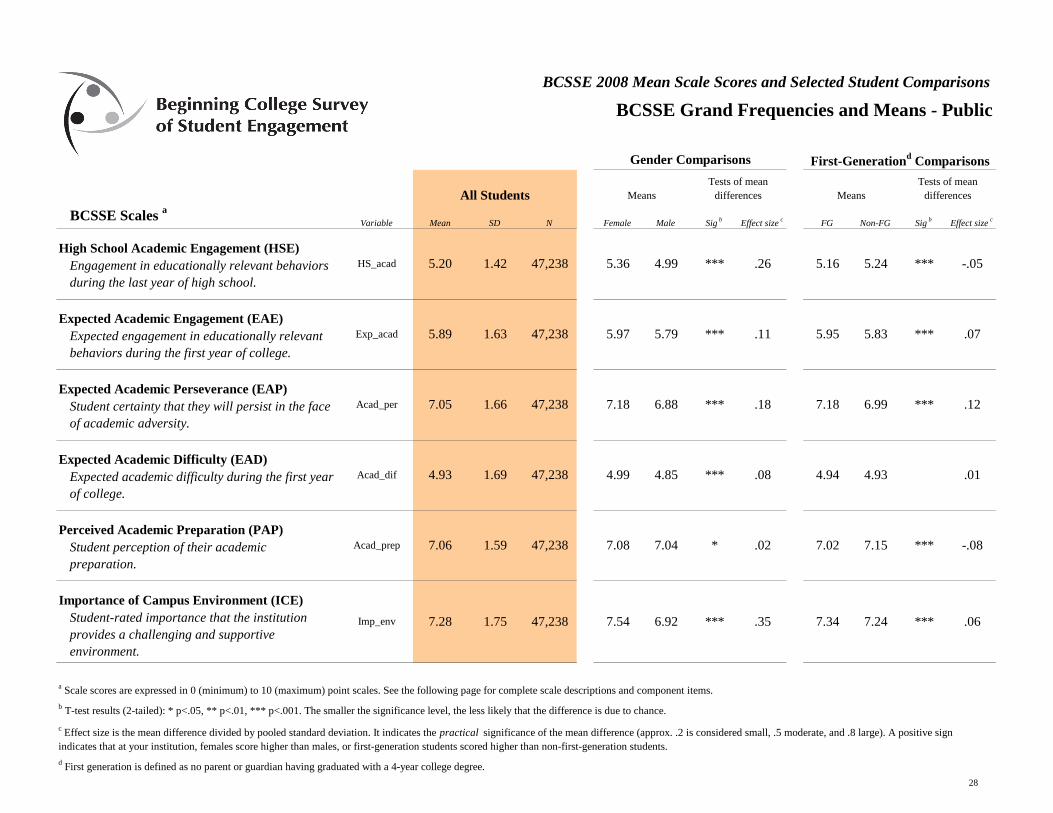
High School Academic Engagement (HSE)
Engagement in educationally relevant behaviors
during the last year of high school.
Expected Academic Engagement (EAE)
Expected engagement in educationally relevant
behaviors during the first year of college.
Expected Academic Perseverance (EAP)
Student certainty that they will persist in the face
of academic adversity.
Expected Academic Difficulty (EAD)
Expected academic difficulty during the first year
of college.
Perceived Academic Preparation (PAP)
Student perception of their academic
preparation.
Importance of Campus Environment (ICE)
Student-rated importance that the institution
provides a challenging and supportive
environment.
.01
MeansMeansAll Students
***
*** 6.99 ***
5.95
Tests of mean
differences
5.83
.12
Tests of mean
differences
5.24 -.05***5.20 ***.26 5.16
-.08
7.18
47,238
1.66
4.93
.07
7.08
4.85
.186.88
BCSSE 2008 Mean Scale Scores and Selected Student Comparisons
BCSSE Grand Frequencies and Means - Public
Gender Comparisons First-Generationd Comparisons
4.94
47,238
5.97
.08***
4.99
4.99
7.18
.11
5.36
a Scale scores are expressed in 0 (minimum) to 10 (maximum) point scales. See the following page for complete scale descriptions and component items.
7.02Acad_prep
47,238
1.694.93
7.05
1.75
7.06 1.59
47,238
d First generation is defined as no parent or guardian having graduated with a 4-year college degree.
Imp_env 7.54 .35 7.34
b T-test results (2-tailed): * p<.05, ** p<.01, *** p<.001. The smaller the significance level, the less likely that the difference is due to chance.
7.24 ***7.28
HS_acad
7.15 ***
Acad_dif
.027.04 *47,238
47,2381.42
c Effect size is the mean difference divided by pooled standard deviation. It indicates the practical significance of the mean difference (approx. .2 is considered small, .5 moderate, and .8 large). A positive sign
indicates that at your institution, females score higher than males, or first-generation students scored higher than non-first-generation students.
5.89 5.79 ***1.63
6.92
Exp_acad
Acad_per
.06***
28
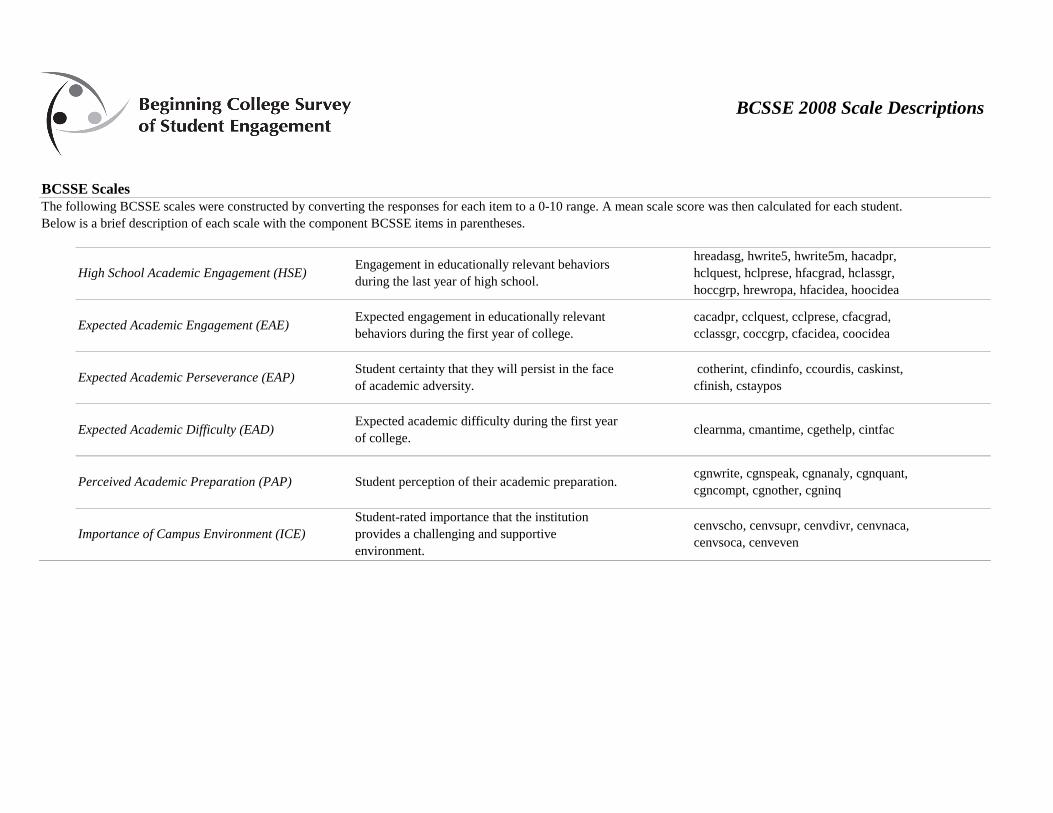
BCSSE Scales
cenvscho, cenvsupr, cenvdivr, cenvnaca,
cenvsoca, cenvevenImportance of Campus Environment (ICE)
cacadpr, cclquest, cclprese, cfacgrad,
cclassgr, coccgrp, cfacidea, coocidea
hreadasg, hwrite5, hwrite5m, hacadpr,
hclquest, hclprese, hfacgrad, hclassgr,
hoccgrp, hrewropa, hfacidea, hoocidea
cgnwrite, cgnspeak, cgnanaly, cgnquant,
cgncompt, cgnother, cgninq
Expected engagement in educationally relevant
behaviors during the first year of college.
Student certainty that they will persist in the face
of academic adversity.
Expected academic difficulty during the first year
of college.
Perceived Academic Preparation (PAP) Student perception of their academic preparation.
Student-rated importance that the institution
provides a challenging and supportive
environment.
Expected Academic Difficulty (EAD)
BCSSE 2008 Scale Descriptions
cotherint, cfindinfo, ccourdis, caskinst,
cfinish, cstaypos
clearnma, cmantime, cgethelp, cintfac
The following BCSSE scales were constructed by converting the responses for each item to a 0-10 range. A mean scale score was then calculated for each student.
Below is a brief description of each scale with the component BCSSE items in parentheses.
Expected Academic Perseverance (EAP)
High School Academic Engagement (HSE)
Expected Academic Engagement (EAE)
Engagement in educationally relevant behaviors
during the last year of high school.


![[XLS] · Web view2174 25 2175 25 2176 25 2177 25 2178 25 2179 25 2180 25 2181 25 2182 25 2183 25 2184 25 2185 25 2186 25 2187 25 2188 25 2189 25 2190 25 2191 25 2192 25 2193 25 2194](https://static.fdocuments.in/doc/165x107/5a9f94857f8b9a76178cfd21/xls-view2174-25-2175-25-2176-25-2177-25-2178-25-2179-25-2180-25-2181-25-2182-25.jpg)


