BCL::MP-Fold: Folding Membrane Proteins through Assembly
11
Structure Ways & Means BCL::MP-Fold: Folding Membrane Proteins through Assembly of Transmembrane Helices Brian E. Weiner, 1 Nils Woetzel, 1 Mert Karakas x, 1 Nathan Alexander, 1 and Jens Meiler 1, * 1 Center for Structural Biology, Department of Chemistry, Vanderbilt University, Nashville, TN 37232, USA *Correspondence: [email protected] http://dx.doi.org/10.1016/j.str.2013.04.022 SUMMARY Membrane protein structure determination remains a challenging endeavor. Computational methods that predict membrane protein structure from sequence can potentially aid structure determination for such difficult target proteins. The de novo protein structure prediction method BCL::Fold rapidly assembles sec- ondary structure elements into three-dimensional models. Here, we describe modifications to the algo- rithm, named BCL::MP-Fold, in order to simulate membrane protein folding. Models are built into a static membrane object and are evaluated using a knowledge-based energy potential, which has been modified to account for the membrane environment. Additionally, a symmetry folding mode allows for the prediction of obligate homomultimers, a common property among membrane proteins. In a benchmark test of 40 proteins of known structure, the method sampled the correct topology in 34 cases. This dem- onstrates that the algorithm can accurately predict protein topology without the need for large multiple sequence alignments, homologous template struc- tures, or experimental restraints. INTRODUCTION Membrane proteins (MPs) constitute more than one-quarter of the human genome (Fagerberg et al., 2010) and more than one-half of all known drug targets (Bakheet and Doig, 2009). However, less than 2% of structures present in the Protein Data Bank (PDB) are MPs, meaning that a large number of MP folds have not yet been characterized (Oberai et al., 2006). Presently, about 100 helical multispan integral MP folds have been determined—about 1,200 are expected to exist based on analysis of sequence databases (Hopf et al., 2012). This wide disparity between MP biological relevance and available struc- tural information is in large part due to the specialized biophysi- cal properties that make MPs difficult to express, purify, and study by X-ray crystallography or NMR spectroscopy. Computa- tional techniques can often provide structural insight when experimental data are lacking; however, the majority of the effort in this field has been focused on soluble proteins. There are several successful algorithms for predicting MP transmembrane (TM) spans (Fagerberg et al., 2010), yet predict- ing MP three-dimensional structure remains difficult. One con- sequence of the low number of MP folds with known structure is that for a larger fraction of MP targets, template-based modeling is not an option. There are a few de novo methods that have been successful in predicting structures for small (<150 residues) MPs, one example of which is Rosetta- Membrane (Yarov-Yarovoy et al., 2006). However, many larger and more complex MPs, such as G protein-coupled receptors, are important both biologically and pharmaceutically, yet remain challenging targets for these methods. One important caveat is that the accuracy of prediction methods can improve drastically with the incorporation of re- straints (Barth et al., 2009). The restraints can be experimental, such as NMR chemical shifts, residual dipolar couplings, and distance restraints (Sanders and So ¨ nnichsen, 2006). Addition- ally, recent work has demonstrated the power of predicted con- tact restraints generated from sequence analysis with the accu- rate prediction of MPs with up to 14 TM segments (Hopf et al., 2012; Nugent and Jones, 2012b). Obtaining experimental data or a large number of homologous sequences cannot be guaran- teed for any given target; therefore, improved algorithms for de novo MP structure prediction would be beneficial for the field. De novo protein structure prediction methods can be broken down into two components: sampling and scoring. During the sampling phase, the protein model is perturbed in some manner. The protein model is then scored, using a scoring function designed to identify native-like topologies. The bottleneck of de novo protein structure prediction is sampling the large confor- mational space densely enough so that one model approaches the native conformation to about 2 A ˚ RMSD100 (root-mean- square deviation normalized to a protein length of 100 residues) (Carugo and Pongor, 2001). At this accuracy, an all-atom energy function can usually distinguish the native-like conformation from alternatives (Bradley et al., 2005). However, without restrict- ing the conformational space through experimental restraints, such sampling densities can only be achieved for very small pro- teins (<80 residues). Therefore, progress in de novo MP structure prediction accuracy is likely to arise from an increase in sampling efficiency. Rosetta uses a fragment assembly approach to replace stretches of three or nine residues with conformations determined from sequence similarity to known structures (Simons et al., 1997). Although this method samples local con- tacts effectively, it is challenged to adequately sample long- range contacts, especially for larger proteins (Bonneau et al., 2002; Lange and Baker, 2012). As evidence, modifying the algo- rithm to allow for random chain breaks improves performance when using long-range contacts as restraints (Barth et al., 2009). BCL::Fold (BCL, BioChemical Library) is a protein structure prediction method that rapidly assembles secondary structure Structure 21, 1–11, July 2, 2013 ª2013 Elsevier Ltd All rights reserved 1 Please cite this article in press as: Weiner et al., BCL::MP-Fold: Folding Membrane Proteins through Assembly of Transmembrane Helices, Structure (2013), http://dx.doi.org/10.1016/j.str.2013.04.022
Transcript of BCL::MP-Fold: Folding Membrane Proteins through Assembly

Please cite this article in press as: Weiner et al., BCL::MP-Fold: Folding Membrane Proteins through Assembly of Transmembrane Helices, Structure(2013), http://dx.doi.org/10.1016/j.str.2013.04.022
Structure
Ways & Means
BCL::MP-Fold: Folding Membrane Proteinsthrough Assembly of Transmembrane HelicesBrian E. Weiner,1 Nils Woetzel,1 Mert Karakasx,1 Nathan Alexander,1 and Jens Meiler1,*1Center for Structural Biology, Department of Chemistry, Vanderbilt University, Nashville, TN 37232, USA
*Correspondence: [email protected]
http://dx.doi.org/10.1016/j.str.2013.04.022
SUMMARY
Membrane protein structure determination remains achallenging endeavor. Computational methods thatpredict membrane protein structure from sequencecan potentially aid structure determination for suchdifficult target proteins. The de novoprotein structureprediction method BCL::Fold rapidly assembles sec-ondary structure elements into three-dimensionalmodels. Here, we describe modifications to the algo-rithm, named BCL::MP-Fold, in order to simulatemembrane protein folding. Models are built into astatic membrane object and are evaluated using aknowledge-based energy potential, which has beenmodified to account for the membrane environment.Additionally, a symmetry folding mode allows forthe prediction of obligate homomultimers, a commonproperty amongmembrane proteins. In a benchmarktest of 40 proteins of known structure, the methodsampled the correct topology in 34 cases. This dem-onstrates that the algorithm can accurately predictprotein topology without the need for large multiplesequence alignments, homologous template struc-tures, or experimental restraints.
INTRODUCTION
Membrane proteins (MPs) constitute more than one-quarter of
the human genome (Fagerberg et al., 2010) and more than
one-half of all known drug targets (Bakheet and Doig, 2009).
However, less than 2% of structures present in the Protein
Data Bank (PDB) are MPs, meaning that a large number of
MP folds have not yet been characterized (Oberai et al., 2006).
Presently, about 100 helical multispan integral MP folds have
been determined—about 1,200 are expected to exist based on
analysis of sequence databases (Hopf et al., 2012). This wide
disparity between MP biological relevance and available struc-
tural information is in large part due to the specialized biophysi-
cal properties that make MPs difficult to express, purify, and
study by X-ray crystallography or NMR spectroscopy. Computa-
tional techniques can often provide structural insight when
experimental data are lacking; however, the majority of the effort
in this field has been focused on soluble proteins.
There are several successful algorithms for predicting MP
transmembrane (TM) spans (Fagerberg et al., 2010), yet predict-
ing MP three-dimensional structure remains difficult. One con-
Struc
sequence of the low number of MP folds with known structure
is that for a larger fraction of MP targets, template-based
modeling is not an option. There are a few de novo methods
that have been successful in predicting structures for small
(<150 residues) MPs, one example of which is Rosetta-
Membrane (Yarov-Yarovoy et al., 2006). However, many larger
and more complex MPs, such as G protein-coupled receptors,
are important both biologically and pharmaceutically, yet remain
challenging targets for these methods.
One important caveat is that the accuracy of prediction
methods can improve drastically with the incorporation of re-
straints (Barth et al., 2009). The restraints can be experimental,
such as NMR chemical shifts, residual dipolar couplings, and
distance restraints (Sanders and Sonnichsen, 2006). Addition-
ally, recent work has demonstrated the power of predicted con-
tact restraints generated from sequence analysis with the accu-
rate prediction of MPs with up to 14 TM segments (Hopf et al.,
2012; Nugent and Jones, 2012b). Obtaining experimental data
or a large number of homologous sequences cannot be guaran-
teed for any given target; therefore, improved algorithms for de
novo MP structure prediction would be beneficial for the field.
De novo protein structure prediction methods can be broken
down into two components: sampling and scoring. During the
sampling phase, the protein model is perturbed in somemanner.
The protein model is then scored, using a scoring function
designed to identify native-like topologies. The bottleneck of
de novo protein structure prediction is sampling the large confor-
mational space densely enough so that one model approaches
the native conformation to about 2 A RMSD100 (root-mean-
square deviation normalized to a protein length of 100 residues)
(Carugo and Pongor, 2001). At this accuracy, an all-atom energy
function can usually distinguish the native-like conformation
from alternatives (Bradley et al., 2005). However, without restrict-
ing the conformational space through experimental restraints,
such sampling densities can only be achieved for very small pro-
teins (<80 residues). Therefore, progress in de novoMP structure
prediction accuracy is likely to arise from an increase in sampling
efficiency. Rosetta uses a fragment assembly approach to
replace stretches of three or nine residues with conformations
determined from sequence similarity to known structures
(Simons et al., 1997). Although this method samples local con-
tacts effectively, it is challenged to adequately sample long-
range contacts, especially for larger proteins (Bonneau et al.,
2002; Lange and Baker, 2012). As evidence, modifying the algo-
rithm to allow for random chain breaks improves performance
when using long-range contacts as restraints (Barth et al., 2009).
BCL::Fold (BCL, BioChemical Library) is a protein structure
prediction method that rapidly assembles secondary structure
ture 21, 1–11, July 2, 2013 ª2013 Elsevier Ltd All rights reserved 1
Structure
Ways & Means
Please cite this article in press as: Weiner et al., BCL::MP-Fold: Folding Membrane Proteins through Assembly of Transmembrane Helices, Structure(2013), http://dx.doi.org/10.1016/j.str.2013.04.022
elements (SSEs) into topologies (Karakasx et al., 2012). For
soluble proteins, a pool of predicted SSEs is generated using
JUFO (Meiler et al., 2001) and PSIPRED (Jones, 1999). The
SSEs are then assembled using a Monte Carlo (MC) assembly
protocol and evaluated using a consensus knowledge-based
scoring function (Woetzel et al., 2012) via the Metropolis crite-
rion. The method achieves prediction accuracies comparable
to Rosetta.
We hypothesize that assembly of SSEs is a particularly
efficient approach to sampling MP topology space; helical MP
topology is defined by the relative orientation of the transmem-
brane helices (TMHs). Although there are many variations of
the canonical bundle of TMHs (Nugent and Jones, 2012a), the
fold space of MPs is much reduced when compared to soluble
proteins (Oberai et al., 2006). The underlying hypothesis of
BCL::Fold is that the interactions between SSEs determine the
majority of the protein core and therefore give rise to its thermo-
dynamic stability. For the TMHs in MPs this is particularly true,
as the apolar membrane environment promotes formation of
secondary structure, thereby minimizing the error introduced
into BCL::Fold through the absence of loop regions in the initial
assembly. In order to test this hypothesis and begin to predict
the structure of larger membrane proteins in the absence of
experimental data, we have developed BCL::MP-Fold to predict
MP topology. The scoring functions were modified to account
for the unique properties of the apolar membrane in the amino
acid environment potential and an increased radius of gyration
along the membrane normal. Three additional scores are intro-
duced to describe the preferred orientation of SSEs with respect
to the membrane, penalize connection of two neighboring TMHs
that would require passage through the membrane, and assess
the agreement of amino acid placement in membrane regions
with prediction from sequence. As many MPs are obligate
homo-oligomers, a symmetrical folding mode was introduced.
The method was benchmarked against 40 MPs of known struc-
ture. In 34 cases, BCL::MP-Fold was able to sample the native
topology, indicating that assembly of discreet SSEs is a viable
strategy in de novo membrane protein topology determination.
RESULTS
The BCL::Fold protocol (Karakasx et al., 2012) was first updated
to accommodate MP structure determination. This involved
the addition of further assembly stages prior to refinement, the
incorporation of MP-specific scores, and the incorporation
of MP-specific MC moves. Additionally, symmetric multimer
folding was introduced in order to predict homomultimeric
MP structure. Finally, the updated method was benchmarked
against 40 MPs of known structure.
Multiphase MP Assembly from SSEs Beginswith Placement of TMHsBCL::Fold for soluble proteins is broken into two stages: assem-
bly and refinement. Large-scale perturbations—such as SSE
transformations, SSE addition/deletion, and domain shuffling—
are utilized in the assembly stage. The refinement stage focuses
on small-amplitude transformations and SSE bending that apply
minor modifications to the topology established by the assembly
stage.
2 Structure 21, 1–11, July 2, 2013 ª2013 Elsevier Ltd All rights reserv
To enable a subsequent assembly of TMH and non-TMH
SSEs, the assembly stage is broken up into five substages.
The weight of the clash scores (amino acid and SSE) start at
zero in the first stage and are increased linearly to maximum
values for the fifth stage. This allows for SSEs to ‘‘move through’’
each other during assembly, allowing for more efficient sampling
of distinct topologies. Additionally, two SSE pools are used dur-
ing the minimization. For the first two stages of refinement, the
SSE pool contains only TMHs predicted by SPOCTOPUS
(Viklund et al., 2008). This allows for the core of the MP to be
assembled without interference from small, amphipathic helices
or soluble SSEs that do not determine the overall MP topology.
Once the core has been assembled in the second stage, the re-
maining stages utilize a pool that contains both SPOCTOPUS
and JUFO9D (Leman et al., 2013) predictions. This serves two
purposes. First, because SPOCTOPUS only predicts TMHs,
additional SSEs predicted by JUFO9D can be added at this
point. Second, SPOCTOPUS predictions are rather rigid with re-
gard to TMH length; the addition of JUFO9D allows for shrinking/
extending of the TMHs based on the predicted probability
and the associated knowledge-based (KB) potential. Finally, in
the refinement stage, small moves optimize SSE interactions
and packing. This stage is identical to the one described for
soluble proteins, aside from the MP-specific scores and moves
described below. The complete assembly and refinement
process is repeated 1,000 times to generate the final models
(Figure S1A available online; Movie S1).
Three-Layer Implicit Membrane Representationwith a Total Thickness of 50 ABCL::MP-Fold uses a static, three-layer membrane object
(Figure 1A) with scoring functions optimized for each of the
three layers. Themembrane apolar core is 20 A thick. A transition
region of 10 A on either side of the membrane core marks the
position of lipid head groups. Beyond this transition region, reg-
ular potentials for soluble proteins are assumed. To facilitate a
smooth transition between the layers, 2.5 A gaps are introduced
between the membrane core and transition region and between
the transition region and soluble region. The total membrane
thickness is therefore 50 A. Thickness of the membrane core
and transition region were held constant for the present study
but can be manually adjusted if desired. Bicubic splines are
used to ensure that all potentials are smooth and continuously
differentiable, especially along the membrane normal. During
the MC assembly process, the membrane is situated along
the x-y plane, with the z axis as the membrane normal. The
minimization starts with the placement of a single, random
TMH in the membrane, with its main axis perpendicular to the
membrane plane.
BCL::Score: Scoring Soluble Proteins
BCL::MP-Fold modifies the established soluble scoring function.
Here, we briefly summarize the theory used to derive the poten-
tial. The reader is referred to the BCL::Score manuscript for
additional details (Woetzel et al., 2012). The soluble BCL::Fold
method evaluates models using BCL::Score, a knowledge-
based potential, derived using Bayes’s theorem:
PðstructjseqÞ=PðstructÞ3PðseqjstructÞ 31
PðseqÞ:
ed
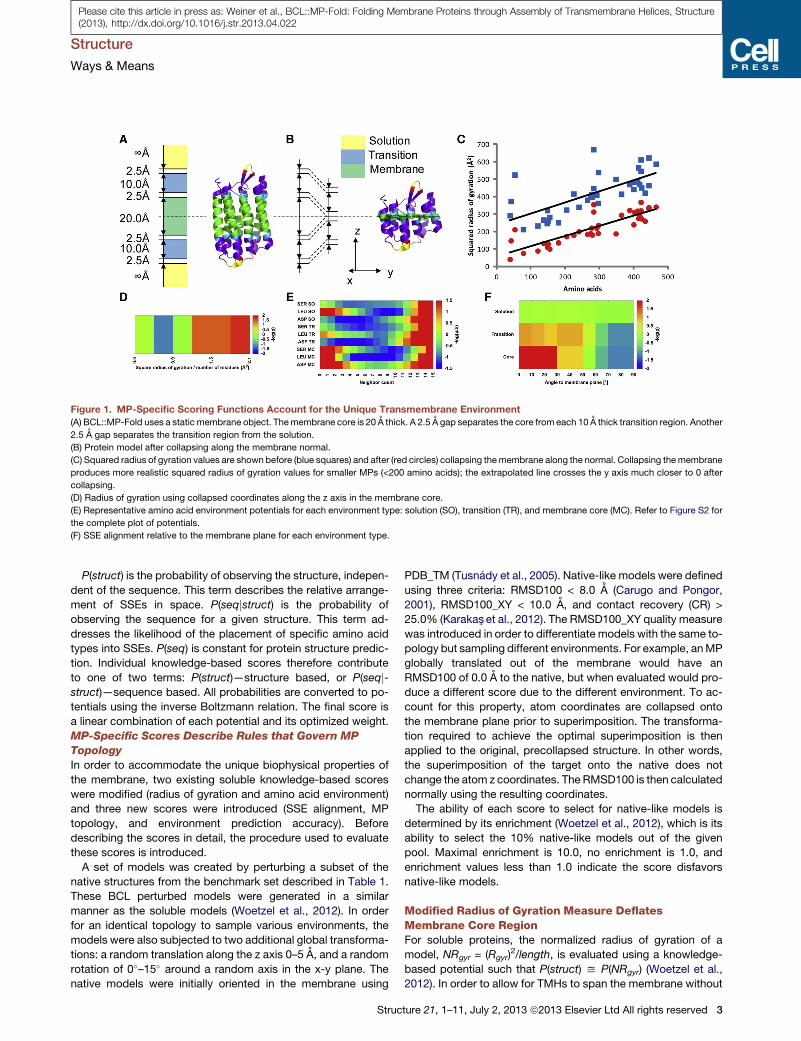
Figure 1. MP-Specific Scoring Functions Account for the Unique Transmembrane Environment
(A) BCL::MP-Fold uses a staticmembrane object. Themembrane core is 20 A thick. A 2.5 A gap separates the core from each 10 A thick transition region. Another
2.5 A gap separates the transition region from the solution.
(B) Protein model after collapsing along the membrane normal.
(C) Squared radius of gyration values are shown before (blue squares) and after (red circles) collapsing themembrane along the normal. Collapsing themembrane
produces more realistic squared radius of gyration values for smaller MPs (<200 amino acids); the extrapolated line crosses the y axis much closer to 0 after
collapsing.
(D) Radius of gyration using collapsed coordinates along the z axis in the membrane core.
(E) Representative amino acid environment potentials for each environment type: solution (SO), transition (TR), and membrane core (MC). Refer to Figure S2 for
the complete plot of potentials.
(F) SSE alignment relative to the membrane plane for each environment type.
Structure
Ways & Means
Please cite this article in press as: Weiner et al., BCL::MP-Fold: Folding Membrane Proteins through Assembly of Transmembrane Helices, Structure(2013), http://dx.doi.org/10.1016/j.str.2013.04.022
P(struct) is the probability of observing the structure, indepen-
dent of the sequence. This term describes the relative arrange-
ment of SSEs in space. P(seqjstruct) is the probability of
observing the sequence for a given structure. This term ad-
dresses the likelihood of the placement of specific amino acid
types into SSEs. P(seq) is constant for protein structure predic-
tion. Individual knowledge-based scores therefore contribute
to one of two terms: P(struct)—structure based, or P(seqj-struct)—sequence based. All probabilities are converted to po-
tentials using the inverse Boltzmann relation. The final score is
a linear combination of each potential and its optimized weight.
MP-Specific Scores Describe Rules that Govern MP
Topology
In order to accommodate the unique biophysical properties of
the membrane, two existing soluble knowledge-based scores
were modified (radius of gyration and amino acid environment)
and three new scores were introduced (SSE alignment, MP
topology, and environment prediction accuracy). Before
describing the scores in detail, the procedure used to evaluate
these scores is introduced.
A set of models was created by perturbing a subset of the
native structures from the benchmark set described in Table 1.
These BCL perturbed models were generated in a similar
manner as the soluble models (Woetzel et al., 2012). In order
for an identical topology to sample various environments, the
models were also subjected to two additional global transforma-
tions: a random translation along the z axis 0–5 A, and a random
rotation of 0�–15� around a random axis in the x-y plane. The
native models were initially oriented in the membrane using
Struc
PDB_TM (Tusnady et al., 2005). Native-like models were defined
using three criteria: RMSD100 < 8.0 A (Carugo and Pongor,
2001), RMSD100_XY < 10.0 A, and contact recovery (CR) >
25.0% (Karakasx et al., 2012). The RMSD100_XY quality measure
was introduced in order to differentiate models with the same to-
pology but sampling different environments. For example, anMP
globally translated out of the membrane would have an
RMSD100 of 0.0 A to the native, but when evaluated would pro-
duce a different score due to the different environment. To ac-
count for this property, atom coordinates are collapsed onto
the membrane plane prior to superimposition. The transforma-
tion required to achieve the optimal superimposition is then
applied to the original, precollapsed structure. In other words,
the superimposition of the target onto the native does not
change the atom z coordinates. The RMSD100 is then calculated
normally using the resulting coordinates.
The ability of each score to select for native-like models is
determined by its enrichment (Woetzel et al., 2012), which is its
ability to select the 10% native-like models out of the given
pool. Maximal enrichment is 10.0, no enrichment is 1.0, and
enrichment values less than 1.0 indicate the score disfavors
native-like models.
Modified Radius of Gyration Measure DeflatesMembrane Core RegionFor soluble proteins, the normalized radius of gyration of a
model, NRgyr = (Rgyr)2/length, is evaluated using a knowledge-
based potential such that P(struct) y P(NRgyr) (Woetzel et al.,
2012). In order to allow for TMHs to span the membrane without
ture 21, 1–11, July 2, 2013 ª2013 Elsevier Ltd All rights reserved 3

Table 1. Benchmark Statistics and Results
PDB ID Code TMH Domain Residues Subunits
BCL::MP-Fold Rosetta-Membrane
RMSD100 Score RMSD100 Score
Best Top 5% Best Top 5% Best Top 5% Best Top 5%
Traditional Folding
2BG9 3 A: 211–301 91 1 2.8 3.4 9.9 6.7 3.9 5.5 10.7 10.2
1NKZ 2 A: 2–53;
B: 1–41
93 1 4.3 4.6 11.2 8.3
2L35 3 A: 1–63;
B: 1–32
95 1 3.1 3.7 17.2 9.7
2KSF 4 396–502 107 1 3.9 4.5 5.1 5.6 5.6 6.9 10.5 10.9
1J4N 3 4–119 116 1 4.9 5.9 9.6 9.0 4.5 6.5 9.7 10.2
3SYO 2 76–197 122 1 5.2 6.3 9.7 10.0 6.4 7.9 11.0 11.2
1PY6 4 77–199 123 1 3.9 4.7 5.4 6.4 2.2 3.2 2.8 5.7
2PNO 4 A: 2–131 130 1 5.0 6.7 5.4 8.6 4.0 5.1 9.4 8.2
2BL2 4 12–156 145 1 2.9 3.8 6.7 7.3 2.2 3.1 3.5 5.6
2K73 4 1–164 164 1 4.7 5.9 10.1 9.1 3.4 5.2 8.7 8.4
1RHZ 5 A: 23–188 166 1 6.7 8.0 9.9 10.4 6.0 7.9 9.3 11.7
1IWG 5 330–497 168 1 4.3 5.6 8.5 8.3 5.1 6.9 8.5 9.3
3P5N 6 10–188 179 1 5.8 7.4 8.3 9.8 5.2 6.9 12.0 9.6
2IC8 6 91–272 182 1 6.0 7.2 9.5 9.3 5.2 7.2 10.1 10.5
2YVX 5 A: 284–471 188 1 5.1 6.9 9.2 9.4 5.7 7.6 8.9 10.5
1PV6 6 1–190 189 1 5.7 6.8 10.6 9.4 6.2 7.6 10.0 10.4
1OCC 5 C: 71–261 191 1 4.6 5.9 8.5 8.0 7.3 9.2 10.8 11.3
2NR9 6 4–195 192 1 5.7 7.2 8.7 9.5 5.6 7.6 10.5 10.5
4A2N 5 1–192 192 1 4.3 6.2 8.1 8.8 5.0 7.1 9.6 10.3
1KPL 7 31–233 203 1 8.7 10.5 14.4 12.5 11.1 13.2 15.4 16.1
2ZW3 4 A: 2–217 216 1 4.0 5.1 9.2 8.1 6.7 8.4 13.5 11.1
2BS2 5 C: 21–237 217 1 5.4 6.9 11.0 9.2 6.0 8.5 13.0 10.9
1L0V 6 C: 20–130;
D: 10–119
221 1 5.2 7.2 9 9.4
2KSY 7 1–223 223 1 5.1 6.3 9.3 8.6 4.6 5.7 6.1 9.1
1PY6 7 5–231 227 1 4.8 5.9 6.1 8.4 3.3 5.8 8.4 8.7
3KCU 7 29–280 252 1 7.3 8.5 11.2 10.5 7.2 9.3 11.0 11.4
1FX8 7 6–259 254 1 6.4 7.6 9.3 9.8 8.9 10.4 11.8 12.4
1U19 7 33–310 278 1 5.3 6.6 8.9 8.8 9.7 12.7 10.7 15.2
1OKC 6 2–293 292 1 7.1 8.2 9.9 10.3 10.3 11.7 12.5 13.5
3KJ6 7 A: 35–346 311 1 5.9 7.4 10.5 10.0 8.0 10.5 13.6 13.2
3B60 6 A: 10–328 319 1 9.5 10.8 12.4 13.2 6.8 8.0 10.4 10.0
3HD6 12 6–448 403 1 7.2 8.2 11.0 10.3 8.0 9.5 11.9 11.7
3GIA 12 3–435 433 1 9.6 10.7 13.4 12.6 11.6 13.9 14.2 15.8
3O0R 12 B: 10–458 449 1 6.9 8.2 10.2 10.3 6.8 8.6 12.3 11.1
2XUT 12 A: 13–500 488 1 7.7 9.0 10.2 11.4 9.4 11.1 13.6 13.3
3HFX 12 12–504 493 1 8.9 9.7 13.1 11.4 11.7 13.5 15.3 15.4
1YEW 14 A: 151–225;
B: 7–244;
C: 45–259
528 1 9.7 11.5 14.1 13.3
2XQ2 15 A: 9–573 565 1 8.2 10.1 12.2 12.1 11.6 13.2 12.6 15.4
Mean 7 242 1 5.8 7.1 9.9 9.6 6.6 8.4 10.6 11.1
Std dev 3 130 0 1.9 2.0 2.5 1.8 2.7 2.8 2.8 2.6
(Continued on next page)
Structure
Ways & Means
4 Structure 21, 1–11, July 2, 2013 ª2013 Elsevier Ltd All rights reserved
Please cite this article in press as: Weiner et al., BCL::MP-Fold: Folding Membrane Proteins through Assembly of Transmembrane Helices, Structure(2013), http://dx.doi.org/10.1016/j.str.2013.04.022

Table 1. Continued
PDB ID Code TMH Domain Residues Subunits
BCL::MP-Fold Rosetta-Membrane
RMSD100 Score RMSD100 Score
Best Top 5% Best Top 5% Best Top 5% Best Top 5%
Multimer Folding
2HAC 1 �3–30 33 2 1.0 1.3 3.5 3.7
2KIX 1 1–33 33 4 2.2 2.4 5.7 4.2
1NKZ 2 A: 2–53;
B: 1–41
93 9 4.1 4.7 8.1 8.4
3SYO 2 76–197 122 4 9.3 9.6 10.7 10.5
2PNO 4 A: 2–131 130 3 3.3 5.2 10.5 8.1
2BL2 4 12–156 145 10 2.8 3.6 5.7 5.4
2YVX 5 A: 284–471 188 2 4.3 5.9 9.5 8.4
2ZW3 4 A: 2–217 216 6 4.8 5.6 7.9 8.0
1FX8 7 6–259 254 4 10.8 11.3 11.7 12.0
3B60 6 A: 10–328 319 2 7.9 9.2 11.3 11.1
3HD6 12 6–448 403 3 5.8 7.4 9.0 9.5
3HFX 12 12–504 493 3 8.7 9.6 10.9 11.3
Mean 5 202 4 5.4 6.3 8.7 8.4
Std dev 4 143 3 3.1 3.1 2.6 2.8
The RMSD100 values are reported after sorting the models by either RMSD100 or score. The RMSD100 is calculated over all Ca atoms in native SSEs.
Std dev, standard deviation.
Structure
Ways & Means
Please cite this article in press as: Weiner et al., BCL::MP-Fold: Folding Membrane Proteins through Assembly of Transmembrane Helices, Structure(2013), http://dx.doi.org/10.1016/j.str.2013.04.022
inflating the Rgyr score, the coordinates are collapsed along
the membrane normal by an amount equal to one-half of the
membrane core thickness, 10 A, prior to the NRgyr calculation
(Figure 1B). The NRgyr is then evaluated using the KB potential
(Figure 1D), as for soluble proteins. The rationale for this proce-
dure is that minimizing the radius of gyration is an effect seen in
soluble proteins caused by the overall drive to (1) bury hydropho-
bic amino acids and (2) maximize constructive interactions of
side chains. This first component is absent once an amino acid
is embedded in the membrane core, that is, there is no force to
compact the MP along the membrane normal. As the second
component is still present, compacting forces in the membrane
plane are still active. Collapsing the membrane is particularly
important for smaller proteins (<200 residues), which would
otherwise have an unnaturally high (Rgyr)2 value (Figure 1C).
The average enrichment value for the radius of gyration score
was 1.4 for each criterion. The percentages of models with a
Z score >1.0 were 56%, 61%, and 67% for the RMSD100,
RMSD100_XY, and CR criteria, respectively.
Amino Acid Environment Potential Reflects ApolarMembrane Core RegionThe amino acid environment potential describes the preference
for a particular amino acid type to be exposed or buried:
P(seqjstruct) y PiP(aaijei), where aai is the residue type and eiis the modified neighbor count. The MP amino acid environment
score function is determined identically to its soluble counter-
part, except that the procedure is executed separately for the
three membrane regions: membrane core, transition, and solu-
tion. For residues in the gap regions, a weighted average of the
score in the neighboring regions is computed. Exposure is repre-
sented by neighbor count, such that a low neighbor count corre-
Struc
sponds to a high solvent-accessible surface area (Durham et al.,
2009). Figure 1E displays representative potentials; the complete
potentials can be found in Figure S2. As expected, the polar
serine and the negatively charged aspartate both favor buried
environments (higher neighbor counts) in the membrane core
relative to solution. Additionally, the hydrophobic leucine has
the opposite property, favoring a more exposed environment
in the membrane core. The average enrichment values for the
amino acid environment score were 2.7, 2.7, and 3.0 for
the RMSD100, RMSD100_XY, and CR criteria, respectively.
The percentages of models with a Z score >1.0 were 88%,
100%, and 100%.
TMH Alignment Displays Strong Preference to BeParallel with Respect to the Membrane NormalDuring the BCL::MP-Fold minimization, SSEs can be rotated in
any orientation. In order to select for models with TMHs properly
spanning the membrane, an SSE alignment score was intro-
duced. This score evaluates the measured angle, q, of the SSE
to the membrane plane given the environment type (Figure 1F),
such that P(struct)yPiP(SSEijqi). TMHs tend to span the mem-
brane at a 70�–90� angle to the membrane plane. The average
enrichment values for the SSE alignment score were 2.2, 2.3,
and 2.4 for the RMSD100, RMSD100_XY, and CR criteria,
respectively. The percentages of models with a Z score >1.0
were 89%, 94%, and 94%.
MP Topology Score Penalizes Loop Connectionsbetween TMHs that Require Passage throughthe MembraneTM loops (coils) are rare, short, and typically associated with
reentrant regions and functional sites in kinked TMHs (Kauko
ture 21, 1–11, July 2, 2013 ª2013 Elsevier Ltd All rights reserved 5

Structure
Ways & Means
Please cite this article in press as: Weiner et al., BCL::MP-Fold: Folding Membrane Proteins through Assembly of Transmembrane Helices, Structure(2013), http://dx.doi.org/10.1016/j.str.2013.04.022
et al., 2008). Because BCL models do not contain loops during
minimization, a penalty score is needed to disfavor topologies
that would require long membrane-spanning loop regions to
connect two TMHs. Although the soluble protein loop scores
are still utilized for MP folding, they only ensure that the loop
can be closed, not that the loop will be in a favorable environ-
ment. The MP topology score introduces a penalty when the C
terminus of a TMH is not on the same side of the membrane as
the N terminus of the subsequent TMH, for example. In practice,
this is achieved by grouping alternating TMHs and determining
whether the termini lie on the same side of the membrane. We
therefore evaluate P(struct) y PiP(TMHi, TMHi+1) and
EMPtopo =Xi
�0; sgnðzc;iÞ= sgnðzn;i + 1Þ1; sgnðzc;iÞssgnðzn;i + 1Þ ;
where zc,i is the z coordinate of the C terminus of TMHi and zn,i+1is the z coordinate of the N terminus of TMHi+1. SSEs that do not
span themembrane, such as amphipathic or soluble helices pre-
dicted by JUFO9D, are excluded from this analysis. The average
enrichment values for the MP topology score were 4.8, 4.2, and
2.5 for the RMSD100, RMSD100_XY, and CR criteria, respec-
tively. The percentage of models with a Z score >1.0 was
100% for each of the three criteria.
Agreement of Amino Acid Placement in MembraneRegions Predicted from SequenceBoth SPOCTOPUS and JUFO9D predict the environment
type (membrane core versus soluble region) as well as the
secondary structure; SPOCTOPUS only predicts TMHs whereas
JUFO9D gives a nine-state prediction, with three secondary
structure types (helix, coil, strand) and three environment types
(membrane core, transition region, soluble region). Models are
therefore scored both on secondary structure and environment
prediction. The secondary structure agreement score is calcu-
lated in an identical manner as for soluble proteins with soluble
prediction methods (Woetzel et al., 2012). The membrane place-
ment prediction agreement is scored analogously, where the
probability of each residue to be observed in the current envi-
ronment type given the SPOCTOPUS and JUFO9D predictions
is calculated: P(seqjstruct) y PiP(aaijENVi).
The average enrichment values for the environment prediction
score were 3.0, 2.9, and 2.3 for the RMSD100, RMSD100_XY,
and CR criteria, respectively, for JUFO9D, and 2.8, 2.8, and
2.7 for SPOCTOPUS. The percentages of models with a Z score
>1.0 were 100%, 100%, and 88% for JUFO9D, and 100% for
all three criteria for SPOCTOPUS.
Efficient Sampling of MP Topologies through a TailoredSet of MC MovesThe soluble BCL::Fold method utilizes a total of 107 MC moves
(Karakasx et al., 2012). They are classified into six categories:
(1) adding SSEs, (2) removing SSEs, (3) swapping SSEs, (4) sin-
gle SSE moves, (5) SSE pair moves, and (6) moving domains.
An additional move category, global transformations, containing
two moves, was added for membrane folding in order to effec-
tively sample the different membrane environments (Figure S1B).
First, a global translation of 2–10 A along the membrane normal
allows for the protein to move in and out of the membrane.
6 Structure 21, 1–11, July 2, 2013 ª2013 Elsevier Ltd All rights reserv
Second, a rotation around a random vector with the membrane
plane samples different orientations within themembrane. These
perturbations preserve protein structure and therefore have
no impact on previous components of the BCL::Fold scoring
function. They alter the five new/modified scores for MPs.
Multimerization Achieved by Replicating a SingleSubunit prior to ScoringIn order to facilitate prediction of homomultimeric MPs, folding
with cyclic symmetry was introduced. All perturbations are per-
formed on a single subunit, and the subunit is then replicated
around an axis of symmetry prior to scoring. The total number
of subunits is defined by the user prior to the minimization.
Additional perturbations are required to sample varying subunit
interfaces (Figure S1C). First, a random global rotation of the
primary subunit allows for a new interface to be sampled.
Second, a global translation toward or away from the symmetry
axis changes the compactness of the multimer. Third, a domain-
swap perturbation is also added that exchanges one SSE with
its counterpart in an adjacent subunit.
Benchmark Set of 40 MPs of Known StructureA benchmark set of 40 MPs of known structure was created to
assess the protein structure prediction method. The set contains
all proteins from the Rosetta-Membrane benchmark (Yarov-
Yarovoy et al., 2006) as well as additional proteins that are
both structurally and functionally diverse (Table 1). The proteins
range from 91 to 565 residues and from 2 to 15 TMHs. Twelve of
the proteins form obligate multimers containing two to ten sub-
units, resulting in 66–1,479 total residues. One thousand models
were generated for each protein using the BCL::MP-Fold
algorithm. Two runs were performed for multimeric proteins—
structures were predicted of just the protomer using the stan-
dard method, and the structure of the complete multimer was
also predicted taking advantage of the cyclic symmetry in the
multimeric folding mode. PDB ID codes 2HAC and 2KIX were
only folded as multimers because they each contain only one
TMH per subunit. The quality of SSE placement is assessed
using the RMSD100 measure. A subset of the results is shown
in Figure 2; complete results can be found in Figure S3.
Among the single-subunit predictions, the average RMSD100
to the native of the best model sampled is 5.8 ± 1.9 A (Table 1).
In 32 of the 38 cases (84%), the correct topology is sampled
using the criteria of RMSD100 < 8.0 A. When large proteins con-
taining 12 or more TMHs are excluded, the correct topology is
sampled in 29 out 31 cases (94%). In 27 of the 38 cases
(71%), the top 5% of models by BCL::Score contain the correct
topology. This changes to 25 out of 31 cases (81%) when the
large proteins are excluded.
The two proteins with seven TMHs or fewer that BCL::MP-Fold
was unable to sample the correct topology were a subdomain
of the H+/Cl� transporter (Dutzler et al., 2002) (PDB ID code
1KPL) and the ABC transporter MsbA (Ward et al., 2007) (PDB
ID code 3B60). The H+/Cl� transporter was part of the Rosetta-
Membrane benchmark (Yarov-Yarovoy et al., 2006), and the
method performed similarly poorly. As the authors mention,
this protein has a particularly complex topology, compounded
by the SPOCTOPUS method only predicting five of the seven
transmembrane spans; the fourth and sixth TMHs are missed.
ed

Figure 2. Gallery of Select Benchmark Results
Left column: BCL score versus RMSD100 plots of
1,000 generated models. The 1,000 models generated
by BCL::MP-Fold for the prediction are shown in green.
In red, 50 minimizations of the native model using only
the refinement stage are shown. Middle column: side
view of the best model sampled. Right column: over-
head view of the best model sampled. The bottom
result, PDB ID code 2KIX, was generated using multi-
mer folding. For the gallery of the complete benchmark
results, please see Figure S3.
Structure
Ways & Means
Structure 21, 1–11, July 2, 2013 ª2013 Elsevier Ltd All rights reserved 7
Please cite this article in press as: Weiner et al., BCL::MP-Fold: Folding Membrane Proteins through Assembly of Transmembrane Helices, Structure(2013), http://dx.doi.org/10.1016/j.str.2013.04.022

Structure
Ways & Means
Please cite this article in press as: Weiner et al., BCL::MP-Fold: Folding Membrane Proteins through Assembly of Transmembrane Helices, Structure(2013), http://dx.doi.org/10.1016/j.str.2013.04.022
JUFO9D successfully predicts these missing TMHs, but
because these predictions are not added to the SSE pool until
the third assembly stage, the BCL::MP-Fold method has diffi-
culty placing them correctly among the five previously placed
TMHs. When folding is initiated with the JUFO9D-predicted
TMHs, the correct topology is sampled; the RMSD100 of the
best model is then 7.1 A. MsbA is a particularly difficult target.
First, the TMHs are extremely long (40+ residues), whereas the
SPOCTOPUS-predicted TMHs only span 21 residues each.
Second, the protein is flexible, with a large ligand-induced
conformational shift. Third, MsbA is a homodimer, which makes
it a better target for the multimeric predictions discussed below.
For the multimeric predictions, the average RMSD100 (over
the entire multimer) to the native of the best model sampled is
5.4 ± 3.1 A (Table 1). This corresponds to 9 out of 12 cases
(75%) where the correct topology is sampled. In the same 9 of
12 cases (75%), the top 5% of models by BCL::Score contain
the correct topology. MsbAwas one of the successfully sampled
multimer targets, with the best model sampled having an
RMSD100 to the native of 7.7 A.
Despite having only two TMHs per subunit, the tetrameric to-
pology of GIRK2 K+ channel protein (Whorton and MacKinnon,
2011) (PDB ID code 3SYO) was not correctly predicted by
BCL::MP-Fold. In particular, the current version of BCL::MP-
Fold cannot adequately form the ion-conducting channel
because it largely contains loop residues. Additionally, the
TMHs pass through the membrane at an angle of approximately
50�, rather than the more commonly observed and thus more
energetically favorable 70�–90� (Figure 1F). The tetrameric
glycerol-conducting channel (Fu et al., 2000) (PDB ID code
1FX8) was also a challenging multimeric target. In the native
tetramer, the core is dominated by interactions between TMH
2 and TMH 6, whereas in the best BCL model, the core only
contains TMH 2.
DISCUSSION
BCL::Fold has been updated via MP-specific energy potentials
and MC moves to accurately predict MP topology from
sequence. Correct topologies were sampled for 32 of 38 proto-
mer benchmark targets and 9 of 12 multimer benchmark targets.
These results demonstrate the viability of discontinuous TMH
placement to predict MP topology.
BCL::MP-Fold Produces Accurate Models for Targets ofVarying Size, Complexity, and SSE ContentThe BCL::MP-Fold MP algorithm was able to sample the native
topology of PDB ID code 2XUT, a 12 TM, 488-residue protein.
The algorithm failed to predict the correct topology for the two
larger proteins, PDB ID codes 3HFX and 2XQ2, which places
the upper limit for single-subunit predictions at around 500 res-
idues. This is a considerable achievement for de novo MP struc-
ture prediction, as these larger proteins are typically excluded
from benchmark sets. For example, the largest Rosetta-
Membrane target, PDB ID code 1U19, contains 278 residues.
As expected, leveraging oligomeric symmetry greatly extends
the upper limit; the decameric PDB ID code 2BL2 contains
1,450 residues, and the best BCL model has an RMSD100 of
2.8 A to the native.
8 Structure 21, 1–11, July 2, 2013 ª2013 Elsevier Ltd All rights reserv
One of the design goals when developing BCL::Fold was to
facilitate sampling of nonlocal contacts, resulting in more
accurate sampling of proteins of high contact order. For targets
containing less than 400 residues, this is the case (Figure 3A);
BCL::MP-Fold accurately samples native topologies with
normalized contact order (NCO) values ranging from 0.15 to
0.50. For targets larger than 400 residues, this is no longer the
case, with the highest NCO value sampled being 0.23. Thus,
the current algorithm is capable of sampling proteins with a
large number of residues (>400) or a high NCO (>0.25), but not
both. In order to keep sampling relatively rapid, each stage ter-
minates after a maximal number of MC steps—2,000 for each
assembly stage and 4,000 for the refinement stage. Sampling
for these large, complex proteins would likely benefit from
increased MC steps, as stages terminated at the maximum
54% ± 2% of the time for these three proteins (PDB ID codes
2XQ2, 3HFX, and 3GIA), versus 44% ± 7% of the time over the
entire benchmark.
The folding algorithm is also accurate for targets covering a
wide range of SSE content (from 70% to 92%) and SSE predic-
tion accuracy (average Q3 values from 0.60 to 0.90) (Figure 3B).
Not surprisingly, the method fails for PDB ID code 1YEW, which
has the lowest SSE content at 66% and average Q3 value at
0.50 of any protein in the benchmark set. Nonetheless, Figure 3
demonstrates that the BCL::MP-Fold algorithm is robust and
typically able to compensate for inaccuracies in secondary
structure prediction.
BCL::MP-Fold Samples More Native-like TopologiesThan Rosetta-MembraneRosetta is a well-established de novo protein structure predic-
tion method that has performed well during several iterations
of the Critical Assessment of protein Structure Prediction
(Raman et al., 2009). In 2006, themethod was updated to predict
membrane protein structure (Yarov-Yarovoy et al., 2006). In or-
der for a direct comparison between BCL::MP-Fold and Ro-
setta-Membrane, Rosetta 3.4 was used to predict structures
for each of the single-chain proteins in the benchmark set (Fig-
ures 3C and 3D; Table 1). In order to directly compare BCL
and Rosetta models, the RMSD100 values are calculated only
over Ca atoms in native SSEs. The average RMSD100 to native
of the best model sampled by Rosetta-Membrane is 6.6 ±
2.7 A, compared to 5.9 ± 1.8 A for BCL::MP-Fold for those
same proteins. The correct topology (RMSD100 < 8.0 A) was
sampled in 25 out of the 34 cases (74%) by Rosetta-Membrane,
and in 29 cases (85%) by BCL::MP-Fold.
Limitations Include Amphipathic and Bent HelicesBCL::MP-Fold models do not typically accurately represent
amphipathic and bent helices. Amphipathic helices are difficult
to model for two reasons. First, placing the helix parallel to a
TMH maximizes packing and results in a favorable SSE packing
score. In the correct orientation, parallel to the membrane, SSE
packing is reduced and no other component of the consensus
energy function compensates. Second, the TMH alignment po-
tential in the transition region is very similar to that observed in
the membrane core (Figure 1F). TMHs tend to span both the
membrane core and the transition, and thus the bulk of the
counts in the transition region comes from TMHs and not
ed

Figure 3. Accurate Models Are Produced for Targets of Varying Size, Complexity, and SSE Content
(A) NCO versus amino acids. Each point represents the best model produced for a particular target. Single-subunit predictions are represented by circles
and multimer predictions are represented by squares. Both use the following coloring scheme based on RMSD100: RMSD100 < 6.0 A (green),
6.0 A % RMSD100 < 8.0 A (light green), 8.0 A % RMSD100 < 10.0 A (yellow), and 10.0 A % RMSD100 (red). Proteins with multiple chains in the protomer
are excluded because the contact order is undefined. For multimers, the contact order reported is for the protomer, whereas the amino acid count is the total for
the complete multimer.
(B) Q3 versus SSE content. The plotted Q3 value is the average of the JUFO9D and SPOCTOPUS predictions. SSE content is the percentage of residues that are
part of a helix or strand.
(C) RMSD100 of the top 5% of the best models versus amino acids. BCL::MP-Fold is shown as black triangles and Rosetta-Membrane as circles.
(D) RMSD100 was computed for BCL::MP-Fold and Rosetta-Membrane to the SSEs of the native models. The value for the top 1% of models ± SD sampled is
plotted for each method. The dashed lines at 8 A indicate the arbitrary cutoff for ‘‘native-like’’ quality.
Structure
Ways & Means
Please cite this article in press as: Weiner et al., BCL::MP-Fold: Folding Membrane Proteins through Assembly of Transmembrane Helices, Structure(2013), http://dx.doi.org/10.1016/j.str.2013.04.022
amphipathic helices. Thus, placement of a short, amphipathic
helix parallel to a TMH in the transition region minimizes both
the SSE packing and TMH alignment scores. An additional KB
potential specific for amphipathic helices would likely be needed
to accurately predict these helices in future iterations of
BCL::MP-Fold.
The BCL::MP-Fold algorithm starts with an idealized, perfectly
straight, pool of SSEs. There are bending moves during the
simulation that bend the SSEs. Even so, the current algorithm
does not adequately capture the kinks and bends that are
commonly seen in native TMHs. This limitation can be overcome
with increased probabilities for the bending MC moves or more
sophisticated bend moves that perturb several f/c angles
simultaneously by fitting to observed TMH fragments.
Contact Recovery Can Be ImprovedFor soluble protein structure prediction using BCL::Fold,
accurately predicted models tend to have low RMSD100 values
and high contact recovery values (Karakasx et al., 2012). This is
not observed for MP structure prediction, however. When
Struc
CR >20% is considered to be ‘‘native-like,’’ the native conforma-
tion is only sampled in 61% of the single-subunit predictions,
compared to 84% using the RMSD100 < 8.0 A criterion. This
suggests that although the TMHs span the membrane in the
correct places, they are not necessarily rotated correctly, with
normally contact-forming, buried residues instead are solvent
or membrane exposed. This property is due to the MP amino
acid environment potentials, which, consistent with the gener-
ated statistics and the underlying biophysics, are less discrimi-
nating than the soluble potentials. For example, when scoring
a soluble protein, helix rotations that place hydrophobic residues
in the core of the protein will be scored favorably. When scoring
an MP, on the other hand, rotations that bury hydrophobic resi-
dueswould be scored similarly to those rotations that expose the
hydrophobic residues. Addition of a knowledge-based exposure
score would likely improve TMH rotations. This would involve
implementing a method to predict individual residue exposure
(such as solvent-accessible surface area) from sequence in a
manner similar to secondary structure and environment predic-
tion by JUFO9D.
ture 21, 1–11, July 2, 2013 ª2013 Elsevier Ltd All rights reserved 9

Structure
Ways & Means
Please cite this article in press as: Weiner et al., BCL::MP-Fold: Folding Membrane Proteins through Assembly of Transmembrane Helices, Structure(2013), http://dx.doi.org/10.1016/j.str.2013.04.022
Enhanced Accuracy with RestraintsExperimental or predicted restraints can dramatically improve
MP structure prediction accuracy by limiting the potential
conformational space (Barth et al., 2009; Hopf et al., 2012;
Nugent and Jones, 2012b). This should hold for BCL::MP-Fold
as well, because the consensus scoring function is highly
adaptable and can be modified to incorporate restraints. In
fact, BCL::Fold has already been successfully applied to pro-
teins with medium-resolution cryo-electron microscopy data
(Lindert et al., 2009). Efforts are currently under way to incorpo-
rate additional restraint types such as NMR, electron paramag-
netic resonance, small-angle X-ray scattering, and contacts.
EXPERIMENTAL PROCEDURES
MP Databank
A databank of diverse MP structures was created in order to create statistics
for theMP-specific knowledge-based potentials. A subset of known structures
from the PDB was selected using the culling server PISCES (Wang and
Dunbrack, 2005). The following criteria were used to select proteins: sequence
identity less than 25%; resolution of less than 3.0 A; R value of less than 0.3;
and sequence length of at least 40 residues. Only those structures determined
by X-ray crystallography were considered. The final list contained 111 MPs
and 175 chains. PDB_TM (Tusnady et al., 2005) was used to properly orient
each structure into the membrane.
Radius of Gyration
As for soluble proteins (Woetzel et al., 2012), the radius of gyration for MPs is
calculated using the formula
R2gyr =
1
nSn
i =1ðri � rmeanÞ2
and is normalized,
NRgyr =R2
gyr
length:
For MPs, however, the Rgyr term is calculated using a collapsing normal. All
Cb atoms within the membrane core have their z coordinate set to zero. Atoms
outside the membrane core are translated toward the membrane plane by a
distance of 10 A, which corresponds to one-half themembrane core thickness.
Statistics for NRgyr were collected over the MP databank in order to generate
the knowledge-based potential.
Amino Acid Environment
The amino acid environment potential is derived in the samemanner as for sol-
uble proteins (Woetzel et al., 2012). The potential is split into three components
based on environment type: membrane core, transition, and solution. Statis-
tics for the neighbor count for each residue type are then collected for each
of the three environment types in order to generate the separate potentials.
Histogram counts are normalized across membrane regions for each residue
type. If the residue is in a gap region, the score is calculated as a cosine-
weighted average of the two adjacent environments based on the z coordinate
of the Cb atom.
SSE Alignment
Separate potentials are generated for the membrane core, transition, and
soluble environment types. Helical SSEs in the BCL can be represented as
overlapping ideal fragments of five residues (Woetzel et al., 2012). Each frag-
ment is evaluated based on the angle between its main axis and themembrane
plane given the environment type. In a similar manner to the amino acid envi-
ronment potential, fragments in gap regions are scored as a cosine-weighted
average of the two adjacent environments based on the z coordinate of the
center of the fragment. The score for a given SSE is simply the sum of its frag-
ment scores.
10 Structure 21, 1–11, July 2, 2013 ª2013 Elsevier Ltd All rights rese
Membrane Topology
A set of predicted SSEsmaking up the transmembrane domain of the protein is
provided using SPOCTOPUS. The helical transmembrane segments of the
protein are assumed to have an antiparallel topology. During folding, the
current SSEs in the model are matched to the associated transmembrane
SSE expected from prediction. The N-terminal Ca atom coordinates for each
transmembrane helix are put into one of two groups according to which termini
should be on the same side of the membrane. The group is determined by the
SPOCTOPUS-predicted topology. Themembrane center has a z coordinate of
zero, so the side of the membrane a terminus lies on is given by the sign of the
z coordinate. Next, within a group, the coordinates are pairwise compared,
and a penalty is given for every pair of coordinates that reside on opposite
sides of the membrane. This selects for correctly placing N termini that should
be on the same side of the membrane. Last, coordinates are pairwise
compared between groups, and a penalty is given for every pair of coordinates
that reside on the same side of the membrane. This selects for correctly
placing N termini that should be on opposite sides of the membrane. The
above procedure is repeated for C-terminal Ca coordinates to give the final to-
tal penalty score.
Environment Prediction Agreement
The environment prediction agreement is scored analogously to the secondary
structure prediction agreement (Woetzel et al., 2012). Briefly,
EEnvPred =Xi
� erf
�pEnv;i � mEnv
sEnv
�;
where pEnv,i is the probability of the observed environment in the model for res-
idue i, mEnv is the mean probability for an accurately predicted environment
type, and sEnv is the standard deviation for an accurately predicted environ-
ment type.
Benchmark
One thousand models were created for each protein in the benchmark set.
SSE pools were generated using the BCL application BCL::SSEPool (Karakasxet al., 2012). The initial pool was generated using SPOCTOPUS (Viklund et al.,
2008), and the final pool included both SPOCTOPUS and JUFO9D predictions.
Example score weight sets, stage files, and command lines for both
BCL::SSEPool and BCL::MP-Fold can be found in Supplemental Experimental
Procedures.
Availability
BCL::MP-Fold is implemented as part of the BioChemical Library, a suite of
software currently under development in the Meiler laboratory (http://www.
meilerlab.org). BCL software, including BCL::MP-Fold, is freely available for
academic use.
SUPPLEMENTAL INFORMATION
Supplemental Information includes Supplemental Experimental Procedures,
three figures, and one movie and can be found with this article online at
http://dx.doi.org/10.1016/j.str.2013.04.022.
ACKNOWLEDGMENTS
The authors thank Stephanie DeLuca for assistance with Rosetta-Membrane.
We thank the Vanderbilt University Center for Structural Biology computational
support team for hardware and software maintenance. We also thank the
Vanderbilt University Advanced Computing Center for Research and Educa-
tion for computer cluster access and support. Work in the Meiler laboratory
is supported through the NIH (R01 GM080403, R01 MH090192, and R01
GM099842) and NSF (Career 0742762).
Received: February 1, 2013
Revised: April 10, 2013
Accepted: April 25, 2013
Published: May 30, 2013
rved

Structure
Ways & Means
Please cite this article in press as: Weiner et al., BCL::MP-Fold: Folding Membrane Proteins through Assembly of Transmembrane Helices, Structure(2013), http://dx.doi.org/10.1016/j.str.2013.04.022
REFERENCES
Bakheet, T.M., and Doig, A.J. (2009). Properties and identification of human
protein drug targets. Bioinformatics 25, 451–457.
Barth, P., Wallner, B., and Baker, D. (2009). Prediction of membrane protein
structures with complex topologies using limited constraints. Proc. Natl.
Acad. Sci. USA 106, 1409–1414.
Bonneau, R., Ruczinski, I., Tsai, J., and Baker, D. (2002). Contact order and ab
initio protein structure prediction. Protein Sci. 11, 1937–1944.
Bradley, P., Misura, K.M., and Baker, D. (2005). Toward high-resolution de
novo structure prediction for small proteins. Science 309, 1868–1871.
Carugo, O., and Pongor, S. (2001). A normalized root-mean-square distance
for comparing protein three-dimensional structures. Protein Sci. 10, 1470–
1473.
Durham, E., Dorr, B., Woetzel, N., Staritzbichler, R., and Meiler, J. (2009).
Solvent accessible surface area approximations for rapid and accurate protein
structure prediction. J. Mol. Model. 15, 1093–1108.
Dutzler, R., Campbell, E.B., Cadene, M., Chait, B.T., and MacKinnon, R.
(2002). X-ray structure of a ClC chloride channel at 3.0 A reveals the molecular
basis of anion selectivity. Nature 415, 287–294.
Fagerberg, L., Jonasson, K., von Heijne, G., Uhlen,M., and Berglund, L. (2010).
Prediction of the human membrane proteome. Proteomics 10, 1141–1149.
Fu, D., Libson, A., Miercke, L.J., Weitzman, C., Nollert, P., Krucinski, J., and
Stroud, R.M. (2000). Structure of a glycerol-conducting channel and the basis
for its selectivity. Science 290, 481–486.
Hopf, T.A., Colwell, L.J., Sheridan, R., Rost, B., Sander, C., and Marks, D.S.
(2012). Three-dimensional structures of membrane proteins from genomic
sequencing. Cell 149, 1607–1621.
Jones, D.T. (1999). Protein secondary structure prediction based on position-
specific scoring matrices. J. Mol. Biol. 292, 195–202.
Karakasx, M., Woetzel, N., Staritzbichler, R., Alexander, N., Weiner, B.E., and
Meiler, J. (2012). BCL::Fold—de novo prediction of complex and large protein
topologies by assembly of secondary structure elements. PLoS One 7,
e49240.
Kauko, A., Illergard, K., and Elofsson, A. (2008). Coils in themembrane core are
conserved and functionally important. J. Mol. Biol. 380, 170–180.
Lange, O.F., and Baker, D. (2012). Resolution-adapted recombination of struc-
tural features significantly improves sampling in restraint-guided structure
calculation. Proteins 80, 884–895.
Leman, J.K., Mueller, R., Karakas, M., Woetzel, N., and Meiler, J. (2013).
Simultaneous prediction of protein secondary structure and transmembrane
spans. Proteins. Published online January 24, 2013. http://dx.doi.org/10.
1002/prot.24258.
Structu
Lindert, S., Staritzbichler, R., Wotzel, N., Karakasx, M., Stewart, P.L., and
Meiler, J. (2009). EM-Fold: de novo folding of a-helical proteins guided by
intermediate-resolution electron microscopy density maps. Structure 17,
990–1003.
Meiler, J., Muller, M., Zeidler, A., and Schmaschke, F. (2001). Generation and
evaluation of dimension-reduced amino acid parameter representations by
artificial neural networks. J. Mol. Model. 7, 360–369.
Nugent, T., and Jones, D.T. (2012a). Membrane protein structural bioinformat-
ics. J. Struct. Biol. 179, 327–337.
Nugent, T., and Jones, D.T. (2012b). Accurate de novo structure prediction
of large transmembrane protein domains using fragment-assembly and corre-
lated mutation analysis. Proc. Natl. Acad. Sci. USA 109, E1540–E1547.
Oberai, A., Ihm, Y., Kim, S., and Bowie, J.U. (2006). A limited universe of mem-
brane protein families and folds. Protein Sci. 15, 1723–1734.
Raman, S., Vernon, R., Thompson, J., Tyka, M., Sadreyev, R., Pei, J., Kim, D.,
Kellogg, E., DiMaio, F., Lange, O., et al. (2009). Structure prediction for CASP8
with all-atom refinement using Rosetta. Proteins 77(Suppl 9 ), 89–99.
Sanders, C.R., and Sonnichsen, F. (2006). Solution NMR of membrane pro-
teins: practice and challenges. Magn. Reson. Chem. 44(Spec No), S24–S40.
Simons, K.T., Kooperberg, C., Huang, E., and Baker, D. (1997). Assembly of
protein tertiary structures from fragments with similar local sequences using
simulated annealing and Bayesian scoring functions. J. Mol. Biol. 268,
209–225.
Tusnady, G.E., Dosztanyi, Z., and Simon, I. (2005). PDB_TM: selection and
membrane localization of transmembrane proteins in the Protein Data Bank.
Nucleic Acids Res. 33(Database Issue), D275–D278.
Viklund, H., Bernsel, A., Skwark, M., and Elofsson, A. (2008). SPOCTOPUS: a
combined predictor of signal peptides and membrane protein topology.
Bioinformatics 24, 2928–2929.
Wang, G., and Dunbrack, R.L., Jr. (2005). PISCES: recent improvements to a
PDB sequence culling server. Nucleic Acids Res. 33(Web Server Issue),
W94–W98.
Ward, A., Reyes, C.L., Yu, J., Roth, C.B., and Chang, G. (2007). Flexibility in the
ABC transporter MsbA: alternating access with a twist. Proc. Natl. Acad. Sci.
USA 104, 19005–19010.
Whorton, M.R., and MacKinnon, R. (2011). Crystal structure of the mammalian
GIRK2 K+ channel and gating regulation by G proteins, PIP2, and sodium. Cell
147, 199–208.
Woetzel, N., Karakasx, M., Staritzbichler, R., Muller, R., Weiner, B.E., and
Meiler, J. (2012). BCL::Score—knowledge based energy potentials for ranking
protein models represented by idealized secondary structure elements. PLoS
One 7, e49242.
Yarov-Yarovoy, V., Schonbrun, J., and Baker, D. (2006). Multipass membrane
protein structure prediction using Rosetta. Proteins 62, 1010–1025.
re 21, 1–11, July 2, 2013 ª2013 Elsevier Ltd All rights reserved 11