BC’s Forest Sector: Biorefineries, Bioenergy & Climate Change · Bioenergy & Climate Change W.E....
41
Forest Products Biotechnology at UBC BC’s Forest Sector: Biorefineries, Bioenergy & Climate Change W.E. Mabee, J.N. Saddler Forest Products Biotechnology, Department of Wood Science Faculty of Forestry, University of British Columbia 2424 Main Mall, Vancouver, BC, Canada V6T 1Z4 [email protected] Forestry Climate Action Meeting February 15, 2008 Prince George, BC
Transcript of BC’s Forest Sector: Biorefineries, Bioenergy & Climate Change · Bioenergy & Climate Change W.E....

Forest Products Biotechnology at UBC
BC’s Forest Sector:Biorefineries, Bioenergy & Climate Change
W.E. Mabee, J.N. SaddlerForest Products Biotechnology, Department of Wood ScienceFaculty of Forestry, University of British Columbia2424 Main Mall, Vancouver, BC, Canada V6T 1Z4
Forestry Climate Action MeetingFebruary 15, 2008Prince George, BC

Forest Products Biotechnology at UBC

Forest Products Biotechnology at UBC
“I love working
with wood!”

Forest Products Biotechnology at UBC
Wood productsA wood-built house has a lower environmental impact than steel or concrete – less energy, pollution, and GHG emissions
A typical house can sequester 28 metric tonnes of CO2-e
Trends in the forest industry include:– A shift towards ‘next generation’ building solutions– New paper products – ‘nano’ robot components, power storage,
bioreactive paper– Nano-crystalline cellulose for application in new biomaterials– Energy and chemicals from forest-based residuals
The biorefinery concept is being researched around the world

Forest Products Biotechnology at UBC
Looking back and forward…17
00
1740
1780
1820
1860
1900
1920
1940
1960
1980
2000
2020
2040
2060
2080
2100
Hydrocarboneconomy1800-2050
Industrial revolution
Carbohydrateeconomy1990-21??
Biomass & renewables
Oil & GasCoal
Carbohydrateeconomy
??-1800
Agricultural-based
log (primary energy use) by category

Forest Products Biotechnology at UBC
Agricultural biorefinery
Cleaning
WET MILLING DRY MILLING
Steeping
Milling
Washing
Starch
Gluten Sep.
Hydrolysis
Fermentation
Yeast Recycle
Distillation
Cleaning
Milling
Hydrolysis
Fermentation
DistillationEthanol recovery
Starch
CORN
Centrifuge
Distillers Dried Grains (DDG)
Syrup
Distillers WetGrains (DWG)
Syrup,Sweetner
CO2
Yeast
CO2
Gluten
Fibre
Germ
Corn oil

Forest Products Biotechnology at UBC
Biorefining PlatformsBIOMASS
BIOENERGY
BIOFUELS
BIOPRODUCTS
ThermochemicalPlatforms
BiologicalPlatforms
TraditionalPlatforms

Forest Products Biotechnology at UBC
Traditional platforms
Impregnation
SULPHITE PULPINGCHEMI-MECHANICAL
(BCTMP) PULPING
Pulping
Washing
Bleaching
Drying
Papermaking
Paper
WOOD
Sulphite Liquor Recovery
Cycle
Pulp40-55% Yield
Lignosulphonates
Impregnation
Refining
Washing
Pulp70-85% Yield
Spent SulphiteLiquor
Silvichemicals
Energy
KRAFT PULPING
Impregnation
Pulping
Washing
Black Liquor Recovery
Cycle
Energy Pulp48-60% Yield

Forest Products Biotechnology at UBC
Thermochemical platformThis platform:
Employs an engineering approach similar to petroleum refineries
Integrates production of higher value chemicals and commodities, as well as fuels and energy
Is well suited to the production of energy, bio-oil, specialty chemicals, etc.
BIOMASS
Fast pyrolysis(Primary processing)
Secondaryprocessing
Tertiaryprocessing
Energy
Commodities
Fuels & Chemicals

Forest Products Biotechnology at UBC
Oil refinery
0
5
10
15
20
25
1950 1960 1970 1980 1990 2000
Oil Demand by Sector(million barrels per day)
Transportation
Industrial
ElectricityRes'l/Comm'l
Traditional oil refining:
~68-70% transportation sector (i.e. gasoline, diesel)
~21% industrial processing
~5% ind. plastics, chemicals(over 2,000 refinery products)
~4% residential/ commercial heating
<3% electricity generation
Source: (1) EIA. 2005. Annual Energy Review. US oil demand by end-use sector. http://www.eia.doe.gov/pub/oil_gas/petroleum/analysis_publications/oil_market_basics/Dem_image_US_cons_sector.htm
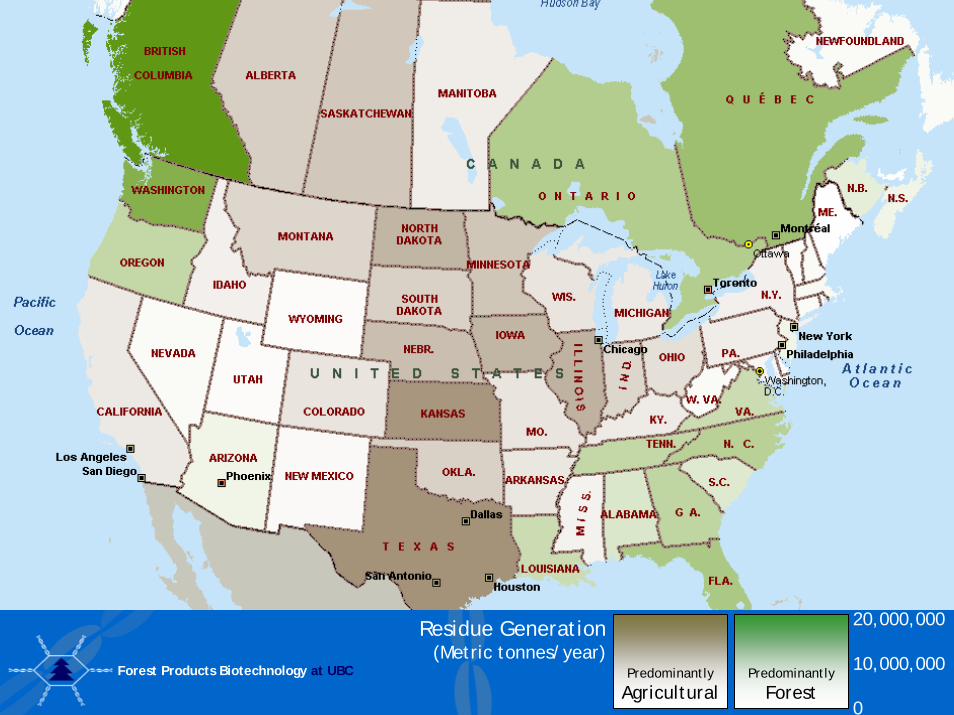
Forest Products Biotechnology at UBC Predominantly
Forest
20,000,000
10,000,000
0
Residue Generation(Metric tonnes/year)
Predominantly
Agricultural

Forest Products Biotechnology at UBC

Forest Products Biotechnology at UBC

Forest Products Biotechnology at UBC

Forest Products Biotechnology at UBC

Forest Products Biotechnology at UBC
0
2
4
6
8
10
12
14
16
1994
1995
1996
1997
1998
1999
2000
2001
2002
2003
2004
2005
2005: 15 million ha dead & dying
million ha
Cumulative impacts - areaD
enm
ark
5 m
illio
n ha
Port
ugal
10 m
illio
n ha
Sources: 1) Council of Forest Industries 2005.

Forest Products Biotechnology at UBC
Oil & World Events
$0
$10
$20
$30
$40
$50
$60
$70
$80
$90
$100
1997
1998
1999
2000
2001
2002
2003
2004
2005
2006
2007
Kyoto
Protocol10 Dec 1997
Y2K 9-11 Venezuala
Oil StrikeDec 2002
- Feb 2003Iraq War20 Mar 2003 >
(US$/barrel West Texas Crude Oil)
Hurricane Katrina29 Aug 2005
Sources: (1) WorldOil.Com. 2004,2005, 2006.

Forest Products Biotechnology at UBC
Bioethanol worldwide
0
10
20
30
40
50
6019
80
1985
1990
1995
2000
2005
Others India China EU US&Can Brazil
Production capacity (billion litres per annum)

Forest Products Biotechnology at UBC
Sugar-to-ethanol
0
100
200
300
400
500
1975 1985 1995 2005
Sugarcane production by product (million metric tonnes)
Sugar
Ethanol
Sources: (1) FAOStat 2006; www.fao.org(2) Bolling, C. and Suarez, N.R. (2001). USDA/ERS – SSS-232.
SUGAR
Pretreatment
Fractionation
Fermentation
Recovery
Hexoses

Forest Products Biotechnology at UBC
SUGAR
Starch-to-ethanol
0
100
200
300
1980 1990 2000
Corn production by product (million metric tonnes)
Animal Feed
Ethanol
Food, Bioproducts
Trade
Residual
STARCH
Pretreatment
Fractionation
Fermentation
Recovery
EnzymaticHydrolysis
Hexoses

Forest Products Biotechnology at UBC
LIGNOCELLULOSE
Pretreatment
Fractionation
Fermentation
Recovery
EnzymaticHydrolysis
Biological platform
PentosesHexoses
Lign
in
Cell
ulos
e
Hem
icel
lulo
se
Extr
acti
ves
BIOFUELS BIOENERGY
BIOPRODUCTS
This platform:
Uses enzymes andmicroorganisms
Builds on the sugar-and starch-based industries
Is well suited to biofuel and bioproduct lines

Forest Products Biotechnology at UBC
BiorefineryCompany
Bulk polymers:Polylactide (PLA), 3-hydroxypropionic acid, 1,3-propanediol, etc.
NatureWorks, DuPont, Cargill
BIOLO
GICA
L
Nutraceuticals:xylitol, arabitol, etc.
Codexis
Platform chemicals:Glycerol, furfural, levulinic acid, succinic acid, etc.
DuPont
Biofuels:ethanol, bio-hydrogen, etc.
Iogen, Abengoa
Biofuels:bio-oil, methanol, ethanol, Fischer-Tropsch, BTL, etc.
Choren
Bioenergy:electricity, steam, combined heat & power (cogen), district heating, wood pellets, etc.
Williams LakeBioenergy Facility
THERM
OCH
EMICA
L

Forest Products Biotechnology at UBC
Role of RD&D

Forest Products Biotechnology at UBC
US Biofuel RD&DDepartment of Energy Biomass Program:
Research Centres (3): $375 MLarge-scale ethanol demonstration (6): $385 MDemonstration-scale biorefineries (4): $114 MDemonstration-scale biorefineries (6): $ 86 M
BP Energy Biosciences InstituteHeadquartered at UC Berkeley (10 yr funds): $500 M

Forest Products Biotechnology at UBC
Cellulosic ethanol I
Iogen ($80 M)(Enzyme)
Bluefire ($40 M)(Acid)
Poet ($80 M)(Enzyme)
Abengoa ($76 M)(Enzyme / Thermochem)
Range ($76 M)(Thermochem)
Alico ($33 M)(Thermochem)
Large-scale ethanol demonstration ($385 M)

Forest Products Biotechnology at UBC
Cellulosic ethanol II
Pacific Ethanol ($24.3 M)(BioGasol Process)
Lignol ($30 M)(Organosolv Pretreat)
Stora Enso ($30 M)(Fischer-Tropsch fuel)
ICM Inc. ($30 M)(Biochem / Thermochem)
Demonstration-scale biorefineries ($114 M)

Forest Products Biotechnology at UBC
Structure of Cellulose

Forest Products Biotechnology at UBC
Elementary Fibril~3nm d, 60 nm l
CBH I from T. reesei
2.09nm d, 18 nm l
Microfibril~25nm d
Macrofibril ~500nm diameter
S2 Layer of fiber wall~1700-3700nm
Source: (1) Mansfield et al. 2000.
Levels of fiber organization

Forest Products Biotechnology at UBC
Future Projection of Ethanol Cost from Lignocellulosic Biomass
0
20
40
60
80
100
120
140
160
180
200
2000 2002 2004 2006 2008 2010 2012 2014 2016 2018 2020
(¢ per litre, CDN currency - 2002 dollars)
2005 DOE targetsModified targets – President’s Initiative
2004 projection – uses lower feedstock costs
Sources: (1) Perlack, R. 2006. (2) Fulton, L. International Energy Agency, Paris. Biofuels for Transport: An International Perspective. Talk for TRB 2004
2020 Projections $USD/gal $CDN/litre
’06 President’s Initiative $0.66 $0.19
’05 DOE Targets $1.05 $0.31
’04 Projection $0.62 $0.18

Forest Products Biotechnology at UBC
Sweden
Lund
Norrköping
Stockholm
Örnsköldsvik
GothenburgBorås
Karlstad
Chalmers University
Borås College of Engineering
Lund UniversityNational Facility for Process Development
Karlstad University
Bioalcohol Foundation (BAFF)Mid-Sweden University
ETEK Etanolteknik (Pilot Facility)SEKAB
STFIIVL (Life Cycle Analysis)
Agroetanol
BioFuel Region

Forest Products Biotechnology at UBC
Sweden - bioenergy
0%
5%
10%
15%
20%
25%
30%
1970 1980 1990 2000 2005
Major bioenergy uses includeCombined heat and powerDistrict heatingBiogas production for fuelBiogas train (Linkoping to Vastervik)Biogas, biodiesel busesBioethanol cars, buses

Forest Products Biotechnology at UBC
BC Bioenergy NetworkDemonstration is the Network’s primary goal
1-3 demonstration projects operational by Year 5
Potential sites:– Prince George– Quesnel– Fort St. James– Okanagan Valley– Fraser Valley– North Vancouver Is.– Haida Gwaii

Forest Products Biotechnology at UBC
BC Bioenergy NetworkThe goals of the BC Bioenergy Network are to:
Combine strengths of BC Universities, government and industry
Support and implement the BC Bioenergy Strategy
Meet BC’s goals for greenhouse gas emission reduction
Catalyze both traditional forest industry and technology companies within BC
Encourage foreign investment (DuPont, Dow, Chevron, etc.)
Strengthen BC’s economy, particularly in resource-dependent communities
Build on international partnerships

Forest Products Biotechnology at UBC
BC Bioenergy NetworkThe BC Bioenergy Network will catalyze activities as
shown below:
Fundamental Research 20%
Applied Research& Development 30%
Demonstration 50%
Forest Products Biotechnology at UBC
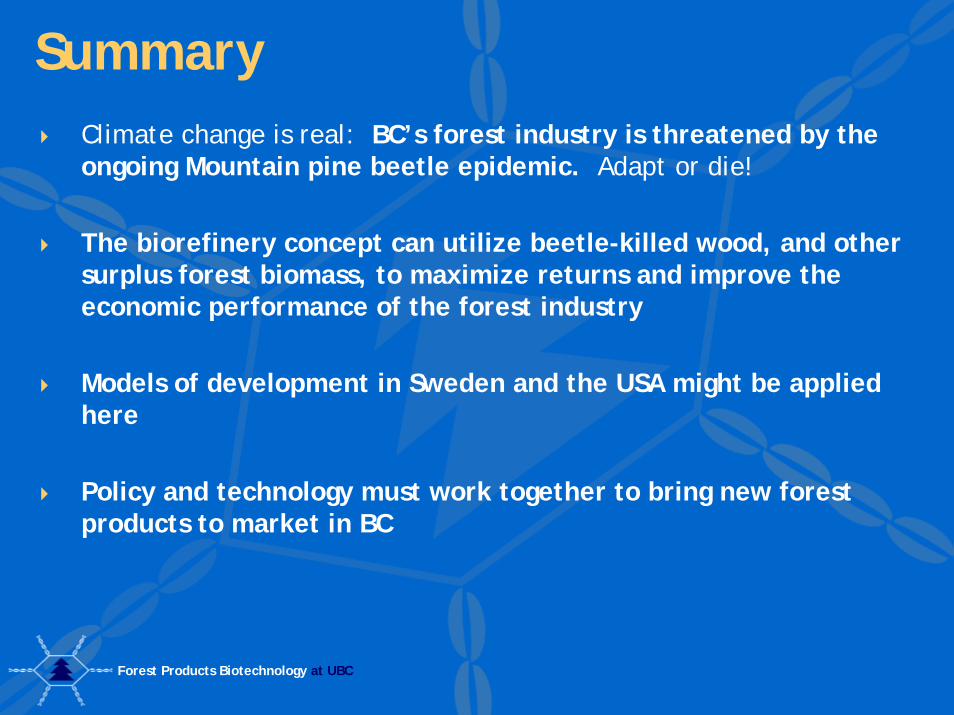
SummaryClimate change is real: BC’s forest industry is threatened by the ongoing Mountain pine beetle epidemic. Adapt or die!
The biorefinery concept can utilize beetle-killed wood, and other surplus forest biomass, to maximize returns and improve the economic performance of the forest industry
Models of development in Sweden and the USA might be applied here
Policy and technology must work together to bring new forest products to market in BC

Forest Products Biotechnology at UBC
BC could be the next DenmarkAbout 20% of electricity in Denmark from wind90% of wind turbines made in Denmark installed offshore50% of all wind turbines globally made in Denmark
Global wind power: ~75,000 MW (15,000 MW installed in 2006)Value about €1.2 million per MW (about $1.9 million CDN)

Forest Products Biotechnology at UBC
AcknowledgementsIEA Bioenergy Task 39 Natural Resources CanadaNSERC
Forest Products Biotechnology Colleagues and collaborators
Questions?

Forest Products Biotechnology at UBC

Forest Products Biotechnology at UBC

Forest Products Biotechnology at UBC
Mill CostsKraft Paper mills – 800-900,000 tonnes/a
Often in the range of $1-1.5 billion in capitalOperating costs about $50-$100 per air-dried tonne, plus feedstock; about $17.5-25 million/a – ~ 2% of capital
Lignocellulosic ethanol plants – 100 million litres/aMay be in the range of $350-450 million in capitalOperating costs about $15-20 million per year, plus feedstocks - ~5% of capital

Forest Products Biotechnology at UBC
Kraft Pulp$US - 1995-2005, Forecast to 2010
$0
$100
$200
$300
$400
$500
$600
$700
$800
1995 1996 1997 1998 1999 2000 2001 2002 2003 2004 2005 2006 2007 2008 2009 2010
(Potential returns, $US/dry tonne biomass)
NBSK returns, highest yields, historic and projected (based on 30 year trends)
Ethanol returns, increasing yields historic and projected
Sources: (1) Statistics Canada 2005.