BC Election May 2013 Thank You Supporters & BC Voters BC Transportation BC Industry BC Business

2016 BRITISH COLUMBIA INTERNATIONAL EDUCATION INTELLIGENCE REPORT
The Illuminate Consulting Group June 2016

This report is being made available by the Illuminate Consulting Group (ICG) to international education
stakeholders in British Columbia.
The report was released at the 2016 BCCIE Summer Seminar in Victoria on 20 June 2016.
Electronic copies of the report are available through
BCCIE and ICG under www.illuminategroup.com.

2016 British Columbia International Education Intelligence Report
ICG
1
IMPRINT ICG Contact Information
The Illuminate Consulting Group, LLC Post Office Box 262 San Carlos, CA 94070 USA Phone +1 (619) 295 9600 Fax +1 (650) 860 6109 E-mail [email protected] Web www.illuminategroup.com
Report Team
Team: Dr. Daniel J. Guhr, Nelson D. Furtado, Anjali J. Vyas. Legal Disclaimer
The views expressed in this report are those of the authors alone. They do not necessarily reflect the views of the institutions, organizations, or individuals covered in this report. While ICG endeavors to provide reliable analysis and believes the information presented is accurate, ICG is not liable for errors and omissions, and will not be liable for any party acting on such information.
Release Note and Copyright
Released by the Illuminate Consulting Group in June 2016 as report 14/2016. © ICG, 2016. All rights reserved.

2016 British Columbia International Education Intelligence Report
ICG
2
TABLE OF CONTENTS Table of Contents 2 Introduction 3 Global Student Mobility Trends 4 International Students in British Columbia 6 Perspectives on British Columbia’s Recruiting Markets 9 Student Decision Drivers: Cost 12 Student Decision Drivers: Ranking 16 Student Decision Drivers: Social Media Presence 18 Competitiveness Driver: Pathways 24 Outlook: British Columbia in 2018 26

2016 British Columbia International Education Intelligence Report
ICG
3
INTRODUCTION
ICG is pleased to share the second British Columbia International Education Intelligence Report with education providers, associations, government ministries, and other international education stakeholders in British Columbia. This 2016 release follows the initial 2014 release. Both reports are available free of charge from either BCCIE or ICG. The report encompasses select research on and analysis of salient international education trends ICG has undertaken on behalf of clients in British Columbia and beyond. Trends commented on stretch from global mobility trends to drivers influencing prospective student decisions. The report closes with an outlook on the competitiveness of British Columbia and potential change dynamics unfolding in coming years. ICG would like to extend its gratitude to the British Columbia Council of International Education (BCCIE), and specifically to its Executive Director, Dr. Randall Martin, as well as its staff members, for facilitating the release of this report at the 2016 BCCIE Summer Seminar in Victoria. ICG would also like to acknowledge the cooperation of the BC Ministry of Advanced Education (AVED) and Immigration, Refugees and Citizenship Canada (IRCC) regarding data availability. Please note that this report contains student data that has been made publicly available by its respective owners. In general, this means that data covers periods until 2014 or 2015. Benchmark data provided by ICG reflects 2016 data. We look forward to sharing more of our research at the 2016 BCCIE Summer Seminar and invite you to pass on this report to your colleagues. Yours sincerely, Dr. Daniel J. Guhr Managing Director

2016 British Columbia International Education Intelligence Report
ICG
4
GLOBAL STUDENT MOBILITY TRENDS
International Students Studying in Select Destination Countries International student mobility has increased for multiple decades. In 2015, about five million students enrolled in tertiary education outside their home countries – up from three million in 2005 (OECD and ICG estimate). Six leading destination countries enrolling nearly 2.5 million higher education international students are displayed in the graph below – all grew notably with Canada more than quadrupling enrollments.
International Higher Education Student Enrollment in Select Destination Countries (2000-15)
Notes: Australian methodology revised between 2001 and 2002. UK methodology revised between 2007 and 2008. New Zealand enrollment for 2015 was estimated. France and China excluded owing to data definition and consistency issues. Both countries likely enrolled more than 300,000 international students in 2015. Source: AEI, IRCC, DAAD-DZHW, HESA, IIE, NZ MoE.
The below graph highlights the differences in year-over-year growth rates. After 2009, previous years’ volatility started to subside driven by larger, more stable enrollment pools. Data for Canada especially shows a stable growth trend from 2009 to 2014, with 2015 marking the beginning of a period of slowing growth.
International Higher Education Students in Select Destination Countries (Year-over-Year Growth Rates)
Source: AEI, IRCC, DAAD-DZHW, HESA, IIE, NZ MoE.
0
200,000
400,000
600,000
800,000
1,000,000
1,200,000
2000 2003 2006 2009 2012 2015
U.S.
UK
Germany
Canada
Australia
New Zealand
-25%-20%-15%-10%-5%0%5%
10%15%20%25%
2001 2003 2005 2007 2009 2011 2013 2015
New Zealand
U.S.
Australia
Canada
Germany
UK

2016 British Columbia International Education Intelligence Report
ICG
5
International Students in Canada1 In 2014, more than 336,000 long-term international students studied in Canada (all sectors). Nearly 29 percent of these students (96,785) pursued their education in BC, which hosts the second-largest international student population in Canada, second only to Ontario with around 43 percent share. Quebec was third with a share of just over 14 percent.
International Student Enrollment Canada by Province, All Sectors (2004-14)
Notes: Northwest Territories, Nunavut, and Yukon not displayed. Source: IRCC.
More than 46 percent of long-term international students in Canada are enrolled at universities. The “other post-secondary” sector (i.e., non-university/trade studies in colleges, private training, and certain language institutions) experienced the strongest growth dynamic, more than quintupling since 2004. However, it must be noted that IRCC reclassified 2014 sectoral data; some of the “other post-secondary” enrollment can be assumed to historically “belong” to the university sector. International Student Enrollment in Canada by Sector (2004-14)
Notes: Based on levels of study as defined by IRCC Source: IRCC.
1 Please note: Only international student data publicly released by IRCC are discussed (data as of May
2016). The following analysis uses data on “international student study permit holders with valid study permits”. This encompasses temporary residents who have been issued a study permit (required for any program of study of six months or more) and are in Canada principally to study.
0
50,000
100,000
150,000
200,000
250,000
300,000
350,000
2004 2005 2006 2007 2008 2009 2010 2011 2012 2013 2014
P.E.I.NewfoundlandNew BrunswickSaskatchewanManitobaNova ScotiaAlbertaQuebecBritish ColumbiaOntario
020,00040,00060,00080,000
100,000120,000140,000160,000180,000
2004 2005 2006 2007 2008 2009 2010 2011 2012 2013 2014
University
Other post-secondary
Secondaryor less
Other

2016 British Columbia International Education Intelligence Report
ICG
6
INTERNATIONAL STUDENTS IN BRITISH COLUMBIA
Overview According to AVED, more than 114,000 international students studied in BC in the 2013/14 academic year (including short-term students not on study permits). IRCC data show that the number of long-term international students studying in BC increased by around 104 percent between 2004 and 2014, from 47,513 to 96,785. Increasing enrollment of Chinese students fueled much of this growth: Their share of international students in BC rose from more than 24 percent in 2004 to close to 45 percent in 2014. All other countries enrolled fewer than 10,000 students to BC, with India rising notably and South Korea having lost nearly half of its enrollment since 2007.
International Students in BC by Top Ten Source Countries, All Sectors (2004-14)
Source: IRCC.
Similarly to other Canadian provinces, the university sector accounts for the largest share of international students in BC at nearly 40 percent. However, BC’s K-12 sector attracted an outsized number of international students – nearly 39 percent of international K-12 students in Canada were enrolled in BC in 2014. In line with national trends, the “other post-secondary” sector grew as well. Please note that data for this sector in BC is subject to the mentioned 2014 IRCC reclassification. International Student Enrollment in BC by Sector (2004-14)
Source: IRCC.
05,000
10,00015,00020,00025,00030,00035,00040,00045,000
2004 2005 2006 2007 2008 2009 2010 2011 2012 2013 2014
ChinaSouth KoreaIndiaJapanUnited StatesSaudi ArabiaBrazilMexicoTaiwanVietnam
05,000
10,00015,00020,00025,00030,00035,00040,00045,000
2004 2005 2006 2007 2008 2009 2010 2011 2012 2013 2014
University
Other post-secondary
Secondary orless
Other

2016 British Columbia International Education Intelligence Report
ICG
7
K-12 Sector The performance of BC’s K-12 sector in recent years is largely driven by recruitment success in China – enrollments increased 43-fold since 2004 and accounted for close to 46 percent of all enrollments in 2014. Conversely, the enrollment of South Korean students has continuously declined since 2006. Diversification is a concern given that no other sending country appears poised for future strong enrollment growth that could provide an enrollment balance.
International Students in British Columbia, Secondary or Less (2004-14)
Notes: Top 10 source countries shown. Source: IRCC.
University Sector
At 38,332 students, the university sector accounted for nearly 40 percent of all international students in BC in 2014. China has become the dominant source country, accounting for more than half of all enrollments in 2014. Only four other countries send more than 1,000 students to BC: The U.S., India, South Korea, and Saudi Arabia (in order). With the exception of India, enrollments from these countries have declined since 2011. Again, please note the 2014 IRCC reclassification. Based on AVED data, the majority of international students at BC universities study at the undergraduate level. International Students in British Columbia, University Sector (2004-14)
Notes: Top 10 source countries shown. Source: IRCC.
01,0002,0003,0004,0005,0006,0007,0008,0009,000
10,000
2004 2005 2006 2007 2008 2009 2010 2011 2012 2013 2014
ChinaSouth KoreaJapanMexicoGermanyBrazilHong KongTaiwanVietnamUnited States
0
5,000
10,000
15,000
20,000
25,000
2004 2005 2006 2007 2008 2009 2010 2011 2012 2013 2014
ChinaUnited StatesIndiaSouth KoreaSaudi ArabiaJapanIranTaiwanNigeriaHong Kong

2016 British Columbia International Education Intelligence Report
ICG
8
Colleges and Institutes Sector
BC’s colleges and institutes are represented by IRCC data on students in the “other post-secondary” category. Data for 2014 includes students enrolled in programs that previously were classified as university sector programs. Overall trends remained similar regardless. Enrollments from China increased notably, partially driven by eventual university transfer opportunities. The enrollment pool of Indian students also grew notably, while enrollments from South Korea more than halved.
International Students in British Columbia, Other Post-Secondary (2004-14)
Notes: IRCC data does not disaggregate College-level students. These are included in the “Other post-secondary” category. Source: IRCC.
Language Schools Sector
Data from Languages Canada (LC) data indicates that more than 50,000 international students were enrolled at LC member institutions in BC in 2015. Japan, Brazil, and then South Korea accounted for more than half of enrollments. Outside the Top 3, the combined enrollments of the other leading sending countries dropped by more than 5,000 students, though some of this decline also reflects changes in LC membership over time. International Students in BC Language Programs (2009-15)
Notes: Includes only students in Languages Canada member programs. Decrease in 2013 partially owing to a change in Languages Canada membership in BC. Source: Languages Canada.
0
2,000
4,000
6,000
8,000
10,000
12,000
14,000
2004 2005 2006 2007 2008 2009 2010 2011 2012 2013 2014
ChinaIndiaSouth KoreaJapanSaudi ArabiaBrazilVietnamTaiwanMexicoUnited States
0
2,000
4,000
6,000
8,000
10,000
12,000
2009 2010 2011 2012 2013 2014 2015
JapanBrazilSouth KoreaChinaMexicoSaudi ArabiaTaiwanCanadaSwitzerlandColombia

2016 British Columbia International Education Intelligence Report
ICG
9
PERSPECTIVES ON BRITISH COLUMBIA’S RECRUITING MARKETS
Overview The recruitment of international students into British Columbia does not occur in a vacuum. BC’s leading international student source countries also send many students to other major education destinations. This section compares international higher education student enrollment from China, India, the United States, South Korea, and Japan in the following destination countries: Canada, Australia, Germany, New Zealand, the United States, and the UK. These comparisons are provided to highlight BC’s competitive position in some of its key recruitment markets. Additionally, they serve to offer a broader view of trends in student flows from these source countries. Note that for the purpose of these comparisons, international higher education students in Canada are taken as the sum of students in the “university” and “other post-secondary” levels of study in IRCC data. This figure is used for better comparability with international student data from other leading destination countries. Several of these countries do not consistently publish data on international students at primary and/or secondary education levels, therefore these cannot be compared.
China
In 2016, China’s Ministry of Education reported that 523,700 Chinese students studied abroad in 2015. Moreover, the dominant majority (around 90 percent) of Chinese students currently studying abroad are self-funded. The U.S. witnessed a significant increase in Chinese enrollment since 2006. Growth from China slowed in the UK in recent years while New Zealand experienced early success, but failed to maintain this enrollment and now hosts fewer Chinese students than it did in 2006. In the past few years, Australia recovered from a period of slow/negative growth between 2010 and 2013. Canada has exhibited a sustained growth trajectory since 2006.
International Higher Education Students from China in Select Countries (2006-15)
Notes: For countries marked with an asterisk (*), data refer to students enrolled in higher education only. Source: AEI, IRCC, DAAD-DZHW, HESA, IIE, NZ MoE.
0
50,000
100,000
150,000
200,000
250,000
300,000
350,000
2006 2007 2008 2009 2010 2011 2012 2013 2014 2015
United States*
Australia
Canada
United Kingdom*
Germany*
New Zealand

2016 British Columbia International Education Intelligence Report
ICG
10
India Indian students are known for a return-on-investment driven decision-making approach and typically are interested in work and immigration opportunities. For example, the number of Indian students in the UK halved from 2011 and 2013 following the effective closure of the post-study work visa route. The number of students in Australia declined markedly for similar reasons. Canada experienced strong enrollment growth after 2008, driven by the Student Partners Program.
International Students from India in Select Countries (2006-15)
Notes: For countries marked with an asterisk (*), data refer to students enrolled in higher education only. Source: AEI, IRCC, DAAD-DZHW, HESA, IIE, NZ MoE.
United States
The United Kingdom continues to be the most popular international study destination for American students. Germany has enjoyed a doubling of U.S. enrollment, partially owing to its no-tuition fees value proposition. Canada remains a popular destination for American students – albeit with no growth occurring – while Australia has experienced an overall deterioration of U.S. enrollment. The U.S. remains an underexploited market for Canadian as well as BC higher education institutions, especially given the success of UK institutions. International Students from the U.S. in Select Countries (2006-15)
Notes: For countries marked with an asterisk (*), data refer to students enrolled in higher education only. Source: AEI, IRCC, DAAD-DZHW, HESA, IIE, NZ MoE.
0
20,000
40,000
60,000
80,000
100,000
120,000
140,000
2006 2007 2008 2009 2010 2011 2012 2013 2014 2015
United States*
Australia
Canada
United Kingdom*
New Zealand
Germany*
02,0004,0006,0008,000
10,00012,00014,00016,00018,000
2006 2007 2008 2009 2010 2011 2012 2013 2014 2015
United Kingdom*
Canada
Australia
Germany*
New Zealand

2016 British Columbia International Education Intelligence Report
ICG
11
South Korea Domestic demographic pressures are resulting in decreasing South Korean enrollments in most leading international student destination countries. Among major destination countries discussed below, only the U.S. enrolled more South Korean Students in 2016 than in 2006 though the trend is clearly negative. Enrollments in Australia, Canada, and New Zealand all declined. It is suggested that South Korea should be treated mostly as a maintenance market.
International Students from South Korea in Select Countries (2006-15)
Notes: For countries marked with an asterisk (*), data refer to students enrolled in higher education only. Source: AEI, IRCC, DAAD-DZHW, HESA, IIE, NZ MoE.
Japan
Similar to South Korea, Japanese outbound mobility has been in steep decline. For example, the U.S. hosted less than half as many Japanese students in 2015 as it did in 2006. However, the Japanese government is aiming to double the number of its students abroad to 120,000 in 2020. Already, Australia, Canada, Germany, and New Zealand have experienced increasing Japanese enrollment since 2011. BC institutions should thus benefit from maintaining or bolstering existing recruitment relationships in Japan. International Students from Japan in Select Destination Countries (2006-15)
Notes: For countries marked with an asterisk (*), data refer to students enrolled in higher education only. Source: AEI, IRCC, DAAD-DZHW, HESA, IIE, NZ MoE.
0
10,000
20,000
30,000
40,000
50,000
60,000
70,000
80,000
2006 2007 2008 2009 2010 2011 2012 2013 2014 2015
United States*
Australia
Canada
New Zealand
Germany*
United Kingdom*
0
5,000
10,000
15,000
20,000
25,000
30,000
35,000
40,000
2006 2007 2008 2009 2010 2011 2012 2013 2014 2015
United States*
Australia
New Zealand
Canada
United Kingdom*
Germany*

2016 British Columbia International Education Intelligence Report
ICG
12
STUDENT DECISION DRIVERS: COST
Overview It is estimated that international higher education students around the world spent more than CAD 70 billion on the cost of tuition fees alone (ICG, 2015). The total cost for these students to pursue an international education has increased notably over the last two decades. At the upper range, an international student may be required to invest more than CAD 300,000 in fees and living expenses to acquire an undergraduate degree (for example, from a private U.S. university such as Columbia or NYU). The continued popularity of high cost destinations (e.g., the United States and Australia) among international students indicates that cost as such constitutes only one of many decision drivers for students. International students have proven to be willing to accept high cost if they believe their degree will provide significant value in return. In the increasingly competitive student recruitment landscape, institutions must thus be mindful of their cost position relative to their peers/competitors, and of their respective value proposition.
International Student Tuition Fees at BC Post-Secondary Institutions
The graph below compares annual international student tuition fees in 2016 for Bachelor of Business Administration (BBA) programs at BC colleges and universities. The BBA is used as an example due to its wide availability and popularity among international students. Annual program fees at institutions offering the program in BC range widely, from less than CAD 10,000 to nearly CAD 37,000. Colleges generally charge less than universities – the average annual fee at displayed colleges is CAD 13,122, compared to an average annual fee of CAD 20,230 at universities. Langara’s pricing is a function of its focus on university transfer pathways, especially to UBC.
International Tuition Fees: Bachelor of Business Administration (CAD) (2016)
Notes: Colleges are displayed in orange. Universities are displayed in blue. Source: Institutions.
0 5,000 10,000 15,000 20,000 25,000 30,000 35,000 40,000University of British Columbia
Simon Fraser UniversityUniversity of Victoria
Royal Roads UniversityUniversity of Northern British Columbia
Capilano UniversityLangara College
Thompson Rivers UniversityKwantlen Polytechnic University
University of the Fraser ValleyCamosun College
Vancouver Island UniversityNorth Island College
Douglas CollegeOkanagan College
College of the Rockies

2016 British Columbia International Education Intelligence Report
ICG
13
Perspectives from ICG’s International Tuition-based Competition Database The following analysis is based on benchmarking data from ICG’s International Tuition-based Competition Database (ITBCD). ITBCD includes benchmarking data on international student tuition fees and living expenses for more than 12,000 individually benchmarked programs across more than 200 institutions, including internationally-ranked research universities (the majority of programs), art and design institutions (more than 600 programs), and a selection of college-level institutions. The analysis presented herein focuses on benchmarking of costs at 35 universities across seven countries, as summarized below:
Country Universities Canada Carleton University, Dalhousie University, Laval University, McGill University,
McMaster University, Memorial University of Newfoundland, Queen’s University, Simon Fraser University, University of Alberta, University of British Columbia, University of Calgary, University of Guelph, University of Manitoba, University of Montreal, University of New Brunswick, University of Ottawa, University of Saskatchewan, University of Toronto, University of Victoria, University of Waterloo, Western University, York University
Australia Griffith University, Macquarie University, Monash University Germany Humboldt University of Berlin Ireland Maynooth University New Zealand University of Otago United Kingdom University College London, University of Surrey United States Arizona State University, Kansas State University, Michigan State
University, New York University, University of California, Davis The following graph presents annual international student tuition and fees for 2016 for a Bachelor of Economics degree program at benchmarked universities. Amounts range from nearly zero at a no-fees German university to more than CAD 60,000 at a private U.S. university. Among the Canadian universities, annual fees vary from CAD 9,000 at Memorial to more than CAD 40,000 at McGill. BC universities span across this range, with UBC positioned as the third most costly university. Most benchmarked universities with greater annual fees than UBC are based in the U.S., including several state universities2.
2 This is to some extent due to the current strength of the U.S. dollar relative to the Canadian dollar.
Another factor is that financial aid and scholarships have not been factored in – U.S. institutions have begun to increasingly discount their costs for international undergraduate students. No systematic data exists for Canada which makes a “net price” comparison impossible.

2016 British Columbia International Education Intelligence Report
ICG
14
Annual International Tuition and Fees: Bachelor of Economics (2016) (CAD)
Source: ICG ITBCD. It is important to recognize that while annual tuition fees are a simple indicator of cost, they do not reflect the total investment made by students in an international education experience. In order to understand the full cost that international students have to cover in order to complete a particular degree program, ICG developed the concept of Total Cost of Degree Acquisition (TCODA). TCODA combines tuition fees, additional fees (e.g., student service fees, technology fees, etc.), and estimated cost of living over the duration of a degree program into one metric of cost. Past increase and inflation rates, combined with institutional information on future fees increases, are used to generate fees and cost of living levels for future years. Using forward-looking modeling ICG can model TCODA for an international student over the duration of a given program. The following graph displays the TCODA for international students to complete a Bachelor of Economics degree beginning in 2016 at benchmarked universities. The least costly degree can be obtained from the Humboldt University of Berlin, for under CAD 70,000 – less than the cost of two years of tuition fees at the University of Toronto or McGill. In contrast, the total cost at several U.S. universities exceeds CAD 300,000. On an annual fees basis, BC universities appeared competitive within the benchmarking pool. The projected TCODA at these universities is less competitive – for example, UBC is the tenth highest among the benchmarked universities, at just over CAD 210,000. This is nearly double the cost of the least expensive benchmarked Canadian universities (three-year degrees at Quebec institutions).

2016 British Columbia International Education Intelligence Report
ICG
15
The high TCODA at benchmarked BC universities can be largely attributed to two factors: The duration of undergraduate programs at Canadian universities (four years compared to three years at Australian, New Zealand, and UK universities), which incurs additional cost to students; and for UBC and SFU, the high cost of living in Vancouver (and BC in general).
Total Cost of Degree Acquisition: Bachelor of Economics (2016-20) (CAD)
Source: ICG ITBCD.
Note that the costs presented in this analysis are gross costs based on the “sticker price” of tuition fees, i.e., not reflecting the value of any scholarships or other cost offsets. While BC universities appear cost-competitive relative to major U.S. universities (both public and private), U.S. universities often discount heavily for talented international undergraduate students. For example, according to data from the College Board, ten percent of international undergraduate students at NYU received financial aid from the University in 2015, with the amount of aid averaging about USD 29,000 per student. BC universities will come under increasing pressure if relying on comparatively low as a competitive differentiator – especially if this positioning comes under pressure. Instead, messaging around cost should emphasize quality and return on investment. This is especially salient for programs that demonstrably contribute to the employability of graduates.
2016 British Columbia International Education Intelligence Report
ICG
16
STUDENT DECISION DRIVERS: RANKINGS
Overview While national rankings are well established in many countries, global rankings are just over one decade old. The Academic Ranking of World Universities (ARWU, also known as the Shanghai Ranking) was the first of these rankings to be published, starting in 2003. More than a dozen international university rankings have been launched since, including the well known QS World University Rankings and Times Higher Education (THE) World University Rankings. The analysis presented in this section centers on these three rankings based on their international prominence. International students and relevant decision-makers and influences such as parents, agents, or scholarship agencies and often turn to these rankings as measures of the reputation and quality of a university when making study destination decisions. While debates continue surrounding the methodologies and objectives of these rankings (e.g., emphasis on research universities or reliance on survey-based data), they continue to impact international student perceptions of a destination and thus require consideration.
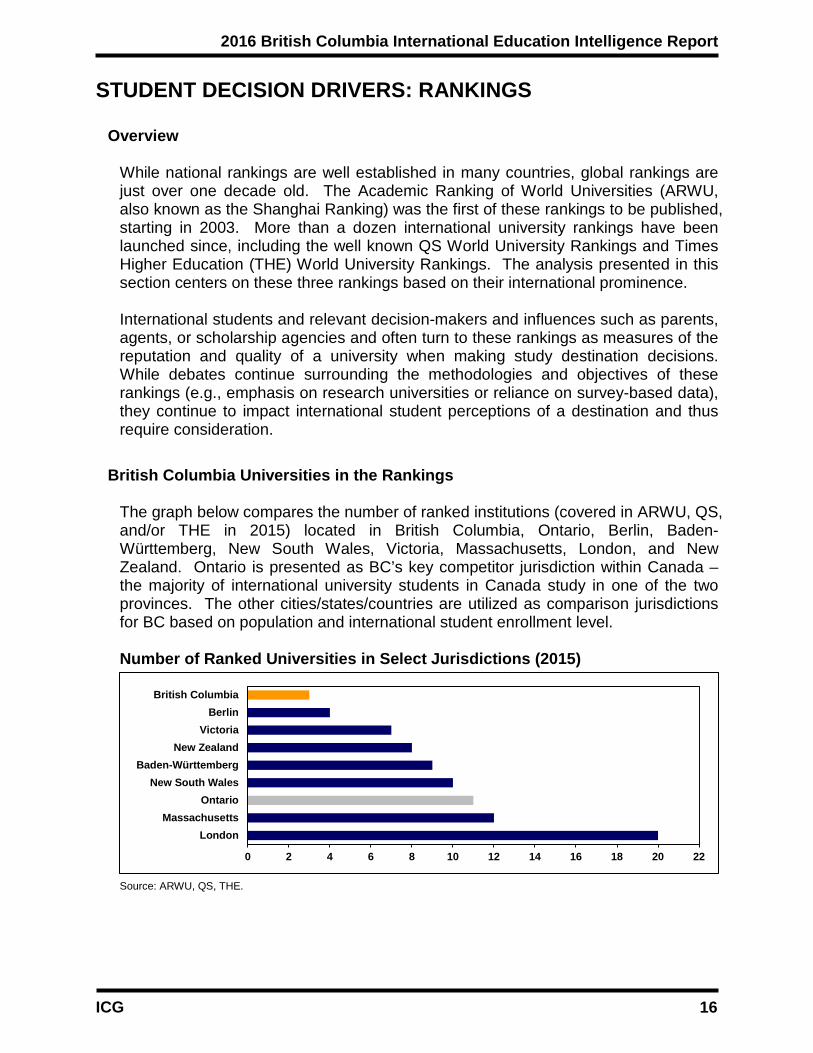
British Columbia Universities in the Rankings The graph below compares the number of ranked institutions (covered in ARWU, QS, and/or THE in 2015) located in British Columbia, Ontario, Berlin, Baden-Württemberg, New South Wales, Victoria, Massachusetts, London, and New Zealand. Ontario is presented as BC’s key competitor jurisdiction within Canada – the majority of international university students in Canada study in one of the two provinces. The other cities/states/countries are utilized as comparison jurisdictions for BC based on population and international student enrollment level.
Number of Ranked Universities in Select Jurisdictions (2015)
Source: ARWU, QS, THE.
0 2 4 6 8 10 12 14 16 18 20 22
LondonMassachusetts
OntarioNew South Wales
Baden-WürttembergNew Zealand
VictoriaBerlin
British Columbia

2016 British Columbia International Education Intelligence Report
ICG
17
The following chart compares the number of ranked universities in each jurisdiction relative to the respective population. As displayed below, the number of ranked universities is not proportional to population size. Given that major international rankings in large part measure research performance, this comparison suggests a relatively low level of research intensity in BC compared to even the cities of London and Massachusetts. Ranked Universities per Million Residents in Select Jurisdictions (2015)
Source: ARWU, QS, THE, respective jurisdictions and statistics agencies.
New Zealand is notable as a jurisdiction in that all eight of its universities place among the top 500 in at least one of the three major rankings. Half of Ontario’s public universities (11 out of 22) appear in at least one of the rankings, of which six consistently ranked in the Top 300 in 2015. BC is positioned somewhat less favorably in this comparison, with only three of its eleven public universities appearing in the rankings (SFU, UBC, and UVic). The BC higher education landscape operates with what may be described as a gap in the positioning of its universities. BC’s ranked, high-performing research universities are highly competitive, with UBC in particular positioned as a Canadian flagship (among the University of Toronto and McGill University) with a distinct international reputation. Although BC’s teaching-focused universities recruit internationally, some students may overlook these universities (and may overlook BC as a whole) since they do not appear in international rankings. This is particularly challenging for those institutions that were only classified as universities as of 2008 – even among students in BC, these are often perceived as college-level institutions. As the world of rankings continues to expand, BC universities should be on the lookout for new rankings measuring dimensions of performance that would likely be applicable to them. BC universities would potentially excel on rankings exclusively focused on areas such as teaching quality, student satisfaction, and employability – all topics of interest among ranking agencies and students. Newer rankings may also be participation-driven, offering BC teaching universities the opportunity to “enter the fray”. For example, U-Multirank may present a means for more BC universities to credibly validate their performance through an external ranking.
0.00 0.25 0.50 0.75 1.00 1.25 1.50 1.75 2.00 2.25 2.50
LondonNew Zealand
MassachusettsNew South Wales
VictoriaBerlin
Baden-WürttembergOntario
British Columbia

2016 British Columbia International Education Intelligence Report
ICG
18
STUDENT DECISION DRIVERS: SOCIAL MEDIA PRESENCE
Overview Online engagement is increasingly important for education institutions seeking to reach prospective international students located around the world. This social media footprint analysis focuses on the presence of BC education institutions on Facebook, LinkedIn, Twitter, and YouTube. These four platforms were chosen because they offer a combination of reach (measured in users or traffic) and relevancy (as measured in the prevalence of target groups education providers aim to reach). All four platforms, at varying levels, are useful for BC institutions to engage on from a marketing, outreach, alumni relations, employer relations, and competitive intelligence perspective. The most important aspect of these platforms from a marketing and recruitment perspective is their ability to reach thousands of potentially interested students by virtue of their respective communication and network dynamics. The following analysis covers all BC public universities, colleges, and institutes. Select international peers are included for comparison, including the Fachhochschule Frankfurt am Main (FH Frankfurt, Germany), Macquarie University (Australia), Miami Dade College (United States), the Northern Melbourne Institute of TAFE (NMIT, Australia), the University of California, Davis (United States), and the University of Edinburgh (United Kingdom). While the social media metrics presented in this analysis are partially a reflection of institutional size and enrollment levels, they also provide insight into the relative brand position of institutions. For example, more than 4.6 million Facebook users “Like” the Harvard University Facebook page despite the University only enrolling about 21,000 students. Note that the values for the specific metrics for each institutional presence (number of Likes on Facebook, number of Twitter followers, etc.) change on a daily basis. The objective of indicating these values is thus to provide a snapshot of the relative presence of each institution.

2016 British Columbia International Education Intelligence Report
ICG
19
British Columbia Institutions on Facebook Relative to global competitors, most BC universities achieve a relatively small social media footprint on Facebook as measured by the number of “Likes”. UBC and TRU are the only BC universities whose official Facebook pages are “Liked” by more than 50,000 users. Among global universities, TRU is highly successful at attracting users to its official Facebook page, with a footprint exceeding those of many Ivy League institutions including Princeton University and Columbia University. This reflects a concerted effort by TRU to build brand awareness via social media, particularly with international students.
Official Facebook Page by University (Number of Likes)
Source: Facebook (June 2016).
The number of Likes for BC colleges on Facebook largely reflects their overall size. BCIT, Langara, and Douglas each garner more than 15,000 Likes for their official Facebook pages. The size of these profiles is comparable to international peers and indicates the impact of institutional branding efforts. NWCC is notable for achieving a sizable profile relative to its enrollment level among BC colleges. Official Facebook Page by College (Number of Likes)
Source: Facebook (June 2016).
0 100,000 200,000 300,000 400,000 500,000 600,000
TRUMacquarieEdinburgh
UBCUC Davis
SFUUVicVIU
UNBCRoyal Roads
UFVCapilano
Emily CarrKwantlen
0 5,000 10,000 15,000 20,000 25,000 30,000 35,000 40,000 45,000Miami Dade
NMITBCIT
LangaraDouglas
FH FrankfurtVCC
SelkirkJIBC
CamosunNWCCCOTR
OkanaganNIC
New CaledoniaNorthern Lights
NVIT

2016 British Columbia International Education Intelligence Report
ICG
20
British Columbia Institutions on LinkedIn LinkedIn’s “University Pages” offer insight into the size, reach, and level of affinity of a given university’s pool of alumni. The number of alumni listed on a University Page measures not only the actual number of students that have attended a university, but the number of those active professionally and willing to highlight their affiliation. UBC’s global reputation and reach is evidenced by its strong LinkedIn network of more than 190,000 alumni.
LinkedIn University Page by University (Total Number of Alumni)
Source: LinkedIn (June 2016).
A LinkedIn University Page can be useful for prospective international students to learn about the outcomes that have been achieved by graduates of a university. This includes information about the industries worked in, types of jobs, and seniority levels of alumni. The comparatively low numbers of self-reported alumni on some BC university pages can be a competitive malus in this regard. University Pages also indicate the number of reported alumni that work outside of the country in which the university is located (here termed “international alumni”). This information can be valuable for a university in terms of gauging the reach of its international alumni network – a network that can be leveraged for activities such as international student recruitment.
LinkedIn University Page by University (Percent International Alumni)
Source: LinkedIn (June 2016).
0 20,000 40,000 60,000 80,000 100,000 120,000 140,000 160,000 180,000 200,000
UBCUC Davis
EdinburghSFU
MacquarieUVic
KwantlenCapilano
TRURoyal Roads
VIUUFV
Emily CarrUNBC
0% 5% 10% 15% 20% 25% 30% 35% 40%
EdinburghMacquarie
UBCUVicSFU
Emily CarrRoyal Roads
VIUTRU
UNBCCapilano
UFVKwantlenUC Davis

2016 British Columbia International Education Intelligence Report
ICG
21
Among BC universities, anywhere from six to 22 percent of self-identified alumni live (and work) outside of Canada. Nearly 40 percent of alumni listed on the University of Edinburgh’s page are international, suggesting the effectiveness of the University in leading students to global careers. Among BC colleges maintaining LinkedIn University Pages, BCIT achieves the greatest reach by far, with more than 89,000 registered alumni. No other BC college LinkedIn page achieves an alumni network of more than 20,000. One of the challenges for BC colleges engaging with alumni on LinkedIn is that many of their students transfer to universities and accordingly do not identify themselves as college alumni. Colleges may benefit from enhanced efforts to reach these students and encourage maintaining connections through participation in LinkedIn networks. LinkedIn University Page by College (Total Number of Alumni)
Source: LinkedIn (June 2016). According to the pages for each of the benchmarked colleges in North America, less than ten percent of the listed alumni work internationally. This may suggest that these colleges focus on programs that prepare graduates for entering the local (domestic) labor market. The outlier is FH Frankfurt, with more than 20 percent of listed alumni working internationally – likely reflecting a high level of intra-European mobility. LinkedIn University Page by College (Percent International Alumni)
Source: LinkedIn (June 2016).
0 10,000 20,000 30,000 40,000 50,000 60,000 70,000 80,000 90,000 100,000
Miami DadeBCIT
LangaraDouglas
CamosunVCC
OkanaganFH Frankfurt
JIBCNew Caledonia
SelkirkNIC
0% 5% 10% 15% 20% 25%
FH FrankfurtBCIT
LangaraVCC
DouglasOkanagan
New CaledoniaCamosun
Miami DadeNIC
JIBCSelkirk

2016 British Columbia International Education Intelligence Report
ICG
22
British Columbia Institutions on Twitter To a great extent, Facebook and LinkedIn are affiliation-driven platforms for education institutions (i.e., students/graduates will “Like” or follow a page to indicate their connection to the institution). Twitter operates as a more content-driven platform: Twitter users largely draw followers based providing informative, entertaining, or engaging tweets. Universities such as SFU and Royal Roads achieve comparatively large Twitter followings based on frequent sharing of multimedia content (e.g., photos and videos) and interactions with students (e.g., re-tweets and replies). Notably, the UBC Twitter following is relatively small compared to its presence on other platforms, largely because its official institutional account is one of many operated by the University (e.g., including accounts for different audiences such as prospective students or Faculty-specific accounts).
Official Twitter Account by University (Number of Followers)
Source: Twitter (June 2016).
For BC colleges, size appears to be a key driver of Twitter followings. Unlike on other platforms, the presence of BC colleges on Twitter is often comparable to that of universities. This again reflects the different content landscape of Twitter. Official Twitter Account by College (Number of Followers)
Source: Twitter (June 2016).
0 10,000 20,000 30,000 40,000 50,000 60,000 70,000
EdinburghUC Davis
SFUUBC
MacquarieRoyal Roads
UVicEmily Carr
VIUUFV
UNBCKwantlen
TRUCapilano
0 2,000 4,000 6,000 8,000 10,000 12,000 14,000BCIT
Miami DadeLangaraDouglas
CamosunVCCJIBCNIC
OkanaganNew Caledonia
SelkirkCOTRNMIT
NWCCNorthern Lights
FH FrankfurtNVIT

2016 British Columbia International Education Intelligence Report
ICG
23
British Columbia Institutions on YouTube Compared to platforms such as Facebook and LinkedIn, YouTube is not relationship-based. Traffic is driven by content, which can be made available for viewing by YouTube users who may not have an account or subscribe to the institutional channel. As such, an institution producing a small number of compelling videos can accomplish the same reach as one producing a high volume of videos. For example, although Royal Roads’ YouTube channel hosts approximately 200 more videos than Emily Carr’s, on average Emily Carr videos are viewed more frequently – resulting in the almost equal view count displayed below. Popular institutional videos range across a variety of content types, from well-produced promotional videos, to creative content videos, to videos of lectures delivered at an institution by prominent speakers.
Official YouTube Channel by University (Total Number of Video Views)
Source: YouTube (June 2016).
Okanagan College’s YouTube presence demonstrates the value of compelling content over size. More than 55 percent of its YouTube views come from one video it posted in 2009: A video of the building of a world record-setting spaghetti bridge on campus at the Spaghetti Bridge World Championships. Official YouTube Channel by College (Total Number of Video Views)
Source: YouTube (June 2016).
0 1,000,000 2,000,000 3,000,000 4,000,000 5,000,000 6,000,000
UC DavisEdinburgh
UBCSFU
MacquarieKwantlen
Royal RoadsEmily Carr
UVicVIU
TRUUNBC
CapilanoUFV
0 100,000 200,000 300,000 400,000 500,000 600,000 700,000 800,000 900,000 1,000,000BCIT
OkanaganDouglas
VCCLangara
Miami DadeCamosun
NICNMIT
COTRJIBCNVIT
New CaledoniaNorthern Lights
SelkirkNWCC

2016 British Columbia International Education Intelligence Report
ICG
24
COMPETITIVENESS DRIVER: PATHWAYS
Overview As the pool of students pursuing education abroad has grown, so has the variation in their academic and linguistic preparation for postsecondary study. An increasing number of talented students seeking education internationally hail from secondary education systems which do not adequately prepare them for study at a quality English-speaking university. In order to bridge this gap, a wide range of programs have emerged or expanded to offer an academic pathway into higher education. ICG’s 2015 report on International Students Pathways in Canada estimated that as of 2014, 25 to 30 percent of international students entering undergraduate degree programs at Canadian universities come from pathways programs. Yet the pathways landscape in Canada remains fragmented, with many universities maintaining unclear relationships even with their on-campus language and academic augmentation programs (e.g., English for Academic Purposes). In contrast, Australia and the UK have taken a lead in promoting – often highly integrated - pathways programs as bridges to undergraduate degree tracks. In Australia, more than 80 percent of international undergraduate students are recruited through a wide variety of pathways programs. Based on benchmarking of 80 of the largest university and college pathways programs in Canada, ICG mapped out the below landscape of available programs. Map of Benchmarked Canadian Pathway Programs by Program Type
Source: ICG.

2016 British Columbia International Education Intelligence Report
ICG
25
The benchmarking reflected the following types of pathways programs observed in Canada:
• University Transfer. Programs combining English language skills development, academic coursework for credit, and additional academic support. These programs are deemed to be equivalent to the first year of a degree program at universities accepting the university transfer (UT) award. Upon successful completion of a university transfer program, students enter the second year of the university undergraduate degree program.
• Summer Intensive. English preparatory programs taking place in the summer prior to degree entry, typically aimed at students with an English proficiency score close to the minimum entry requirements for direct entry.
• EAP (English for Academic Purposes). English language programs structured to improve language and study skills preparing students for tertiary education entry and success. English language proficiency requirements for entry to degree programs at target institutions can be met by successful completion of accepted EAP programs. Students may or not be able to earn academic credits counting towards an undergraduate degree program within an EAP program.
Within Canada, BC leads as a jurisdiction for offering tightly integrated pathways programs, particularly in the Lower Mainland. For example, Fraser International College at SFU is one of the largest UT award based programs worldwide, while UBC’s Vantage College offers an example of a homegrown effort to deliver a well-supported on-campus pathway experience. BC also benefits from the presence of de facto international student pathways due to the long-established BC Transfer System facilitating transitions between colleges and universities. Pathways offer BC a competitive advantage for recruiting international students, by enabling institutions to reach capable students who might not be admissible to peer institutions without pathway options. With the right level of organized preparatory work, pathways students can go on to be academically successful in degree or diploma level studies. It is important to note, however, that this competitive advantage will come under pressure for BC. The global pathways market has been expanding, particularly with many reputable U.S. universities partnering with private providers such as INTO and Study Group to deliver on-campus pathways programs. Several of these are UT award type programs enrolling thousands of international students, such as INTO Oregon State University. Moving forward, it will be critical for BC institutions to maintain quality in their pathways programs, be able to clearly demonstrate outcomes of pathways students, and position the availability of pathways clearly and comprehensibly in international recruiting efforts.

2016 British Columbia International Education Intelligence Report
ICG
26
OUTLOOK: BRITISH COLUMBIA IN 2018
Reflecting on the 2014 BC International Education Intelligence Report
The 2014 report posited five theories covering subsequent years:
One theory was that BC would see continued international student enrollment albeit at declining annual growth rates. New student entry data covering 2015 for Canada as a whole (detailed BC data is not yet available) as well as select BC sectoral data (here: language schools) have borne this theory out – though some BC colleges and universities continue on a strong growth path. Earlier this year, Vancouver was named as the world’s third-most expensive city for housing. The general cost of living in BC has continued to increase as well. The 2014 report foresaw the need for institutional cost mitigation – a development beginning to slowly unfold through, for example, the addition of added housing capacity. The lack of diversity in the international student body continued to grow, with Chinese students on course to double their share from 2004 to nearly half of all international students. The need for re-balancing student portfolios in the mid-term future remains ever more acute. Rising competition levels from Australian, U.S., and New Zealand institutions manifested themselves in 2015 – all three countries grew enrollments at a notably higher rate than Canada. The UK continues to remain mired in policy discord that has led to 2015 international enrollments running at 2012 levels. As predicted, pathways continue to be source of strength in BC, with institutions from Langara College to Fraser International College at SFU posting continued strong growth numbers. ICG’s 2016 report on behalf of the BC Ministry of Education on Secondary to Post-Secondary Education Pathways for International Students in British Columbia offers detailed information on this dynamic.
Looking Forward to 2018
Many of the conditions that have powered the growth of international student enrollment in BC remain in place: BC is considered as a safe and attractive location offering quality education with easy transfer opportunities. In addition, Vancouver is now more easily reachable by international direct flights from the Asia Pacific region. At the same time, the value proposition of BC education providers has eroded based on the (very) high and further increasing cost of living in BC (especially in Vancouver, but increasingly so as well in other areas). Some cost pressure has been mitigated by the decline of the Canadian dollar – any substantial increase of the Canadian dollar will put this situation into sharp relief.

2016 British Columbia International Education Intelligence Report
ICG
27
As already stated, BC’s international student pool is becoming less and less diverse. This trend is creating an increasing structural risk – should the stream of Chinese students accessing BC institutions slow down or reverse, significant financial pressures on many BC education providers would ensure. BC’s second largest source country, South Korea, offers little to no growth opportunities while the third-largest market, India, is characterized by price sensitivity and volatility. The need for diversification continues to grow. For 2017 and 2018, the biggest competitive threat is likely to emanate from the United States. After years if not decades of benign neglect of systematic international marketing and recruiting activities, hundreds of U.S. colleges and universities have begun to recruit actively. Coupled with a much more pronounced discount-driven approach by these institutions, BC colleges and universities are bound to face a large group of new competitors. BC can defend its position as a prime international student destination if it addresses its key challenges – cost, diversification, and competition – in an active and evidence-based approach. Relaying on core strength such as education quality, substantial pathways options, and the continued attraction of BC as a destination will aid in this pursuit. Note that this report aimed to address the impact of macro-level competitive factors on the Province of British Columbia, taken through an institutional benchmarking lens where possible. However, BC’s future performance will also be a reflection of the institution-level activities of BC’s universities, colleges, institutes, language schools, and elementary and secondary schools. This includes strategic selection of target markets by institutions, institutional marketing and recruitment efforts, and particularly a timely and organized student admissions process. Skillful execution by education providers in these areas will be critical in determining BC’s continued success as an education destination.


The Illuminate Consulting Group (ICG) is an international science, research, and academic strategy consulting firm
advising the leadership of teaching and research institutions, foundations, governments, and public agencies on policy,
development, and competition issues.

The Illuminate Consulting Group June 2016