
B.C. 2025 Labour Market Outlook
56
WORKBC.CA
Transcript of B.C. 2025 Labour Market Outlook

WORKBC.CAWORKBC.CA

DID YOU KNOW?B.C. was the leader in economic growth in Canada in 2015 and we are well positioned to be among Canada’s leaders in economic growth again in 2016.
B.C. 2025 LABOUR MARKET OUTLOOK
CONTENTS
MINISTER’S MESSAGE 2
ABOUT THIS REPORT 4
What is the Labour Market? 4
Where Do the Numbers Come From? 5
Who Uses the Numbers? 7
Why Do the Numbers Change? 7
What is New this Year? 8
LABOUR MARKET OUTLOOK 9
Overview 9
What are the Key Assumptions? 11
A Balanced Outlook 12
Education and Training Needs 12
Skills and Competencies in British Columbia 13
Occupation Outlook 16
Industry Outlook 17
TOP 100 HIGH OPPORTUNITY OCCUPATIONS 19
How is the Top 100 list used? 19
How is the list developed? 20
High Opportunity Health Occupations 23
TOP OPPORTUNITY OCCUPATIONS IN BRITISH COLUMBIA
RANKED BY SKILL LEVEL AND JOB OPENINGS 24
REGIONAL OUTLOOK 26
Vancouver Island/Coast 28
Mainland/Southwest 30
North 32
South East 34
CONCLUSION 36
APPENDIX 1: Provincial Labour Market Outlook Summary Data 37
APPENDIX 2: Methodology and Assumptions 39
APPENDIX 3: Job Openings for All 500 Occupations 42
1B.C. 2025 LABOUR MARKET OUTLOOK

MINISTER’S MESSAGEBRITISH COLUMBIA’S FUTURE PROSPERITY DEPENDS ON A
GROWING WORKFORCE WITH THE EDUCATION, TRAINING,
AND SKILLS REQUIRED TO PARTNER WITH AND COMPETE
AMONGST THE WORLD’S ADVANCED ECONOMIES.
The 2025 B C Labour Market Outlook report is the Province’s contribution to the foundation of labour market
information and is available for students, families, employers, job-seekers, educators and anyone else with an interest in living and working in British Columbia The labour market is complex and embodies decisions being made every day by British Columbians; decisions that require reliable, timely information about the latest trends and expectations in the labour market
Since last year’s report, employment has continued on an upward trend and is now at a record high of over 2 3 million B C was the leader in economic growth in Canada in 2015 and is well positioned to be among Canada’s leaders in economic growth again in 2016 and even 2017 We have benefited from a diverse economy that has allowed us to grow and adapt to changing global and national economic forces We have also been open and welcoming to our new residents from across the country and around the world
By 2025, we’re expecting 934,000 job openings Over a third of those will require
a bachelor, graduate or professional degree An even larger share – about 42 percent – will require diploma certificates or trades apprenticeship training It’s essential that we have the right mix of education and training programs available to meet these emerging labour market needs
We need to have a clear appreciation for the implications of our aging workforce Economic growth will generate thousands of job openings but replacement of retiring workers will generate over two-thirds of job openings over the next ten years We now have more people reaching retirement age than we have people entering the labour force This means that labour demand growth will increasingly rely on higher rates of labour force participation, reduced unemployment and increased in-migration In 2014, we developed B C ’s Skills for Jobs Blueprint to provide us with clear direction on how to build our current and future workforce, to ensure we have the labour force required for B C ’s prosperous future, while maintaining British Columbians’ place at the front of the line for the jobs that are in-demand
The 2025 Labour Market Outlook forecast incorporates a clear view on the impact of an aging population and how focused and
2 B.C. 2025 LABOUR MARKET OUTLOOK
effective policies and programs will facilitate the required growth in B C ’s labour supply We are projecting an increase in the labour supply of 1 1 percent over the next ten years, keeping pace with labour force demand growth This clear path of labour market balance is an important signal to investors to continue and expand their support for our growth potential
As we have since 2010, our government uses the information in the Labour Market Outlook to help inform the more than $7 8 billion investment that we make in training and education This past year we have also worked with more partners and stakeholders, to help them understand the information and use it as an important tool for their planning We also work with them to integrate their specific knowledge to make this edition and future updates better and to identify additional labour market research requirements
This updated forecast incorporates a wide range of feedback that we received during our consultations this past year I would like to thank the partners and stakeholders who generously spent time with me and my staff to discuss our projections
including industry and business associations,
unions, community groups, aboriginal
representatives, sector roundtable and
advisory group participants, education and
training providers, labour market consultants,
and academics
This year we will be promoting sector
information through distinctive online
reports that will be made available via
www.WorkBC.ca We have updated our
list of top-opportunity occupations, along
with the identification of occupations that
are trending up or down in terms of future
opportunity We have also added analysis
about the important role of competencies
and the skills needed to meet the jobs of
the future
As we prepare for our next stage of growth,
we will continue bringing people together
to talk about our labour market needs and
priorities, and fine-tuning our education
and training systems to help ensure that
B C taxpayers get full value from the billions
of dollars we invest every year With this
report, we’re inviting all British Columbians
to continue working with us to build a future
of stability, strength and opportunity
THE HONOURABLE SHIRLEY BOND Minister of Jobs, Tourism and Skills Training
and Minister Responsible for Labour
3B.C. 2025 LABOUR MARKET OUTLOOK

ABOUT THIS REPORT
What is the Labour Market?
THE LABOUR MARKET IS DEFINED AS “THE SUPPLY OF AVAILABLE WORKERS
IN RELATION TO AVAILABLE WORK.” This basic supply and demand equation can affect everything from wage rates to investors’ decisions to proceed with major projects
Within B C , the labour market varies by industry, geography and occupation It also changes over time B C has a flexible labour market and supply will respond to increases in demand So it’s good to have the latest, most up-to-date information, recognizing that it is only ever a snapshot in time
That’s exactly what you’ll find in this Labour Market Outlook report It provides the best available information about the kinds of jobs and skills that will be most in demand – overall, and region by region – for the next 10 years
WHAT WILL B.C.’S LABOUR MARKET LOOK LIKE IN THE FUTURE? WHAT KINDS OF OCCUPATIONS WILL BE MOST IN DEMAND? AND WHERE WILL THE BEST OPPORTUNITIES BE?
These are important questions, especially for young people planning their careers and employers considering major investments They’re also critical questions for the education and training sectors, which are constantly evolving to ensure we keep pace with a changing world and a growing economy
That’s why the Province issues regular Labour Market Outlook reports, estimating future supply and demand by industry, occupation, education/skill level and geographic region
This information links directly to B C ’s Skills for Jobs Blueprint, helping to ensure that young people have a seamless path from school to the workplace, and that our labour force has the right mix of skills for the future
We do not rely only on this report to spread the word Results from the forecast are in the WorkBC Parents’ Guide (workbc.ca/parentguide), integrated into WorkBC Career Profiles, available for full detailed download from DataBC and included in the wide range of industry consultation and roundtable briefings we undertake on an ongoing basis
4 B.C. 2025 LABOUR MARKET OUTLOOK
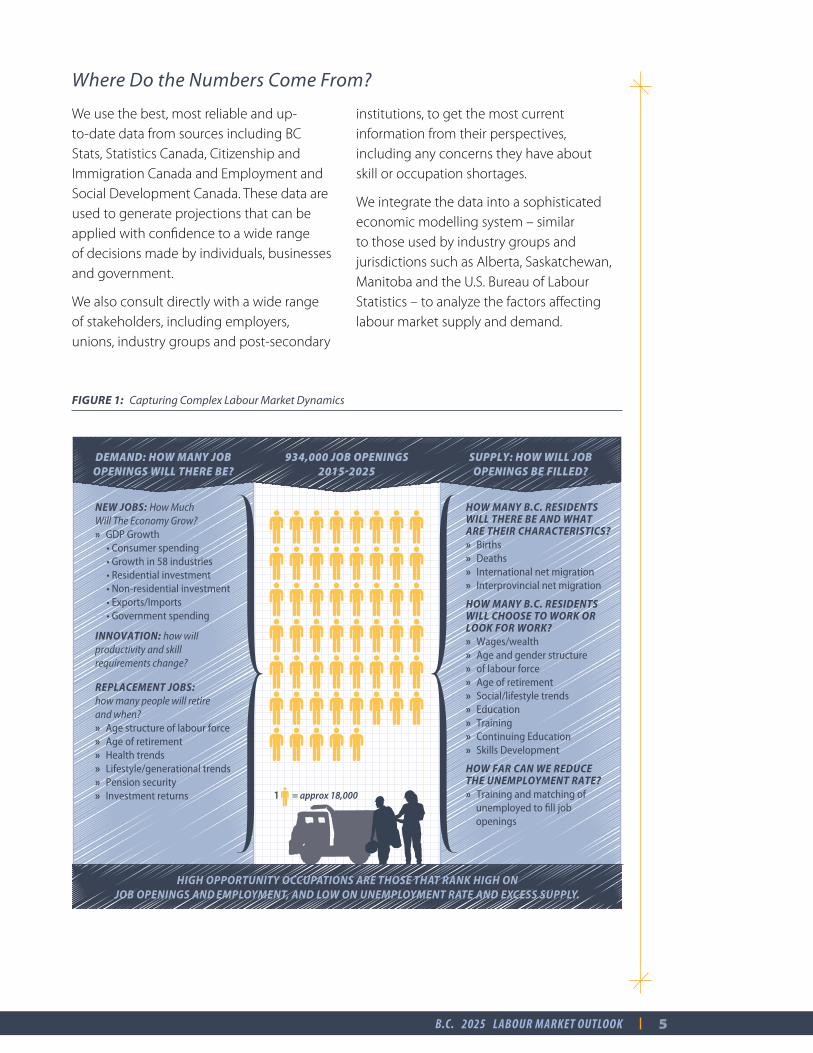
Where Do the Numbers Come From?
We use the best, most reliable and up-to-date data from sources including BC Stats, Statistics Canada, Citizenship and Immigration Canada and Employment and Social Development Canada These data are used to generate projections that can be applied with confidence to a wide range of decisions made by individuals, businesses and government
We also consult directly with a wide range of stakeholders, including employers, unions, industry groups and post-secondary
institutions, to get the most current information from their perspectives, including any concerns they have about skill or occupation shortages
We integrate the data into a sophisticated economic modelling system – similar to those used by industry groups and jurisdictions such as Alberta, Saskatchewan, Manitoba and the U S Bureau of Labour Statistics – to analyze the factors affecting labour market supply and demand
DEMAND: HOW MANY JOBOPENINGS WILL THERE BE?
934,000 JOB OPENINGS20152025
SUPPLY: HOW WILL JOB OPENINGS BE FILLED?
NEW JOBS: How Much Will The Economy Grow? »GDP Growth• Consumer spending• Growth in 58 industries• Residential investment• Non-residential investment • Exports/Imports• Government spending
INNOVATION: how will productivity and skill requirements change?
REPLACEMENT JOBS: how many people will retire and when? »Age structure of labour force »Age of retirement »Health trends »Lifestyle/generational trends »Pension security »Investment returns
HOW MANY B.C. RESIDENTS WILL THERE BE AND WHAT ARE THEIR CHARACTERISTICS? »Births »Deaths »International net migration »Interprovincial net migration
HOW MANY B.C. RESIDENTS WILL CHOOSE TO WORK OR LOOK FOR WORK? »Wages/wealth »Age and gender structure»of labour force »Age of retirement »Social/lifestyle trends »Education »Training »Continuing Education »Skills Development
HOW FAR CAN WE REDUCE THE UNEMPLOYMENT RATE? »Training and matching of »unemployed to fill job »openings
HIGH OPPORTUNITY OCCUPATIONS ARE THOSE THAT RANK HIGH ONJOB OPENINGS AND EMPLOYMENT, AND LOW ON UNEMPLOYMENT RATE AND EXCESS SUPPLY.
1 = approx 18,000
FIGURE 1: Capturing Complex Labour Market Dynamics
5B.C. 2025 LABOUR MARKET OUTLOOK
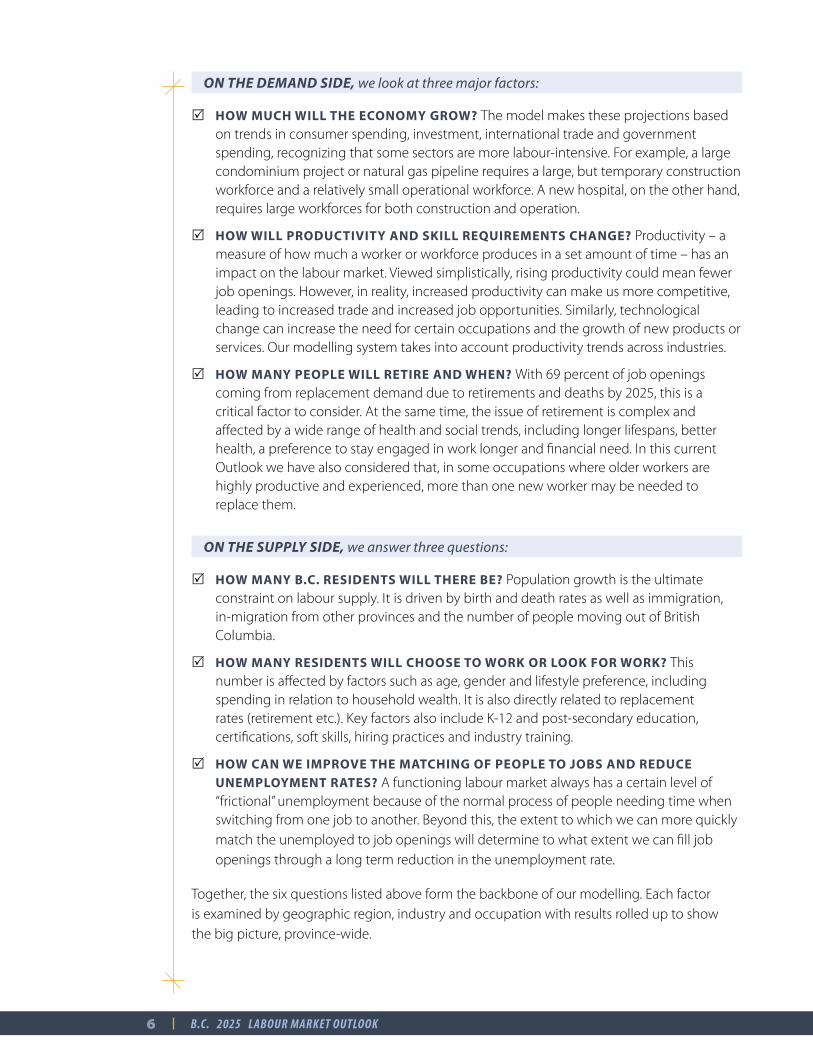
ON THE DEMAND SIDE, we look at three major factors:
R HOW MUCH WILL THE ECONOMY GROW? The model makes these projections based on trends in consumer spending, investment, international trade and government spending, recognizing that some sectors are more labour-intensive For example, a large condominium project or natural gas pipeline requires a large, but temporary construction workforce and a relatively small operational workforce A new hospital, on the other hand, requires large workforces for both construction and operation
R HOW WILL PRODUCTIVITY AND SKILL REQUIREMENTS CHANGE? Productivity – a measure of how much a worker or workforce produces in a set amount of time – has an impact on the labour market Viewed simplistically, rising productivity could mean fewer job openings However, in reality, increased productivity can make us more competitive, leading to increased trade and increased job opportunities Similarly, technological change can increase the need for certain occupations and the growth of new products or services Our modelling system takes into account productivity trends across industries
R HOW MANY PEOPLE WILL RETIRE AND WHEN? With 69 percent of job openings coming from replacement demand due to retirements and deaths by 2025, this is a critical factor to consider At the same time, the issue of retirement is complex and affected by a wide range of health and social trends, including longer lifespans, better health, a preference to stay engaged in work longer and financial need In this current Outlook we have also considered that, in some occupations where older workers are highly productive and experienced, more than one new worker may be needed to replace them
ON THE SUPPLY SIDE, we answer three questions:
R HOW MANY B.C. RESIDENTS WILL THERE BE? Population growth is the ultimate constraint on labour supply It is driven by birth and death rates as well as immigration, in-migration from other provinces and the number of people moving out of British Columbia
R HOW MANY RESIDENTS WILL CHOOSE TO WORK OR LOOK FOR WORK? This number is affected by factors such as age, gender and lifestyle preference, including spending in relation to household wealth It is also directly related to replacement rates (retirement etc ) Key factors also include K-12 and post-secondary education, certifications, soft skills, hiring practices and industry training
R HOW CAN WE IMPROVE THE MATCHING OF PEOPLE TO JOBS AND REDUCE UNEMPLOYMENT RATES? A functioning labour market always has a certain level of “frictional” unemployment because of the normal process of people needing time when switching from one job to another Beyond this, the extent to which we can more quickly match the unemployed to job openings will determine to what extent we can fill job openings through a long term reduction in the unemployment rate
Together, the six questions listed above form the backbone of our modelling Each factor is examined by geographic region, industry and occupation with results rolled up to show the big picture, province-wide
6 B.C. 2025 LABOUR MARKET OUTLOOK

Who Uses the Numbers?
The B C government uses the projections in the Labour Market Outlook to help shape priorities across the education and training sectors A Labour Market Priorities Board, established in 2014, brings together decision-makers from all provincial ministries responsible for training and makes key recommendations about the best ways to target the $7 8 billion B C invests in education and training every year
Students, families, counsellors and job-seekers, both B C residents and potential
in-migrants, use the projections to inform decisions about education, training and career planning
Employers and investors use the data to inform their long-term plans Industry leaders also work closely with the Province to ensure we have their most current projections for skill and employment needs
Planners, consultants and anyone who’s interested can use the raw data to develop applications or other tools that add further value to our ongoing analyses
WHAT ABOUT LNG? The Province continues working closely with the industry to maintain and update occupational workforce projections for the LNG sector However, these projections will factor into the Labour Market Outlook only once there is a final investment decision on one or more projects
Why Do the Numbers Change?
The world around us is constantly changing, so we regularly update both our data and our assumptions based on the best information available at the time For example, economic changes like the oil-price decrease of 2014/15 have widespread implications for the labour market in B C , Canada and around the world
We look forward to continuing to improve the Outlook – and you can help Tell us which aspects of the Outlook are most helpful, and which could be improved as we continue to build a reliable labour market information system for our province and its diverse regions Contact us at [email protected]
FOR MORE on the methodology and assumptions behind this report, see Appendix 2
FOR ACCESS to the full set of forecast data for all 500 occupations and regions, go to http://catalogue.data.gov.bc.ca/dataset/labour-market-outlook.
FOR A BROADER LOOK at employment, hiring and training opportunities, go to www.WorkBC.ca
7B.C. 2025 LABOUR MARKET OUTLOOK

What is New this Year?
This year, we are adding a section that summarizes the outlook by major industry grouping as well as the full detail for the individual 58 industries covered in the forecast Instead of covering a few specific industries in more detail in the report, we will publish a larger number of separate online industry and occupational group profiles After this main report is released, these industry reports will be published on WorkBC on a staged basis over the last half of 2016 with the final report to be released in December
We have also changed some terms used in the report In past reports we have used the term “net other mobility” to describe the concept that includes workers moving from one occupation to another as well as the net change in labour force participation In order to be more informative, when we discuss this at the level of all occupations we will use the term “Change in Labour Force Participation”
We also changed how we describe the educational skill levels In prior reports,
we used the terms “Usually requiring a university degree” and “Usually requiring a college education or apprenticeship training” In this report we changed these to “Usually requiring Bachelor, Graduate or First Professional Degree” and “Usually requiring Diploma, Certificate or Apprenticeship Training” This was done to align to the education credential terminology used in the post-secondary education system
Formal education is an important factor associated with career development Also important are skills such as literacy and numeracy and competencies such as critical thinking, problem solving and ability to work with others This is why we introduced a new section on skills and competencies to articulate what employers say they need in terms of skills and how B C ranks relative to the rest of Canada and the world in numeracy and literacy We also provide information about the evolution of top in-demand competencies over the next ten years
DID YOU KNOW?Currently, about 70 percent of BC’s workers have some post-secondary education and training.
8 B.C. 2025 LABOUR MARKET OUTLOOK
LABOUR MARKET OUTLOOK
Overview
In this year’s forecast, Real Gross Domestic Product – which measures economic growth, minus inflation – is projected to grow at an average of 2 2 percent per year through 2025 Employment growth is projected to be 1 2 percent per year These projections are consistent with economic and demographic forecasts from the BC Ministry of Finance and BC Stats
This forecast for average 10 year total BC GDP growth is the same as last year However, the composition of this growth has shifted
Higher growth prospects are seen in the next few years for the housing sector and its suppliers The same applies to sectors benefiting from a lower Canadian dollar and lower energy prices These include
manufacturers and other exporters of goods and services as well as the tourism and hospitality sector As well, we are incorporating higher short-term growth in net in-migration from other provinces which is providing additional strength to housing and retail sales
The forecast incorporates more challenging short-term conditions for industries and regions that have greater reliance on commodity prices and associated production and investment
As a feature of BC’s diverse economy we see these shifts in the prospects of sectors and regions generally balancing out at the level of the total economy and the long term path
TABLE 1: British Columbia Job Openings, 2015-2025
2015–2025 LABOUR MARKET OUTLOOK HIGHLIGHTS
TOTAL JOB OPENINGS 934,000 100%
Replacement 642,000 69%
Economic growth 292,000 31%
REDUCED UNEMPLOYMENT 5,000
SUPPLY ADDITIONS 929,000 100%
New entrants 430,000 46%
Net international in-migration 248,000 27%
Net interprovincial in-migration 75,000 8%
Increased labour force participation 176,000 19%
Note: Values rounded, percentages are shares of the total, job openings are filled through reduced unemployment and labour supply additions
9B.C. 2025 LABOUR MARKET OUTLOOK
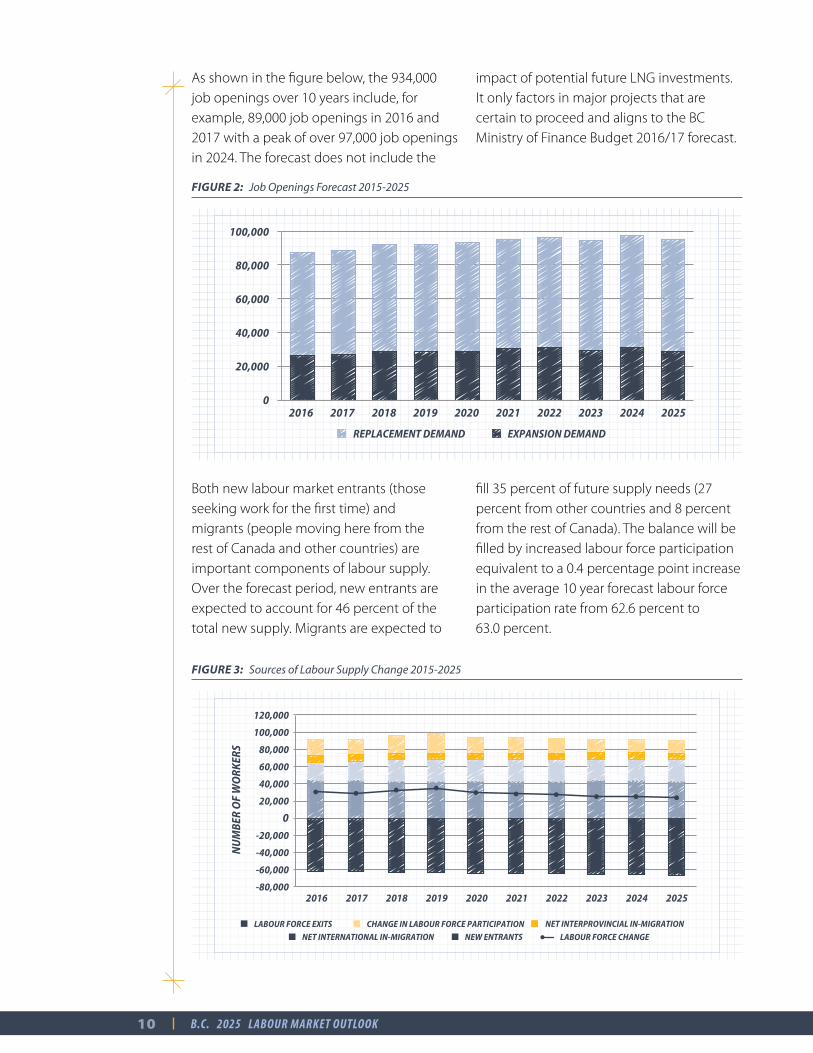
As shown in the figure below, the 934,000 job openings over 10 years include, for example, 89,000 job openings in 2016 and 2017 with a peak of over 97,000 job openings in 2024 The forecast does not include the
impact of potential future LNG investments It only factors in major projects that are certain to proceed and aligns to the BC Ministry of Finance Budget 2016/17 forecast
FIGURE 2: Job Openings Forecast 2015-2025
REPLACEMENT DEMAND EXPANSION DEMAND
20252016 2017 2018 2019 2020 2021 2022 2023 2024
20,000
0
40,000
60,000
80,000
100,000
Both new labour market entrants (those seeking work for the first time) and migrants (people moving here from the rest of Canada and other countries) are important components of labour supply Over the forecast period, new entrants are expected to account for 46 percent of the total new supply Migrants are expected to
fill 35 percent of future supply needs (27 percent from other countries and 8 percent from the rest of Canada) The balance will be filled by increased labour force participation equivalent to a 0 4 percentage point increase in the average 10 year forecast labour force participation rate from 62 6 percent to 63 0 percent
FIGURE 3: Sources of Labour Supply Change 2015-2025
LABOUR FORCE EXITS CHANGE IN LABOUR FORCE PARTICIPATION NET INTERPROVINCIAL IN-MIGRATION
NET INTERNATIONAL IN-MIGRATION NEW ENTRANTS LABOUR FORCE CHANGE
-80,000
-60,000
-40,000
-20,000
0
20,000
40,000
60,000
80,000
100,000
120,000
2016 2017 2018 2019 2020 2021 2022 2023 2024 2025
NU
MBE
R O
F W
ORK
ERS
10 B.C. 2025 LABOUR MARKET OUTLOOK

What are the Key Assumptions?
Little has changed at the top level of the forecast since last year’s 2024 Labour Market Outlook projected 935,000 job openings with 295,000 new jobs generated by economic growth and 640,000 coming from replacements (retirements and deaths)
Actual employment growth in 2015 came in almost exactly as forecast with greater than expected weakness in regions and industries with more exposure to weak commodity prices offset by stronger than expected growth in other regions and industries that benefited from population growth and the lower dollar
Research was undertaken on the projected rate of labour force replacements (labour force exits such as retirements, deaths, disability and illness) that determined our estimates fall within a range that is supported by the data that are available
Our estimates were also consistent with some specific company and industry data that some stakeholders supplied to us for confidential benchmarking We will continue to monitor trends and new data sources, especially regarding retirement behaviour, and incorporate any new insight into future updates of the forecast
Replacement rates are estimated for each of the 500 occupations based on workers’ average age, the average age of retirement plus data on age-specific mortality rates The average annual replacement rate is assumed to be 2 4 percent (comprised of an annual average mortality rate of 0 3 percent and 2 1 percent for other causes of replacement)
The table below shows the major drivers of the model over the last three forecast cycles
FIGURE 4: Comparison of Key Model Drivers: 2025 Outlook compared to the 2024 and 2022 Outlook forecast
CONCEPT DESCRIPTION 2012–2022 FORECAST
2014–2024 FORECAST
2014–2025 FORECAST
IMPACT OF CHANGE
2024 vs 2025
Retirement Rate ( % of labour force, 10 year average)
Rate of exits from the labour force due to retirement, disability,illness and death 2.5% 2.4% 2.4% No change
to openings
Real GDP ($2007 terms, Annual average growth)
Total amount of economic activity/spending adjusted for inflation. Weaker GDP growth leads to lower demand for labour.
2.5% 2.2% 2.2% No change to openings
Employment (Annual average growth)
Growth in employment generates job openings due to economic expansion 1.2% 1.2% 1.2% No change
to openings
Non-residential investment (Constant $2007, sum over 10 years of the forecast)
Investment in industrial, natural resource, and commercial equipment and structures – a large, often variable, component of GDP. Less investment leads to drop in labour demand.
$437 Billion
$386 Billion
$391 Billion
Higher openings
Participation Rate(10 year average)
The % of the working age population that is in the labour force – a lower rate reduces labour supply.
64.7% 63.1% 63.0%No change to Labour
Supply
Net interprovincial In-Migration (Sum over 10 years of forecast)
In-migration less out-migration – higher net in-migration leads to higher labour supply. 117,000 112,000 122,000
Higher Labour Supply
Net International In-Migration (Sum over 10 years of forecast)
In-migration less out-migration – higher net in-migration leads to higher labour supply. 376,000 410,000 390,000
Lower Labour Supply
11B.C. 2025 LABOUR MARKET OUTLOOK
A Balanced Outlook
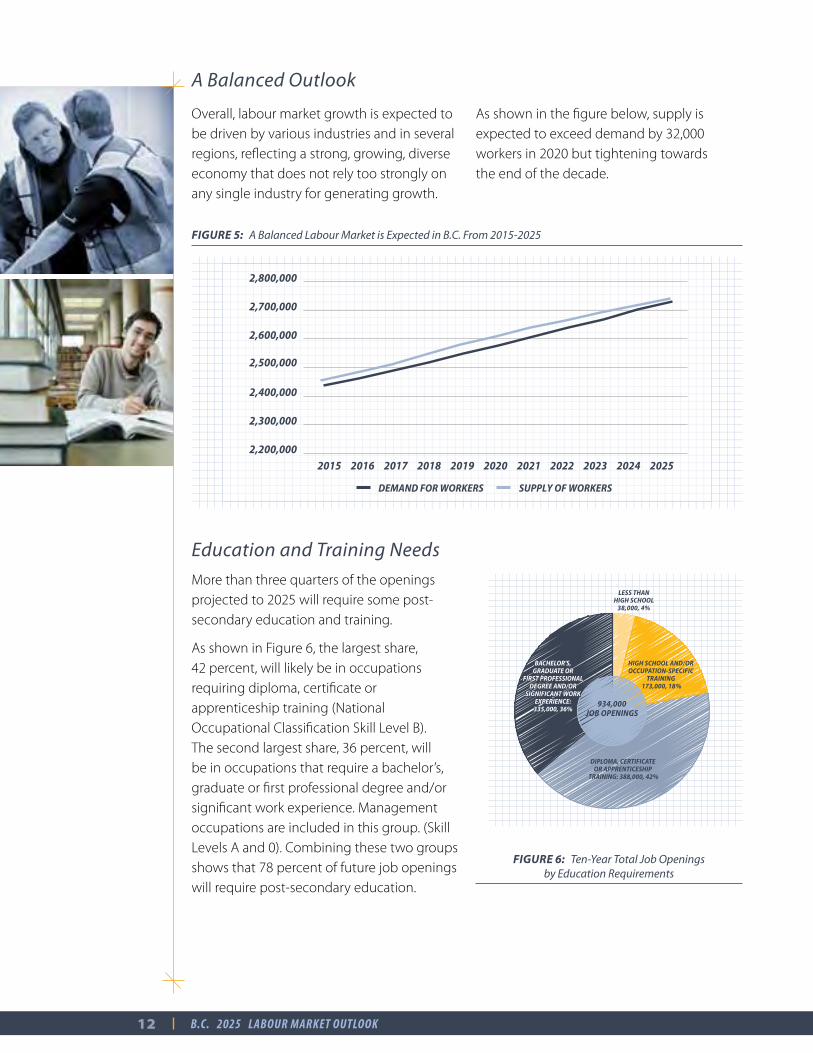
Overall, labour market growth is expected to be driven by various industries and in several regions, reflecting a strong, growing, diverse economy that does not rely too strongly on any single industry for generating growth
As shown in the figure below, supply is expected to exceed demand by 32,000 workers in 2020 but tightening towards the end of the decade
FIGURE 5: A Balanced Labour Market is Expected in B.C. From 2015-2025
2,200,000
2,300,000
2,400,000
2,500,000
2,600,000
2,700,000
2,800,000
2015 2016 2017 2018 2019 2020 2021 2022 2023 2024 2025
DEMAND FOR WORKERS SUPPLY OF WORKERS
Education and Training Needs
More than three quarters of the openings projected to 2025 will require some post-secondary education and training
As shown in Figure 6, the largest share, 42 percent, will likely be in occupations requiring diploma, certificate or apprenticeship training (National Occupational Classification Skill Level B) The second largest share, 36 percent, will be in occupations that require a bachelor’s, graduate or first professional degree and/or significant work experience Management occupations are included in this group (Skill Levels A and 0) Combining these two groups shows that 78 percent of future job openings will require post-secondary education
BACHELOR'S, GRADUATE OR
FIRST PROFESSIONAL DEGREE AND/OR
SIGNIFICANT WORK EXPERIENCE:
335,000, 36%
HIGH SCHOOL AND/OR OCCUPATION-SPECIFIC
TRAINING 173,000, 18%
LESS THANHIGH SCHOOL
38,000, 4%
DIPLOMA, CERTIFICATE OR APPRENTICESHIP
TRAINING: 388,000, 42%
934,000JOB OPENINGS
BACHELOR'S, GRADUATE OR
FIRST PROFESSIONAL DEGREE AND/OR
SIGNIFICANT WORK EXPERIENCE:
335,000, 36%
FIGURE 6: Ten-Year Total Job Openings by Education Requirements
12 B.C. 2025 LABOUR MARKET OUTLOOK
Skills and Competencies in British Columbia
Education and training are important means for developing the workforce that British Columbia needs Skills such as literacy and numeracy and competencies such as problem solving and critical thinking are also critical
The growing knowledge economy highlights the importance of skilled workers in advancing economic growth and job creation A shift to a knowledge economy also reshapes labour demand in British Columbia As Lemieux 1 (2014) suggests, education helps workers get assigned to higher-paying occupations where output is more sensitive to skill In addition, the return to education varies greatly depending on
occupation, field of study, and the match between these two factors
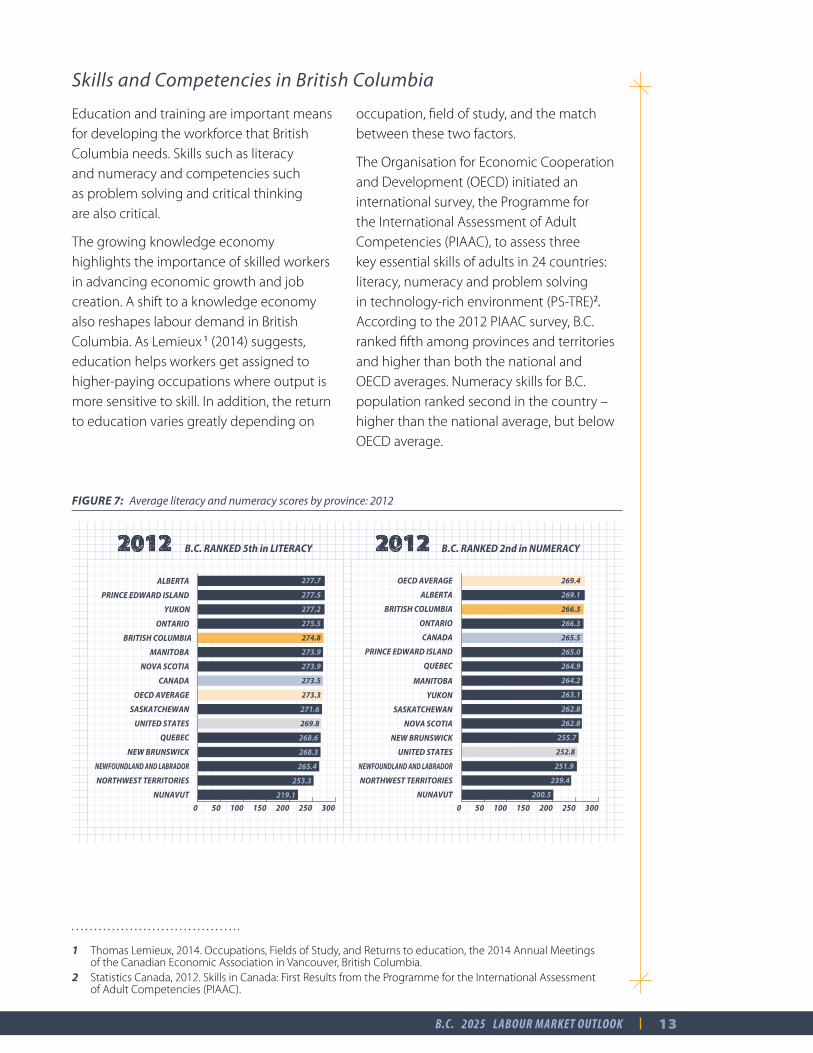
The Organisation for Economic Cooperation and Development (OECD) initiated an international survey, the Programme for the International Assessment of Adult Competencies (PIAAC), to assess three key essential skills of adults in 24 countries: literacy, numeracy and problem solving in technology-rich environment (PS-TRE)2.According to the 2012 PIAAC survey, B C ranked fifth among provinces and territories and higher than both the national and OECD averages Numeracy skills for B C population ranked second in the country – higher than the national average, but below OECD average
FIGURE 7: Average literacy and numeracy scores by province: 2012
0 50 100 150 200 250 300
219.1
253.3
265.4
268.3
268.6
269.8
271.6
273.3
273.5
273.9
273.9
274.8
275.5
277.2
277.5
277.7
0 50 100 150 200 250 300
200.5
239.4
251.9
252.8
255.7
262.8
262.8
263.1
264.2
264.9
265.0
265.5
266.3
266.3
269.1
269.4
B.C. RANKED 5th in LITERACY B.C. RANKED 2nd in NUMERACY
1 Thomas Lemieux, 2014 Occupations, Fields of Study, and Returns to education, the 2014 Annual Meetings of the Canadian Economic Association in Vancouver, British Columbia
2 Statistics Canada, 2012 Skills in Canada: First Results from the Programme for the International Assessment of Adult Competencies (PIAAC)
13B.C. 2025 LABOUR MARKET OUTLOOK
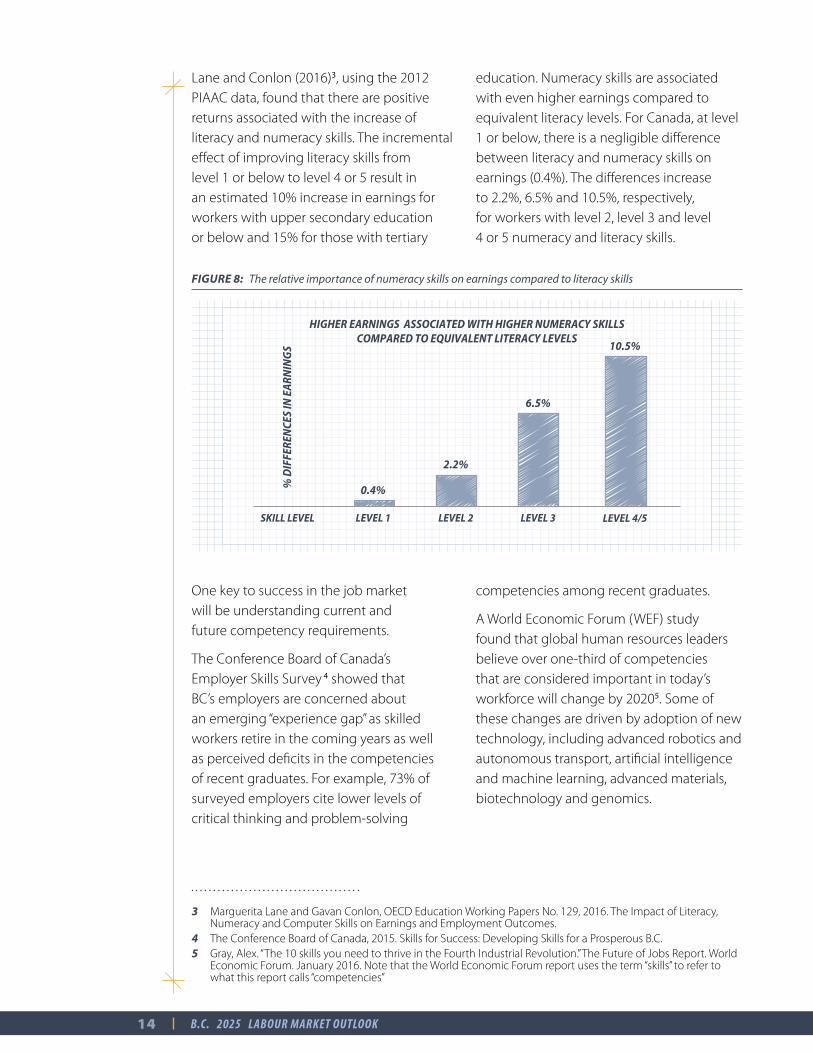
Lane and Conlon (2016)3, using the 2012 PIAAC data, found that there are positive returns associated with the increase of literacy and numeracy skills The incremental effect of improving literacy skills from level 1 or below to level 4 or 5 result in an estimated 10% increase in earnings for workers with upper secondary education or below and 15% for those with tertiary
education Numeracy skills are associated with even higher earnings compared to equivalent literacy levels For Canada, at level 1 or below, there is a negligible difference between literacy and numeracy skills on earnings (0 4%) The differences increase to 2 2%, 6 5% and 10 5%, respectively, for workers with level 2, level 3 and level 4 or 5 numeracy and literacy skills
FIGURE 8: The relative importance of numeracy skills on earnings compared to literacy skills
HIGHER EARNINGS ASSOCIATED WITH HIGHER NUMERACY SKILLS COMPARED TO EQUIVALENT LITERACY LEVELS
% D
IFFE
REN
CES
IN E
ARN
ING
S
SKILL LEVEL
0.4%
LEVEL 1
2.2%
LEVEL 2
6.5%
LEVEL 3
10.5%
LEVEL 4/5
One key to success in the job market will be understanding current and future competency requirements
The Conference Board of Canada’s Employer Skills Survey 4 showed that BC’s employers are concerned about an emerging “experience gap” as skilled workers retire in the coming years as well as perceived deficits in the competencies of recent graduates For example, 73% of surveyed employers cite lower levels of critical thinking and problem-solving
competencies among recent graduates
A World Economic Forum (WEF) study found that global human resources leaders believe over one-third of competencies that are considered important in today’s workforce will change by 20205 Some of these changes are driven by adoption of new technology, including advanced robotics and autonomous transport, artificial intelligence and machine learning, advanced materials, biotechnology and genomics
3 Marguerita Lane and Gavan Conlon, OECD Education Working Papers No 129, 2016 The Impact of Literacy, Numeracy and Computer Skills on Earnings and Employment Outcomes
4 The Conference Board of Canada, 2015 Skills for Success: Developing Skills for a Prosperous B C 5 Gray, Alex “The 10 skills you need to thrive in the Fourth Industrial Revolution ” The Future of Jobs Report World
Economic Forum January 2016 Note that the World Economic Forum report uses the term “skills” to refer to what this report calls “competencies”
14 B.C. 2025 LABOUR MARKET OUTLOOK
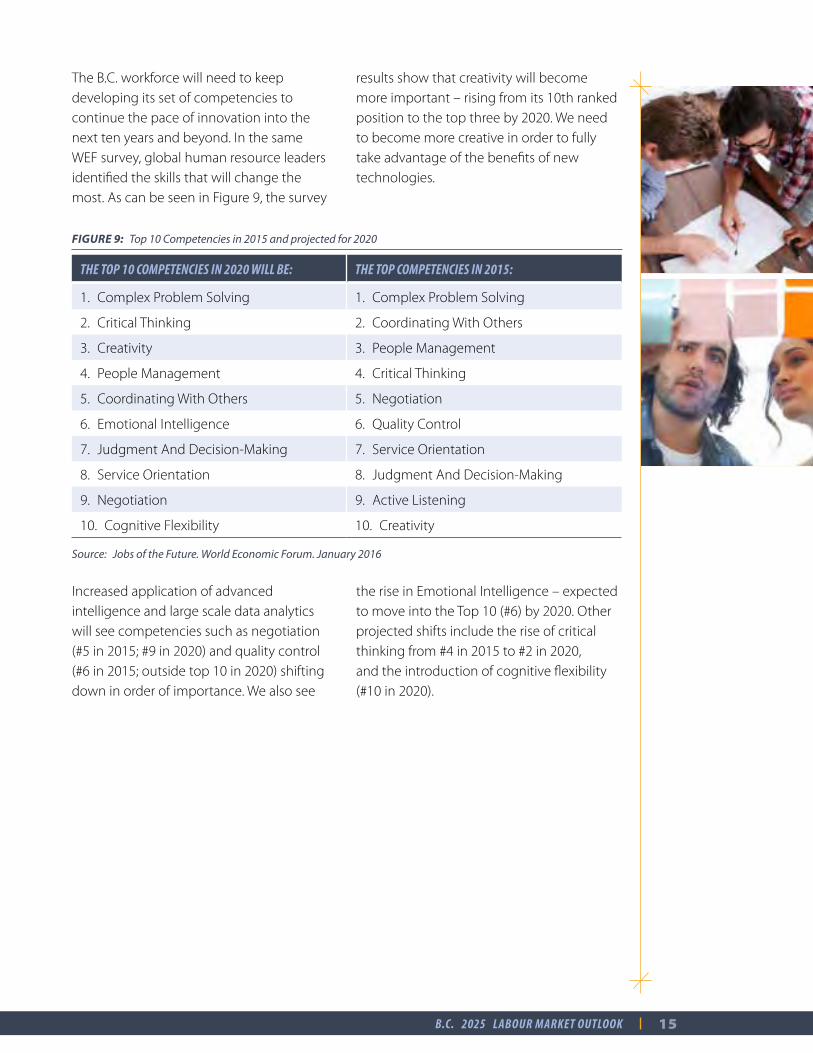
The B C workforce will need to keep developing its set of competencies to continue the pace of innovation into the next ten years and beyond In the same WEF survey, global human resource leaders identified the skills that will change the most As can be seen in Figure 9, the survey
results show that creativity will become more important – rising from its 10th ranked position to the top three by 2020 We need to become more creative in order to fully take advantage of the benefits of new technologies
FIGURE 9: Top 10 Competencies in 2015 and projected for 2020
THE TOP 10 COMPETENCIES IN 2020 WILL BE: THE TOP COMPETENCIES IN 2015:
1 Complex Problem Solving 1 Complex Problem Solving
2 Critical Thinking 2 Coordinating With Others
3 Creativity 3 People Management
4 People Management 4 Critical Thinking
5 Coordinating With Others 5 Negotiation
6 Emotional Intelligence 6 Quality Control
7 Judgment And Decision-Making 7 Service Orientation
8 Service Orientation 8 Judgment And Decision-Making
9 Negotiation 9 Active Listening
10 Cognitive Flexibility 10 Creativity
Source: Jobs of the Future. World Economic Forum. January 2016
Increased application of advanced intelligence and large scale data analytics will see competencies such as negotiation (#5 in 2015; #9 in 2020) and quality control (#6 in 2015; outside top 10 in 2020) shifting down in order of importance We also see
the rise in Emotional Intelligence – expected to move into the Top 10 (#6) by 2020 Other projected shifts include the rise of critical thinking from #4 in 2015 to #2 in 2020, and the introduction of cognitive flexibility (#10 in 2020)
15B.C. 2025 LABOUR MARKET OUTLOOK
Occupation Outlook
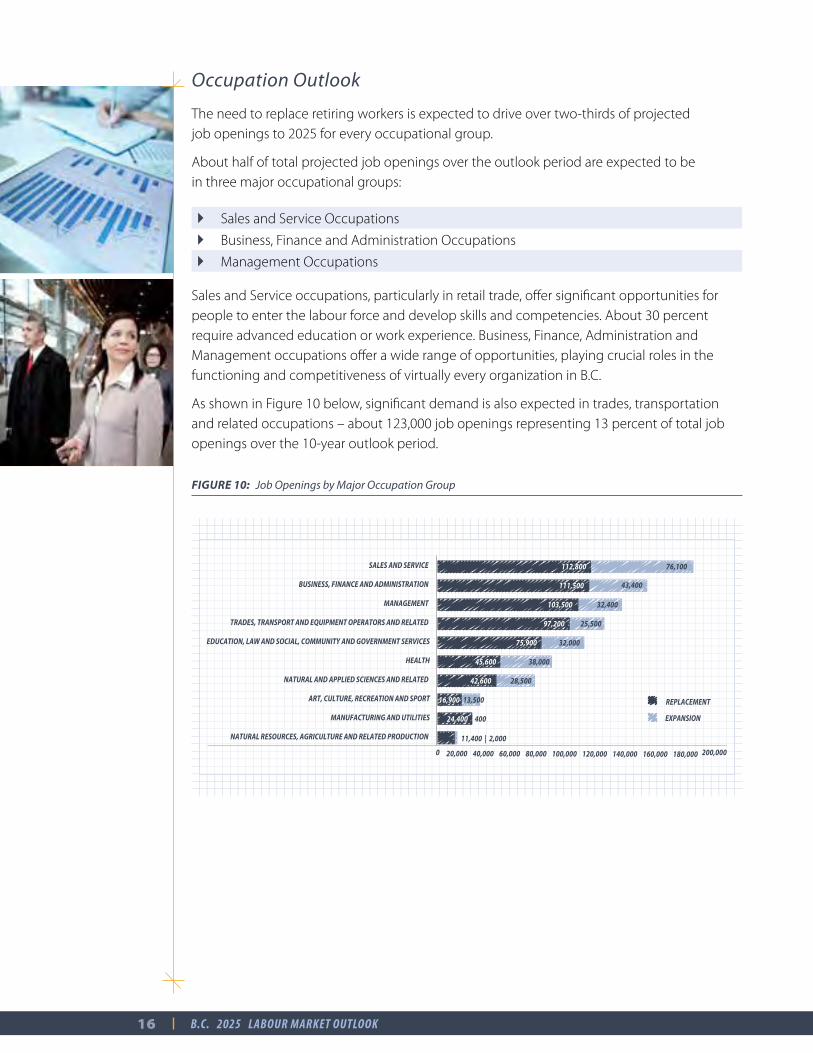
The need to replace retiring workers is expected to drive over two-thirds of projected job openings to 2025 for every occupational group
About half of total projected job openings over the outlook period are expected to be in three major occupational groups:
} Sales and Service Occupations
} Business, Finance and Administration Occupations
} Management Occupations
Sales and Service occupations, particularly in retail trade, offer significant opportunities for people to enter the labour force and develop skills and competencies About 30 percent require advanced education or work experience Business, Finance, Administration and Management occupations offer a wide range of opportunities, playing crucial roles in the functioning and competitiveness of virtually every organization in B C
As shown in Figure 10 below, significant demand is also expected in trades, transportation and related occupations – about 123,000 job openings representing 13 percent of total job openings over the 10-year outlook period
FIGURE 10: Job Openings by Major Occupation Group
112,800
111,500
103,500
97,200
75,900
45,600
42,600
16,900
24,400
11,400 | 2,000
76,100
43,400
32,400
25,500
32,000
38,000
28,500
13,500
400
0 20,000 40,000 60,000 80,000 100,000 120,000 140,000 160,000 180,000 200,000
SALES AND SERVICE
BUSINESS, FINANCE AND ADMINISTRATION
MANAGEMENT
TRADES, TRANSPORT AND EQUIPMENT OPERATORS AND RELATED
EDUCATION, LAW AND SOCIAL, COMMUNITY AND GOVERNMENT SERVICES
HEALTH
NATURAL AND APPLIED SCIENCES AND RELATED
ART, CULTURE, RECREATION AND SPORT
MANUFACTURING AND UTILITIES
NATURAL RESOURCES, AGRICULTURE AND RELATED PRODUCTION
REPLACEMENT
EXPANSION
16 B.C. 2025 LABOUR MARKET OUTLOOK
Industry Outlook
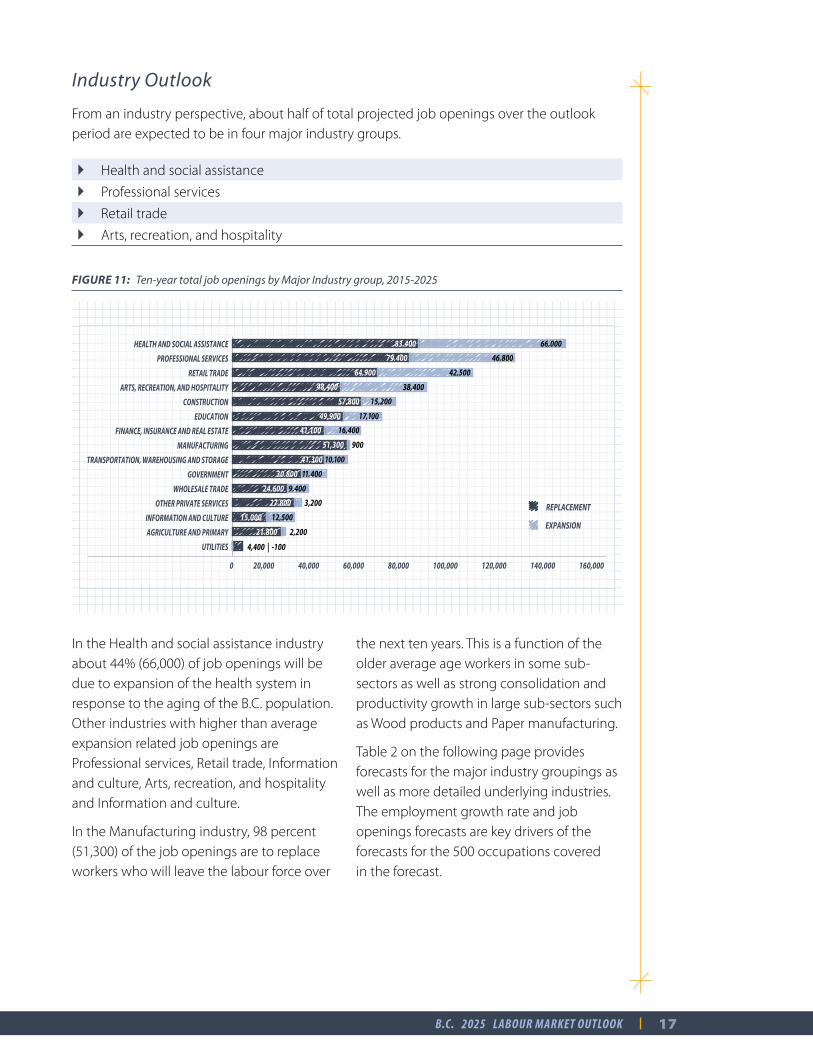
From an industry perspective, about half of total projected job openings over the outlook period are expected to be in four major industry groups
} Health and social assistance
} Professional services
} Retail trade
} Arts, recreation, and hospitality
FIGURE 11: Ten-year total job openings by Major Industry group, 2015-2025
83,400
79,400
64,900
48,400
57,800
49,900
41,100
51,300
41,300
30,800
24,600
27,800
15,000
21,800
66,000
46,800
42,500
38,400
15,200
17,100
16,400
900
10,100
11,400
9,400
3,200
12,500
2,200
0 20,000 40,000 60,000 80,000 100,000 120,000 140,000 160,000
HEALTH AND SOCIAL ASSISTANCE
PROFESSIONAL SERVICES
RETAIL TRADE
ARTS, RECREATION, AND HOSPITALITY
CONSTRUCTION
EDUCATION
FINANCE, INSURANCE AND REAL ESTATE
MANUFACTURING
TRANSPORTATION, WAREHOUSING AND STORAGE
GOVERNMENT
WHOLESALE TRADE
OTHER PRIVATE SERVICES
INFORMATION AND CULTURE
AGRICULTURE AND PRIMARY
UTILITIES
REPLACEMENT
EXPANSION
4,400 | -100
In the Health and social assistance industry about 44% (66,000) of job openings will be due to expansion of the health system in response to the aging of the B C population Other industries with higher than average expansion related job openings are Professional services, Retail trade, Information and culture, Arts, recreation, and hospitality and Information and culture
In the Manufacturing industry, 98 percent (51,300) of the job openings are to replace workers who will leave the labour force over
the next ten years This is a function of the older average age workers in some sub-sectors as well as strong consolidation and productivity growth in large sub-sectors such as Wood products and Paper manufacturing
Table 2 on the following page provides forecasts for the major industry groupings as well as more detailed underlying industries The employment growth rate and job openings forecasts are key drivers of the forecasts for the 500 occupations covered in the forecast
17B.C. 2025 LABOUR MARKET OUTLOOK
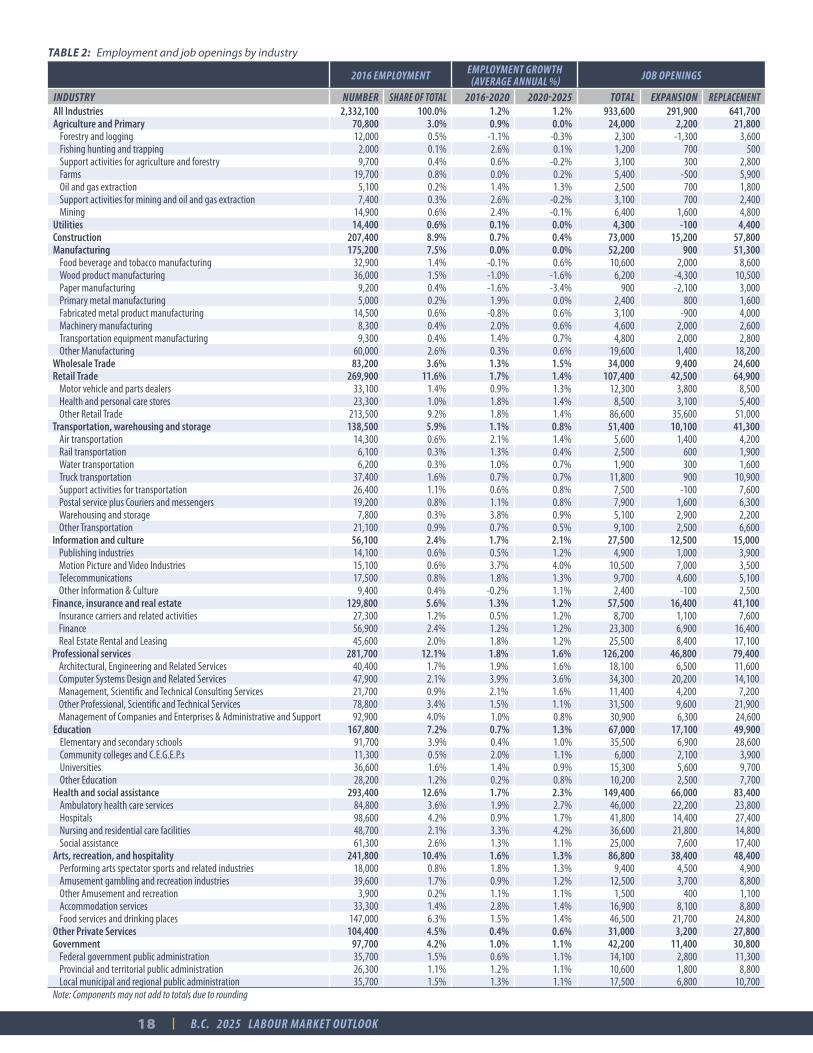
TABLE 2: Employment and job openings by industry
2016 EMPLOYMENT EMPLOYMENT GROWTH (AVERAGE ANNUAL %) JOB OPENINGS
INDUSTRY NUMBER SHARE OF TOTAL 2016-2020 2020-2025 TOTAL EXPANSION REPLACEMENTAll Industries 2,332,100 100.0% 1.2% 1.2% 933,600 291,900 641,700Agriculture and Primary 70,800 3.0% 0.9% 0.0% 24,000 2,200 21,800
Forestry and logging 12,000 0.5% -1.1% -0.3% 2,300 -1,300 3,600Fishing hunting and trapping 2,000 0.1% 2.6% 0.1% 1,200 700 500Support activities for agriculture and forestry 9,700 0.4% 0.6% -0.2% 3,100 300 2,800Farms 19,700 0.8% 0.0% 0.2% 5,400 -500 5,900Oil and gas extraction 5,100 0.2% 1.4% 1.3% 2,500 700 1,800Support activities for mining and oil and gas extraction 7,400 0.3% 2.6% -0.2% 3,100 700 2,400Mining 14,900 0.6% 2.4% -0.1% 6,400 1,600 4,800
Utilities 14,400 0.6% 0.1% 0.0% 4,300 -100 4,400Construction 207,400 8.9% 0.7% 0.4% 73,000 15,200 57,800Manufacturing 175,200 7.5% 0.0% 0.0% 52,200 900 51,300
Food beverage and tobacco manufacturing 32,900 1.4% -0.1% 0.6% 10,600 2,000 8,600Wood product manufacturing 36,000 1.5% -1.0% -1.6% 6,200 -4,300 10,500Paper manufacturing 9,200 0.4% -1.6% -3.4% 900 -2,100 3,000Primary metal manufacturing 5,000 0.2% 1.9% 0.0% 2,400 800 1,600Fabricated metal product manufacturing 14,500 0.6% -0.8% 0.6% 3,100 -900 4,000Machinery manufacturing 8,300 0.4% 2.0% 0.6% 4,600 2,000 2,600Transportation equipment manufacturing 9,300 0.4% 1.4% 0.7% 4,800 2,000 2,800Other Manufacturing 60,000 2.6% 0.3% 0.6% 19,600 1,400 18,200
Wholesale Trade 83,200 3.6% 1.3% 1.5% 34,000 9,400 24,600Retail Trade 269,900 11.6% 1.7% 1.4% 107,400 42,500 64,900
Motor vehicle and parts dealers 33,100 1.4% 0.9% 1.3% 12,300 3,800 8,500Health and personal care stores 23,300 1.0% 1.8% 1.4% 8,500 3,100 5,400Other Retail Trade 213,500 9.2% 1.8% 1.4% 86,600 35,600 51,000
Transportation, warehousing and storage 138,500 5.9% 1.1% 0.8% 51,400 10,100 41,300Air transportation 14,300 0.6% 2.1% 1.4% 5,600 1,400 4,200Rail transportation 6,100 0.3% 1.3% 0.4% 2,500 600 1,900Water transportation 6,200 0.3% 1.0% 0.7% 1,900 300 1,600Truck transportation 37,400 1.6% 0.7% 0.7% 11,800 900 10,900Support activities for transportation 26,400 1.1% 0.6% 0.8% 7,500 -100 7,600Postal service plus Couriers and messengers 19,200 0.8% 1.1% 0.8% 7,900 1,600 6,300Warehousing and storage 7,800 0.3% 3.8% 0.9% 5,100 2,900 2,200Other Transportation 21,100 0.9% 0.7% 0.5% 9,100 2,500 6,600
Information and culture 56,100 2.4% 1.7% 2.1% 27,500 12,500 15,000Publishing industries 14,100 0.6% 0.5% 1.2% 4,900 1,000 3,900Motion Picture and Video Industries 15,100 0.6% 3.7% 4.0% 10,500 7,000 3,500Telecommunications 17,500 0.8% 1.8% 1.3% 9,700 4,600 5,100Other Information & Culture 9,400 0.4% -0.2% 1.1% 2,400 -100 2,500
Finance, insurance and real estate 129,800 5.6% 1.3% 1.2% 57,500 16,400 41,100Insurance carriers and related activities 27,300 1.2% 0.5% 1.2% 8,700 1,100 7,600Finance 56,900 2.4% 1.2% 1.2% 23,300 6,900 16,400Real Estate Rental and Leasing 45,600 2.0% 1.8% 1.2% 25,500 8,400 17,100
Professional services 281,700 12.1% 1.8% 1.6% 126,200 46,800 79,400Architectural, Engineering and Related Services 40,400 1.7% 1.9% 1.6% 18,100 6,500 11,600Computer Systems Design and Related Services 47,900 2.1% 3.9% 3.6% 34,300 20,200 14,100Management, Scientific and Technical Consulting Services 21,700 0.9% 2.1% 1.6% 11,400 4,200 7,200Other Professional, Scientific and Technical Services 78,800 3.4% 1.5% 1.1% 31,500 9,600 21,900Management of Companies and Enterprises & Administrative and Support 92,900 4.0% 1.0% 0.8% 30,900 6,300 24,600
Education 167,800 7.2% 0.7% 1.3% 67,000 17,100 49,900Elementary and secondary schools 91,700 3.9% 0.4% 1.0% 35,500 6,900 28,600Community colleges and C.E.G.E.P.s 11,300 0.5% 2.0% 1.1% 6,000 2,100 3,900Universities 36,600 1.6% 1.4% 0.9% 15,300 5,600 9,700Other Education 28,200 1.2% 0.2% 0.8% 10,200 2,500 7,700
Health and social assistance 293,400 12.6% 1.7% 2.3% 149,400 66,000 83,400Ambulatory health care services 84,800 3.6% 1.9% 2.7% 46,000 22,200 23,800Hospitals 98,600 4.2% 0.9% 1.7% 41,800 14,400 27,400Nursing and residential care facilities 48,700 2.1% 3.3% 4.2% 36,600 21,800 14,800Social assistance 61,300 2.6% 1.3% 1.1% 25,000 7,600 17,400
Arts, recreation, and hospitality 241,800 10.4% 1.6% 1.3% 86,800 38,400 48,400Performing arts spectator sports and related industries 18,000 0.8% 1.8% 1.3% 9,400 4,500 4,900Amusement gambling and recreation industries 39,600 1.7% 0.9% 1.2% 12,500 3,700 8,800Other Amusement and recreation 3,900 0.2% 1.1% 1.1% 1,500 400 1,100Accommodation services 33,300 1.4% 2.8% 1.4% 16,900 8,100 8,800Food services and drinking places 147,000 6.3% 1.5% 1.4% 46,500 21,700 24,800
Other Private Services 104,400 4.5% 0.4% 0.6% 31,000 3,200 27,800Government 97,700 4.2% 1.0% 1.1% 42,200 11,400 30,800
Federal government public administration 35,700 1.5% 0.6% 1.1% 14,100 2,800 11,300Provincial and territorial public administration 26,300 1.1% 1.2% 1.1% 10,600 1,800 8,800Local municipal and regional public administration 35,700 1.5% 1.3% 1.1% 17,500 6,800 10,700
Note: Components may not add to totals due to rounding
18 B.C. 2025 LABOUR MARKET OUTLOOK

TOP 100 HIGH OPPORTUNITY OCCUPATIONS
How is the Top 100 list used?
Over the years to 2025, the projected 934,000 job openings across 500 occupations in the province offer opportunities in every sector of the economy and across the regions However, naturally, some occupations will have relatively better prospects for job seekers than others To prepare our workforce for these opportunities with required education and training, it is important to identify these occupations well in advance
The most general use of the list is to guide the education and career choices of B C ’s residents and those planning a move to B C to seek employment For this purpose, in addition to being provided in this report,
it is also included in the B C Parents’ Guide (workbc.ca/parentguide) and the B C Grad Planner
The list is also available for the post-secondary education sector to use as a guide when incrementally realigning its resources to labour market demand Occupations removed from the list will not necessarily have ongoing operating funding streams reduced, but will be less likely to receive incremental capital expenditure allocations
The list is also used as an input in deciding on the allocation of a range of incremental labour market program funding and selection criteria
DID YOU KNOW?Skills such as literacy and numeracy, and competencies such as critical thinking, problem solving and ability to work with others, are as important as formal education for career development.
19B.C. 2025 LABOUR MARKET OUTLOOK
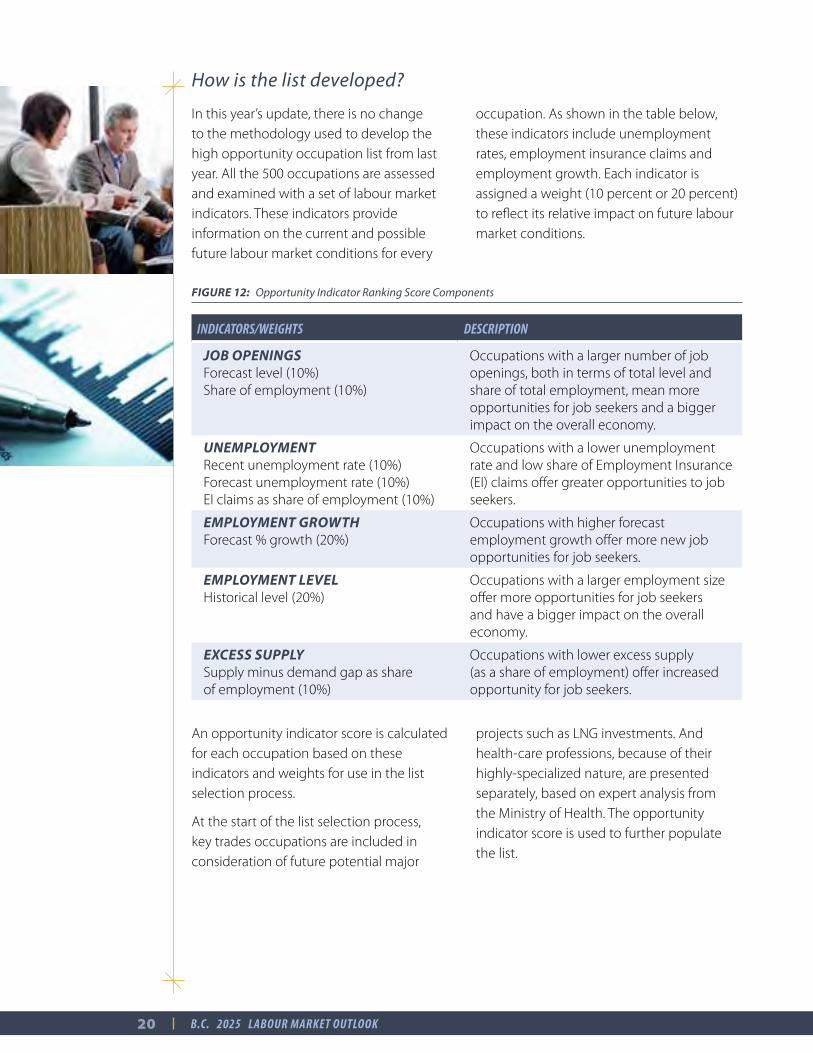
How is the list developed?
In this year’s update, there is no change to the methodology used to develop the high opportunity occupation list from last year All the 500 occupations are assessed and examined with a set of labour market indicators These indicators provide information on the current and possible future labour market conditions for every
occupation As shown in the table below, these indicators include unemployment rates, employment insurance claims and employment growth Each indicator is assigned a weight (10 percent or 20 percent) to reflect its relative impact on future labour market conditions
FIGURE 12: Opportunity Indicator Ranking Score Components
INDICATORS/WEIGHTS DESCRIPTION
JOB OPENINGSForecast level (10%) Share of employment (10%)
Occupations with a larger number of job openings, both in terms of total level and share of total employment, mean more opportunities for job seekers and a bigger impact on the overall economy
UNEMPLOYMENTRecent unemployment rate (10%) Forecast unemployment rate (10%) EI claims as share of employment (10%)
Occupations with a lower unemployment rate and low share of Employment Insurance (EI) claims offer greater opportunities to job seekers
EMPLOYMENT GROWTHForecast % growth (20%)
Occupations with higher forecast employment growth offer more new job opportunities for job seekers
EMPLOYMENT LEVELHistorical level (20%)
Occupations with a larger employment size offer more opportunities for job seekers and have a bigger impact on the overall economy
EXCESS SUPPLYSupply minus demand gap as share of employment (10%)
Occupations with lower excess supply (as a share of employment) offer increased opportunity for job seekers
An opportunity indicator score is calculated for each occupation based on these indicators and weights for use in the list selection process
At the start of the list selection process, key trades occupations are included in consideration of future potential major
projects such as LNG investments And health-care professions, because of their highly-specialized nature, are presented separately, based on expert analysis from the Ministry of Health The opportunity indicator score is used to further populate the list
20 B.C. 2025 LABOUR MARKET OUTLOOK
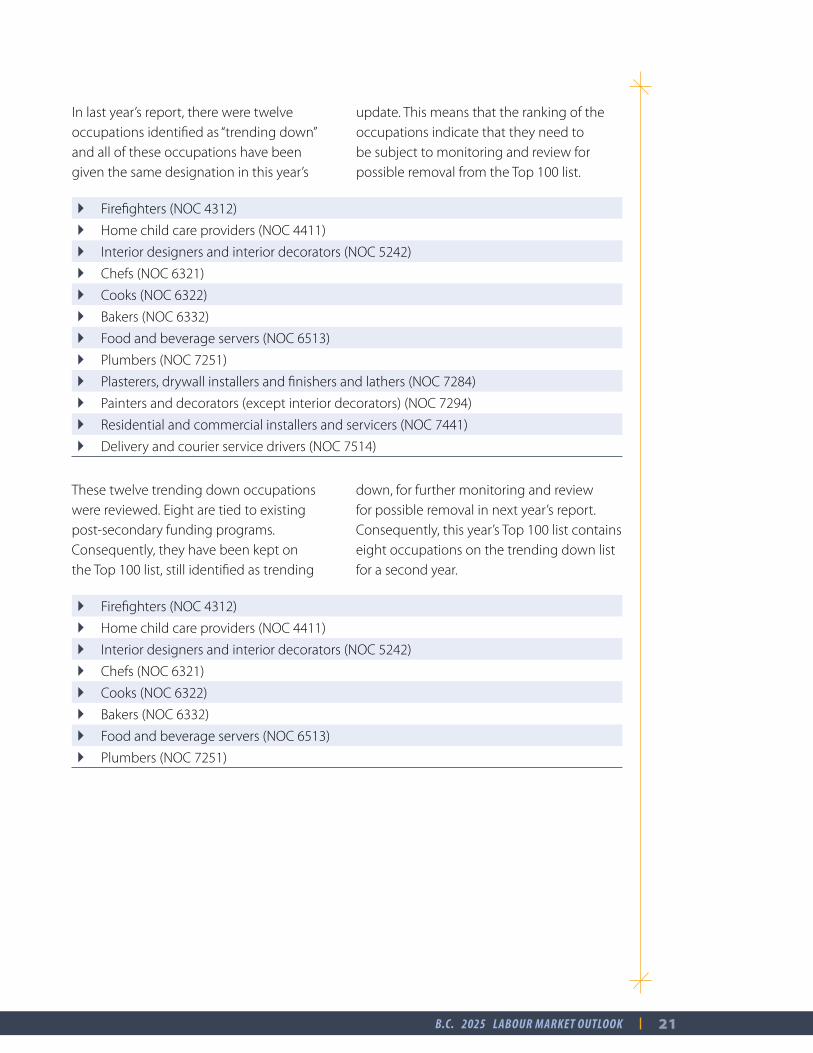
In last year’s report, there were twelve occupations identified as “trending down” and all of these occupations have been given the same designation in this year’s
update This means that the ranking of the occupations indicate that they need to be subject to monitoring and review for possible removal from the Top 100 list
} Firefighters (NOC 4312)
} Home child care providers (NOC 4411)
} Interior designers and interior decorators (NOC 5242)
} Chefs (NOC 6321)
} Cooks (NOC 6322)
} Bakers (NOC 6332)
} Food and beverage servers (NOC 6513)
} Plumbers (NOC 7251)
} Plasterers, drywall installers and finishers and lathers (NOC 7284)
} Painters and decorators (except interior decorators) (NOC 7294)
} Residential and commercial installers and servicers (NOC 7441)
} Delivery and courier service drivers (NOC 7514)
These twelve trending down occupations were reviewed Eight are tied to existing post-secondary funding programs Consequently, they have been kept on the Top 100 list, still identified as trending
down, for further monitoring and review for possible removal in next year’s report Consequently, this year’s Top 100 list contains eight occupations on the trending down list for a second year
} Firefighters (NOC 4312)
} Home child care providers (NOC 4411)
} Interior designers and interior decorators (NOC 5242)
} Chefs (NOC 6321)
} Cooks (NOC 6322)
} Bakers (NOC 6332)
} Food and beverage servers (NOC 6513)
} Plumbers (NOC 7251)
21B.C. 2025 LABOUR MARKET OUTLOOK
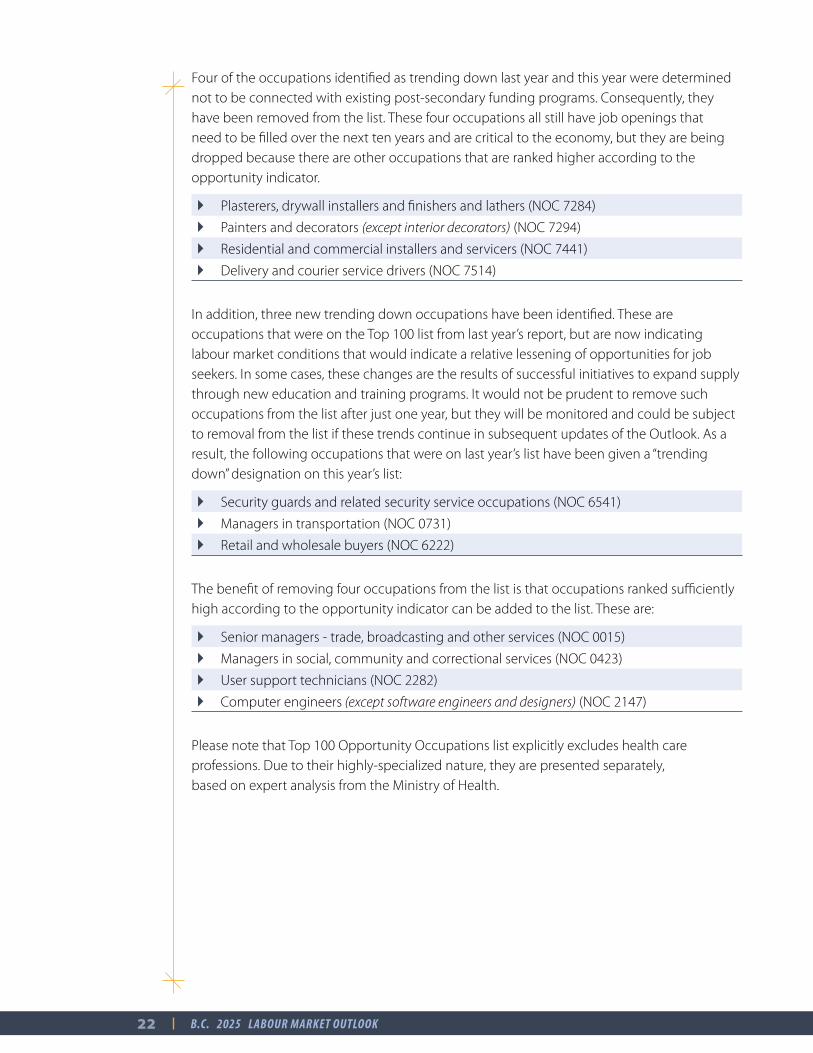
Four of the occupations identified as trending down last year and this year were determined not to be connected with existing post-secondary funding programs Consequently, they have been removed from the list These four occupations all still have job openings that need to be filled over the next ten years and are critical to the economy, but they are being dropped because there are other occupations that are ranked higher according to the opportunity indicator
} Plasterers, drywall installers and finishers and lathers (NOC 7284)
} Painters and decorators (except interior decorators) (NOC 7294)
} Residential and commercial installers and servicers (NOC 7441)
} Delivery and courier service drivers (NOC 7514)
In addition, three new trending down occupations have been identified These are occupations that were on the Top 100 list from last year’s report, but are now indicating labour market conditions that would indicate a relative lessening of opportunities for job seekers In some cases, these changes are the results of successful initiatives to expand supply through new education and training programs It would not be prudent to remove such occupations from the list after just one year, but they will be monitored and could be subject to removal from the list if these trends continue in subsequent updates of the Outlook As a result, the following occupations that were on last year’s list have been given a “trending down” designation on this year’s list:
} Security guards and related security service occupations (NOC 6541)
} Managers in transportation (NOC 0731)
} Retail and wholesale buyers (NOC 6222)
The benefit of removing four occupations from the list is that occupations ranked sufficiently high according to the opportunity indicator can be added to the list These are:
} Senior managers - trade, broadcasting and other services (NOC 0015)
} Managers in social, community and correctional services (NOC 0423)
} User support technicians (NOC 2282)
} Computer engineers (except software engineers and designers) (NOC 2147)
Please note that Top 100 Opportunity Occupations list explicitly excludes health care professions Due to their highly-specialized nature, they are presented separately, based on expert analysis from the Ministry of Health
22 B.C. 2025 LABOUR MARKET OUTLOOK

High Opportunity Health Occupations
B C ’s health sector employed 227,000 workers in 20156, one of the largest sectors in terms of the number of workers The sector is also one of the fastest-growing industries, with employment growing at an average rate of 3 2 percent each year in the past decade, much higher than the 1 0 percent provincial average over the same period
Employment in the health sector is forecast to increase by an annual average rate of 2 3 per cent to 2025
2015 TOP PRIORITY HEALTH PROFESSIONS
1 Registered Nurse – Specialty Specialties include the following:
} Intensive Care Unit/Critical Care (ICU/CC) } Emergency Room (ER) } Operating Room/Post Anesthetic Recovery Room (OR/PARR) } Mental Health } Perinatal } Medical/Surgical
2 Physiotherapist
3 Registered Nurse - General
4 Nurse Practitioner
5 Occupational Therapist
6 Diagnostic Medical Sonographer (Ultrasonographer)
7 Medical Laboratory Technician
8 Licensed Practical Nurse (LPN)
9 Respiratory Therapist
10 Care Aide/Health Care Assistant
There is also a need for physicians For more on opportunities in the health-care sector, go to http://www.healthmatchbc.org/.
6 Statistics Canada, Labour Force Survey, as provided by BC Stats
23B.C. 2025 LABOUR MARKET OUTLOOK
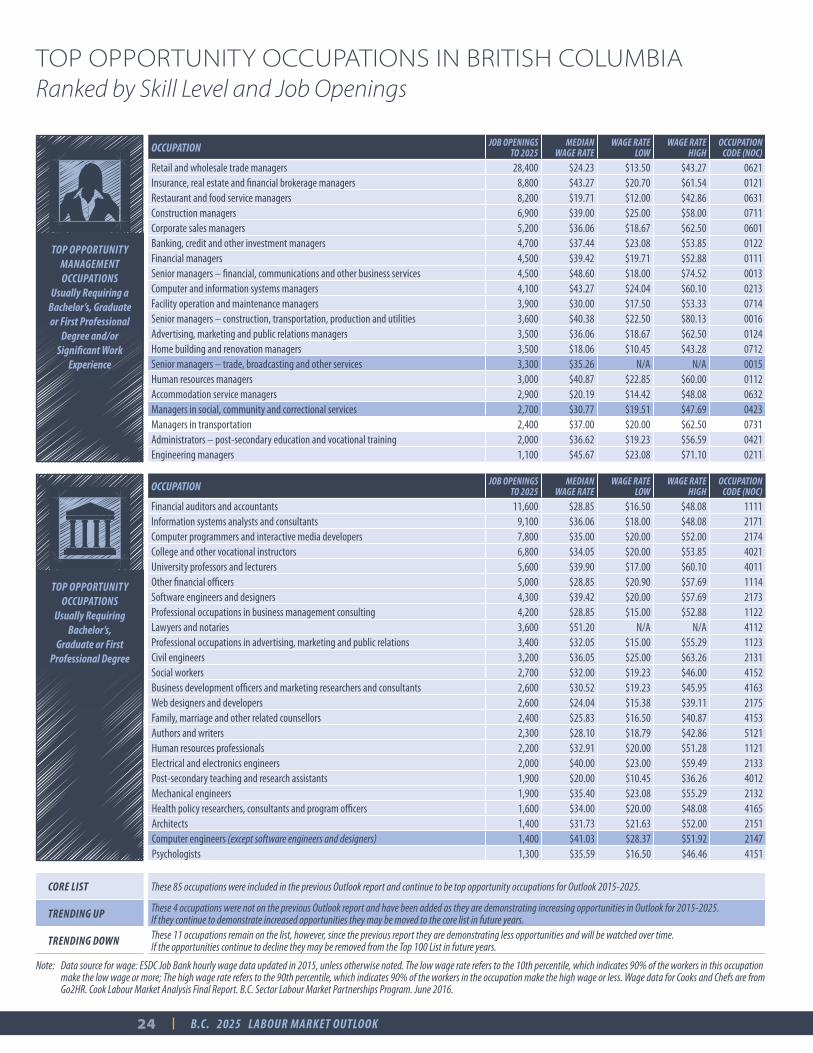
CORE LIST These 85 occupations were included in the previous Outlook report and continue to be top opportunity occupations for Outlook 2015-2025.
TRENDING UP These 4 occupations were not on the previous Outlook report and have been added as they are demonstrating increasing opportunities in Outlook for 2015-2025. If they continue to demonstrate increased opportunities they may be moved to the core list in future years.
TRENDING DOWN These 11 occupations remain on the list, however, since the previous report they are demonstrating less opportunities and will be watched over time. If the opportunities continue to decline they may be removed from the Top 100 List in future years.
OCCUPATION JOB OPENINGS TO 2025
MEDIAN WAGE RATE
WAGE RATE LOW
WAGE RATE HIGH
OCCUPATION CODE (NOC)
Retail and wholesale trade managers 28,400 $24.23 $13.50 $43.27 0621Insurance, real estate and financial brokerage managers 8,800 $43.27 $20.70 $61.54 0121Restaurant and food service managers 8,200 $19.71 $12.00 $42.86 0631Construction managers 6,900 $39.00 $25.00 $58.00 0711Corporate sales managers 5,200 $36.06 $18.67 $62.50 0601Banking, credit and other investment managers 4,700 $37.44 $23.08 $53.85 0122Financial managers 4,500 $39.42 $19.71 $52.88 0111Senior managers – financial, communications and other business services 4,500 $48.60 $18.00 $74.52 0013Computer and information systems managers 4,100 $43.27 $24.04 $60.10 0213Facility operation and maintenance managers 3,900 $30.00 $17.50 $53.33 0714Senior managers – construction, transportation, production and utilities 3,600 $40.38 $22.50 $80.13 0016Advertising, marketing and public relations managers 3,500 $36.06 $18.67 $62.50 0124Home building and renovation managers 3,500 $18.06 $10.45 $43.28 0712Senior managers – trade, broadcasting and other services 3,300 $35.26 N/A N/A 0015Human resources managers 3,000 $40.87 $22.85 $60.00 0112Accommodation service managers 2,900 $20.19 $14.42 $48.08 0632Managers in social, community and correctional services 2,700 $30.77 $19.51 $47.69 0423Managers in transportation 2,400 $37.00 $20.00 $62.50 0731Administrators – post-secondary education and vocational training 2,000 $36.62 $19.23 $56.59 0421Engineering managers 1,100 $45.67 $23.08 $71.10 0211
TOP OPPORTUNITY MANAGEMENT OCCUPATIONS
Usually Requiring a Bachelor’s, Graduate or First Professional
Degree and/or Significant Work
Experience
OCCUPATION JOB OPENINGS TO 2025
MEDIAN WAGE RATE
WAGE RATE LOW
WAGE RATE HIGH
OCCUPATION CODE (NOC)
Financial auditors and accountants 11,600 $28.85 $16.50 $48.08 1111Information systems analysts and consultants 9,100 $36.06 $18.00 $48.08 2171Computer programmers and interactive media developers 7,800 $35.00 $20.00 $52.00 2174College and other vocational instructors 6,800 $34.05 $20.00 $53.85 4021University professors and lecturers 5,600 $39.90 $17.00 $60.10 4011Other financial officers 5,000 $28.85 $20.90 $57.69 1114Software engineers and designers 4,300 $39.42 $20.00 $57.69 2173Professional occupations in business management consulting 4,200 $28.85 $15.00 $52.88 1122Lawyers and notaries 3,600 $51.20 N/A N/A 4112Professional occupations in advertising, marketing and public relations 3,400 $32.05 $15.00 $55.29 1123Civil engineers 3,200 $36.05 $25.00 $63.26 2131Social workers 2,700 $32.00 $19.23 $46.00 4152Business development officers and marketing researchers and consultants 2,600 $30.52 $19.23 $45.95 4163Web designers and developers 2,600 $24.04 $15.38 $39.11 2175Family, marriage and other related counsellors 2,400 $25.83 $16.50 $40.87 4153Authors and writers 2,300 $28.10 $18.79 $42.86 5121Human resources professionals 2,200 $32.91 $20.00 $51.28 1121Electrical and electronics engineers 2,000 $40.00 $23.00 $59.49 2133Post-secondary teaching and research assistants 1,900 $20.00 $10.45 $36.26 4012Mechanical engineers 1,900 $35.40 $23.08 $55.29 2132Health policy researchers, consultants and program officers 1,600 $34.00 $20.00 $48.08 4165Architects 1,400 $31.73 $21.63 $52.00 2151Computer engineers (except software engineers and designers) 1,400 $41.03 $28.37 $51.92 2147Psychologists 1,300 $35.59 $16.50 $46.46 4151
TOP OPPORTUNITY OCCUPATIONS
Usually Requiring Bachelor’s,
Graduate or First Professional Degree
TOP OPPORTUNITY OCCUPATIONS IN BRITISH COLUMBIA Ranked by Skill Level and Job Openings
Note: Data source for wage: ESDC Job Bank hourly wage data updated in 2015, unless otherwise noted. The low wage rate refers to the 10th percentile, which indicates 90% of the workers in this occupation make the low wage or more; The high wage rate refers to the 90th percentile, which indicates 90% of the workers in the occupation make the high wage or less. Wage data for Cooks and Chefs are from Go2HR. Cook Labour Market Analysis Final Report. B.C. Sector Labour Market Partnerships Program. June 2016.
24 B.C. 2025 LABOUR MARKET OUTLOOK
OCCUPATION JOB OPENINGS TO 2025
MEDIAN WAGE RATE
WAGE RATE LOW
WAGE RATE HIGH
OCCUPATION CODE (NOC)
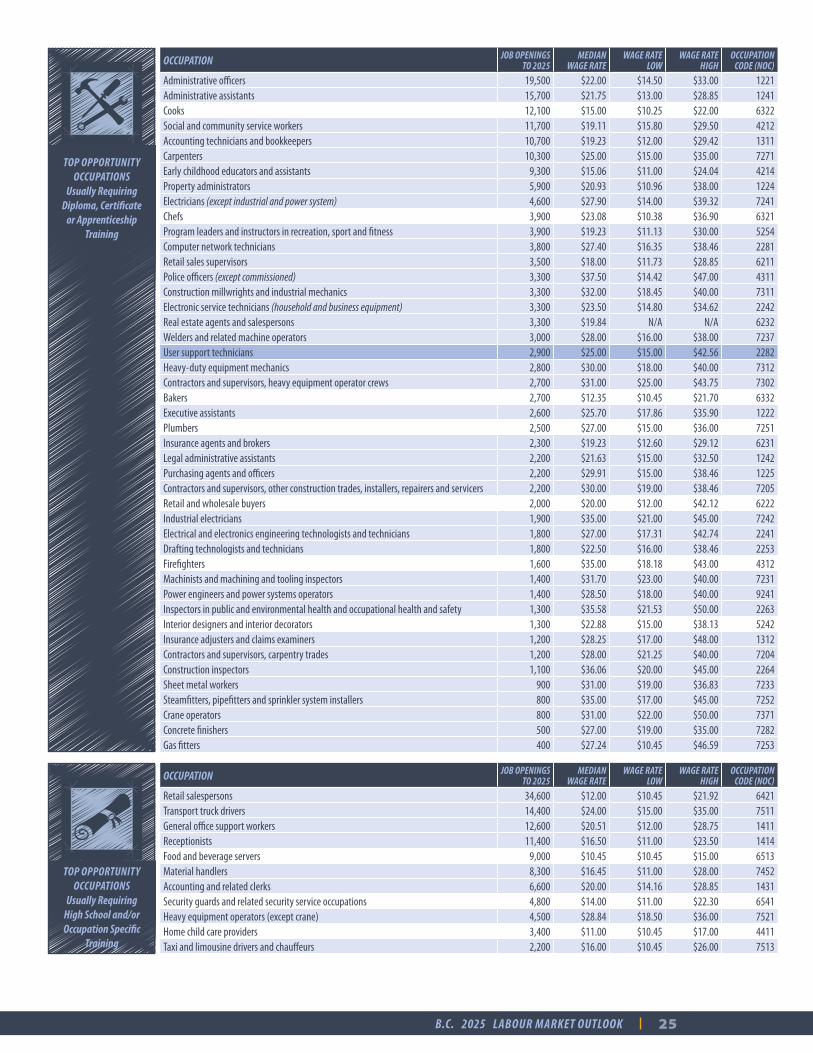
Administrative officers 19,500 $22.00 $14.50 $33.00 1221Administrative assistants 15,700 $21.75 $13.00 $28.85 1241Cooks 12,100 $15.00 $10.25 $22.00 6322Social and community service workers 11,700 $19.11 $15.80 $29.50 4212Accounting technicians and bookkeepers 10,700 $19.23 $12.00 $29.42 1311Carpenters 10,300 $25.00 $15.00 $35.00 7271Early childhood educators and assistants 9,300 $15.06 $11.00 $24.04 4214Property administrators 5,900 $20.93 $10.96 $38.00 1224Electricians (except industrial and power system) 4,600 $27.90 $14.00 $39.32 7241Chefs 3,900 $23.08 $10.38 $36.90 6321Program leaders and instructors in recreation, sport and fitness 3,900 $19.23 $11.13 $30.00 5254Computer network technicians 3,800 $27.40 $16.35 $38.46 2281Retail sales supervisors 3,500 $18.00 $11.73 $28.85 6211Police officers (except commissioned) 3,300 $37.50 $14.42 $47.00 4311Construction millwrights and industrial mechanics 3,300 $32.00 $18.45 $40.00 7311Electronic service technicians (household and business equipment) 3,300 $23.50 $14.80 $34.62 2242Real estate agents and salespersons 3,300 $19.84 N/A N/A 6232Welders and related machine operators 3,000 $28.00 $16.00 $38.00 7237User support technicians 2,900 $25.00 $15.00 $42.56 2282Heavy-duty equipment mechanics 2,800 $30.00 $18.00 $40.00 7312Contractors and supervisors, heavy equipment operator crews 2,700 $31.00 $25.00 $43.75 7302Bakers 2,700 $12.35 $10.45 $21.70 6332Executive assistants 2,600 $25.70 $17.86 $35.90 1222Plumbers 2,500 $27.00 $15.00 $36.00 7251Insurance agents and brokers 2,300 $19.23 $12.60 $29.12 6231Legal administrative assistants 2,200 $21.63 $15.00 $32.50 1242Purchasing agents and officers 2,200 $29.91 $15.00 $38.46 1225Contractors and supervisors, other construction trades, installers, repairers and servicers 2,200 $30.00 $19.00 $38.46 7205Retail and wholesale buyers 2,000 $20.00 $12.00 $42.12 6222Industrial electricians 1,900 $35.00 $21.00 $45.00 7242Electrical and electronics engineering technologists and technicians 1,800 $27.00 $17.31 $42.74 2241Drafting technologists and technicians 1,800 $22.50 $16.00 $38.46 2253Firefighters 1,600 $35.00 $18.18 $43.00 4312Machinists and machining and tooling inspectors 1,400 $31.70 $23.00 $40.00 7231Power engineers and power systems operators 1,400 $28.50 $18.00 $40.00 9241Inspectors in public and environmental health and occupational health and safety 1,300 $35.58 $21.53 $50.00 2263Interior designers and interior decorators 1,300 $22.88 $15.00 $38.13 5242Insurance adjusters and claims examiners 1,200 $28.25 $17.00 $48.00 1312Contractors and supervisors, carpentry trades 1,200 $28.00 $21.25 $40.00 7204Construction inspectors 1,100 $36.06 $20.00 $45.00 2264Sheet metal workers 900 $31.00 $19.00 $36.83 7233Steamfitters, pipefitters and sprinkler system installers 800 $35.00 $17.00 $45.00 7252Crane operators 800 $31.00 $22.00 $50.00 7371Concrete finishers 500 $27.00 $19.00 $35.00 7282Gas fitters 400 $27.24 $10.45 $46.59 7253
TOP OPPORTUNITY OCCUPATIONS
Usually Requiring Diploma, Certificate
or Apprenticeship Training
OCCUPATION JOB OPENINGS TO 2025
MEDIAN WAGE RATE
WAGE RATE LOW
WAGE RATE HIGH
OCCUPATION CODE (NOC)
Retail salespersons 34,600 $12.00 $10.45 $21.92 6421Transport truck drivers 14,400 $24.00 $15.00 $35.00 7511General office support workers 12,600 $20.51 $12.00 $28.75 1411Receptionists 11,400 $16.50 $11.00 $23.50 1414Food and beverage servers 9,000 $10.45 $10.45 $15.00 6513Material handlers 8,300 $16.45 $11.00 $28.00 7452Accounting and related clerks 6,600 $20.00 $14.16 $28.85 1431Security guards and related security service occupations 4,800 $14.00 $11.00 $22.30 6541Heavy equipment operators (except crane) 4,500 $28.84 $18.50 $36.00 7521Home child care providers 3,400 $11.00 $10.45 $17.00 4411Taxi and limousine drivers and chauffeurs 2,200 $16.00 $10.45 $26.00 7513
TOP OPPORTUNITY OCCUPATIONS
Usually Requiring High School and/or Occupation Specific
Training
25B.C. 2025 LABOUR MARKET OUTLOOK
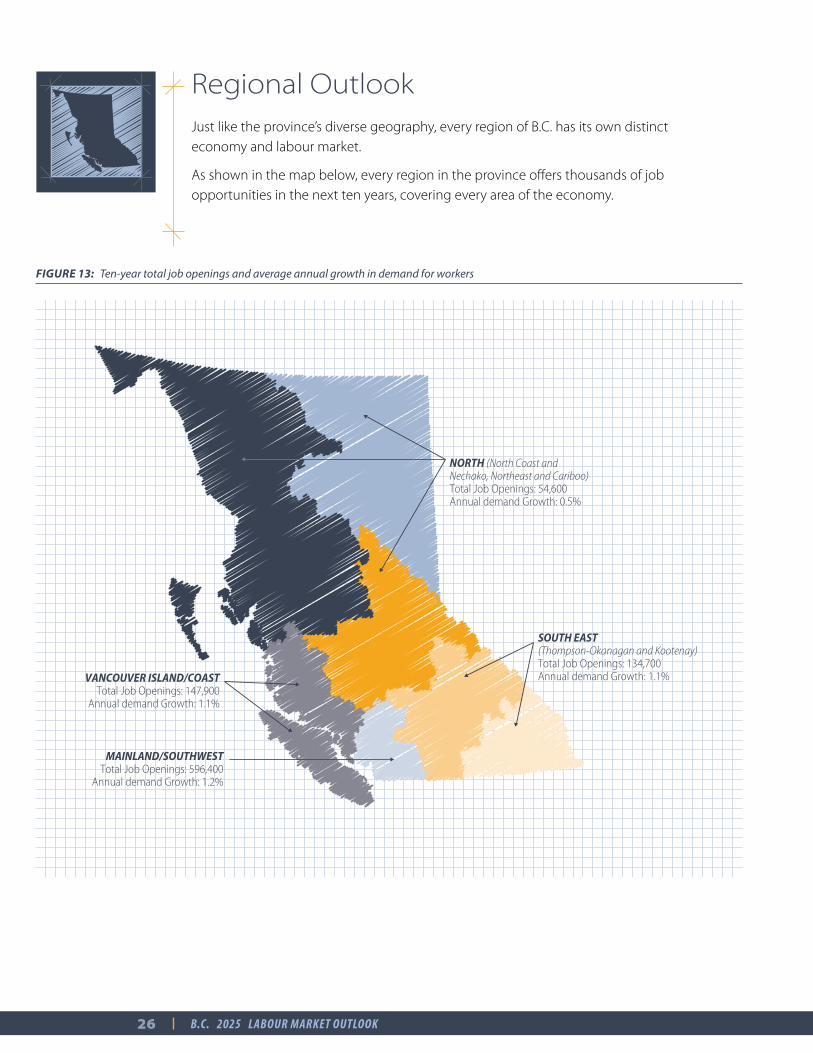
Regional OutlookJust like the province’s diverse geography, every region of B C has its own distinct economy and labour market
As shown in the map below, every region in the province offers thousands of job opportunities in the next ten years, covering every area of the economy
NORTH (North Coast and Nechako, Northeast and Cariboo)Total Job Openings: 54,600Annual demand Growth: 0.5%
SOUTH EAST (Thompson-Okanagan and Kootenay)Total Job Openings: 134,700Annual demand Growth: 1.1%VANCOUVER ISLAND/COAST
Total Job Openings: 147,900Annual demand Growth: 1.1%
MAINLAND/SOUTHWESTTotal Job Openings: 596,400
Annual demand Growth: 1.2%
FIGURE 13: Ten-year total job openings and average annual growth in demand for workers
26 B.C. 2025 LABOUR MARKET OUTLOOK

DID YOU KNOW?Over the years to 2025, migrant workers to the province are expected to fill 35 percent of the future labour supply additions.
27B.C. 2025 LABOUR MARKET OUTLOOK
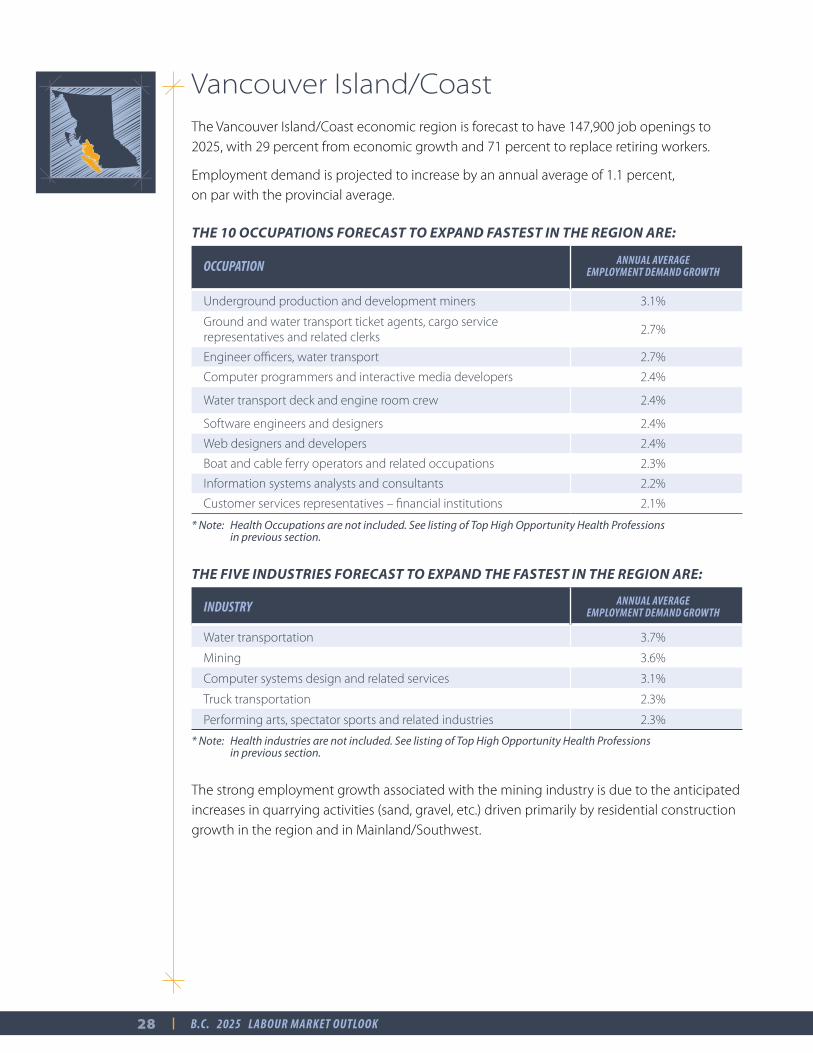
Vancouver Island/CoastThe Vancouver Island/Coast economic region is forecast to have 147,900 job openings to 2025, with 29 percent from economic growth and 71 percent to replace retiring workers
Employment demand is projected to increase by an annual average of 1 1 percent, on par with the provincial average
THE 10 OCCUPATIONS FORECAST TO EXPAND FASTEST IN THE REGION ARE:
OCCUPATION ANNUAL AVERAGE EMPLOYMENT DEMAND GROWTH
Underground production and development miners 3 1%
Ground and water transport ticket agents, cargo service representatives and related clerks
2 7%
Engineer officers, water transport 2 7%
Computer programmers and interactive media developers 2 4%
Water transport deck and engine room crew 2 4%
Software engineers and designers 2 4%
Web designers and developers 2 4%
Boat and cable ferry operators and related occupations 2 3%
Information systems analysts and consultants 2 2%
Customer services representatives – financial institutions 2 1%
* Note: Health Occupations are not included. See listing of Top High Opportunity Health Professions in previous section.
THE FIVE INDUSTRIES FORECAST TO EXPAND THE FASTEST IN THE REGION ARE:
INDUSTRY ANNUAL AVERAGE EMPLOYMENT DEMAND GROWTH
Water transportation 3 7%
Mining 3 6%
Computer systems design and related services 3 1%
Truck transportation 2 3%
Performing arts, spectator sports and related industries 2 3%
* Note: Health industries are not included. See listing of Top High Opportunity Health Professions in previous section.
The strong employment growth associated with the mining industry is due to the anticipated increases in quarrying activities (sand, gravel, etc ) driven primarily by residential construction growth in the region and in Mainland/Southwest
28 B.C. 2025 LABOUR MARKET OUTLOOK
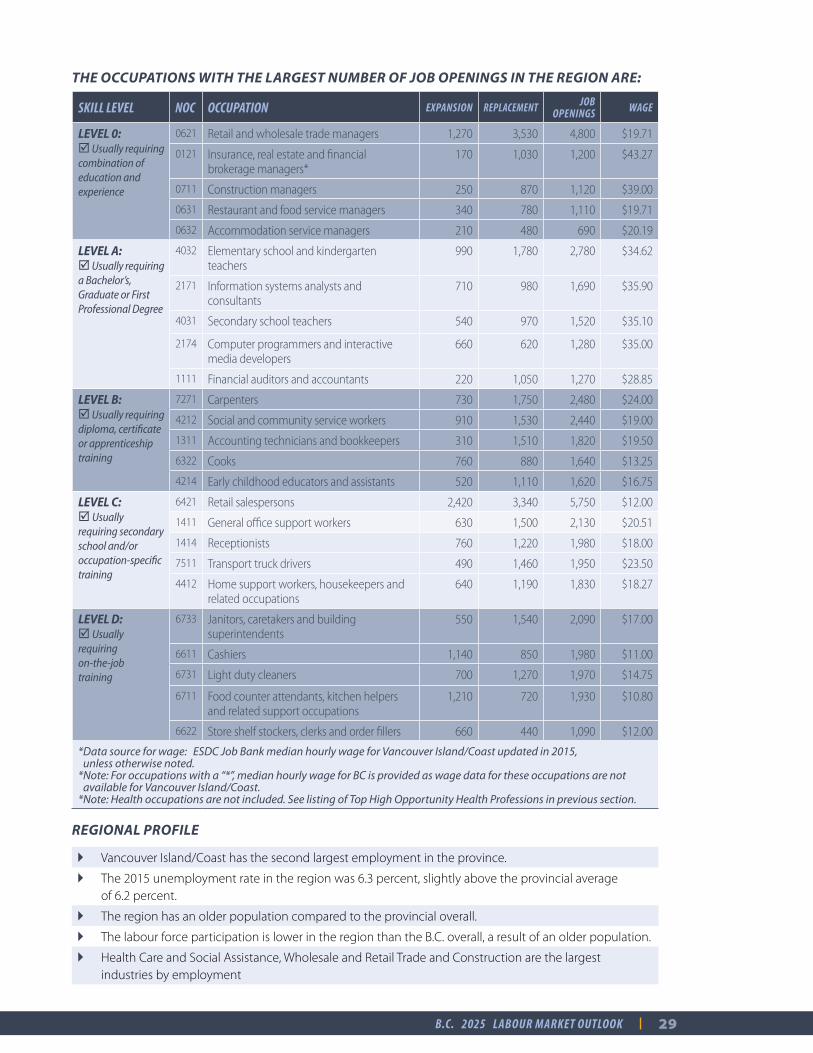
THE OCCUPATIONS WITH THE LARGEST NUMBER OF JOB OPENINGS IN THE REGION ARE:
SKILL LEVEL NOC OCCUPATION EXPANSION REPLACEMENT JOB OPENINGS WAGE
LEVEL 0: þ Usually requiring combination of education and experience
0621 Retail and wholesale trade managers 1,270 3,530 4,800 $19.71
0121 Insurance, real estate and financial brokerage managers*
170 1,030 1,200 $43.27
0711 Construction managers 250 870 1,120 $39.00
0631 Restaurant and food service managers 340 780 1,110 $19.71
0632 Accommodation service managers 210 480 690 $20.19
LEVEL A: þ Usually requiring a Bachelor’s, Graduate or First Professional Degree
4032 Elementary school and kindergarten teachers
990 1,780 2,780 $34.62
2171 Information systems analysts and consultants
710 980 1,690 $35.90
4031 Secondary school teachers 540 970 1,520 $35.10
2174 Computer programmers and interactive media developers
660 620 1,280 $35.00
1111 Financial auditors and accountants 220 1,050 1,270 $28.85
LEVEL B: þ Usually requiring diploma, certificate or apprenticeship training
7271 Carpenters 730 1,750 2,480 $24.00
4212 Social and community service workers 910 1,530 2,440 $19.00
1311 Accounting technicians and bookkeepers 310 1,510 1,820 $19.50
6322 Cooks 760 880 1,640 $13.25
4214 Early childhood educators and assistants 520 1,110 1,620 $16.75
LEVEL C: þ Usually requiring secondary school and/or occupation-specific training
6421 Retail salespersons 2,420 3,340 5,750 $12.00
1411 General office support workers 630 1,500 2,130 $20.51
1414 Receptionists 760 1,220 1,980 $18.00
7511 Transport truck drivers 490 1,460 1,950 $23.50
4412 Home support workers, housekeepers and related occupations
640 1,190 1,830 $18.27
LEVEL D: þ Usually requiring on-the-job training
6733 Janitors, caretakers and building superintendents
550 1,540 2,090 $17.00
6611 Cashiers 1,140 850 1,980 $11.00
6731 Light duty cleaners 700 1,270 1,970 $14.75
6711 Food counter attendants, kitchen helpers and related support occupations
1,210 720 1,930 $10.80
6622 Store shelf stockers, clerks and order fillers 660 440 1,090 $12.00
* Data source for wage: ESDC Job Bank median hourly wage for Vancouver Island/Coast updated in 2015, unless otherwise noted.
* Note: For occupations with a “*”, median hourly wage for BC is provided as wage data for these occupations are not available for Vancouver Island/Coast.
*Note: Health occupations are not included. See listing of Top High Opportunity Health Professions in previous section.
REGIONAL PROFILE
} Vancouver Island/Coast has the second largest employment in the province
} The 2015 unemployment rate in the region was 6 3 percent, slightly above the provincial average of 6 2 percent
} The region has an older population compared to the provincial overall
} The labour force participation is lower in the region than the B C overall, a result of an older population
} Health Care and Social Assistance, Wholesale and Retail Trade and Construction are the largest industries by employment
29B.C. 2025 LABOUR MARKET OUTLOOK
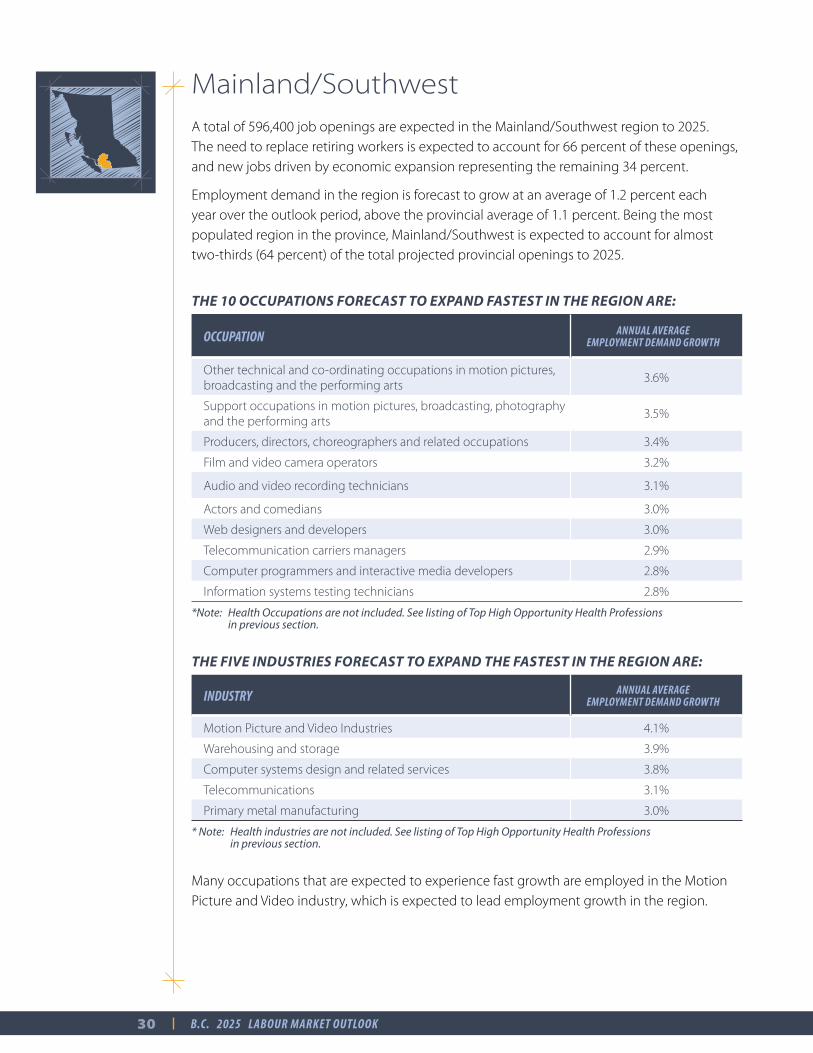
Mainland/SouthwestA total of 596,400 job openings are expected in the Mainland/Southwest region to 2025 The need to replace retiring workers is expected to account for 66 percent of these openings, and new jobs driven by economic expansion representing the remaining 34 percent
Employment demand in the region is forecast to grow at an average of 1 2 percent each year over the outlook period, above the provincial average of 1 1 percent Being the most populated region in the province, Mainland/Southwest is expected to account for almost two-thirds (64 percent) of the total projected provincial openings to 2025
THE 10 OCCUPATIONS FORECAST TO EXPAND FASTEST IN THE REGION ARE:
OCCUPATION ANNUAL AVERAGE EMPLOYMENT DEMAND GROWTH
Other technical and co-ordinating occupations in motion pictures, broadcasting and the performing arts
3 6%
Support occupations in motion pictures, broadcasting, photography and the performing arts
3 5%
Producers, directors, choreographers and related occupations 3 4%
Film and video camera operators 3 2%
Audio and video recording technicians 3 1%
Actors and comedians 3 0%
Web designers and developers 3 0%
Telecommunication carriers managers 2 9%
Computer programmers and interactive media developers 2 8%
Information systems testing technicians 2 8%
*Note: Health Occupations are not included. See listing of Top High Opportunity Health Professions in previous section.
THE FIVE INDUSTRIES FORECAST TO EXPAND THE FASTEST IN THE REGION ARE:
INDUSTRY ANNUAL AVERAGE EMPLOYMENT DEMAND GROWTH
Motion Picture and Video Industries 4 1%
Warehousing and storage 3 9%
Computer systems design and related services 3 8%
Telecommunications 3 1%
Primary metal manufacturing 3 0%
* Note: Health industries are not included. See listing of Top High Opportunity Health Professions in previous section.
Many occupations that are expected to experience fast growth are employed in the Motion Picture and Video industry, which is expected to lead employment growth in the region
30 B.C. 2025 LABOUR MARKET OUTLOOK
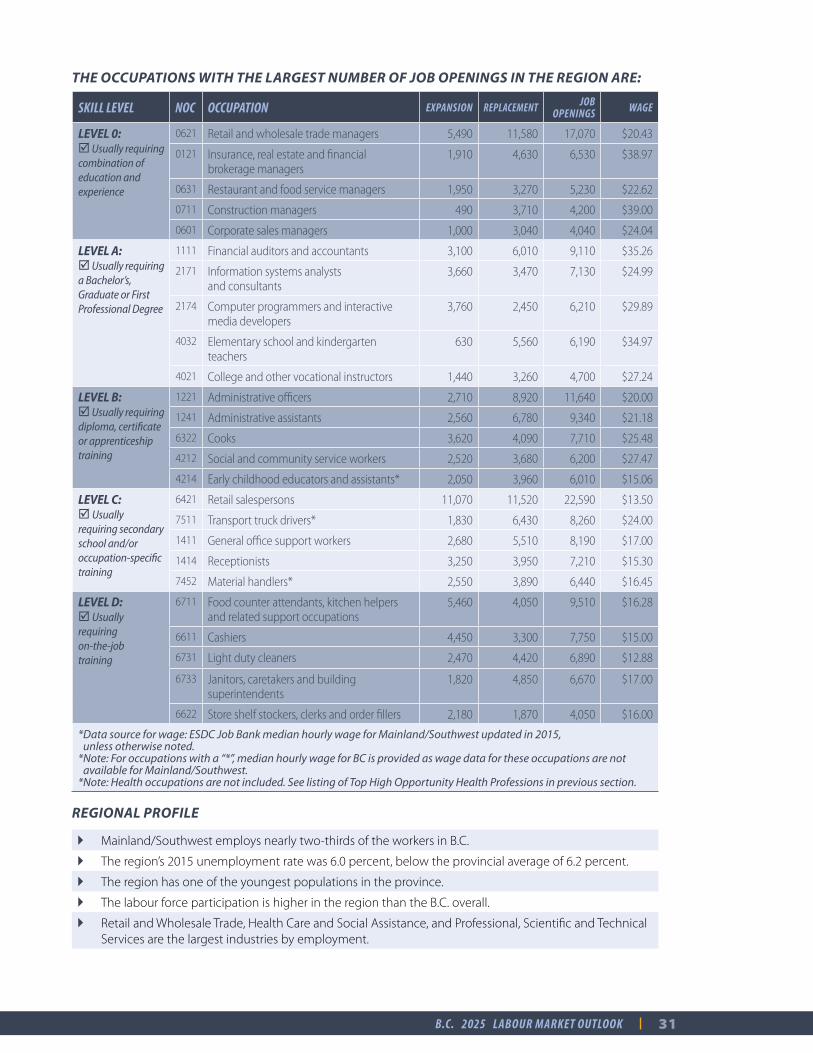
THE OCCUPATIONS WITH THE LARGEST NUMBER OF JOB OPENINGS IN THE REGION ARE:
SKILL LEVEL NOC OCCUPATION EXPANSION REPLACEMENT JOB OPENINGS WAGE
LEVEL 0: þ Usually requiring combination of education and experience
0621 Retail and wholesale trade managers 5,490 11,580 17,070 $20.43
0121 Insurance, real estate and financial brokerage managers
1,910 4,630 6,530 $38.97
0631 Restaurant and food service managers 1,950 3,270 5,230 $22.62
0711 Construction managers 490 3,710 4,200 $39.00
0601 Corporate sales managers 1,000 3,040 4,040 $24.04
LEVEL A: þ Usually requiring a Bachelor’s, Graduate or First Professional Degree
1111 Financial auditors and accountants 3,100 6,010 9,110 $35.26
2171 Information systems analysts and consultants
3,660 3,470 7,130 $24.99
2174 Computer programmers and interactive media developers
3,760 2,450 6,210 $29.89
4032 Elementary school and kindergarten teachers
630 5,560 6,190 $34.97
4021 College and other vocational instructors 1,440 3,260 4,700 $27.24
LEVEL B: þ Usually requiring diploma, certificate or apprenticeship training
1221 Administrative officers 2,710 8,920 11,640 $20.00
1241 Administrative assistants 2,560 6,780 9,340 $21.18
6322 Cooks 3,620 4,090 7,710 $25.48
4212 Social and community service workers 2,520 3,680 6,200 $27.47
4214 Early childhood educators and assistants* 2,050 3,960 6,010 $15.06
LEVEL C: þ Usually requiring secondary school and/or occupation-specific training
6421 Retail salespersons 11,070 11,520 22,590 $13.50
7511 Transport truck drivers* 1,830 6,430 8,260 $24.00
1411 General office support workers 2,680 5,510 8,190 $17.00
1414 Receptionists 3,250 3,950 7,210 $15.30
7452 Material handlers* 2,550 3,890 6,440 $16.45
LEVEL D: þ Usually requiring on-the-job training
6711 Food counter attendants, kitchen helpers and related support occupations
5,460 4,050 9,510 $16.28
6611 Cashiers 4,450 3,300 7,750 $15.00
6731 Light duty cleaners 2,470 4,420 6,890 $12.88
6733 Janitors, caretakers and building superintendents
1,820 4,850 6,670 $17.00
6622 Store shelf stockers, clerks and order fillers 2,180 1,870 4,050 $16.00
* Data source for wage: ESDC Job Bank median hourly wage for Mainland/Southwest updated in 2015, unless otherwise noted.
* Note: For occupations with a “*”, median hourly wage for BC is provided as wage data for these occupations are not available for Mainland/Southwest.
*Note: Health occupations are not included. See listing of Top High Opportunity Health Professions in previous section.
REGIONAL PROFILE
} Mainland/Southwest employs nearly two-thirds of the workers in B C
} The region’s 2015 unemployment rate was 6 0 percent, below the provincial average of 6 2 percent
} The region has one of the youngest populations in the province
} The labour force participation is higher in the region than the B C overall
} Retail and Wholesale Trade, Health Care and Social Assistance, and Professional, Scientific and Technical Services are the largest industries by employment
31B.C. 2025 LABOUR MARKET OUTLOOK
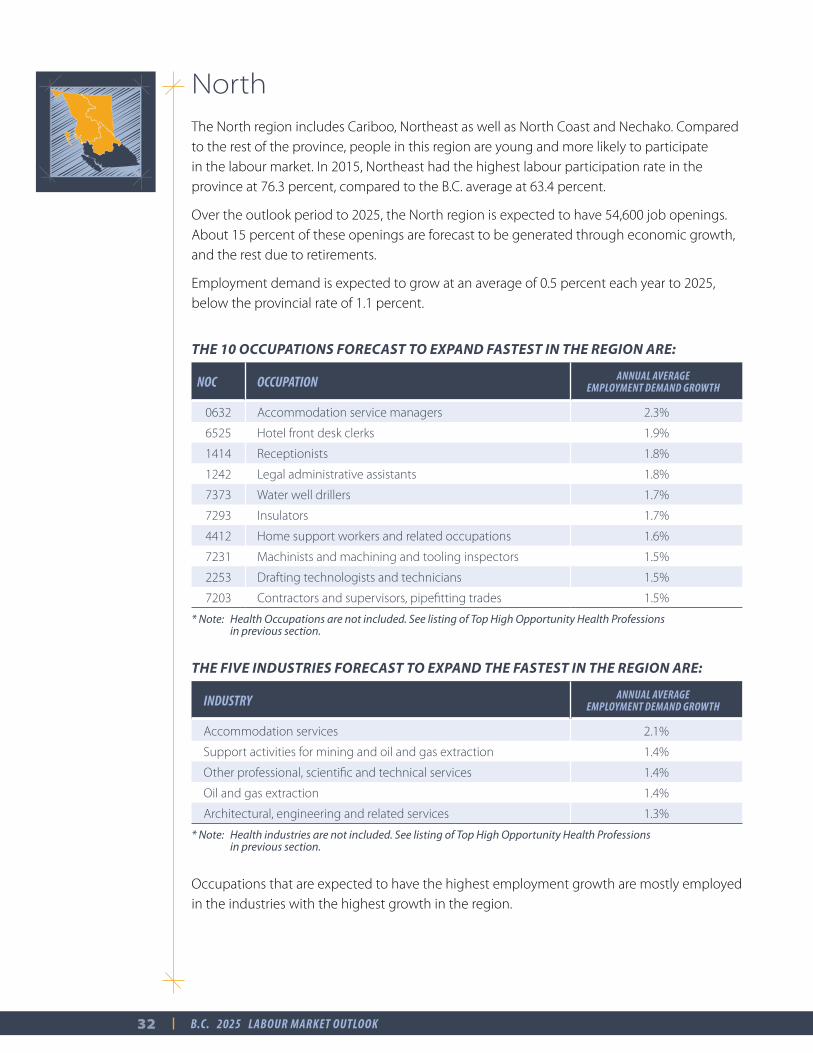
NorthThe North region includes Cariboo, Northeast as well as North Coast and Nechako Compared to the rest of the province, people in this region are young and more likely to participate in the labour market In 2015, Northeast had the highest labour participation rate in the province at 76 3 percent, compared to the B C average at 63 4 percent
Over the outlook period to 2025, the North region is expected to have 54,600 job openings About 15 percent of these openings are forecast to be generated through economic growth, and the rest due to retirements
Employment demand is expected to grow at an average of 0 5 percent each year to 2025, below the provincial rate of 1 1 percent
THE 10 OCCUPATIONS FORECAST TO EXPAND FASTEST IN THE REGION ARE:
NOC OCCUPATION ANNUAL AVERAGE EMPLOYMENT DEMAND GROWTH
0632 Accommodation service managers 2 3%
6525 Hotel front desk clerks 1 9%
1414 Receptionists 1 8%
1242 Legal administrative assistants 1 8%
7373 Water well drillers 1 7%
7293 Insulators 1 7%
4412 Home support workers and related occupations 1 6%
7231 Machinists and machining and tooling inspectors 1 5%
2253 Drafting technologists and technicians 1 5%
7203 Contractors and supervisors, pipefitting trades 1 5%
* Note: Health Occupations are not included. See listing of Top High Opportunity Health Professions in previous section.
THE FIVE INDUSTRIES FORECAST TO EXPAND THE FASTEST IN THE REGION ARE:
INDUSTRY ANNUAL AVERAGE EMPLOYMENT DEMAND GROWTH
Accommodation services 2 1%
Support activities for mining and oil and gas extraction 1 4%
Other professional, scientific and technical services 1 4%
Oil and gas extraction 1 4%
Architectural, engineering and related services 1 3%
* Note: Health industries are not included. See listing of Top High Opportunity Health Professions in previous section.
Occupations that are expected to have the highest employment growth are mostly employed in the industries with the highest growth in the region
32 B.C. 2025 LABOUR MARKET OUTLOOK
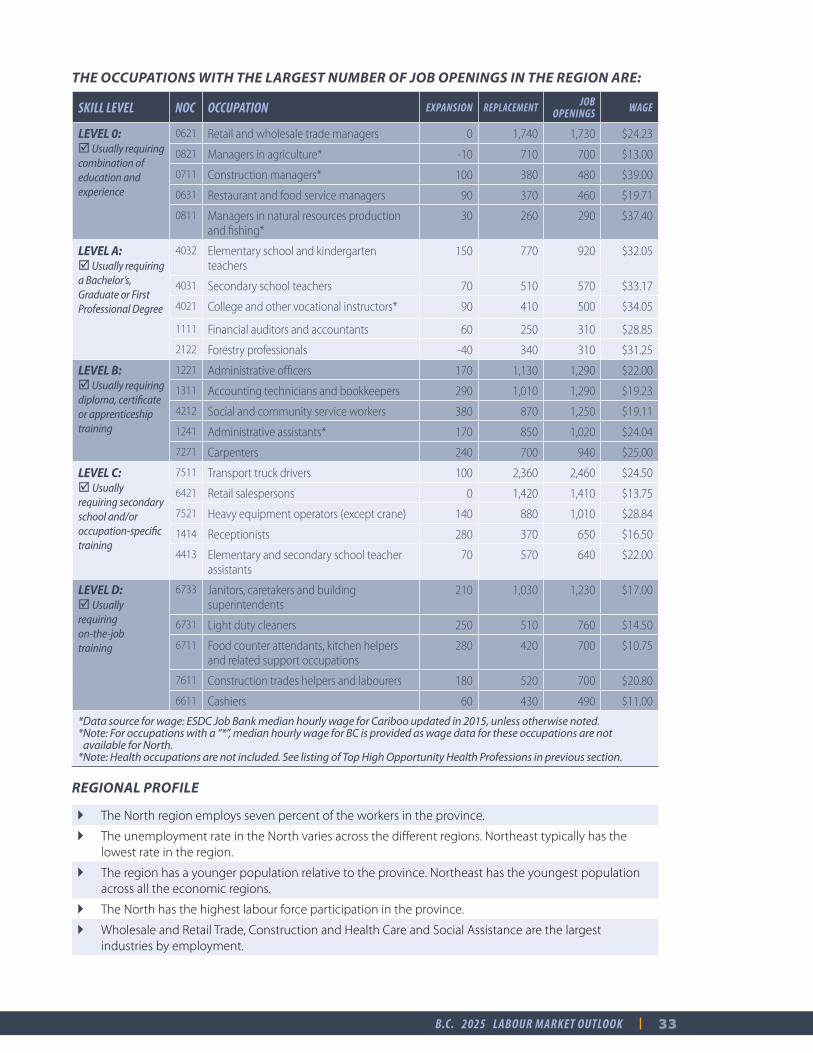
THE OCCUPATIONS WITH THE LARGEST NUMBER OF JOB OPENINGS IN THE REGION ARE:
SKILL LEVEL NOC OCCUPATION EXPANSION REPLACEMENT JOB OPENINGS WAGE
LEVEL 0: þ Usually requiring combination of education and experience
0621 Retail and wholesale trade managers 0 1,740 1,730 $24.23
0821 Managers in agriculture* -10 710 700 $13.00
0711 Construction managers* 100 380 480 $39.00
0631 Restaurant and food service managers 90 370 460 $19.71
0811 Managers in natural resources production and fishing*
30 260 290 $37.40
LEVEL A: þ Usually requiring a Bachelor’s, Graduate or First Professional Degree
4032 Elementary school and kindergarten teachers
150 770 920 $32.05
4031 Secondary school teachers 70 510 570 $33.17
4021 College and other vocational instructors* 90 410 500 $34.05
1111 Financial auditors and accountants 60 250 310 $28.85
2122 Forestry professionals -40 340 310 $31.25
LEVEL B: þ Usually requiring diploma, certificate or apprenticeship training
1221 Administrative officers 170 1,130 1,290 $22.00
1311 Accounting technicians and bookkeepers 290 1,010 1,290 $19.23
4212 Social and community service workers 380 870 1,250 $19.11
1241 Administrative assistants* 170 850 1,020 $24.04
7271 Carpenters 240 700 940 $25.00
LEVEL C: þ Usually requiring secondary school and/or occupation-specific training
7511 Transport truck drivers 100 2,360 2,460 $24.50
6421 Retail salespersons 0 1,420 1,410 $13.75
7521 Heavy equipment operators (except crane) 140 880 1,010 $28.84
1414 Receptionists 280 370 650 $16.50
4413 Elementary and secondary school teacher assistants
70 570 640 $22.00
LEVEL D: þ Usually requiring on-the-job training
6733 Janitors, caretakers and building superintendents
210 1,030 1,230 $17.00
6731 Light duty cleaners 250 510 760 $14.50
6711 Food counter attendants, kitchen helpers and related support occupations
280 420 700 $10.75
7611 Construction trades helpers and labourers 180 520 700 $20.80
6611 Cashiers 60 430 490 $11.00
*Data source for wage: ESDC Job Bank median hourly wage for Cariboo updated in 2015, unless otherwise noted.* Note: For occupations with a “*”, median hourly wage for BC is provided as wage data for these occupations are not
available for North.*Note: Health occupations are not included. See listing of Top High Opportunity Health Professions in previous section.
REGIONAL PROFILE
} The North region employs seven percent of the workers in the province
} The unemployment rate in the North varies across the different regions Northeast typically has the lowest rate in the region
} The region has a younger population relative to the province Northeast has the youngest population across all the economic regions
} The North has the highest labour force participation in the province
} Wholesale and Retail Trade, Construction and Health Care and Social Assistance are the largest industries by employment
33B.C. 2025 LABOUR MARKET OUTLOOK
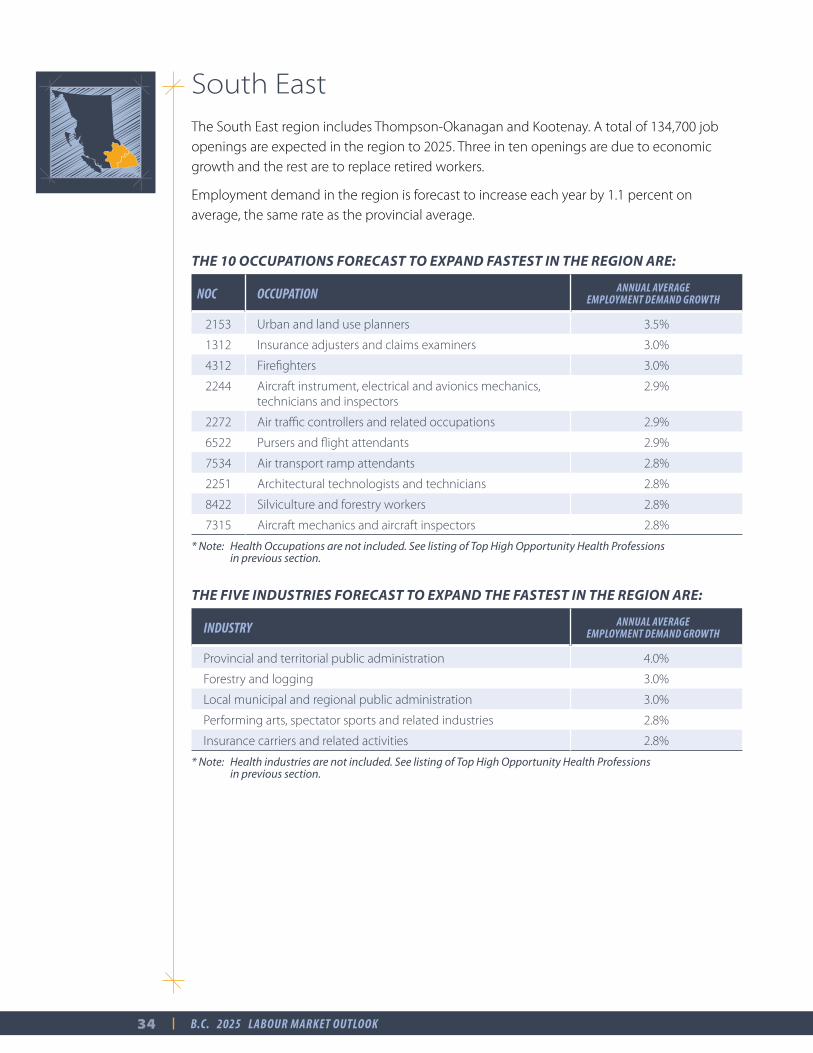
South EastThe South East region includes Thompson-Okanagan and Kootenay A total of 134,700 job openings are expected in the region to 2025 Three in ten openings are due to economic growth and the rest are to replace retired workers
Employment demand in the region is forecast to increase each year by 1 1 percent on average, the same rate as the provincial average
THE 10 OCCUPATIONS FORECAST TO EXPAND FASTEST IN THE REGION ARE:
NOC OCCUPATION ANNUAL AVERAGE EMPLOYMENT DEMAND GROWTH
2153 Urban and land use planners 3 5%
1312 Insurance adjusters and claims examiners 3 0%
4312 Firefighters 3 0%
2244 Aircraft instrument, electrical and avionics mechanics, technicians and inspectors
2 9%
2272 Air traffic controllers and related occupations 2 9%
6522 Pursers and flight attendants 2 9%
7534 Air transport ramp attendants 2 8%
2251 Architectural technologists and technicians 2 8%
8422 Silviculture and forestry workers 2 8%
7315 Aircraft mechanics and aircraft inspectors 2 8%
* Note: Health Occupations are not included. See listing of Top High Opportunity Health Professions in previous section.
THE FIVE INDUSTRIES FORECAST TO EXPAND THE FASTEST IN THE REGION ARE:
INDUSTRY ANNUAL AVERAGE EMPLOYMENT DEMAND GROWTH
Provincial and territorial public administration 4 0%
Forestry and logging 3 0%
Local municipal and regional public administration 3 0%
Performing arts, spectator sports and related industries 2 8%
Insurance carriers and related activities 2 8%
* Note: Health industries are not included. See listing of Top High Opportunity Health Professions in previous section.
34 B.C. 2025 LABOUR MARKET OUTLOOK
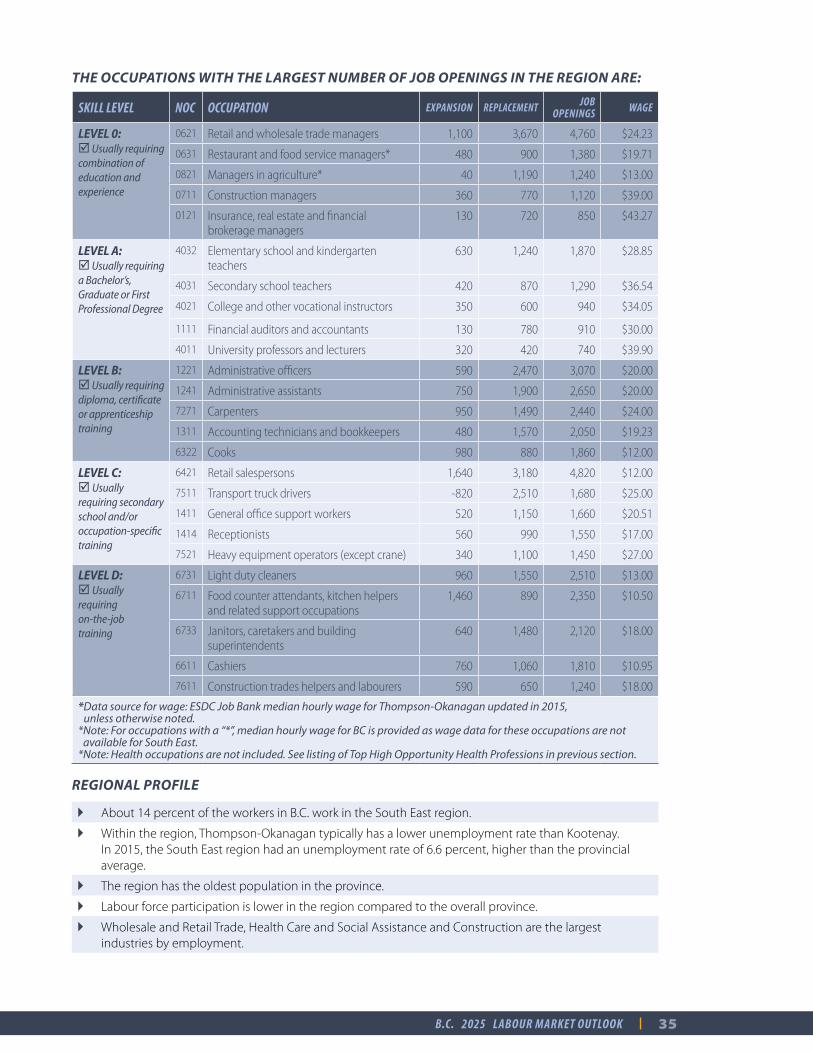
THE OCCUPATIONS WITH THE LARGEST NUMBER OF JOB OPENINGS IN THE REGION ARE:
SKILL LEVEL NOC OCCUPATION EXPANSION REPLACEMENT JOB OPENINGS WAGE
LEVEL 0: þ Usually requiring combination of education and experience
0621 Retail and wholesale trade managers 1,100 3,670 4,760 $24.23
0631 Restaurant and food service managers* 480 900 1,380 $19.71
0821 Managers in agriculture* 40 1,190 1,240 $13.00
0711 Construction managers 360 770 1,120 $39.00
0121 Insurance, real estate and financial brokerage managers
130 720 850 $43.27
LEVEL A: þ Usually requiring a Bachelor’s, Graduate or First Professional Degree
4032 Elementary school and kindergarten teachers
630 1,240 1,870 $28.85
4031 Secondary school teachers 420 870 1,290 $36.54
4021 College and other vocational instructors 350 600 940 $34.05
1111 Financial auditors and accountants 130 780 910 $30.00
4011 University professors and lecturers 320 420 740 $39.90
LEVEL B: þ Usually requiring diploma, certificate or apprenticeship training
1221 Administrative officers 590 2,470 3,070 $20.00
1241 Administrative assistants 750 1,900 2,650 $20.00
7271 Carpenters 950 1,490 2,440 $24.00
1311 Accounting technicians and bookkeepers 480 1,570 2,050 $19.23
6322 Cooks 980 880 1,860 $12.00
LEVEL C: þ Usually requiring secondary school and/or occupation-specific training
6421 Retail salespersons 1,640 3,180 4,820 $12.00
7511 Transport truck drivers -820 2,510 1,680 $25.00
1411 General office support workers 520 1,150 1,660 $20.51
1414 Receptionists 560 990 1,550 $17.00
7521 Heavy equipment operators (except crane) 340 1,100 1,450 $27.00
LEVEL D: þ Usually requiring on-the-job training
6731 Light duty cleaners 960 1,550 2,510 $13.00
6711 Food counter attendants, kitchen helpers and related support occupations
1,460 890 2,350 $10.50
6733 Janitors, caretakers and building superintendents
640 1,480 2,120 $18.00
6611 Cashiers 760 1,060 1,810 $10.95
7611 Construction trades helpers and labourers 590 650 1,240 $18.00
* Data source for wage: ESDC Job Bank median hourly wage for Thompson-Okanagan updated in 2015, unless otherwise noted.
* Note: For occupations with a “*”, median hourly wage for BC is provided as wage data for these occupations are not available for South East.
*Note: Health occupations are not included. See listing of Top High Opportunity Health Professions in previous section.
REGIONAL PROFILE
} About 14 percent of the workers in B C work in the South East region
} Within the region, Thompson-Okanagan typically has a lower unemployment rate than Kootenay In 2015, the South East region had an unemployment rate of 6 6 percent, higher than the provincial average
} The region has the oldest population in the province
} Labour force participation is lower in the region compared to the overall province
} Wholesale and Retail Trade, Health Care and Social Assistance and Construction are the largest industries by employment
35B.C. 2025 LABOUR MARKET OUTLOOK

ConclusionBY 2025, BRITISH COLUMBIANS can expect a total of 934,000 job openings, providing opportunities in every region and every economic sector The projections are based on information from BC Stats, Statistics Canada and the BC Ministry of Finance
Nearly 70 percent of all job openings will be driven by replacements and over three quarters will require some kind of post-secondary education The largest share – 42 percent – will require a diploma, certificate or apprenticeship training
The forecast is based on the projected needs for labour across 58 individual industries About half of job openings over the next ten years will be in the Health and social assistance, Professional services, Retail trade and Arts, recreation, and hospitality major industry groups
Forecasts of how future job openings will be filled demonstrate the range of strategies and tactics available to the education sector, industries and individual companies to develop B C ’s future workforce Key objectives are:
} Reducing the number of unemployed
} Efficiently providing information and resources to maximize the supply of new entrants
} Attracting immigrants from other countries
} Facilitating labour mobility with other provinces
} Increasing labour force participation
BY FOCUSING ON THESE OBJECTIVES, THE LABOUR MARKET IS EXPECTED TO BE BALANCED, WITH SUPPLY AND DEMAND INCREASING AT SIMILAR RATES THROUGH 2025.
36 B.C. 2025 LABOUR MARKET OUTLOOK
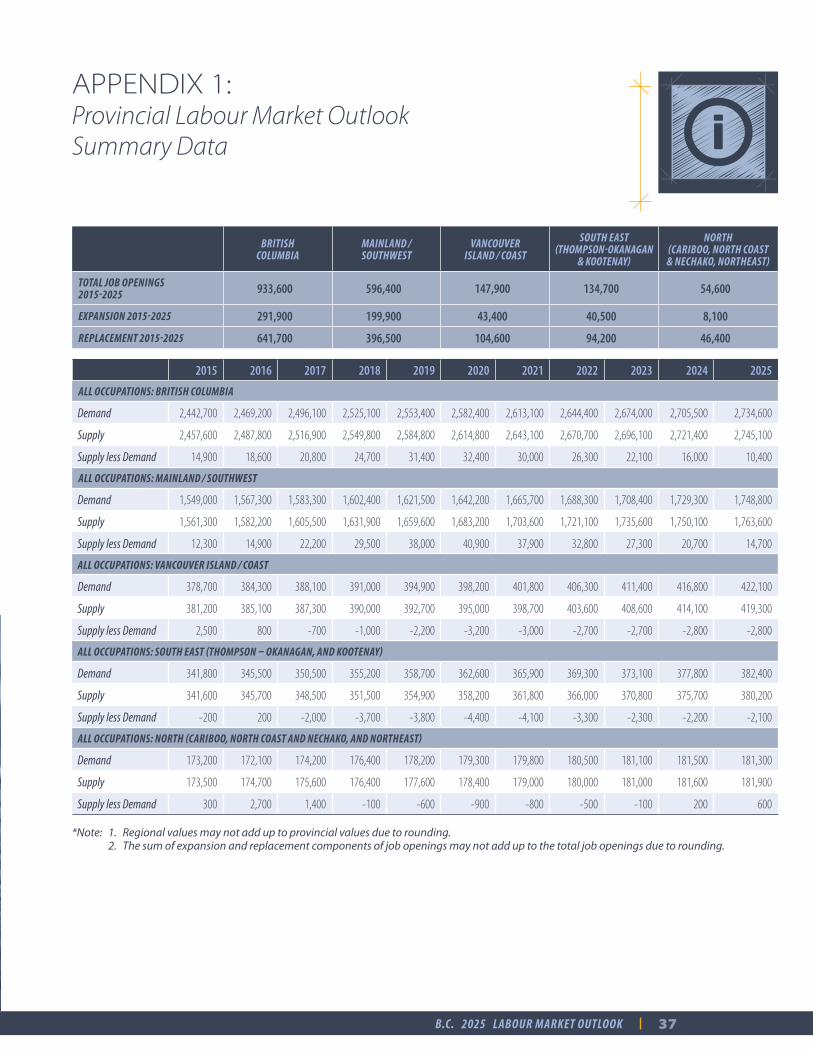
APPENDIX 1: Provincial Labour Market Outlook Summary Data
BRITISH COLUMBIA
MAINLAND / SOUTHWEST
VANCOUVER ISLAND / COAST
SOUTH EAST (THOMPSON-OKANAGAN
& KOOTENAY)
NORTH (CARIBOO, NORTH COAST & NECHAKO, NORTHEAST)
TOTAL JOB OPENINGS 2015-2025 933,600 596,400 147,900 134,700 54,600
EXPANSION 2015-2025 291,900 199,900 43,400 40,500 8,100
REPLACEMENT 2015-2025 641,700 396,500 104,600 94,200 46,400
2015 2016 2017 2018 2019 2020 2021 2022 2023 2024 2025
ALL OCCUPATIONS: BRITISH COLUMBIA
Demand 2,442,700 2,469,200 2,496,100 2,525,100 2,553,400 2,582,400 2,613,100 2,644,400 2,674,000 2,705,500 2,734,600
Supply 2,457,600 2,487,800 2,516,900 2,549,800 2,584,800 2,614,800 2,643,100 2,670,700 2,696,100 2,721,400 2,745,100
Supply less Demand 14,900 18,600 20,800 24,700 31,400 32,400 30,000 26,300 22,100 16,000 10,400
ALL OCCUPATIONS: MAINLAND / SOUTHWEST
Demand 1,549,000 1,567,300 1,583,300 1,602,400 1,621,500 1,642,200 1,665,700 1,688,300 1,708,400 1,729,300 1,748,800
Supply 1,561,300 1,582,200 1,605,500 1,631,900 1,659,600 1,683,200 1,703,600 1,721,100 1,735,600 1,750,100 1,763,600
Supply less Demand 12,300 14,900 22,200 29,500 38,000 40,900 37,900 32,800 27,300 20,700 14,700
ALL OCCUPATIONS: VANCOUVER ISLAND / COAST
Demand 378,700 384,300 388,100 391,000 394,900 398,200 401,800 406,300 411,400 416,800 422,100
Supply 381,200 385,100 387,300 390,000 392,700 395,000 398,700 403,600 408,600 414,100 419,300
Supply less Demand 2,500 800 -700 -1,000 -2,200 -3,200 -3,000 -2,700 -2,700 -2,800 -2,800
ALL OCCUPATIONS: SOUTH EAST (THOMPSON – OKANAGAN, AND KOOTENAY)
Demand 341,800 345,500 350,500 355,200 358,700 362,600 365,900 369,300 373,100 377,800 382,400
Supply 341,600 345,700 348,500 351,500 354,900 358,200 361,800 366,000 370,800 375,700 380,200
Supply less Demand -200 200 -2,000 -3,700 -3,800 -4,400 -4,100 -3,300 -2,300 -2,200 -2,100
ALL OCCUPATIONS: NORTH (CARIBOO, NORTH COAST AND NECHAKO, AND NORTHEAST)
Demand 173,200 172,100 174,200 176,400 178,200 179,300 179,800 180,500 181,100 181,500 181,300
Supply 173,500 174,700 175,600 176,400 177,600 178,400 179,000 180,000 181,000 181,600 181,900
Supply less Demand 300 2,700 1,400 -100 -600 -900 -800 -500 -100 200 600
*Note: 1. Regional values may not add up to provincial values due to rounding. 2. The sum of expansion and replacement components of job openings may not add up to the total job openings due to rounding.
37B.C. 2025 LABOUR MARKET OUTLOOK
Definitions
1 DEMAND: Total number of employed plus vacant positions
2 SUPPLY: The expected labour force, including those who are employed and those who are actively looking for a job
3 SUPPLY LESS DEMAND: The difference between Supply and Demand A positive value indicates that Supply is greater than Demand
4 EXPANSION: New job openings that arise due to economic growth It is the difference between the Demand in 2025 and 2015
5 REPLACEMENT: Job openings to fill positions that are generated by a permanent exit from the labour force This includes exits due to retirements, illness, disabilities, deaths and other reasons from 2015 to 2025
6 TOTAL JOB OPENINGS: The sum of expansion and replacement job openings A job opening is the addition of a new job position through economic growth or a position that needs to be filled due only to someone exiting the labour force permanently It is very different from job postings because it does not include any concept of turnover If someone leaves a position to take another position in the same occupation this is not a job opening Also, if someone leaves a position to take another position in a different occupation, this is not a job opening
7 NEW ENTRANTS: Persons aged 15-34 entering the labour force for the first time after leaving the education system
8 NET IN-MIGRATION: Net in-migration from outside of B C This can be migration from other jurisdictions in Canada or from international sources
9 CHANGE IN LABOUR FORCE PARTICIPATION: This group captures other types of mobility in the labour market, such as people coming back to the labour force after a period of absence This is a concept that is also called “Net other in-mobility”
DID YOU KNOW?Labour supply is expected exceed demand by 32,000 workers in 2020 but tightening towards the end of the decade.
38 B.C. 2025 LABOUR MARKET OUTLOOK
APPENDIX 2: Methodology and Assumptions
Model Structure and Methodology
The B C Labour Market Scenario Model is a labour market forecasting system to generate 10-year projections of labour demand and supply for 500 occupations for B C and its economic development regions
The Model is composed of three sets of regional models: macroeconomic models, industry employment models and occupational models The results of the regional models are rolled up to generate the provincial forecast
MACROECONOMIC MODELS:
} There are seven regional macroeconomic models Two main sections in each regional macroeconomic model are economic and demographic components
} The economic component generates industry employment estimates and forecast and ultimately links to the labour demand projections in the occupational model The demographic component links to the labour supply projections in the occupational model
} In each regional macroeconomic model, the entire regional economy is split into 15 high-level industries based on the 2007 North American Industry Classification System (NAICS) structure
INDUSTRY EMPLOYMENT MODELS:
} There are seven regional industry employment models For each region, the industry employment model converts employment for high-level industries from the macroeconomic model into employment estimates and forecast for 58 NAICS industries
OCCUPATIONAL MODELS:
} Produce labour demand projections for 500 occupations at 4-digit NOC level for the seven development regions
} Produce labour supply forecast for 500 occupations at the 4-digit NOC level for the four regions – Mainland/Southwest, Vancouver Island/Coast, South East (Thompson-Okanagan and Kootenay combined) and North (Cariboo, North Coast and Nechako, and Northeast combined)
39B.C. 2025 LABOUR MARKET OUTLOOK
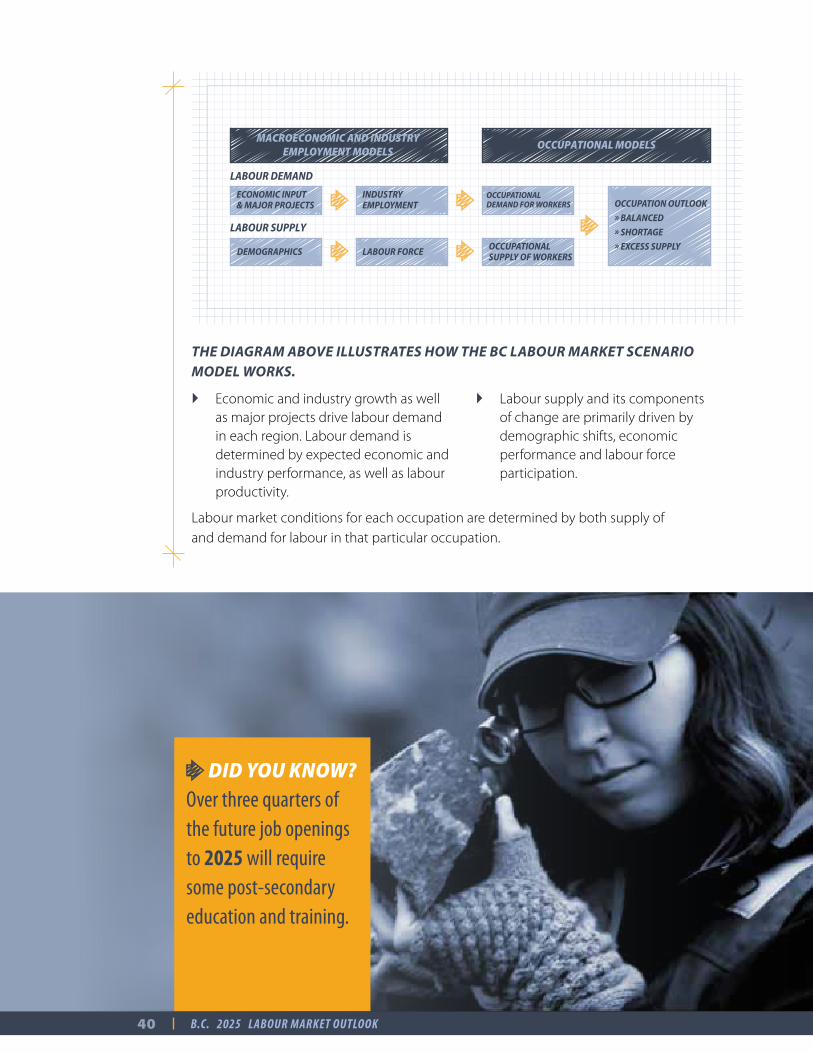
MACROECONOMIC AND INDUSTRY EMPLOYMENT MODELS
LABOUR DEMAND
LABOUR SUPPLY
ECONOMIC INPUT & MAJOR PROJECTS
INDUSTRYEMPLOYMENT
DEMOGRAPHICS LABOUR FORCE
OCCUPATIONAL DEMAND FOR WORKERS
OCCUPATIONAL SUPPLY OF WORKERS
OCCUPATIONAL MODELS
OCCUPATION OUTLOOK
BALANCED
SHORTAGE
EXCESS SUPPLY
THE DIAGRAM ABOVE ILLUSTRATES HOW THE BC LABOUR MARKET SCENARIO MODEL WORKS.
} Economic and industry growth as well as major projects drive labour demand in each region Labour demand is determined by expected economic and industry performance, as well as labour productivity
} Labour supply and its components of change are primarily driven by demographic shifts, economic performance and labour force participation
Labour market conditions for each occupation are determined by both supply of and demand for labour in that particular occupation
DID YOU KNOW?Over three quarters of the future job openings to 2025 will require some post-secondary education and training.
40 B.C. 2025 LABOUR MARKET OUTLOOK
Key Assumptions
} MACROECONOMIC INDICATORS: Assumptions on key economic indicators such as GDP, investment, income, capital stock and housing starts are incorporated into the labour market forecasting model GDP and employment growth assumptions are consistent with the medium-term economic outlook in the B C Ministry of Finance Budget and Fiscal Plan 2016/17–2018/19, released in February 2016 Economic outlooks for B C ’s major trading partners are incorporated
} LABOUR PRODUCTIVITY: Assumptions are made on the labour productivity growth at the industry level
} POPULATION: Age and sex-specific population projections are consistent with B C Stats’ population projections
} LABOUR FORCE PARTICIPATION RATE: Assumptions are made on labour force participation rate trends by age and sex Overall labour force participation rates are expected to drop over the outlook period
} NEW ENTRANTS: Age and sex-specific labour force participation rates are used to calculate the number of new entrants to the labour market New entrants are allocated to different occupations based on each occupation’s historical demand share out of occupation demand for all occupations It is assumed that there will be no new entrants entering management and supervisory occupations as these occupations usually require several years of work experience
} RETIREMENTS AND DEATHS: Occupation-specific median retirement age and labour force age structure are used to derive the number of retirements that factor into the overall estimate of exits from the labour force Age and sex-specific death rates are used to calculate the number of deaths in the labour force
} LABOUR FORCE ADJUSTMENT: It is assumed that: (1) Labour supply generally responds to labour demand, and in the long run, labour force for an occupation will be determined by the demand for the occupation; (2) Occupations need to compete with each other for new labour supply; and (3) If the share of an occupation in the economy is rising, so will its share of new entrants
41B.C. 2025 LABOUR MARKET OUTLOOK
OCCUPATIONS JOB OPENINGS TO 2025
SKILL LEVEL
HOURLY WAGE RATE ($)
OCCUPATION CODE (NOC)
LOW MEDIAN HIGH
Legislators* 440 0 21,191.35 55,083.00 141,794.00 0011Senior government managers and officials 910 0 24.79 48.77 79.91 0012Senior managers – financial, communications and other business services 4,460 0 18.00 48.60 74.52 0013Senior managers – health, education, social and community services and membership organizations
2,050 0 20.00 40.38 78.57 0014
Senior managers – trade, broadcasting and other services, N.E.C. 3,260 0 10.45 35.26 105.36 0015Senior managers – construction, transportation, production and utilities 3,570 0 22.50 40.38 80.13 0016Financial managers 4,530 0 19.71 39.42 52.88 0111Human resources managers 3,000 0 22.85 40.87 60.00 0112Purchasing managers 710 0 22.15 36.21 52.88 0113Other administrative services managers 1,970 0 20.43 38.46 53.85 0114Insurance, real estate and financial brokerage managers 8,830 0 20.70 43.27 61.54 0121Banking, credit and other investment managers 4,650 0 23.08 37.44 53.85 0122Advertising, marketing and public relations managers 3,500 0 18.67 36.06 62.50 0124Other business services managers 780 0 19.23 33.00 50.96 0125Telecommunication carriers managers 700 0 23.55 39.86 56.37 0131Postal and courier services managers 360 0 11.49 33.92 52.80 0132Engineering managers 1,120 0 23.08 45.67 71.10 0211Architecture and science managers 450 0 16.15 39.04 74.62 0212Computer and information systems managers 4,050 0 24.04 43.27 60.10 0213Managers in health care 2,610 0 20.77 36.66 57.95 0311Government managers – health and social policy development and program administration 240 0 28.84 43.11 62.50 0411Government managers – economic analysis, policy development and program administration 470 0 25.98 41.66 62.39 0412Government managers – education policy development and program administration 40 0 34.77 48.40 64.79 0413Other managers in public administration 380 0 26.55 45.30 61.54 0414Administrators – post-secondary education and vocational training 1,980 0 19.23 36.62 56.59 0421School principals and administrators of elementary and secondary education 2,390 0 20.04 43.08 53.85 0422Managers in social, community and correctional services 2,720 0 19.51 30.77 47.69 0423Commissioned police officers 50 0 N/A N/A N/A 0431Fire chiefs and senior firefighting officers 220 0 34.29 55.44 64.68 0432Commissioned officers of the Canadian Forces 450 0 18.24 35.10 50.87 0433Library, archive, museum and art gallery managers 200 0 10.94 30.26 51.03 0511Managers – publishing, motion pictures, broadcasting and performing arts 990 0 17.00 27.54 49.22 0512Recreation, sports and fitness program and service directors 1,070 0 10.45 26.22 47.42 0513Corporate sales managers 5,190 0 18.67 36.06 62.50 0601Retail and wholesale trade managers 28,370 0 13.50 24.23 43.27 0621Restaurant and food service managers 8,170 0 12.00 19.71 42.86 0631Accommodation service managers 2,910 0 14.42 20.19 48.08 0632
APPENDIX 3: Job Openings for All 500 Occupations
42 B.C. 2025 LABOUR MARKET OUTLOOK
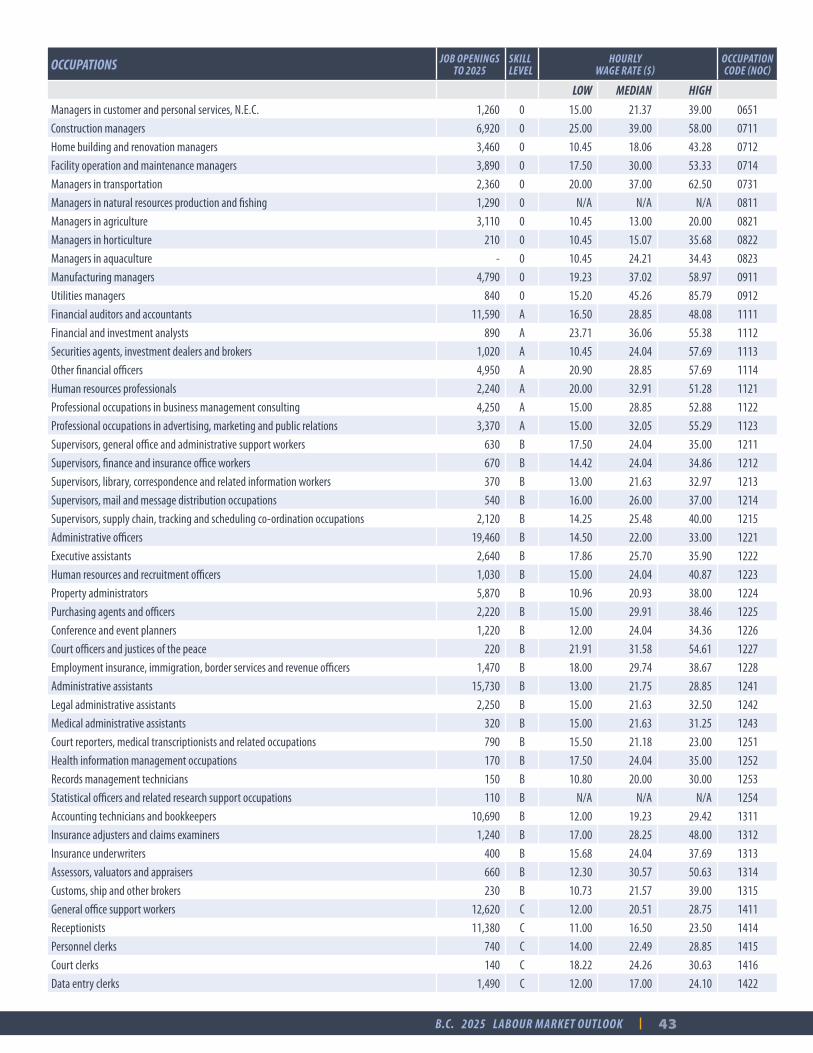
OCCUPATIONS JOB OPENINGS TO 2025
SKILL LEVEL
HOURLY WAGE RATE ($)
OCCUPATION CODE (NOC)
LOW MEDIAN HIGH
Managers in customer and personal services, N.E.C. 1,260 0 15.00 21.37 39.00 0651Construction managers 6,920 0 25.00 39.00 58.00 0711Home building and renovation managers 3,460 0 10.45 18.06 43.28 0712Facility operation and maintenance managers 3,890 0 17.50 30.00 53.33 0714Managers in transportation 2,360 0 20.00 37.00 62.50 0731Managers in natural resources production and fishing 1,290 0 N/A N/A N/A 0811Managers in agriculture 3,110 0 10.45 13.00 20.00 0821Managers in horticulture 210 0 10.45 15.07 35.68 0822Managers in aquaculture - 0 10.45 24.21 34.43 0823Manufacturing managers 4,790 0 19.23 37.02 58.97 0911Utilities managers 840 0 15.20 45.26 85.79 0912Financial auditors and accountants 11,590 A 16.50 28.85 48.08 1111Financial and investment analysts 890 A 23.71 36.06 55.38 1112Securities agents, investment dealers and brokers 1,020 A 10.45 24.04 57.69 1113Other financial officers 4,950 A 20.90 28.85 57.69 1114Human resources professionals 2,240 A 20.00 32.91 51.28 1121Professional occupations in business management consulting 4,250 A 15.00 28.85 52.88 1122Professional occupations in advertising, marketing and public relations 3,370 A 15.00 32.05 55.29 1123Supervisors, general office and administrative support workers 630 B 17.50 24.04 35.00 1211Supervisors, finance and insurance office workers 670 B 14.42 24.04 34.86 1212Supervisors, library, correspondence and related information workers 370 B 13.00 21.63 32.97 1213Supervisors, mail and message distribution occupations 540 B 16.00 26.00 37.00 1214Supervisors, supply chain, tracking and scheduling co-ordination occupations 2,120 B 14.25 25.48 40.00 1215Administrative officers 19,460 B 14.50 22.00 33.00 1221Executive assistants 2,640 B 17.86 25.70 35.90 1222Human resources and recruitment officers 1,030 B 15.00 24.04 40.87 1223Property administrators 5,870 B 10.96 20.93 38.00 1224Purchasing agents and officers 2,220 B 15.00 29.91 38.46 1225Conference and event planners 1,220 B 12.00 24.04 34.36 1226Court officers and justices of the peace 220 B 21.91 31.58 54.61 1227Employment insurance, immigration, border services and revenue officers 1,470 B 18.00 29.74 38.67 1228Administrative assistants 15,730 B 13.00 21.75 28.85 1241Legal administrative assistants 2,250 B 15.00 21.63 32.50 1242Medical administrative assistants 320 B 15.00 21.63 31.25 1243Court reporters, medical transcriptionists and related occupations 790 B 15.50 21.18 23.00 1251Health information management occupations 170 B 17.50 24.04 35.00 1252Records management technicians 150 B 10.80 20.00 30.00 1253Statistical officers and related research support occupations 110 B N/A N/A N/A 1254Accounting technicians and bookkeepers 10,690 B 12.00 19.23 29.42 1311Insurance adjusters and claims examiners 1,240 B 17.00 28.25 48.00 1312Insurance underwriters 400 B 15.68 24.04 37.69 1313Assessors, valuators and appraisers 660 B 12.30 30.57 50.63 1314Customs, ship and other brokers 230 B 10.73 21.57 39.00 1315General office support workers 12,620 C 12.00 20.51 28.75 1411Receptionists 11,380 C 11.00 16.50 23.50 1414Personnel clerks 740 C 14.00 22.49 28.85 1415Court clerks 140 C 18.22 24.26 30.63 1416Data entry clerks 1,490 C 12.00 17.00 24.10 1422
43B.C. 2025 LABOUR MARKET OUTLOOK
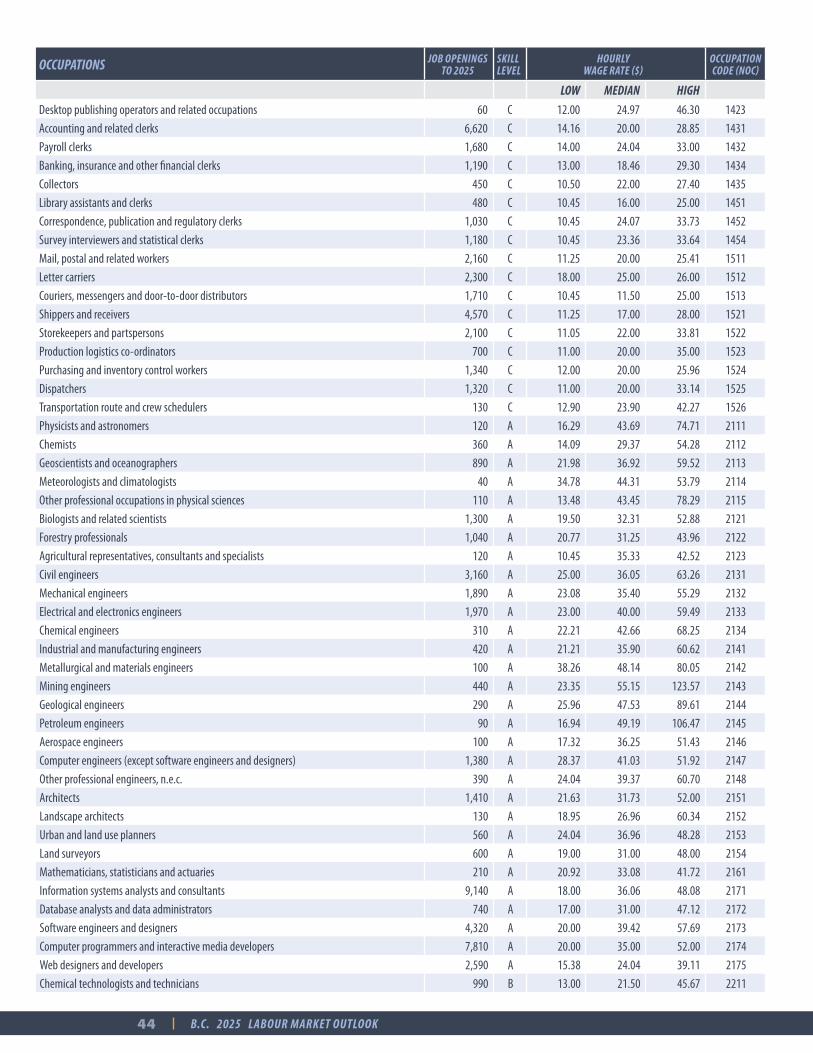
OCCUPATIONS JOB OPENINGS TO 2025
SKILL LEVEL
HOURLY WAGE RATE ($)
OCCUPATION CODE (NOC)
LOW MEDIAN HIGH
Desktop publishing operators and related occupations 60 C 12.00 24.97 46.30 1423Accounting and related clerks 6,620 C 14.16 20.00 28.85 1431Payroll clerks 1,680 C 14.00 24.04 33.00 1432Banking, insurance and other financial clerks 1,190 C 13.00 18.46 29.30 1434Collectors 450 C 10.50 22.00 27.40 1435Library assistants and clerks 480 C 10.45 16.00 25.00 1451Correspondence, publication and regulatory clerks 1,030 C 10.45 24.07 33.73 1452Survey interviewers and statistical clerks 1,180 C 10.45 23.36 33.64 1454Mail, postal and related workers 2,160 C 11.25 20.00 25.41 1511Letter carriers 2,300 C 18.00 25.00 26.00 1512Couriers, messengers and door-to-door distributors 1,710 C 10.45 11.50 25.00 1513Shippers and receivers 4,570 C 11.25 17.00 28.00 1521Storekeepers and partspersons 2,100 C 11.05 22.00 33.81 1522Production logistics co-ordinators 700 C 11.00 20.00 35.00 1523Purchasing and inventory control workers 1,340 C 12.00 20.00 25.96 1524Dispatchers 1,320 C 11.00 20.00 33.14 1525Transportation route and crew schedulers 130 C 12.90 23.90 42.27 1526Physicists and astronomers 120 A 16.29 43.69 74.71 2111Chemists 360 A 14.09 29.37 54.28 2112Geoscientists and oceanographers 890 A 21.98 36.92 59.52 2113Meteorologists and climatologists 40 A 34.78 44.31 53.79 2114Other professional occupations in physical sciences 110 A 13.48 43.45 78.29 2115Biologists and related scientists 1,300 A 19.50 32.31 52.88 2121Forestry professionals 1,040 A 20.77 31.25 43.96 2122Agricultural representatives, consultants and specialists 120 A 10.45 35.33 42.52 2123Civil engineers 3,160 A 25.00 36.05 63.26 2131Mechanical engineers 1,890 A 23.08 35.40 55.29 2132Electrical and electronics engineers 1,970 A 23.00 40.00 59.49 2133Chemical engineers 310 A 22.21 42.66 68.25 2134Industrial and manufacturing engineers 420 A 21.21 35.90 60.62 2141Metallurgical and materials engineers 100 A 38.26 48.14 80.05 2142Mining engineers 440 A 23.35 55.15 123.57 2143Geological engineers 290 A 25.96 47.53 89.61 2144Petroleum engineers 90 A 16.94 49.19 106.47 2145Aerospace engineers 100 A 17.32 36.25 51.43 2146Computer engineers (except software engineers and designers) 1,380 A 28.37 41.03 51.92 2147Other professional engineers, n.e.c. 390 A 24.04 39.37 60.70 2148Architects 1,410 A 21.63 31.73 52.00 2151Landscape architects 130 A 18.95 26.96 60.34 2152Urban and land use planners 560 A 24.04 36.96 48.28 2153Land surveyors 600 A 19.00 31.00 48.00 2154Mathematicians, statisticians and actuaries 210 A 20.92 33.08 41.72 2161Information systems analysts and consultants 9,140 A 18.00 36.06 48.08 2171Database analysts and data administrators 740 A 17.00 31.00 47.12 2172Software engineers and designers 4,320 A 20.00 39.42 57.69 2173Computer programmers and interactive media developers 7,810 A 20.00 35.00 52.00 2174Web designers and developers 2,590 A 15.38 24.04 39.11 2175Chemical technologists and technicians 990 B 13.00 21.50 45.67 2211
44 B.C. 2025 LABOUR MARKET OUTLOOK
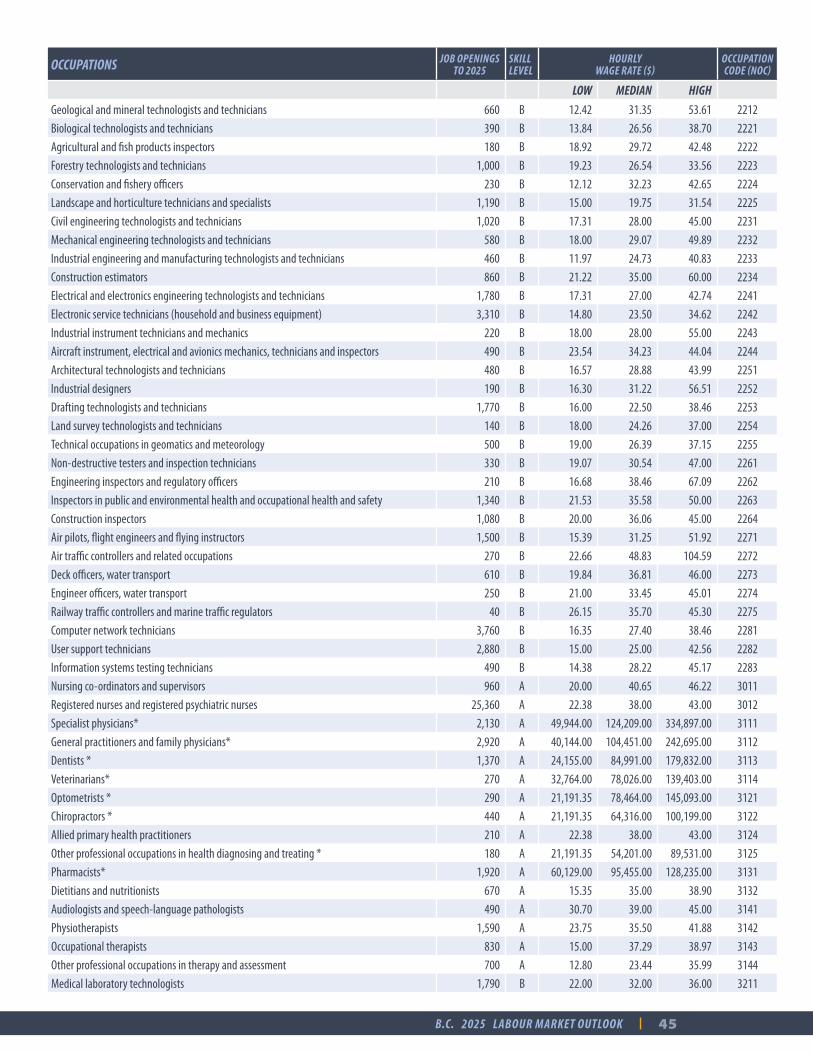
OCCUPATIONS JOB OPENINGS TO 2025
SKILL LEVEL
HOURLY WAGE RATE ($)
OCCUPATION CODE (NOC)
LOW MEDIAN HIGH
Geological and mineral technologists and technicians 660 B 12.42 31.35 53.61 2212Biological technologists and technicians 390 B 13.84 26.56 38.70 2221Agricultural and fish products inspectors 180 B 18.92 29.72 42.48 2222Forestry technologists and technicians 1,000 B 19.23 26.54 33.56 2223Conservation and fishery officers 230 B 12.12 32.23 42.65 2224Landscape and horticulture technicians and specialists 1,190 B 15.00 19.75 31.54 2225Civil engineering technologists and technicians 1,020 B 17.31 28.00 45.00 2231Mechanical engineering technologists and technicians 580 B 18.00 29.07 49.89 2232Industrial engineering and manufacturing technologists and technicians 460 B 11.97 24.73 40.83 2233Construction estimators 860 B 21.22 35.00 60.00 2234Electrical and electronics engineering technologists and technicians 1,780 B 17.31 27.00 42.74 2241Electronic service technicians (household and business equipment) 3,310 B 14.80 23.50 34.62 2242Industrial instrument technicians and mechanics 220 B 18.00 28.00 55.00 2243Aircraft instrument, electrical and avionics mechanics, technicians and inspectors 490 B 23.54 34.23 44.04 2244Architectural technologists and technicians 480 B 16.57 28.88 43.99 2251Industrial designers 190 B 16.30 31.22 56.51 2252Drafting technologists and technicians 1,770 B 16.00 22.50 38.46 2253Land survey technologists and technicians 140 B 18.00 24.26 37.00 2254Technical occupations in geomatics and meteorology 500 B 19.00 26.39 37.15 2255Non-destructive testers and inspection technicians 330 B 19.07 30.54 47.00 2261Engineering inspectors and regulatory officers 210 B 16.68 38.46 67.09 2262Inspectors in public and environmental health and occupational health and safety 1,340 B 21.53 35.58 50.00 2263Construction inspectors 1,080 B 20.00 36.06 45.00 2264Air pilots, flight engineers and flying instructors 1,500 B 15.39 31.25 51.92 2271Air traffic controllers and related occupations 270 B 22.66 48.83 104.59 2272Deck officers, water transport 610 B 19.84 36.81 46.00 2273Engineer officers, water transport 250 B 21.00 33.45 45.01 2274Railway traffic controllers and marine traffic regulators 40 B 26.15 35.70 45.30 2275Computer network technicians 3,760 B 16.35 27.40 38.46 2281User support technicians 2,880 B 15.00 25.00 42.56 2282Information systems testing technicians 490 B 14.38 28.22 45.17 2283Nursing co-ordinators and supervisors 960 A 20.00 40.65 46.22 3011Registered nurses and registered psychiatric nurses 25,360 A 22.38 38.00 43.00 3012Specialist physicians* 2,130 A 49,944.00 124,209.00 334,897.00 3111General practitioners and family physicians* 2,920 A 40,144.00 104,451.00 242,695.00 3112Dentists * 1,370 A 24,155.00 84,991.00 179,832.00 3113Veterinarians* 270 A 32,764.00 78,026.00 139,403.00 3114Optometrists * 290 A 21,191.35 78,464.00 145,093.00 3121Chiropractors * 440 A 21,191.35 64,316.00 100,199.00 3122Allied primary health practitioners 210 A 22.38 38.00 43.00 3124Other professional occupations in health diagnosing and treating * 180 A 21,191.35 54,201.00 89,531.00 3125Pharmacists* 1,920 A 60,129.00 95,455.00 128,235.00 3131Dietitians and nutritionists 670 A 15.35 35.00 38.90 3132Audiologists and speech-language pathologists 490 A 30.70 39.00 45.00 3141Physiotherapists 1,590 A 23.75 35.50 41.88 3142Occupational therapists 830 A 15.00 37.29 38.97 3143Other professional occupations in therapy and assessment 700 A 12.80 23.44 35.99 3144Medical laboratory technologists 1,790 B 22.00 32.00 36.00 3211
45B.C. 2025 LABOUR MARKET OUTLOOK
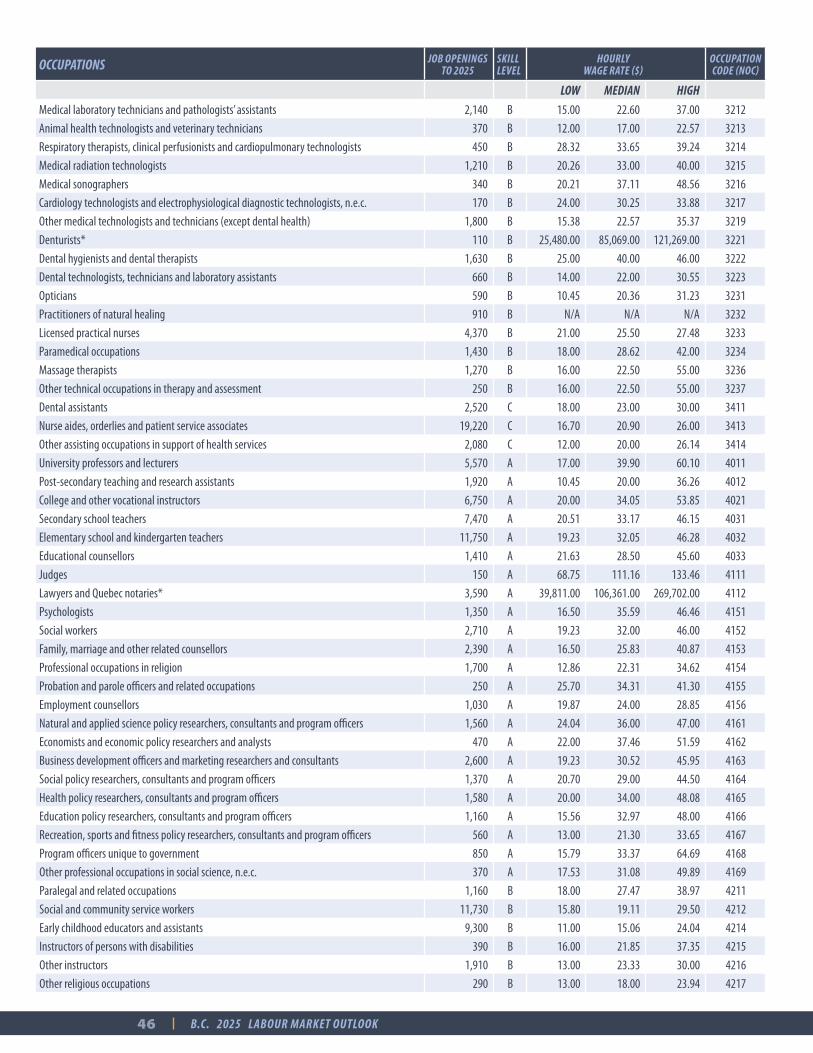
OCCUPATIONS JOB OPENINGS TO 2025
SKILL LEVEL
HOURLY WAGE RATE ($)
OCCUPATION CODE (NOC)
LOW MEDIAN HIGH
Medical laboratory technicians and pathologists’ assistants 2,140 B 15.00 22.60 37.00 3212Animal health technologists and veterinary technicians 370 B 12.00 17.00 22.57 3213Respiratory therapists, clinical perfusionists and cardiopulmonary technologists 450 B 28.32 33.65 39.24 3214Medical radiation technologists 1,210 B 20.26 33.00 40.00 3215Medical sonographers 340 B 20.21 37.11 48.56 3216Cardiology technologists and electrophysiological diagnostic technologists, n.e.c. 170 B 24.00 30.25 33.88 3217Other medical technologists and technicians (except dental health) 1,800 B 15.38 22.57 35.37 3219Denturists* 110 B 25,480.00 85,069.00 121,269.00 3221Dental hygienists and dental therapists 1,630 B 25.00 40.00 46.00 3222Dental technologists, technicians and laboratory assistants 660 B 14.00 22.00 30.55 3223Opticians 590 B 10.45 20.36 31.23 3231Practitioners of natural healing 910 B N/A N/A N/A 3232Licensed practical nurses 4,370 B 21.00 25.50 27.48 3233Paramedical occupations 1,430 B 18.00 28.62 42.00 3234Massage therapists 1,270 B 16.00 22.50 55.00 3236Other technical occupations in therapy and assessment 250 B 16.00 22.50 55.00 3237Dental assistants 2,520 C 18.00 23.00 30.00 3411Nurse aides, orderlies and patient service associates 19,220 C 16.70 20.90 26.00 3413Other assisting occupations in support of health services 2,080 C 12.00 20.00 26.14 3414University professors and lecturers 5,570 A 17.00 39.90 60.10 4011Post-secondary teaching and research assistants 1,920 A 10.45 20.00 36.26 4012College and other vocational instructors 6,750 A 20.00 34.05 53.85 4021Secondary school teachers 7,470 A 20.51 33.17 46.15 4031Elementary school and kindergarten teachers 11,750 A 19.23 32.05 46.28 4032Educational counsellors 1,410 A 21.63 28.50 45.60 4033Judges 150 A 68.75 111.16 133.46 4111Lawyers and Quebec notaries* 3,590 A 39,811.00 106,361.00 269,702.00 4112Psychologists 1,350 A 16.50 35.59 46.46 4151Social workers 2,710 A 19.23 32.00 46.00 4152Family, marriage and other related counsellors 2,390 A 16.50 25.83 40.87 4153Professional occupations in religion 1,700 A 12.86 22.31 34.62 4154Probation and parole officers and related occupations 250 A 25.70 34.31 41.30 4155Employment counsellors 1,030 A 19.87 24.00 28.85 4156Natural and applied science policy researchers, consultants and program officers 1,560 A 24.04 36.00 47.00 4161Economists and economic policy researchers and analysts 470 A 22.00 37.46 51.59 4162Business development officers and marketing researchers and consultants 2,600 A 19.23 30.52 45.95 4163Social policy researchers, consultants and program officers 1,370 A 20.70 29.00 44.50 4164Health policy researchers, consultants and program officers 1,580 A 20.00 34.00 48.08 4165Education policy researchers, consultants and program officers 1,160 A 15.56 32.97 48.00 4166Recreation, sports and fitness policy researchers, consultants and program officers 560 A 13.00 21.30 33.65 4167Program officers unique to government 850 A 15.79 33.37 64.69 4168Other professional occupations in social science, n.e.c. 370 A 17.53 31.08 49.89 4169Paralegal and related occupations 1,160 B 18.00 27.47 38.97 4211Social and community service workers 11,730 B 15.80 19.11 29.50 4212Early childhood educators and assistants 9,300 B 11.00 15.06 24.04 4214Instructors of persons with disabilities 390 B 16.00 21.85 37.35 4215Other instructors 1,910 B 13.00 23.33 30.00 4216Other religious occupations 290 B 13.00 18.00 23.94 4217
46 B.C. 2025 LABOUR MARKET OUTLOOK
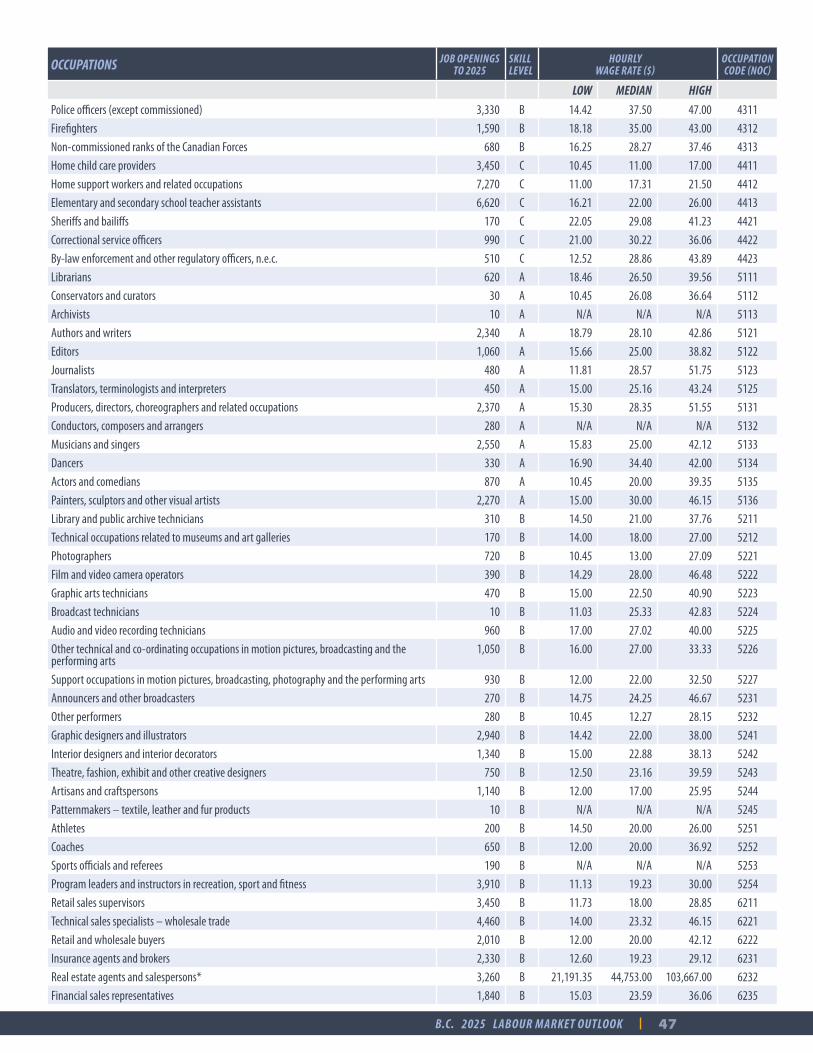
OCCUPATIONS JOB OPENINGS TO 2025
SKILL LEVEL
HOURLY WAGE RATE ($)
OCCUPATION CODE (NOC)
LOW MEDIAN HIGH
Police officers (except commissioned) 3,330 B 14.42 37.50 47.00 4311Firefighters 1,590 B 18.18 35.00 43.00 4312Non-commissioned ranks of the Canadian Forces 680 B 16.25 28.27 37.46 4313Home child care providers 3,450 C 10.45 11.00 17.00 4411Home support workers and related occupations 7,270 C 11.00 17.31 21.50 4412Elementary and secondary school teacher assistants 6,620 C 16.21 22.00 26.00 4413Sheriffs and bailiffs 170 C 22.05 29.08 41.23 4421Correctional service officers 990 C 21.00 30.22 36.06 4422By-law enforcement and other regulatory officers, n.e.c. 510 C 12.52 28.86 43.89 4423Librarians 620 A 18.46 26.50 39.56 5111Conservators and curators 30 A 10.45 26.08 36.64 5112Archivists 10 A N/A N/A N/A 5113Authors and writers 2,340 A 18.79 28.10 42.86 5121Editors 1,060 A 15.66 25.00 38.82 5122Journalists 480 A 11.81 28.57 51.75 5123Translators, terminologists and interpreters 450 A 15.00 25.16 43.24 5125Producers, directors, choreographers and related occupations 2,370 A 15.30 28.35 51.55 5131Conductors, composers and arrangers 280 A N/A N/A N/A 5132Musicians and singers 2,550 A 15.83 25.00 42.12 5133Dancers 330 A 16.90 34.40 42.00 5134Actors and comedians 870 A 10.45 20.00 39.35 5135Painters, sculptors and other visual artists 2,270 A 15.00 30.00 46.15 5136Library and public archive technicians 310 B 14.50 21.00 37.76 5211Technical occupations related to museums and art galleries 170 B 14.00 18.00 27.00 5212Photographers 720 B 10.45 13.00 27.09 5221Film and video camera operators 390 B 14.29 28.00 46.48 5222Graphic arts technicians 470 B 15.00 22.50 40.90 5223Broadcast technicians 10 B 11.03 25.33 42.83 5224Audio and video recording technicians 960 B 17.00 27.02 40.00 5225Other technical and co-ordinating occupations in motion pictures, broadcasting and the performing arts
1,050 B 16.00 27.00 33.33 5226
Support occupations in motion pictures, broadcasting, photography and the performing arts 930 B 12.00 22.00 32.50 5227Announcers and other broadcasters 270 B 14.75 24.25 46.67 5231Other performers 280 B 10.45 12.27 28.15 5232Graphic designers and illustrators 2,940 B 14.42 22.00 38.00 5241Interior designers and interior decorators 1,340 B 15.00 22.88 38.13 5242Theatre, fashion, exhibit and other creative designers 750 B 12.50 23.16 39.59 5243Artisans and craftspersons 1,140 B 12.00 17.00 25.95 5244Patternmakers – textile, leather and fur products 10 B N/A N/A N/A 5245Athletes 200 B 14.50 20.00 26.00 5251Coaches 650 B 12.00 20.00 36.92 5252Sports officials and referees 190 B N/A N/A N/A 5253Program leaders and instructors in recreation, sport and fitness 3,910 B 11.13 19.23 30.00 5254Retail sales supervisors 3,450 B 11.73 18.00 28.85 6211Technical sales specialists – wholesale trade 4,460 B 14.00 23.32 46.15 6221Retail and wholesale buyers 2,010 B 12.00 20.00 42.12 6222Insurance agents and brokers 2,330 B 12.60 19.23 29.12 6231Real estate agents and salespersons* 3,260 B 21,191.35 44,753.00 103,667.00 6232Financial sales representatives 1,840 B 15.03 23.59 36.06 6235
47B.C. 2025 LABOUR MARKET OUTLOOK
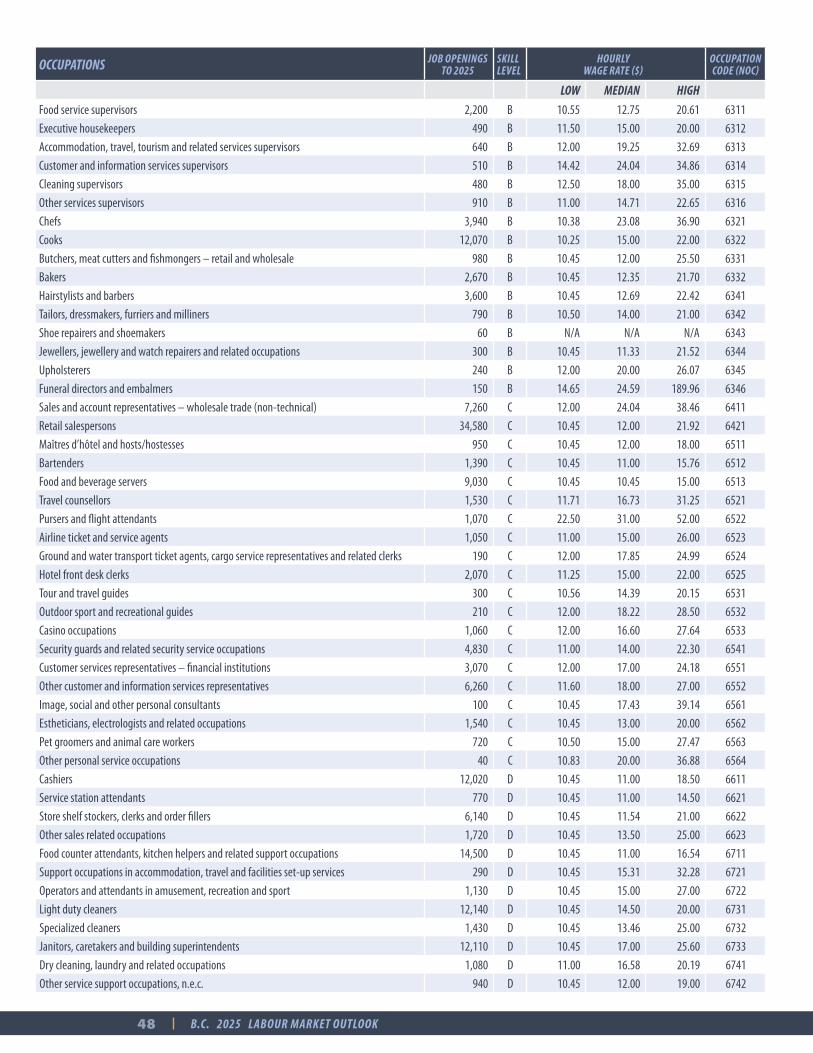
OCCUPATIONS JOB OPENINGS TO 2025
SKILL LEVEL
HOURLY WAGE RATE ($)
OCCUPATION CODE (NOC)
LOW MEDIAN HIGH
Food service supervisors 2,200 B 10.55 12.75 20.61 6311Executive housekeepers 490 B 11.50 15.00 20.00 6312Accommodation, travel, tourism and related services supervisors 640 B 12.00 19.25 32.69 6313Customer and information services supervisors 510 B 14.42 24.04 34.86 6314Cleaning supervisors 480 B 12.50 18.00 35.00 6315Other services supervisors 910 B 11.00 14.71 22.65 6316Chefs 3,940 B 10.38 23.08 36.90 6321Cooks 12,070 B 10.25 15.00 22.00 6322Butchers, meat cutters and fishmongers – retail and wholesale 980 B 10.45 12.00 25.50 6331Bakers 2,670 B 10.45 12.35 21.70 6332Hairstylists and barbers 3,600 B 10.45 12.69 22.42 6341Tailors, dressmakers, furriers and milliners 790 B 10.50 14.00 21.00 6342Shoe repairers and shoemakers 60 B N/A N/A N/A 6343Jewellers, jewellery and watch repairers and related occupations 300 B 10.45 11.33 21.52 6344Upholsterers 240 B 12.00 20.00 26.07 6345Funeral directors and embalmers 150 B 14.65 24.59 189.96 6346Sales and account representatives – wholesale trade (non-technical) 7,260 C 12.00 24.04 38.46 6411Retail salespersons 34,580 C 10.45 12.00 21.92 6421Maîtres d’hôtel and hosts/hostesses 950 C 10.45 12.00 18.00 6511Bartenders 1,390 C 10.45 11.00 15.76 6512Food and beverage servers 9,030 C 10.45 10.45 15.00 6513Travel counsellors 1,530 C 11.71 16.73 31.25 6521Pursers and flight attendants 1,070 C 22.50 31.00 52.00 6522Airline ticket and service agents 1,050 C 11.00 15.00 26.00 6523Ground and water transport ticket agents, cargo service representatives and related clerks 190 C 12.00 17.85 24.99 6524Hotel front desk clerks 2,070 C 11.25 15.00 22.00 6525Tour and travel guides 300 C 10.56 14.39 20.15 6531Outdoor sport and recreational guides 210 C 12.00 18.22 28.50 6532Casino occupations 1,060 C 12.00 16.60 27.64 6533Security guards and related security service occupations 4,830 C 11.00 14.00 22.30 6541Customer services representatives – financial institutions 3,070 C 12.00 17.00 24.18 6551Other customer and information services representatives 6,260 C 11.60 18.00 27.00 6552Image, social and other personal consultants 100 C 10.45 17.43 39.14 6561Estheticians, electrologists and related occupations 1,540 C 10.45 13.00 20.00 6562Pet groomers and animal care workers 720 C 10.50 15.00 27.47 6563Other personal service occupations 40 C 10.83 20.00 36.88 6564Cashiers 12,020 D 10.45 11.00 18.50 6611Service station attendants 770 D 10.45 11.00 14.50 6621Store shelf stockers, clerks and order fillers 6,140 D 10.45 11.54 21.00 6622Other sales related occupations 1,720 D 10.45 13.50 25.00 6623Food counter attendants, kitchen helpers and related support occupations 14,500 D 10.45 11.00 16.54 6711Support occupations in accommodation, travel and facilities set-up services 290 D 10.45 15.31 32.28 6721Operators and attendants in amusement, recreation and sport 1,130 D 10.45 15.00 27.00 6722Light duty cleaners 12,140 D 10.45 14.50 20.00 6731Specialized cleaners 1,430 D 10.45 13.46 25.00 6732Janitors, caretakers and building superintendents 12,110 D 10.45 17.00 25.60 6733Dry cleaning, laundry and related occupations 1,080 D 11.00 16.58 20.19 6741Other service support occupations, n.e.c. 940 D 10.45 12.00 19.00 6742
48 B.C. 2025 LABOUR MARKET OUTLOOK
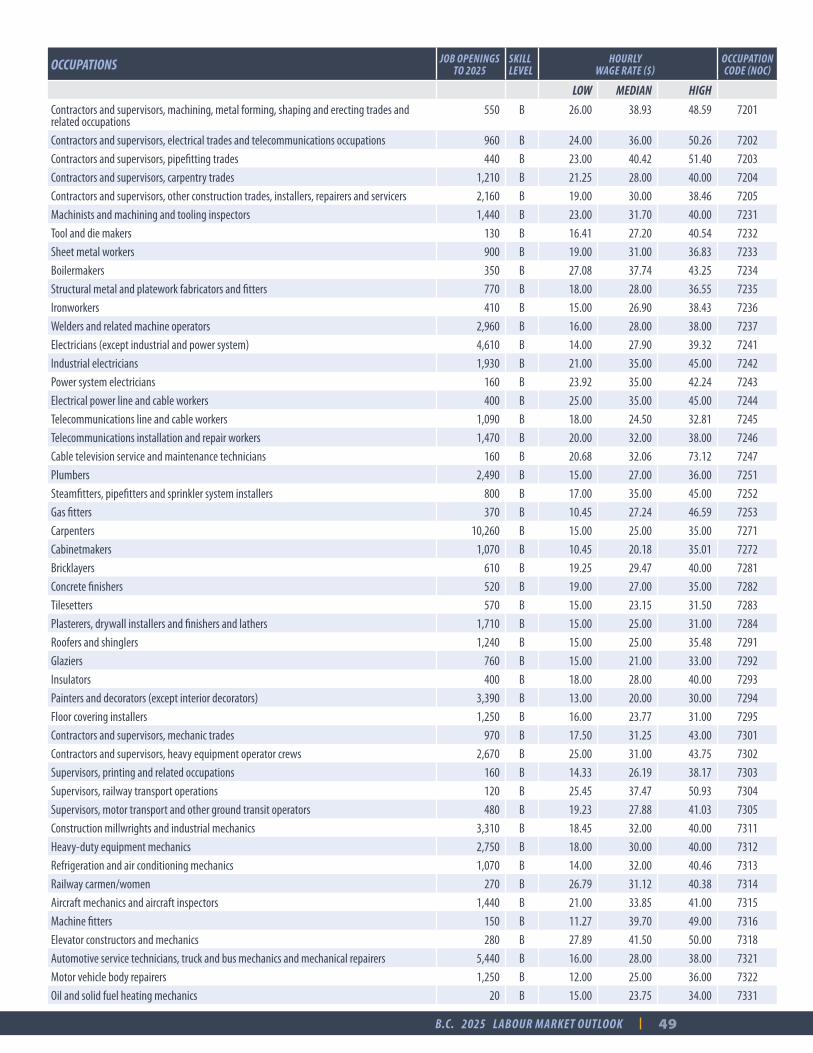
OCCUPATIONS JOB OPENINGS TO 2025
SKILL LEVEL
HOURLY WAGE RATE ($)
OCCUPATION CODE (NOC)
LOW MEDIAN HIGH
Contractors and supervisors, machining, metal forming, shaping and erecting trades and related occupations
550 B 26.00 38.93 48.59 7201
Contractors and supervisors, electrical trades and telecommunications occupations 960 B 24.00 36.00 50.26 7202Contractors and supervisors, pipefitting trades 440 B 23.00 40.42 51.40 7203Contractors and supervisors, carpentry trades 1,210 B 21.25 28.00 40.00 7204Contractors and supervisors, other construction trades, installers, repairers and servicers 2,160 B 19.00 30.00 38.46 7205Machinists and machining and tooling inspectors 1,440 B 23.00 31.70 40.00 7231Tool and die makers 130 B 16.41 27.20 40.54 7232Sheet metal workers 900 B 19.00 31.00 36.83 7233Boilermakers 350 B 27.08 37.74 43.25 7234Structural metal and platework fabricators and fitters 770 B 18.00 28.00 36.55 7235Ironworkers 410 B 15.00 26.90 38.43 7236Welders and related machine operators 2,960 B 16.00 28.00 38.00 7237Electricians (except industrial and power system) 4,610 B 14.00 27.90 39.32 7241Industrial electricians 1,930 B 21.00 35.00 45.00 7242Power system electricians 160 B 23.92 35.00 42.24 7243Electrical power line and cable workers 400 B 25.00 35.00 45.00 7244Telecommunications line and cable workers 1,090 B 18.00 24.50 32.81 7245Telecommunications installation and repair workers 1,470 B 20.00 32.00 38.00 7246Cable television service and maintenance technicians 160 B 20.68 32.06 73.12 7247Plumbers 2,490 B 15.00 27.00 36.00 7251Steamfitters, pipefitters and sprinkler system installers 800 B 17.00 35.00 45.00 7252Gas fitters 370 B 10.45 27.24 46.59 7253Carpenters 10,260 B 15.00 25.00 35.00 7271Cabinetmakers 1,070 B 10.45 20.18 35.01 7272Bricklayers 610 B 19.25 29.47 40.00 7281Concrete finishers 520 B 19.00 27.00 35.00 7282Tilesetters 570 B 15.00 23.15 31.50 7283Plasterers, drywall installers and finishers and lathers 1,710 B 15.00 25.00 31.00 7284Roofers and shinglers 1,240 B 15.00 25.00 35.48 7291Glaziers 760 B 15.00 21.00 33.00 7292Insulators 400 B 18.00 28.00 40.00 7293Painters and decorators (except interior decorators) 3,390 B 13.00 20.00 30.00 7294Floor covering installers 1,250 B 16.00 23.77 31.00 7295Contractors and supervisors, mechanic trades 970 B 17.50 31.25 43.00 7301Contractors and supervisors, heavy equipment operator crews 2,670 B 25.00 31.00 43.75 7302Supervisors, printing and related occupations 160 B 14.33 26.19 38.17 7303Supervisors, railway transport operations 120 B 25.45 37.47 50.93 7304Supervisors, motor transport and other ground transit operators 480 B 19.23 27.88 41.03 7305Construction millwrights and industrial mechanics 3,310 B 18.45 32.00 40.00 7311Heavy-duty equipment mechanics 2,750 B 18.00 30.00 40.00 7312Refrigeration and air conditioning mechanics 1,070 B 14.00 32.00 40.46 7313Railway carmen/women 270 B 26.79 31.12 40.38 7314Aircraft mechanics and aircraft inspectors 1,440 B 21.00 33.85 41.00 7315Machine fitters 150 B 11.27 39.70 49.00 7316Elevator constructors and mechanics 280 B 27.89 41.50 50.00 7318Automotive service technicians, truck and bus mechanics and mechanical repairers 5,440 B 16.00 28.00 38.00 7321Motor vehicle body repairers 1,250 B 12.00 25.00 36.00 7322Oil and solid fuel heating mechanics 20 B 15.00 23.75 34.00 7331
49B.C. 2025 LABOUR MARKET OUTLOOK
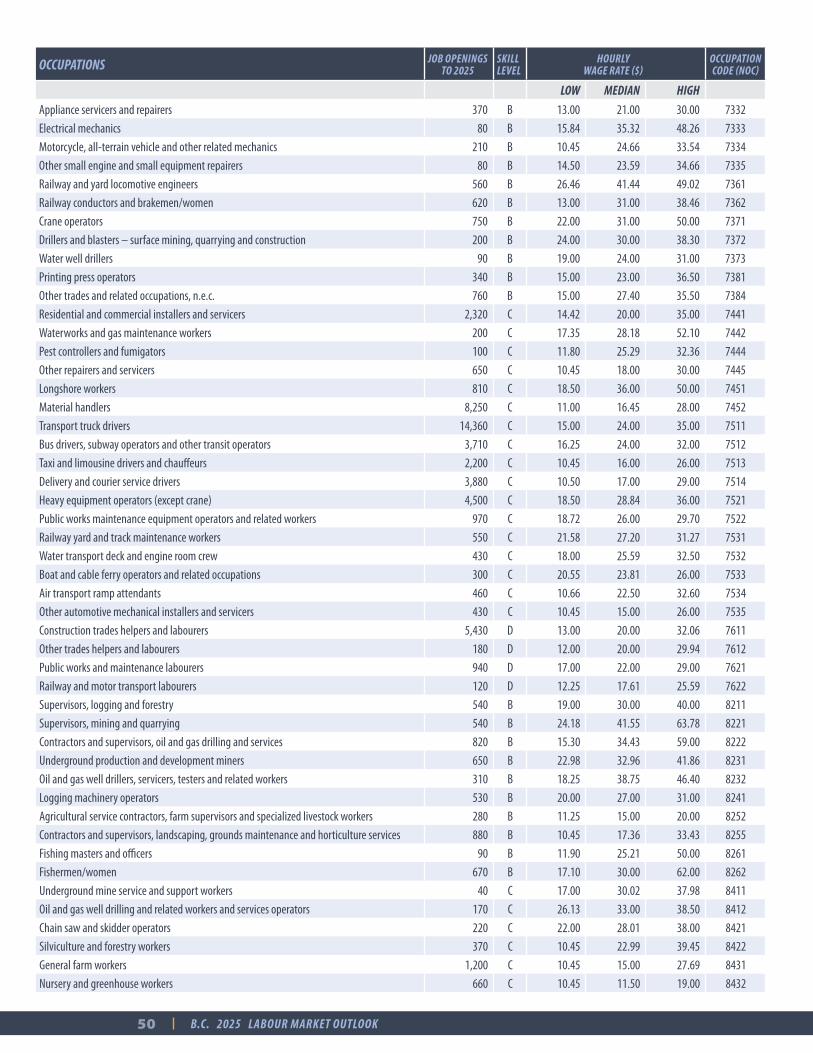
OCCUPATIONS JOB OPENINGS TO 2025
SKILL LEVEL
HOURLY WAGE RATE ($)
OCCUPATION CODE (NOC)
LOW MEDIAN HIGH
Appliance servicers and repairers 370 B 13.00 21.00 30.00 7332Electrical mechanics 80 B 15.84 35.32 48.26 7333Motorcycle, all-terrain vehicle and other related mechanics 210 B 10.45 24.66 33.54 7334Other small engine and small equipment repairers 80 B 14.50 23.59 34.66 7335Railway and yard locomotive engineers 560 B 26.46 41.44 49.02 7361Railway conductors and brakemen/women 620 B 13.00 31.00 38.46 7362Crane operators 750 B 22.00 31.00 50.00 7371Drillers and blasters – surface mining, quarrying and construction 200 B 24.00 30.00 38.30 7372Water well drillers 90 B 19.00 24.00 31.00 7373Printing press operators 340 B 15.00 23.00 36.50 7381Other trades and related occupations, n.e.c. 760 B 15.00 27.40 35.50 7384Residential and commercial installers and servicers 2,320 C 14.42 20.00 35.00 7441Waterworks and gas maintenance workers 200 C 17.35 28.18 52.10 7442Pest controllers and fumigators 100 C 11.80 25.29 32.36 7444Other repairers and servicers 650 C 10.45 18.00 30.00 7445Longshore workers 810 C 18.50 36.00 50.00 7451Material handlers 8,250 C 11.00 16.45 28.00 7452Transport truck drivers 14,360 C 15.00 24.00 35.00 7511Bus drivers, subway operators and other transit operators 3,710 C 16.25 24.00 32.00 7512Taxi and limousine drivers and chauffeurs 2,200 C 10.45 16.00 26.00 7513Delivery and courier service drivers 3,880 C 10.50 17.00 29.00 7514Heavy equipment operators (except crane) 4,500 C 18.50 28.84 36.00 7521Public works maintenance equipment operators and related workers 970 C 18.72 26.00 29.70 7522Railway yard and track maintenance workers 550 C 21.58 27.20 31.27 7531Water transport deck and engine room crew 430 C 18.00 25.59 32.50 7532Boat and cable ferry operators and related occupations 300 C 20.55 23.81 26.00 7533Air transport ramp attendants 460 C 10.66 22.50 32.60 7534Other automotive mechanical installers and servicers 430 C 10.45 15.00 26.00 7535Construction trades helpers and labourers 5,430 D 13.00 20.00 32.06 7611Other trades helpers and labourers 180 D 12.00 20.00 29.94 7612Public works and maintenance labourers 940 D 17.00 22.00 29.00 7621Railway and motor transport labourers 120 D 12.25 17.61 25.59 7622Supervisors, logging and forestry 540 B 19.00 30.00 40.00 8211Supervisors, mining and quarrying 540 B 24.18 41.55 63.78 8221Contractors and supervisors, oil and gas drilling and services 820 B 15.30 34.43 59.00 8222Underground production and development miners 650 B 22.98 32.96 41.86 8231Oil and gas well drillers, servicers, testers and related workers 310 B 18.25 38.75 46.40 8232Logging machinery operators 530 B 20.00 27.00 31.00 8241Agricultural service contractors, farm supervisors and specialized livestock workers 280 B 11.25 15.00 20.00 8252Contractors and supervisors, landscaping, grounds maintenance and horticulture services 880 B 10.45 17.36 33.43 8255Fishing masters and officers 90 B 11.90 25.21 50.00 8261Fishermen/women 670 B 17.10 30.00 62.00 8262Underground mine service and support workers 40 C 17.00 30.02 37.98 8411Oil and gas well drilling and related workers and services operators 170 C 26.13 33.00 38.50 8412Chain saw and skidder operators 220 C 22.00 28.01 38.00 8421Silviculture and forestry workers 370 C 10.45 22.99 39.45 8422General farm workers 1,200 C 10.45 15.00 27.69 8431Nursery and greenhouse workers 660 C 10.45 11.50 19.00 8432
50 B.C. 2025 LABOUR MARKET OUTLOOK
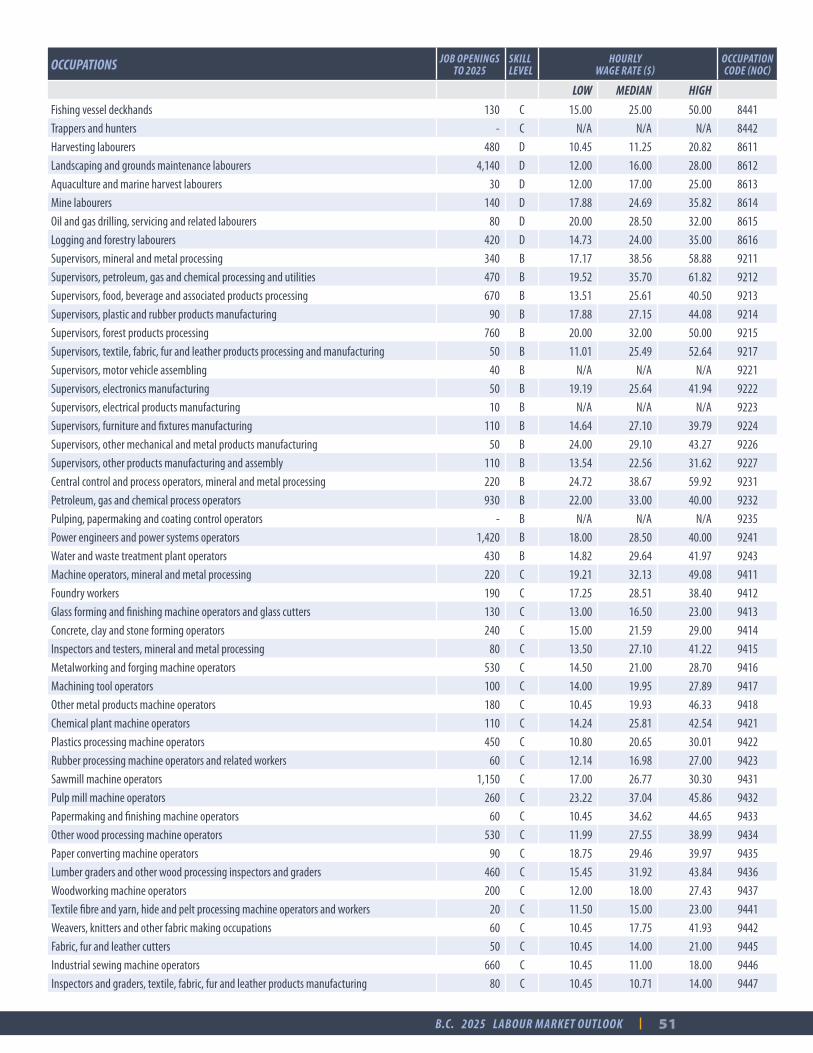
OCCUPATIONS JOB OPENINGS TO 2025
SKILL LEVEL
HOURLY WAGE RATE ($)
OCCUPATION CODE (NOC)
LOW MEDIAN HIGH
Fishing vessel deckhands 130 C 15.00 25.00 50.00 8441Trappers and hunters - C N/A N/A N/A 8442Harvesting labourers 480 D 10.45 11.25 20.82 8611Landscaping and grounds maintenance labourers 4,140 D 12.00 16.00 28.00 8612Aquaculture and marine harvest labourers 30 D 12.00 17.00 25.00 8613Mine labourers 140 D 17.88 24.69 35.82 8614Oil and gas drilling, servicing and related labourers 80 D 20.00 28.50 32.00 8615Logging and forestry labourers 420 D 14.73 24.00 35.00 8616Supervisors, mineral and metal processing 340 B 17.17 38.56 58.88 9211Supervisors, petroleum, gas and chemical processing and utilities 470 B 19.52 35.70 61.82 9212Supervisors, food, beverage and associated products processing 670 B 13.51 25.61 40.50 9213Supervisors, plastic and rubber products manufacturing 90 B 17.88 27.15 44.08 9214Supervisors, forest products processing 760 B 20.00 32.00 50.00 9215Supervisors, textile, fabric, fur and leather products processing and manufacturing 50 B 11.01 25.49 52.64 9217Supervisors, motor vehicle assembling 40 B N/A N/A N/A 9221Supervisors, electronics manufacturing 50 B 19.19 25.64 41.94 9222Supervisors, electrical products manufacturing 10 B N/A N/A N/A 9223Supervisors, furniture and fixtures manufacturing 110 B 14.64 27.10 39.79 9224Supervisors, other mechanical and metal products manufacturing 50 B 24.00 29.10 43.27 9226Supervisors, other products manufacturing and assembly 110 B 13.54 22.56 31.62 9227Central control and process operators, mineral and metal processing 220 B 24.72 38.67 59.92 9231Petroleum, gas and chemical process operators 930 B 22.00 33.00 40.00 9232Pulping, papermaking and coating control operators - B N/A N/A N/A 9235Power engineers and power systems operators 1,420 B 18.00 28.50 40.00 9241Water and waste treatment plant operators 430 B 14.82 29.64 41.97 9243Machine operators, mineral and metal processing 220 C 19.21 32.13 49.08 9411Foundry workers 190 C 17.25 28.51 38.40 9412Glass forming and finishing machine operators and glass cutters 130 C 13.00 16.50 23.00 9413Concrete, clay and stone forming operators 240 C 15.00 21.59 29.00 9414Inspectors and testers, mineral and metal processing 80 C 13.50 27.10 41.22 9415Metalworking and forging machine operators 530 C 14.50 21.00 28.70 9416Machining tool operators 100 C 14.00 19.95 27.89 9417Other metal products machine operators 180 C 10.45 19.93 46.33 9418Chemical plant machine operators 110 C 14.24 25.81 42.54 9421Plastics processing machine operators 450 C 10.80 20.65 30.01 9422Rubber processing machine operators and related workers 60 C 12.14 16.98 27.00 9423Sawmill machine operators 1,150 C 17.00 26.77 30.30 9431Pulp mill machine operators 260 C 23.22 37.04 45.86 9432Papermaking and finishing machine operators 60 C 10.45 34.62 44.65 9433Other wood processing machine operators 530 C 11.99 27.55 38.99 9434Paper converting machine operators 90 C 18.75 29.46 39.97 9435Lumber graders and other wood processing inspectors and graders 460 C 15.45 31.92 43.84 9436Woodworking machine operators 200 C 12.00 18.00 27.43 9437Textile fibre and yarn, hide and pelt processing machine operators and workers 20 C 11.50 15.00 23.00 9441Weavers, knitters and other fabric making occupations 60 C 10.45 17.75 41.93 9442Fabric, fur and leather cutters 50 C 10.45 14.00 21.00 9445Industrial sewing machine operators 660 C 10.45 11.00 18.00 9446Inspectors and graders, textile, fabric, fur and leather products manufacturing 80 C 10.45 10.71 14.00 9447
51B.C. 2025 LABOUR MARKET OUTLOOK

OCCUPATIONS JOB OPENINGS TO 2025
SKILL LEVEL
HOURLY WAGE RATE ($)
OCCUPATION CODE (NOC)
LOW MEDIAN HIGH
Process control and machine operators, food, beverage and associated products processing 1,240 C 11.00 18.00 30.00 9461Industrial butchers and meat cutters, poultry preparers and related workers 510 C 10.45 18.13 28.96 9462Fish and seafood plant workers 500 C 10.75 14.00 19.00 9463Testers and graders, food, beverage and associated products processing 170 C 10.45 21.18 29.69 9465Plateless printing equipment operators 450 C 10.45 18.26 30.40 9471Camera, platemaking and other prepress occupations 150 C 15.58 25.23 39.72 9472Binding and finishing machine operators 210 C 10.45 17.22 28.73 9473Photographic and film processors 360 C 11.00 14.75 20.40 9474Aircraft assemblers and aircraft assembly inspectors 80 C N/A N/A N/A 9521Motor vehicle assemblers, inspectors and testers 360 C 10.45 24.76 32.82 9522Electronics assemblers, fabricators, inspectors and testers 430 C 10.45 17.56 24.34 9523Assemblers and inspectors, electrical appliance, apparatus and equipment manufacturing 260 C 13.48 20.76 35.51 9524Assemblers, fabricators and inspectors, industrial electrical motors and transformers 40 C 14.98 21.92 32.17 9525Mechanical assemblers and inspectors 320 C 12.80 20.29 33.57 9526Machine operators and inspectors, electrical apparatus manufacturing 40 C 10.81 17.20 57.70 9527Boat assemblers and inspectors 320 C 15.64 19.00 31.00 9531Furniture and fixture assemblers and inspectors 470 C 11.50 15.00 24.77 9532Other wood products assemblers and inspectors 330 C 12.00 18.00 26.00 9533Furniture finishers and refinishers 240 C 13.00 18.75 28.00 9534Plastic products assemblers, finishers and inspectors 130 C 10.45 19.02 27.93 9535Industrial painters, coaters and metal finishing process operators 430 C 14.00 23.04 37.90 9536Other products assemblers, finishers and inspectors 430 C 12.00 14.00 28.85 9537Labourers in mineral and metal processing 180 D 13.73 20.00 29.85 9611Labourers in metal fabrication 240 D 10.45 19.23 38.98 9612Labourers in chemical products processing and utilities 120 D 10.45 21.71 32.62 9613Labourers in wood, pulp and paper processing 490 D 14.00 24.50 29.11 9614Labourers in rubber and plastic products manufacturing 60 D 11.50 16.39 22.00 9615Labourers in textile processing 20 D N/A N/A N/A 9616Labourers in food, beverage and associated products processing 2,860 D 10.45 14.00 23.00 9617Labourers in fish and seafood processing 170 D 10.45 13.08 23.85 9618Other labourers in processing, manufacturing and utilities 1,510 D 10.45 15.00 26.93 9619
*NOTES: Data source for wage: ESDC Job Bank hourly wage updated in 2015, unless otherwise noted. For occupations with a “*”, annual wage rates are provided as hourly wage data are not available. The low wage rate refers to the 10th percentile, which indicates 90% of the workers in this occupation make the low wage or more; The high wage rate refers to the 90th percentile, which indicates 90% of the workers in the occupation make the high wage or less. Wage data for Cooks and Chefs are based on Go2HR. Cook Labour Market Analysis Final Report. B.C. Sector Labour Market Partnerships Program. June 2016.
*SKILLS LEVEL DEFINITIONS
SKILL LEVEL 0: Usually requiring a combination of education and experience
SKILL LEVEL A: Usually requiring a Bachelor’s, Graduate or First Professional Degree
SKILL LEVEL B: Usually requiring diploma, certificate or apprenticeship training
SKILL LEVEL C: Usually requiring secondary school and/or occupation-specific training
SKILL LEVEL D: Usually requiring on-the-job training
52 B.C. 2025 LABOUR MARKET OUTLOOK

NOTES. . . . . . . . . . . . . . . . . . . . . . . . . . . . . . . . . . . . . . . . . . . . . . . . . . . . . . . . . . . . . . . . . . . . . . . . . . . . . . . . . . . . . . . . . . . . . . . . . . . . . . . . . . . . . . . . . .
. . . . . . . . . . . . . . . . . . . . . . . . . . . . . . . . . . . . . . . . . . . . . . . . . . . . . . . . . . . . . . . . . . . . . . . . . . . . . . . . . . . . . . . . . . . . . . . . . . . . . . . . . . . . . . . . . .
. . . . . . . . . . . . . . . . . . . . . . . . . . . . . . . . . . . . . . . . . . . . . . . . . . . . . . . . . . . . . . . . . . . . . . . . . . . . . . . . . . . . . . . . . . . . . . . . . . . . . . . . . . . . . . . . . .
. . . . . . . . . . . . . . . . . . . . . . . . . . . . . . . . . . . . . . . . . . . . . . . . . . . . . . . . . . . . . . . . . . . . . . . . . . . . . . . . . . . . . . . . . . . . . . . . . . . . . . . . . . . . . . . . . .
. . . . . . . . . . . . . . . . . . . . . . . . . . . . . . . . . . . . . . . . . . . . . . . . . . . . . . . . . . . . . . . . . . . . . . . . . . . . . . . . . . . . . . . . . . . . . . . . . . . . . . . . . . . . . . . . . .
. . . . . . . . . . . . . . . . . . . . . . . . . . . . . . . . . . . . . . . . . . . . . . . . . . . . . . . . . . . . . . . . . . . . . . . . . . . . . . . . . . . . . . . . . . . . . . . . . . . . . . . . . . . . . . . . . .
. . . . . . . . . . . . . . . . . . . . . . . . . . . . . . . . . . . . . . . . . . . . . . . . . . . . . . . . . . . . . . . . . . . . . . . . . . . . . . . . . . . . . . . . . . . . . . . . . . . . . . . . . . . . . . . . . .
. . . . . . . . . . . . . . . . . . . . . . . . . . . . . . . . . . . . . . . . . . . . . . . . . . . . . . . . . . . . . . . . . . . . . . . . . . . . . . . . . . . . . . . . . . . . . . . . . . . . . . . . . . . . . . . . . .
. . . . . . . . . . . . . . . . . . . . . . . . . . . . . . . . . . . . . . . . . . . . . . . . . . . . . . . . . . . . . . . . . . . . . . . . . . . . . . . . . . . . . . . . . . . . . . . . . . . . . . . . . . . . . . . . . .
. . . . . . . . . . . . . . . . . . . . . . . . . . . . . . . . . . . . . . . . . . . . . . . . . . . . . . . . . . . . . . . . . . . . . . . . . . . . . . . . . . . . . . . . . . . . . . . . . . . . . . . . . . . . . . . . . .
. . . . . . . . . . . . . . . . . . . . . . . . . . . . . . . . . . . . . . . . . . . . . . . . . . . . . . . . . . . . . . . . . . . . . . . . . . . . . . . . . . . . . . . . . . . . . . . . . . . . . . . . . . . . . . . . . .
. . . . . . . . . . . . . . . . . . . . . . . . . . . . . . . . . . . . . . . . . . . . . . . . . . . . . . . . . . . . . . . . . . . . . . . . . . . . . . . . . . . . . . . . . . . . . . . . . . . . . . . . . . . . . . . . . .
. . . . . . . . . . . . . . . . . . . . . . . . . . . . . . . . . . . . . . . . . . . . . . . . . . . . . . . . . . . . . . . . . . . . . . . . . . . . . . . . . . . . . . . . . . . . . . . . . . . . . . . . . . . . . . . . . .
. . . . . . . . . . . . . . . . . . . . . . . . . . . . . . . . . . . . . . . . . . . . . . . . . . . . . . . . . . . . . . . . . . . . . . . . . . . . . . . . . . . . . . . . . . . . . . . . . . . . . . . . . . . . . . . . . .
. . . . . . . . . . . . . . . . . . . . . . . . . . . . . . . . . . . . . . . . . . . . . . . . . . . . . . . . . . . . . . . . . . . . . . . . . . . . . . . . . . . . . . . . . . . . . . . . . . . . . . . . . . . . . . . . . .
. . . . . . . . . . . . . . . . . . . . . . . . . . . . . . . . . . . . . . . . . . . . . . . . . . . . . . . . . . . . . . . . . . . . . . . . . . . . . . . . . . . . . . . . . . . . . . . . . . . . . . . . . . . . . . . . . .
. . . . . . . . . . . . . . . . . . . . . . . . . . . . . . . . . . . . . . . . . . . . . . . . . . . . . . . . . . . . . . . . . . . . . . . . . . . . . . . . . . . . . . . . . . . . . . . . . . . . . . . . . . . . . . . . . .
. . . . . . . . . . . . . . . . . . . . . . . . . . . . . . . . . . . . . . . . . . . . . . . . . . . . . . . . . . . . . . . . . . . . . . . . . . . . . . . . . . . . . . . . . . . . . . . . . . . . . . . . . . . . . . . . . .
. . . . . . . . . . . . . . . . . . . . . . . . . . . . . . . . . . . . . . . . . . . . . . . . . . . . . . . . . . . . . . . . . . . . . . . . . . . . . . . . . . . . . . . . . . . . . . . . . . . . . . . . . . . . . . . . . .
. . . . . . . . . . . . . . . . . . . . . . . . . . . . . . . . . . . . . . . . . . . . . . . . . . . . . . . . . . . . . . . . . . . . . . . . . . . . . . . . . . . . . . . . . . . . . . . . . . . . . . . . . . . . . . . . . .
. . . . . . . . . . . . . . . . . . . . . . . . . . . . . . . . . . . . . . . . . . . . . . . . . . . . . . . . . . . . . . . . . . . . . . . . . . . . . . . . . . . . . . . . . . . . . . . . . . . . . . . . . . . . . . . . . .
. . . . . . . . . . . . . . . . . . . . . . . . . . . . . . . . . . . . . . . . . . . . . . . . . . . . . . . . . . . . . . . . . . . . . . . . . . . . . . . . . . . . . . . . . . . . . . . . . . . . . . . . . . . . . . . . . .
. . . . . . . . . . . . . . . . . . . . . . . . . . . . . . . . . . . . . . . . . . . . . . . . . . . . . . . . . . . . . . . . . . . . . . . . . . . . . . . . . . . . . . . . . . . . . . . . . . . . . . . . . . . . . . . . . .
. . . . . . . . . . . . . . . . . . . . . . . . . . . . . . . . . . . . . . . . . . . . . . . . . . . . . . . . . . . . . . . . . . . . . . . . . . . . . . . . . . . . . . . . . . . . . . . . . . . . . . . . . . . . . . . . . .
. . . . . . . . . . . . . . . . . . . . . . . . . . . . . . . . . . . . . . . . . . . . . . . . . . . . . . . . . . . . . . . . . . . . . . . . . . . . . . . . . . . . . . . . . . . . . . . . . . . . . . . . . . . . . . . . . .
. . . . . . . . . . . . . . . . . . . . . . . . . . . . . . . . . . . . . . . . . . . . . . . . . . . . . . . . . . . . . . . . . . . . . . . . . . . . . . . . . . . . . . . . . . . . . . . . . . . . . . . . . . . . . . . . . .
. . . . . . . . . . . . . . . . . . . . . . . . . . . . . . . . . . . . . . . . . . . . . . . . . . . . . . . . . . . . . . . . . . . . . . . . . . . . . . . . . . . . . . . . . . . . . . . . . . . . . . . . . . . . . . . . . .
. . . . . . . . . . . . . . . . . . . . . . . . . . . . . . . . . . . . . . . . . . . . . . . . . . . . . . . . . . . . . . . . . . . . . . . . . . . . . . . . . . . . . . . . . . . . . . . . . . . . . . . . . . . . . . . . . .
. . . . . . . . . . . . . . . . . . . . . . . . . . . . . . . . . . . . . . . . . . . . . . . . . . . . . . . . . . . . . . . . . . . . . . . . . . . . . . . . . . . . . . . . . . . . . . . . . . . . . . . . . . . . . . . . . .
. . . . . . . . . . . . . . . . . . . . . . . . . . . . . . . . . . . . . . . . . . . . . . . . . . . . . . . . . . . . . . . . . . . . . . . . . . . . . . . . . . . . . . . . . . . . . . . . . . . . . . . . . . . . . . . . . .
. . . . . . . . . . . . . . . . . . . . . . . . . . . . . . . . . . . . . . . . . . . . . . . . . . . . . . . . . . . . . . . . . . . . . . . . . . . . . . . . . . . . . . . . . . . . . . . . . . . . . . . . . . . . . . . . . .
. . . . . . . . . . . . . . . . . . . . . . . . . . . . . . . . . . . . . . . . . . . . . . . . . . . . . . . . . . . . . . . . . . . . . . . . . . . . . . . . . . . . . . . . . . . . . . . . . . . . . . . . . . . . . . . . . .
53B.C. 2025 LABOUR MARKET OUTLOOK

WORKBC.CAWORKBC.CA
![British Columbia Labour Market Outlook 2010 - 2020 · Labour Market OutlookLabour Market Outlook British Columbia Labour Market Outlook: 2010-2020 [2] B.C. Labour Market Outlook,](https://static.fdocuments.in/doc/165x107/5e167e8e481eae63a43f8127/british-columbia-labour-market-outlook-2010-2020-labour-market-outlooklabour-market.jpg)