BBVA: Strenghts in the new environment
21
1 BBVAFinance BoAML 20th Annual Banking & Financials Conference BBVA: Strengths in the new environment
Transcript of BBVA: Strenghts in the new environment

1 BBVAFinance
BoAML 20th Annual Banking & Financials Conference
BBVA: Strengths in the new environment
2
BBVA: Strengths in the new environment
Jaime Sáenz de Tejada, Chief Financial Officer
BoAML – 20th Annual Banking, Insurance & Diversified Financials CEO Conference “Shaping a business fit for the post-crisis era”
London, September 29th, 2015

3
Disclaimer
This document is only provided for information purposes and does not constitute, nor must it be interpreted as, an offer to sell or exchange or acquire, or
an invitation for offers to buy securities issued by any of the aforementioned companies. Any decision to buy or invest in securities in relation to a specific
issue must be made solely and exclusively on the basis of the information set out in the pertinent prospectus filed by the company in relation to such
specific issue. Nobody who becomes aware of the information contained in this report must regard it as definitive, because it is subject to changes and
modifications.
This document contains or may contain forward looking statements (in the usual meaning and within the meaning of the US Private Securities Litigation
Act of 1995) regarding intentions, expectations or projections of BBVA or of its management on the date thereof, that refer to miscellaneous aspects,
including projections about the future earnings of the business. The statements contained herein are based on our current projections, although the said
earnings may be substantially modified in the future by certain risks, uncertainty and other factors relevant that may cause the results or final decisions to
differ from such intentions, projections or estimates. These factors include, without limitation, (1) the market situation, macroeconomic factors, regulatory,
political or government guidelines, (2) domestic and international stock market movements, exchange rates and interest rates, (3) competitive pressures,
(4) technological changes, (5) alterations in the financial situation, creditworthiness or solvency of our customers, debtors or counterparts. These factors
could condition and result in actual events differing from the information and intentions stated, projected or forecast in this document and other past or
future documents. BBVA does not undertake to publicly revise the contents of this or any other document, either if the events are not exactly as
described herein, or if such events lead to changes in the information of this document.
This document may contain summarised information or information that has not been audited, and its recipients are invited to consult the documentation
and public information filed by BBVA with stock market supervisory bodies, in particular, the prospectuses and periodical information filed with the
Spanish Securities Exchange Commission (CNMV) and the Annual Report on form 20-F and information on form 6-K that are disclosed to the US
Securities and Exchange Commission.
Distribution of this document in other jurisdictions may be prohibited, and recipients into whose possession this document comes shall be solely
responsible for informing themselves about, and observing any such restrictions. By accepting this document you agree to be bound by the foregoing
restrictions.
4
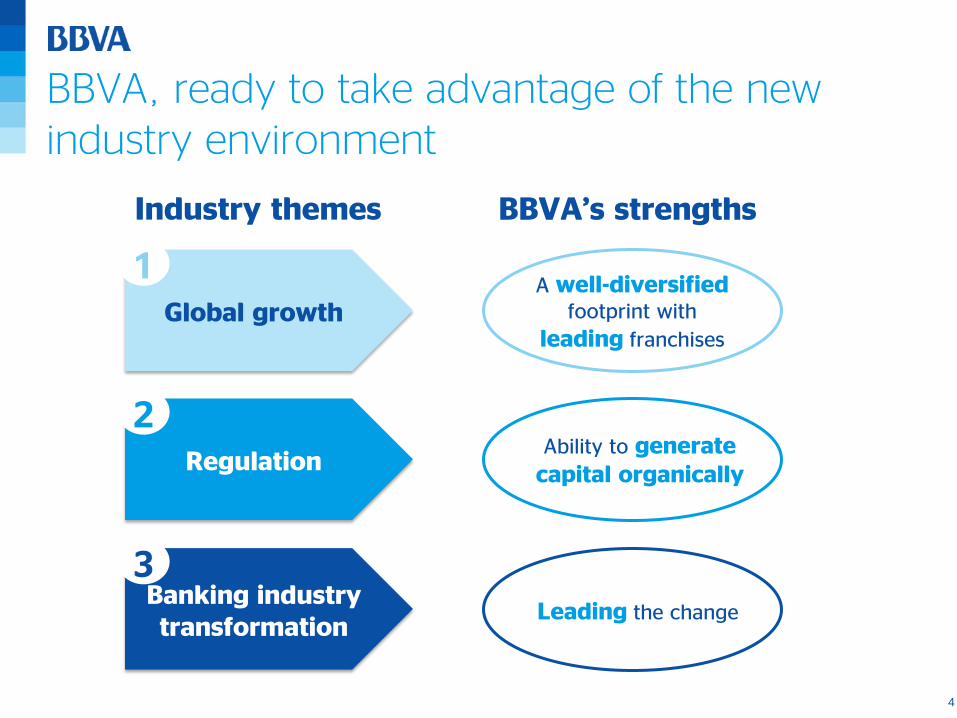
BBVA, ready to take advantage of the new industry environment
Industry themes BBVA’s strengths
A well-diversified footprint with
leading franchises
Ability to generate capital organically
Leading the change
Global growth
1
Regulation
2
Banking industry transformation
3
5
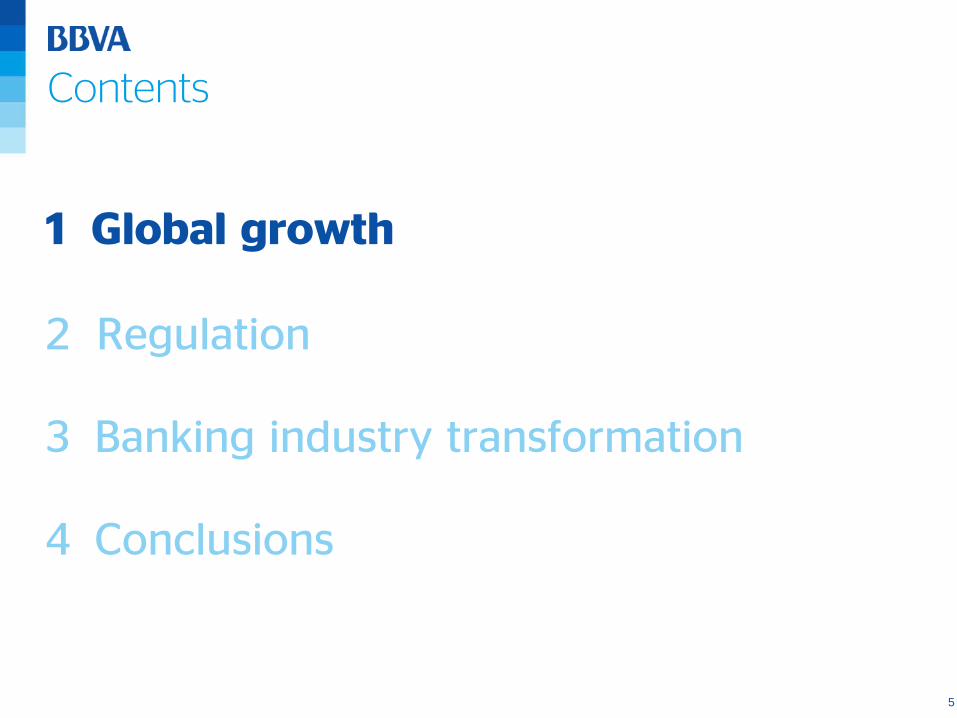
Contents
2 Regulation
1 Global growth
3 Banking industry transformation
4 Conclusions
6 6
40%
19%
11%
10%
6%
5% 3%
3% 1%
Mexico
Spain
Rest of Eurasia 2%
USA
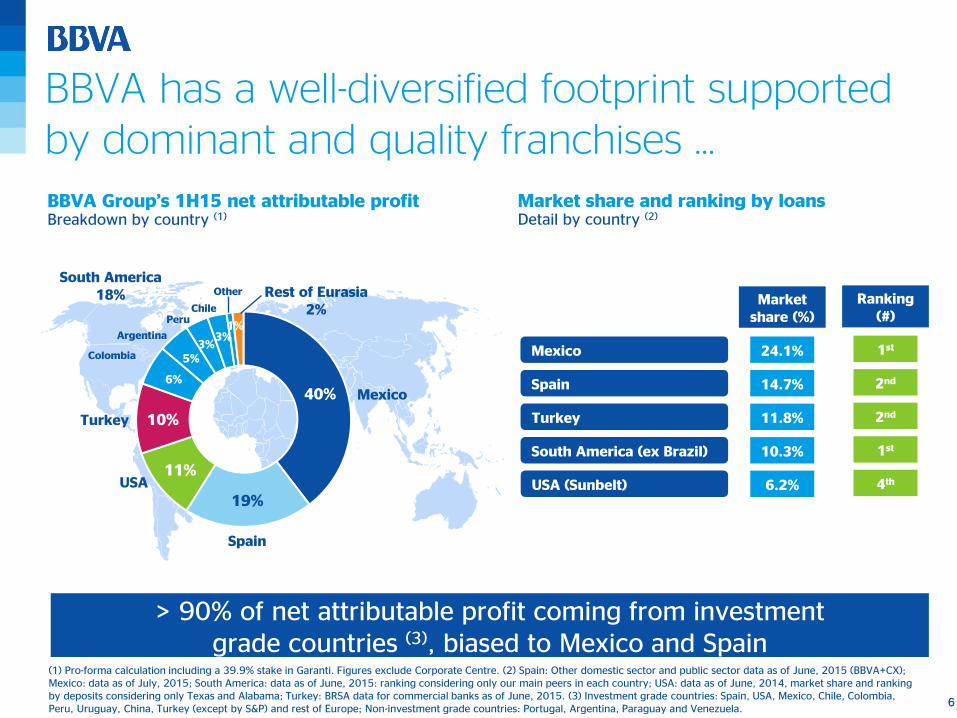
BBVA has a well-diversified footprint supported by dominant and quality franchises …
Turkey
(1) Pro-forma calculation including a 39.9% stake in Garanti. Figures exclude Corporate Centre. (2) Spain: Other domestic sector and public sector data as of June, 2015 (BBVA+CX); Mexico: data as of July, 2015; South America: data as of June, 2015: ranking considering only our main peers in each country; USA: data as of June, 2014, market share and ranking by deposits considering only Texas and Alabama; Turkey: BRSA data for commercial banks as of June, 2015. (3) Investment grade countries: Spain, USA, Mexico, Chile, Colombia, Peru, Uruguay, China, Turkey (except by S&P) and rest of Europe; Non-investment grade countries: Portugal, Argentina, Paraguay and Venezuela.
BBVA Group’s 1H15 net attributable profit Breakdown by country (1)
Colombia
Argentina
Peru Chile
South America 18% Other
> 90% of net attributable profit coming from investment grade countries (3), biased to Mexico and Spain
Ranking (#)
Mexico
Spain
Turkey
South America (ex Brazil)
24.1%
14.7%
11.8%
10.3%
Market share (%)
USA (Sunbelt) 6.2%
Market share and ranking by loans Detail by country (2)
1st
2nd
2nd
1st
4th
7
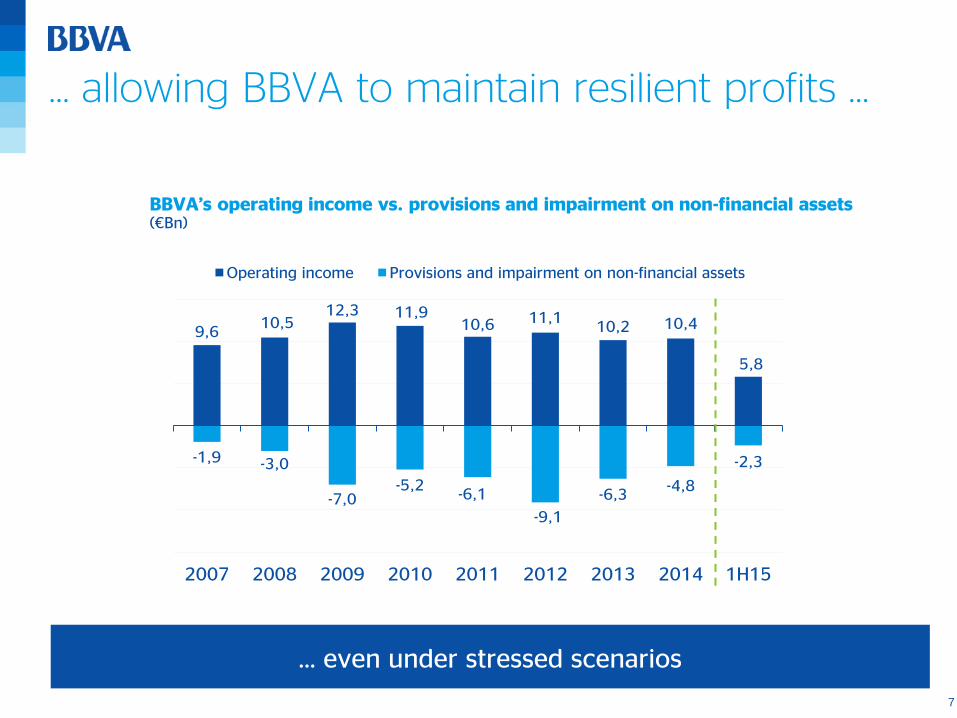
… allowing BBVA to maintain resilient profits …
BBVA’s operating income vs. provisions and impairment on non-financial assets (€Bn)
9,6 10,5
12,3 11,9 10,6 11,1
10,2 10,4
5,8
-1,9 -3,0
-7,0 -5,2
-6,1
-9,1
-6,3 -4,8
-2,3
2007 2008 2009 2010 2011 2012 2013 2014 1H15
Operating income Provisions and impairment on non-financial assets
… even under stressed scenarios
8
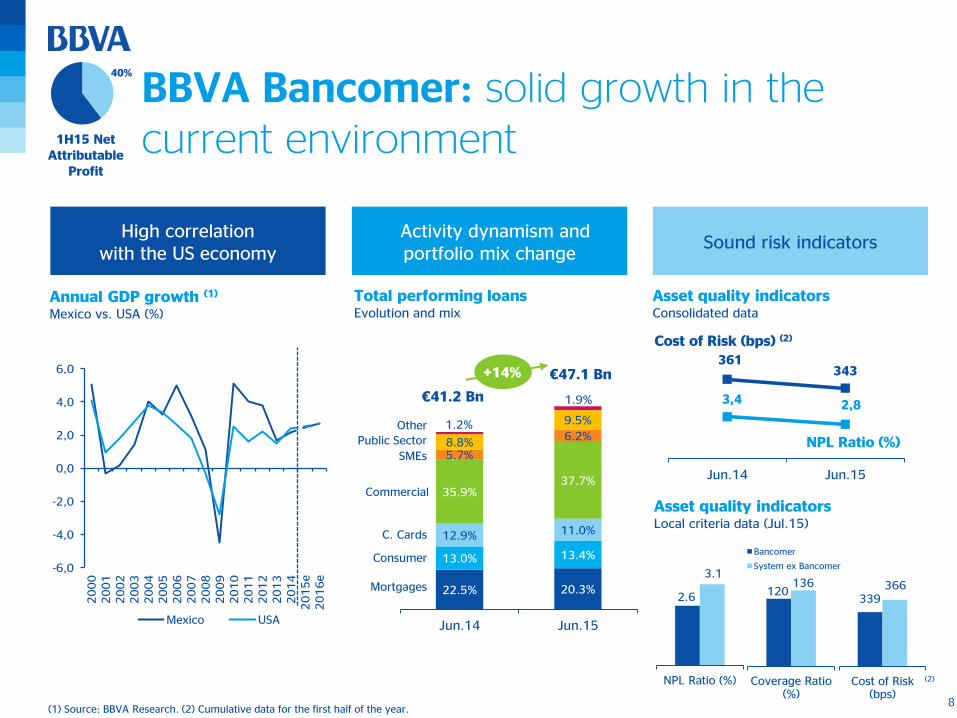
BBVA Bancomer: solid growth in the current environment
High correlation with the US economy
Activity dynamism and portfolio mix change
Sound risk indicators
Total performing loans
Evolution and mix
(1) Source: BBVA Research. (2) Cumulative data for the first half of the year.
3,4 2,8
361 343
200220240260280300320340360380400
012345678
Jun.14 Jun.15
NPL Ratio (%)
Cost of Risk (bps) (2)
Asset quality indicators
Consolidated data
1H15 Net Attributable
Profit
22.5% 20.3%
13.0% 13.4%
12.9% 11.0%
35.9% 37.7%
5.7%
6.2% 8.8%
9.5% 1.2%
1.9%
Jun.14 Jun.15
Mortgages
Consumer
C. Cards
SMEs
Public Sector
Other
€47.1 Bn
Commercial
Annual GDP growth (1)
Mexico vs. USA (%)
-6,0
-4,0
-2,0
0,0
2,0
4,0
6,0
20
00
20
01
20
02
20
03
20
04
20
05
20
06
20
07
20
08
20
09
20
10
20
11
20
12
20
13
20
14
20
15
e2
01
6e
Mexico USA
NPL Ratio (%) Coverage Ratio(%)
Bancomer
System ex Bancomer
Cost of Risk(bps)
120 136
339 366
2.6
3.1
€41.2 Bn
+14%
(2)
Asset quality indicators
Local criteria data (Jul.15)
40%
9
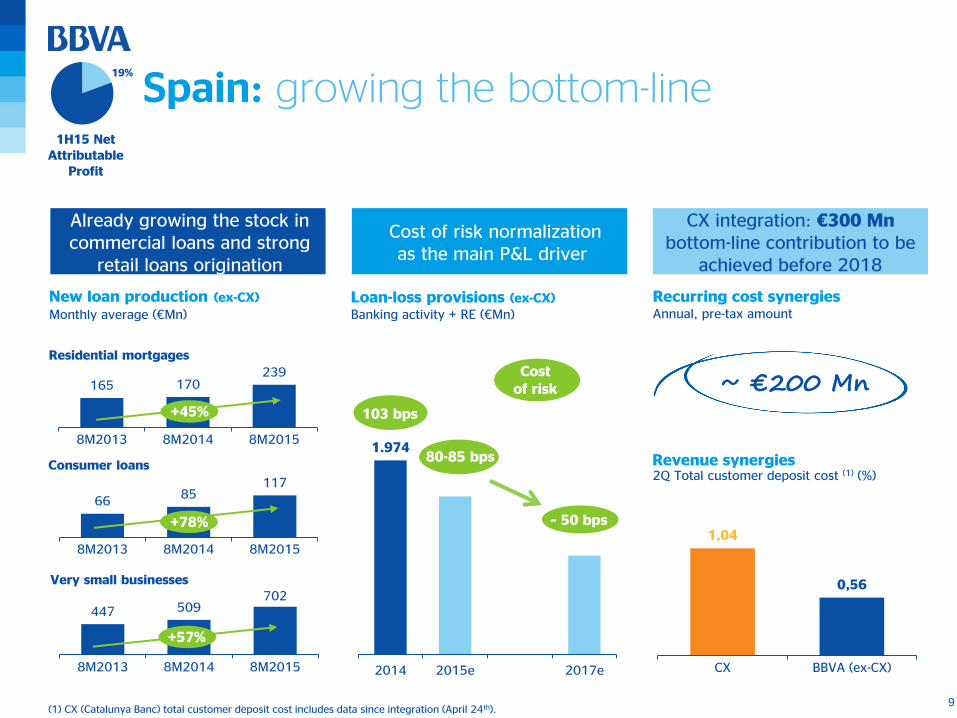
Spain: growing the bottom-line
New loan production (ex-CX)
Monthly average (€Mn)
66 85
117
8M2013 8M2014 8M2015
Consumer loans
165 170 239
8M2013 8M2014 8M2015
Residential mortgages
447 509 702
8M2013 8M2014 8M2015
Very small businesses
+78%
Recurring cost synergies Annual, pre-tax amount
Revenue synergies
1,04
0,56
CX BBVA (ex-CX)
(1) CX (Catalunya Banc) total customer deposit cost includes data since integration (April 24th).
+45%
+57%
2Q Total customer deposit cost (1) (%)
~ €200 Mn
Loan-loss provisions (ex-CX) Banking activity + RE (€Mn)
1.974
2014 2015e 2017e
103 bps
~ 50 bps
Cost of risk
80-85 bps
1H15 Net Attributable
Profit
Already growing the stock in commercial loans and strong
retail loans origination
Cost of risk normalization as the main P&L driver
CX integration: €300 Mn bottom-line contribution to be
achieved before 2018
19%
10
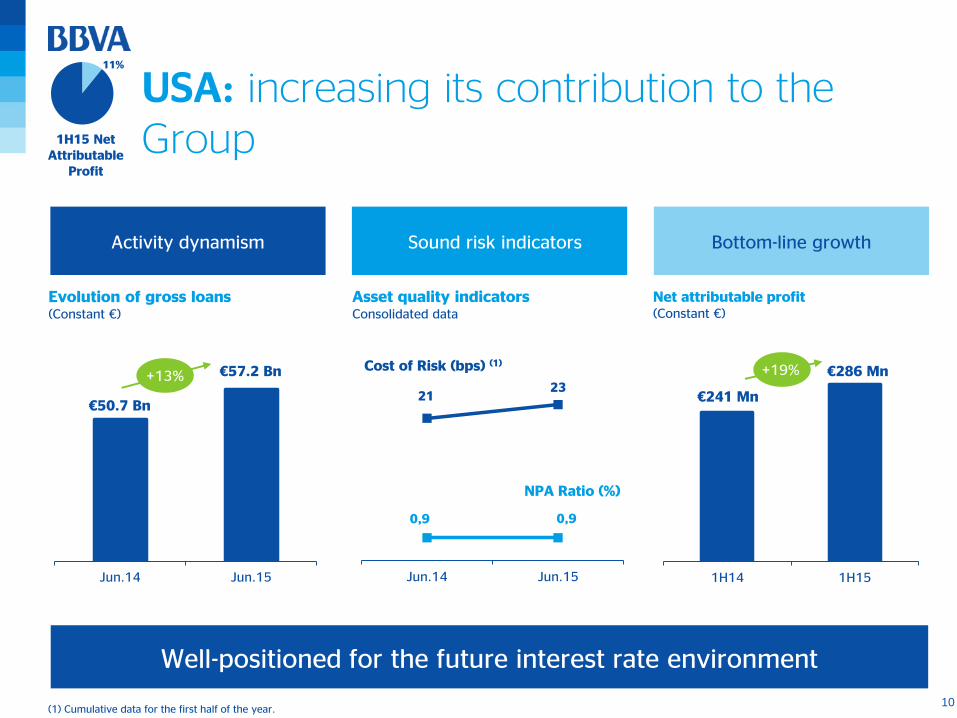
0,9 0,9
21 23
0
1
2
3
4
5
6
7
8
Jun.14 Jun.15
USA: increasing its contribution to the Group
Evolution of gross loans (Constant €)
Cost of Risk (bps) (1)
NPA Ratio (%)
Jun.14 Jun.15
€50.7 Bn
€57.2 Bn +13%
1H15 Net Attributable
Profit
Well-positioned for the future interest rate environment
Net attributable profit (Constant €)
1H14 1H15
€241 Mn
€286 Mn +19%
Asset quality indicators
Consolidated data
Activity dynamism Sound risk indicators Bottom-line growth
(1) Cumulative data for the first half of the year.
11%
11
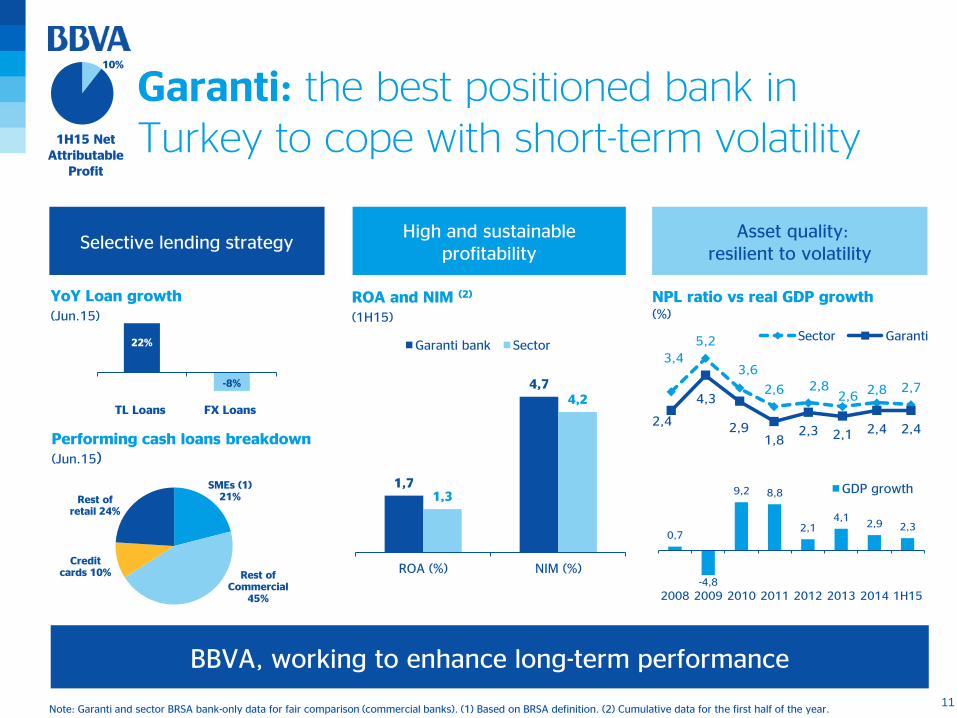
3,4
5,2
3,6
2,6 2,8 2,6
2,8 2,7
2,4
4,3
2,9 1,8
2,3 2,1 2,4 2,4
Sector Garanti
Garanti: the best positioned bank in Turkey to cope with short-term volatility
BBVA, working to enhance long-term performance
NPL ratio vs real GDP growth (%)
ROA and NIM (2)
(1H15)
0,7
-4,8
9,2 8,8
2,1 4,1
2,9 2,3
2008 2009 2010 2011 2012 2013 2014 1H15
GDP growth
1H15 Net Attributable
Profit
Note: Garanti and sector BRSA bank-only data for fair comparison (commercial banks). (1) Based on BRSA definition. (2) Cumulative data for the first half of the year.
High and sustainable profitability
Asset quality: resilient to volatility
Selective lending strategy
1,7
4,7
1,3
4,2
ROA (%) NIM (%)
Garanti bank Sector
SMEs (1) 21%
Rest of Commercial
45%
Credit cards 10%
Rest of retail 24%
Performing cash loans breakdown (Jun.15)
22%
-8%
TL Loans FX Loans
YoY Loan growth
(Jun.15)
10%
12
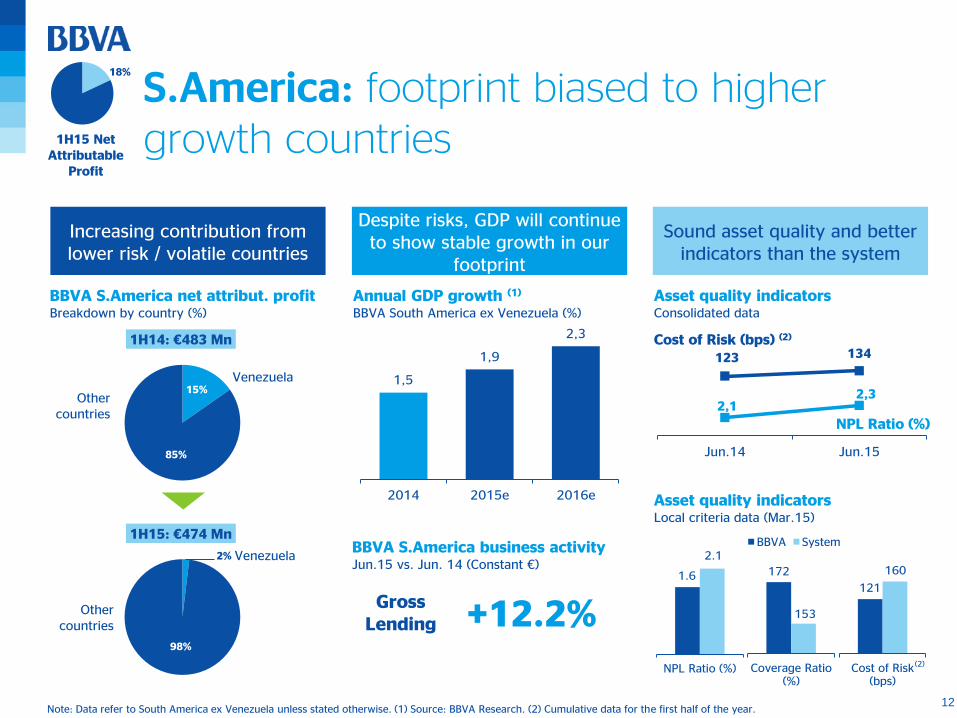
S.America: footprint biased to higher growth countries
2%
98%
1H15: €474 Mn
Increasing contribution from lower risk / volatile countries
Despite risks, GDP will continue to show stable growth in our
footprint
Sound asset quality and better indicators than the system
BBVA S.America net attribut. profit
Breakdown by country (%)
Venezuela
Other countries
Note: Data refer to South America ex Venezuela unless stated otherwise. (1) Source: BBVA Research. (2) Cumulative data for the first half of the year.
2,1 2,3
123 134
0
50
100
150
200
1,8
2,3
2,8
3,3
Jun.14 Jun.15
Cost of Risk (bps) (2)
Asset quality indicators
Consolidated data
NPL Ratio (%)
Asset quality indicators
Local criteria data (Mar.15)
NPL Ratio (%) Coverage Ratio(%)
BBVA System
Cost of Risk(bps)
172
153
121
160 1.6
2.1
18%
15%
85%
1H14: €483 Mn
Venezuela
Other countries
1H15 Net Attributable
Profit
1,5
1,9
2,3
2014 2015e 2016e
Annual GDP growth (1)
BBVA South America ex Venezuela (%)
BBVA S.America business activity
Jun.15 vs. Jun. 14 (Constant €)
Gross Lending +12.2%
(2)
13
Contents
2 Regulation
1 Global growth
3 Banking industry transformation
4 Conclusions
14
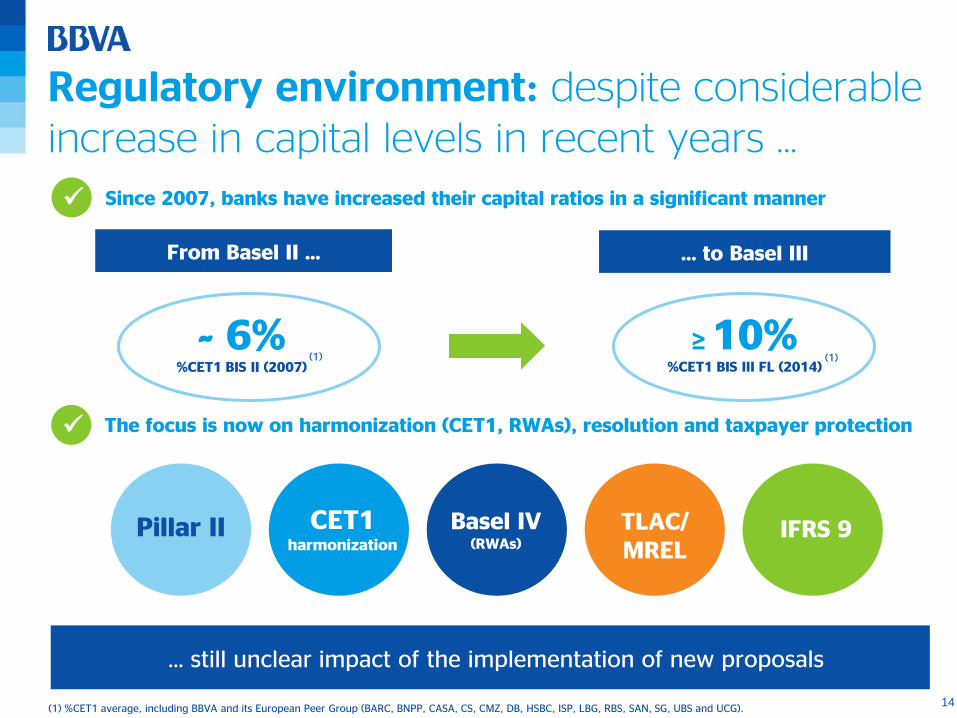
Regulatory environment: despite considerable increase in capital levels in recent years …
Since 2007, banks have increased their capital ratios in a significant manner
From Basel II …
The focus is now on harmonization (CET1, RWAs), resolution and taxpayer protection
… to Basel III
~ 6% %CET1 BIS II (2007)
≥ 10% %CET1 BIS III FL (2014)
(1) %CET1 average, including BBVA and its European Peer Group (BARC, BNPP, CASA, CS, CMZ, DB, HSBC, ISP, LBG, RBS, SAN, SG, UBS and UCG).
(1) (1)
… still unclear impact of the implementation of new proposals
Pillar II
TLAC / MREL
IFRS 9 CET1 harmonization
Basel IV (RWAs)
TLAC/ MREL
15
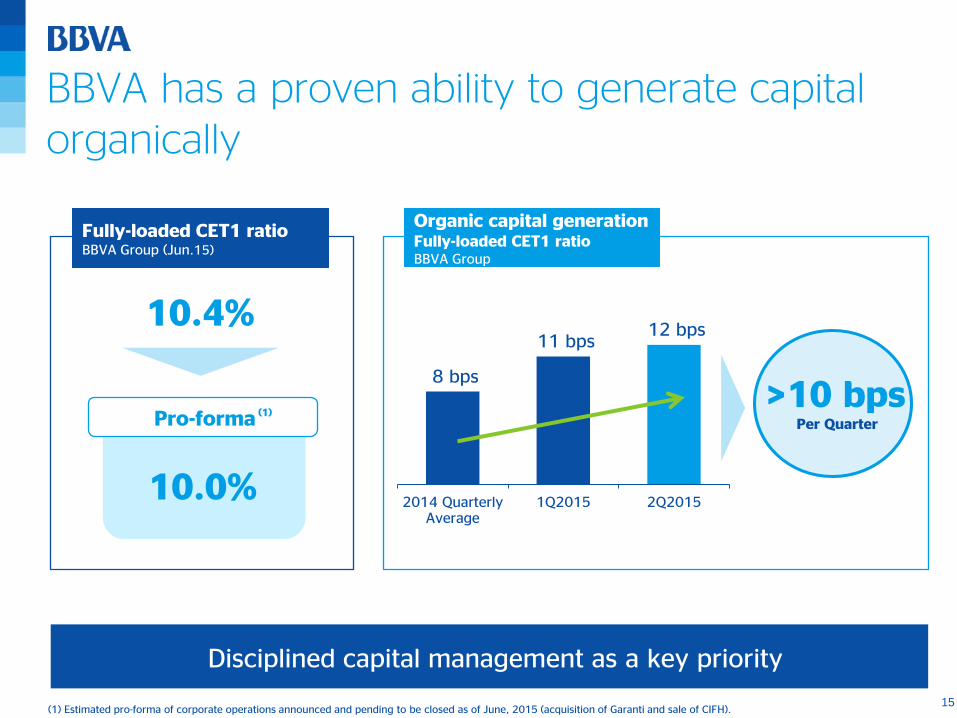
BBVA has a proven ability to generate capital organically
(1) Estimated pro-forma of corporate operations announced and pending to be closed as of June, 2015 (acquisition of Garanti and sale of CIFH).
Disciplined capital management as a key priority
10.4%
Pro-forma
10.0%
8 bps
11 bps 12 bps
2014 QuarterlyAverage
1Q2015 2Q2015
Organic capital generation Fully-loaded CET1 ratio BBVA Group
>10 bps Per Quarter
Fully-loaded CET1 ratio BBVA Group (Jun.15)
(1)
16
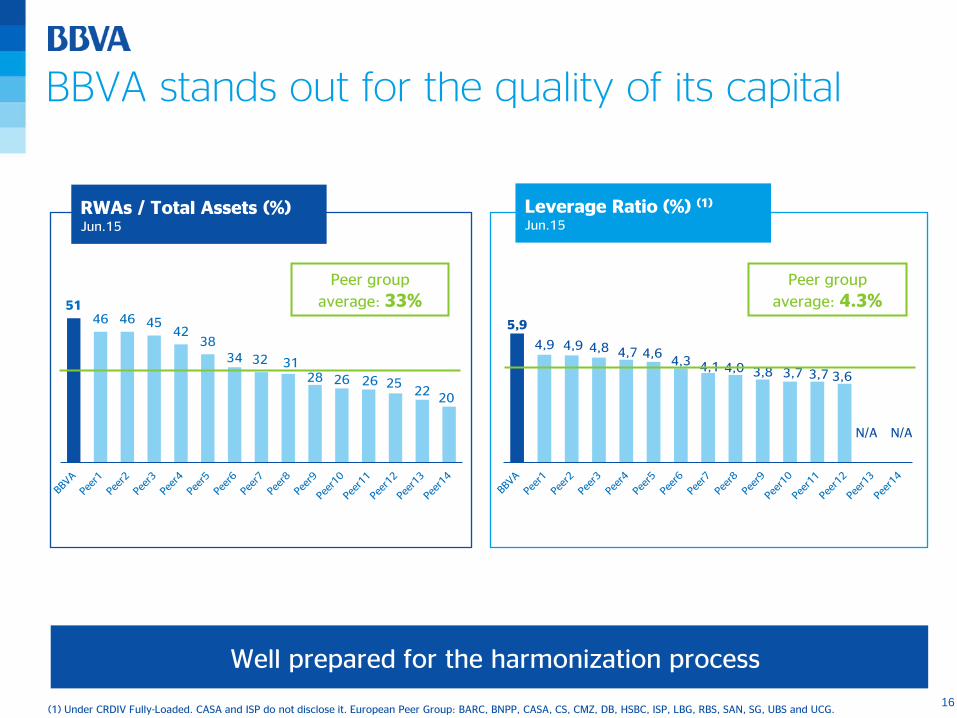
BBVA stands out for the quality of its capital
RWAs / Total Assets (%) Jun.15
Leverage Ratio (%) (1)
Jun.15
51 46 46 45
42 38
34 32 31 28 26 26 25
22 20
Peer group
average: 33% 5,9
4,9 4,9 4,8 4,7 4,6 4,3 4,1 4,0 3,8 3,7 3,7 3,6
N/A N/A
Peer group
average: 4.3%
(1) Under CRDIV Fully-Loaded. CASA and ISP do not disclose it. European Peer Group: BARC, BNPP, CASA, CS, CMZ, DB, HSBC, ISP, LBG, RBS, SAN, SG, UBS and UCG.
Well prepared for the harmonization process

17
Contents
2 Regulation
1 Global growth
3 Banking industry transformation
4 Conclusions
18
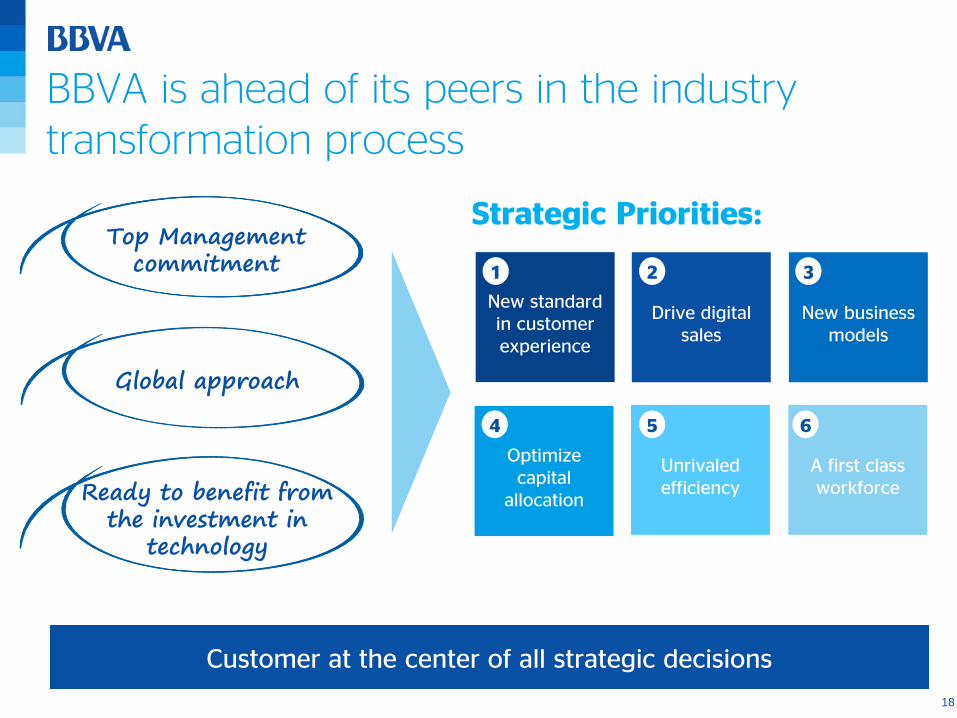
BBVA is ahead of its peers in the industry transformation process
A first class workforce
Unrivaled efficiency
Optimize capital
allocation
New business models
Drive digital sales
New standard in customer experience
Strategic Priorities:
Customer at the center of all strategic decisions
Global approach
Ready to benefit from the investment in
technology
1 2 3
4 5 6
Top Management commitment
19
Contents
2 Regulation
1 Global growth
3 Banking industry transformation
4 Conclusions
20
BBVA has built a sustainable competitive advantage, not easily replicable
Resilient growth thanks to a well-diversified footprint with leading franchises
High quality capital and sustainable organic generation
Leading the industry transformation, placing customers at the center of our strategy

21
BBVA: Strengths in the new environment
Jaime Sáenz de Tejada, Chief Financial Officer
BoAML – 20th Annual Banking, Insurance & Diversified Financials CEO Conference “Shaping a business fit for the post-crisis era”
London, September 29th, 2015