BBVA PILLAR III
163
BBVA PILLAR III 2017
Transcript of BBVA PILLAR III

BBVA PILLAR III2017

2017
Index
Glossary 4
Correspondence between the sections of Pillar III and the Group’s Consolidated Annual Report 6
Executive summary 13
Introduction 15
Regulatory environment in 2017 15
1. General information requirements 21
1.1. Corporate name and differences between the consolidable group for the purposes of the solvency regulations and accounting criteria 22
1.2. Identification of dependent institutions with capital resources below the minimum requirement. Possible impediments to capital transfer 27
1.3. Exemptions from capital requirements at the individual or sub-consolidated level 27
2. Own funds and Capital 28
2.1. Characteristics of the eligible capital resources 29
2.2. Amount of capital 31
2.3. Bank risk profile 33
2.4. Breakdown of minimum capital requirements by risk type 34
2.5. Procedure employed in the internal capital adequacy assessment process 37

IndexBBVA. PILAR III 2017 P. 3
3. Risks 38
3.1. General Risk Management and Control Model 40
3.2. Credit and counterparty risk 47
3.3. Market risk 110
3.4. Structural risk in the equity portfolio 121
3.5. Structural exchange-rate risk 123
3.6. Interest-Rate Risk 124
3.7. Liquidity Risk 126
3.8. Operational risk 137
4. Leverage Ratio 144
4.1. Leverage Ratio definition and composition 145
4.2. Trends in the ratio 146
4.3. Governance 146
5. Information on remuneration 147
5.1. Information on the decision-making process for establishing the remuneration policy for the Identified Staff 148
5.2. Description of the different types of employees included in the Identified Staff 151
5.3. Key features of the remuneration system 151
5.4. Information on the link between the remuneration of the Identified Staff and the performance of the Group 156
5.5. Description of the criteria used for taking into consideration present and future risks in the remuneration process 157
5.6. The main parameters and reasons for any component of the possible variable remuneration plans and other non-cash benefits 158
5.7. Ratios between the fixed and variable remuneration of the Identified Staff 158
5.8. Quantitative information on the remuneration of the Identified Staff 159
6. Information on the Corporate Governance system 162
7. Subsequent events 163

Glossary BBVA. PILAR III 2017 P. 4
Glossary
Glosario
Acronym Description
ALM (Asset - Liability Management)Mechanism for managing structural balance-sheet risk for possible mismatch between assets and liabilities and for various factors (interest rate, exchange rate, liquidity, etc.).
AMAAdvanced method approach used by the entity for calculating the consolidated capital requirements by operational risk
Risk-Weighted Assets (RWAs)The entity's exposure to risk weighted by a percentage obtained by the applicable rule (the Standardised Approach) or internal models
AT1 (Additional Tier 1) Additional Tier 1 capital consists of hybrid instruments, basically CoCos and preferred securities
Basel IIISet of proposals for reforming banking regulation, published starting December 16, 2010 and to be implemented in a phased approach
BCBS (Basel Committee on Banking Supervision) An international forum for cooperation in banking supervision, whose mission is to enhance the quality of banking supervision at global level
BIS (Bank for International Settlements) An independent international organisation that promotes international financial and monetary cooperation and acts as a bank for central banks.
CCF (Credit Conversion Factor)The ratio between the actual amount available for a commitment that could be used, and therefore, would be outstanding at the time of default, and the actual amount available for the commitment.
CDS (Credit Default Swap)A financial derivative between a beneficiary and guarantor by which the beneficiary pays the guarantor a premium in exchange for receiving protection in the case of credit events for a determined period of time.
EC (Economic Capital)The amount of capital considered necessary to cover unexpected losses if actual losses are greater than expected losses.
CET 1 (Common Equity Tier 1) The entity's highest-quality capital (refer to section 2.1)
CRM (Credit Risk Mitigation) A technique used to reduce the credit risk associated with one or more of the entity's current exposures
CRR / CRD IVSolvency Regulation on prudential requirements of credit institutions and investment firms (Regulation EU 575/2013)
CVA (Credit Valuation Adjustment) Value adjustments for counterparty credit risk
D-SIB (Domestic Systemically Important Bank) Other systemically important institutions (O-SIIs)
DLGD (Downturn Loss Given Default) Loss given default at a period of stress in the economic cycle
EAD (Exposure at Default) Maximum loss at the counterparty's time of default
EBA (European Banking Authority) Independent institution responsible for promoting the stability of the financial system, the transparency of markets and financial products, and protecting depositors and investors.
ECAI (External Credit Assessment Institution) The external credit assessment institution designated by the entity.
OE (Original Exposure)The gross amount the entity may lose if the counterparty does not comply with its contractual payment obligations, not taking into account the effect of guarantees or improvements in credit or mitigate credit risk mitigation operations.
FSB (Financial Stability Board) An international body that aims to increase the efficiency and stability of the international financial sector, supervising it and making recommendations.
FTD (First to default) Derivative in which the two parties negotiate protection against the first default of any of the entities in the basket.
GRM Global Risk Management
GRMC Global Risk Management Committee
G-SIBs (Global Systemically Important Banks)Financial institutions that due to their large sise, importance in the market and connection to each other, could trigger a serious crisis in the international financial system if they face economic problems.
IAA (Internal Assessment Approach) Method of internal assessment used for the calculation of securitisation exposures in the investment portfolio
ICAAP Internal Capital Adequacy Assessment Process
ILAAP Internal Liquidity Adequacy Assessment Process
IMA (Internal Model Approach) Approach that uses internal models to calculate the exposure originated by market risk
IMM (Internal Model Method) Internal model method used to calculate exposure originated by counterparty risk
IRB (Internal Rating-Based approach)Internal model method used to calculate exposure originated by credit risk. This method may be broken down into two types: FIRB (Foundation IRB) and AIRB (Advanced IRB)
IRC (Incremental Risk Capital)Charge applied to the exposure by market risk calculated using the internal method that quantifies the risk not captured by the VaR model, specifically in migration and default events
LCR Liquidity coverage ratio

Glossary BBVA. PILAR III 2017 P. 5
Acronym Description
LDA (Loss Distribution Approach)Aggregate Loss Distribution Model: This methodology estimates the distribution of losses by operational event by convoluting the frequency distribution and the loss given default distribution of these events
LDP Low Default Portfolios
LGD (Loss Given Default) Loss in the event of default
LGD BE (Loss Given Default Best Estimate) Loss in the "current" default portfolio
LR (Leverage Ratio)Measurement that indicates the level of debt related to the assets of an entity. It is calculated as Tier1 divided by total exposure.
LRLGD Long-Run Loss Given Default
LtSCD (Loan to Stable Customer Deposits) A ratio that measures the relation between net lending and stable customer deposits
MREL (Minimum Required Eligible Liabilities) Minimum requirement for own funds and eligible liabilities.
ORX (Operational Risk Exchange) Database of external operational losses
PD (Probability of Default) Probability that a counterparty will default during a one-year period
PD-TTC (PD Through the Cycle) Probability of default over the course of the economic cycle
EL (Expected Loss)Ratio between the amount that is expected to be lost in an exposure, due to potential default by a counterparty or dilution over a one-year period, and the amount outstanding at the time of default
PIT (Point-In-Time)Approach for calculating provisions by which the PD and LGD parameters must be adapted at each moment in time
QCCP (Qualifying central counterparty) A central counterparty that has either been authorised under Article 14 of Regulation (EU)
No. 648/2012, or recognised under Article 25 of this Regulation.
Riesgo originado por la posibilidad de que una de las partes del contrato del instrumento financiero incumpla sus obligaciones contractuales por motivos de insolvencia o incapacidad de pago y produzca a la otra parte una pérdida financiera
Credit riskThis is a risk arising from the possibility that one party to a financial instrument contract will fail to meet its contractual obligations for reasons of insolvency or inability to pay, and cause a financial loss for the other party
Counterparty Credit RiskThe credit risk corresponding to derivative instruments, repurchase and resale transactions, securities or commodities lending or borrowing transactions and deferred settlement transactions.
Market riskThis is a risk due to the possibility that there may be losses in the value of positions held due to movements in the market variables that affect the valuation of financial products and assets in trading activity.
Liquidity RiskThe risk of an entity finding it difficult to meet its payment commitments fully and in due time; or when to meet them it has to resort to finance under burdensome terms which may harm the bank's image or reputation
Structural Risk
This risk is subdivided into structural interest-rate risk (movements in interest rates that cause alterations in an entity's net interest income and book value); and structural exchange-rate risk (exposure to variations in exchange rates originating in BBVA Group's foreign companies and in the provision of funds to foreign branches financed in a different currency to that of the investment).
Operational risk (OR)The risk of losses caused by human errors, inadequate or faulty internal processes, system failures or external events, including external fraud, natural disasters, and faulty service provided by third parties. BBVA includes legal risk in this definition, but excludes strategic and/or business risk and reputational risk.
RW (Risk Weight) Level of risk applied to exposures (%)
SFTs Securities financing transactions
SREP Supervisory Review and Evaluation Process
TIER I (First-Level Capital)Capital made up of instruments that can absorb losses when the entity is in operation. It is composed of CET1 and AT1
TIER II (Second-level Capital)Additional capital formed by instruments, basically subordinated debt, revaluation reserves and hybrid instruments, which will absorb losses when the entity is not a going concern.
TLAC (Total Loss Absorbing Capacity)
Total loss absorption capacity: A regulatory framework approved by the FSB with the aim of guaranteeing that G-SIBs hold a minimum level of instruments and liabilities to ensure that the essential functions of the entity may be may maintained in the resolution procedures and immediately afterward, without endangering taxpayers' funds or financial stability.
LMUs (Liquidity Management Units)These are financially self-sufficient entities in BBVA Group created with the aim of preventing and limiting liquidity risk, and avoiding possible contagion from a crisis affecting only one or more of these entities.
VaR (Value at Risk)The measurement model that forecasts the maximum loss that can be incurred by the entity's trading portfolios stemming from market price fluctuations in a specific time horizon and at a specific level of confidence.

BBVA. PILAR III 2017 P. 6CorrespondenCe between the seCtIons of pIllar III and the Group’s ConsolIdated annual report
Correspondence between the sections of Pillar III and the Group’s Consolidated Annual Report
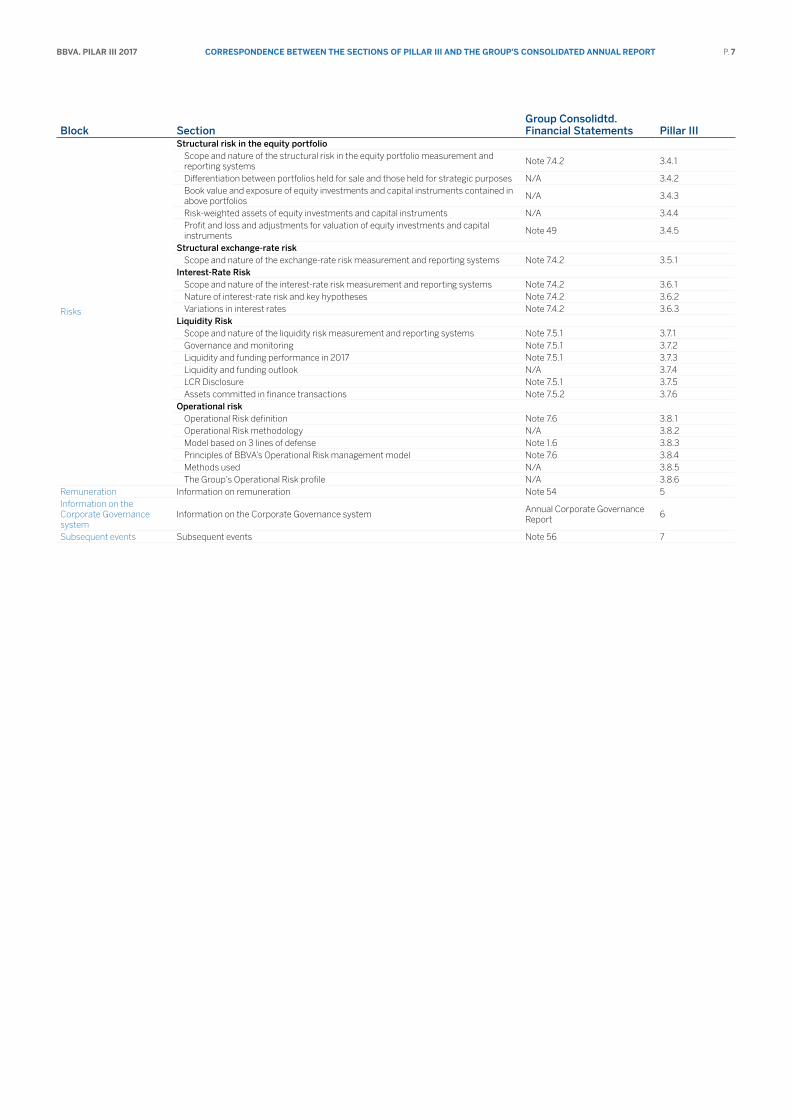
The information included in this Report may be supplemented with the financial information contained in the Group’s Consolidated Annual Financial Statements. For this purpose, the following table presents the correspondence between the sections of the Pillar III Report and the Group’s Consolidated Annual Financial Statements.
Block SectionGroup Consolidtd. Financial Statements Pillar III
Introduction Regulatory environment Note 32 Introduction
General information requirements
Corporate name and differences between the consolidated group for the purposes of the solvency regulations and accounting criteria
Corporate name and scope of application Note 1.1 1.1.1Differences in the consolidated group for the purposes of the solvency regulations and accounting criteria
N/A 1.1.2
Reconciliation of the Public Balance Sheet from the accounting perimeter to the regulatory perimeter
Note 32 1.1.3
Main changes to the Group’s scope of consolidation in 2017 Note 3 1.1.4Identification of dependent institutions with capital resources below the minimum requirement. Possible impediments to capital transfer
N/A 1.2
Exemptions from capital requirements at the individual or sub-consolidated level N/A 1.3
Capital resources
Characteristics of the eligible capital resources N/A 2.1Amount of capital Note 32 2.2Bank risk profile Note 7 2.3Breakdown of minimum capital requirements by risk type Note 32 2.4Procedure employed in the internal capital adequacy assessment process N/A 2.5
Risks
General risk control and management model Governance and organisation Note 7.1.1 3.1.1Risk Appetite Framework Note 7.1.2 3.1.2Decisions and processes Note 7.1.3 3.1.3Assessment, monitoring and reporting Note 7.1.4 3.1.4Infrastructure Note 7.1.5 3.1.5Risk culture Note 7.1.6 3.1.6
Credit and counterparty risk Scope and nature of the credit risk measurement and reporting systems Note 7.3 3.2.1Definitions and accounting methodologies Notes 2.2.1, 2.3 and Glossary 3.2.2Information on credit risks N/A 3.2.3Information on the standardised approach N/A 3.2.4Information on the IRB approach N/A 3.2.5Information on counterparty risk N/A 3.2.6Information on securitisations Note 2.1 3.2.7Information on credit risk mitigation techniques Note 7.3.2 3.2.8RWA density by geographical area N/A 3.2.9
Market risk Scope and nature of the market risk measurement and reporting systems Note 7.4 3.3.1Differences in the trading book for the purposes of applying the solvency regulations and accounting criteria
N/A 3.3.2
Standardised approach N/A 3.3.3Internal Models Note 7.4.1 3.3.4
BBVA. PILAR III 2017 P. 7
Block SectionGroup Consolidtd. Financial Statements Pillar III
Risks
Structural risk in the equity portfolio Scope and nature of the structural risk in the equity portfolio measurement and reporting systems
Note 7.4.2 3.4.1
Differentiation between portfolios held for sale and those held for strategic purposes N/A 3.4.2Book value and exposure of equity investments and capital instruments contained in above portfolios
N/A 3.4.3
Risk-weighted assets of equity investments and capital instruments N/A 3.4.4Profit and loss and adjustments for valuation of equity investments and capital instruments
Note 49 3.4.5
Structural exchange-rate risk Scope and nature of the exchange-rate risk measurement and reporting systems Note 7.4.2 3.5.1
Interest-Rate Risk Scope and nature of the interest-rate risk measurement and reporting systems Note 7.4.2 3.6.1Nature of interest-rate risk and key hypotheses Note 7.4.2 3.6.2Variations in interest rates Note 7.4.2 3.6.3
Liquidity Risk Scope and nature of the liquidity risk measurement and reporting systems Note 7.5.1 3.7.1Governance and monitoring Note 7.5.1 3.7.2Liquidity and funding performance in 2017 Note 7.5.1 3.7.3Liquidity and funding outlook N/A 3.7.4LCR Disclosure Note 7.5.1 3.7.5Assets committed in finance transactions Note 7.5.2 3.7.6
Operational risk Operational Risk definition Note 7.6 3.8.1Operational Risk methodology N/A 3.8.2Model based on 3 lines of defense Note 1.6 3.8.3Principles of BBVA’s Operational Risk management model Note 7.6 3.8.4Methods used N/A 3.8.5The Group’s Operational Risk profile N/A 3.8.6
Remuneration Information on remuneration Note 54 5Information on the Corporate Governance system
Information on the Corporate Governance systemAnnual Corporate Governance Report
6
Subsequent events Subsequent events Note 56 7
CorrespondenCe between the seCtIons of pIllar III and the Group’s ConsolIdated annual report

Index of tables BBVA. PILAR III 2017 P. 8
Index of tables Table 1. Geographical breakdown of relevant credit exposures for the calculation
of the countercyclical capital buffer 19
Table 2. Reconciliation of the Public Balance Sheet from the accounting perimeter to the regulatory perimeter 23
Table 3. EU LI1 - Differences between the accounting and regulatory scopes of consolidation and the mapping of the financial statements categories with regulatory risk categories 24
Table 4. EU LI2 - Main sources of the differences between regulatory original exposure amounts and carrying values in financial statements 25
Table 5. Credit and Counterparty Credit Risk headings of the Public Balance Sheet for EO, EAD and RWAs 25
Table 6. Amount of capital 31
Table 7. Reconciliation of the Public Balance Sheet from the accounting perimeter to the regulatory perimeter 33
Table 8. EU OV1 Overview of RWAs 35
Table 9. Capital requirements by risk type and exposure class 36
Table 10. Credit Risk exposure 51
Table 11. EU CRB-B – Total and average net amount of exposures (includes counterparty credit risk) 53
Table 12. EU CRB-C – Geographical breakdown of exposures (includes counterparty credit risk) 54
Table 13. EU CR1-C – Credit quality of exposures by geography (includes counterparty credit risk) 55
Table 14. EU CR1-A – Credit quality of exposures by exposure class and instrument (excludes counterparty credit risk) 56
Table 15. EU CRB-D – Concentration of exposures by industry or counterparty types (excludes counterparty credit risk) 57
Table 16. EU CR1-B – Credit quality of exposures by industry or counterparty types (excludes counterparty credit risk) 58
Table 17. EU CRB-E – Maturity of exposures (excludes counterparty credit risk) 59
Table 18. EU CR1-D – Ageing of past-due exposures 59
Table 19. Value adjustments for impairment losses and allowances for contingent risks and commitments 60
Table 20. EU CR2-A – Changes in the stock of general and specific credit risk adjustments 60
Table 21. EU CR2-B – Changes in the stock of defaulted and impaired loans and debt securities 60
Table 22. EU CR1-E – Non-performing and forborne exposures 61
Table 23. EU CR4 – Standardised approach – Credit risk exposure and CRM effects 62

Index of tables BBVA. PILAR III 2017 P. 9
Table 24. Standardised approach: Exposure values before the application of credit risk mitigation techniques 63
Table 25. EU CR5 – Standardised approach 64
Table 26. RWA flow statements of credit risk exposures under the standardised approach 65
Table 27. Balance of loan-loss provisions, by exposure category (Standardised approach) 65
Table 28. Models authorized by the supervisor for the purpose of their use in the calculation of capital requirements 66
Table 29. Master Scale of BBVA’s rating 67
Table 30. EU CR6 – IRB approach – Credit risk exposures by exposure class and PD range 72
Table 31. EU CR9 – IRB approach – Backtesting of PD per exposure class 76
Table 32. EU CR8 – RWA flow statements of credit risk exposures under the IRB approach 80
Table 33. Balance of loan-loss provisions, by exposure category 83
Table 34. EU CR10 (1) – IRB: specialised lending 83
Table 35. EU CR10 (2) – IRB: Equity 84
Table 36. Counterparty risk. EAD derivatives by product and risk 85
Table 37. Assets and liabilities subject to contractual netting rights 87
Table 38. Positions subject to counterparty credit risk in terms of EO, EAD and RWAs 88
Table 39. Amounts of counterparty risk in the trading book 89
Table 40. EU CCR5-A – Impact of netting and collateral held on exposure values 90
Table 41. EU CCR1 – Analysis of CCR exposure by approach 90
Table 42. EU CCR3 – Standardised approach – CCR exposures by regulatory portfolio and risk 91
Table 43. EU CCR4 – IRB approach – CCR exposures by portfolio and PD scale 92
Table 44. EU CCR5-B – Composition of collateral for exposures to CCR 94
Table 45. EU CCR6 – Credit derivatives exposures 94
Table 46. EU CCR2 – CVA capital charge 95
Table 47. Variations in terms of RWAs of CVA 96
Table 48. EU CCR8 – Exposures to CCPs 96
Table 49. SEC1: Securitisation exposures in the banking book 100
Table 50. SEC4: Securitisation exposures in the banking book and associated capital requirements (Bank acting as investor) 101
Table 51. Variation in terms of RWAs of investment and retained Securitisations 102
Table 52. SEC3: Securitisation exposures in the banking book and associated regulatory capital requirements (Bank acting as originator or as sponsor) 103
Table 53. Breakdown of securitized balances by type of asset 104
Table 54. Outstanding balance corresponding to the underlying assets of the Group’s originated Securitisations, in which risk transfer criteria are not fulfilled 104

Index of tables BBVA. PILAR III 2017 P. 10
Table 55. Exposure covered with financial guarantees and other collateral calculated using the standardised and advanced approaches 106
Table 56. Exposure covered by personal guarantees. Standardised and advanced approach 107
Table 57. EU CR3 – CRM techniques – Overview (1) 107
Table 58. Breakdown of RWA density by geographical area and approach 108
Table 59. EU MR1 – Market risk under the standardised approach 111
Table 60. EU MR3 – IMA values for trading portfolios 115
Table 61. Trading Book. VaR without smoothing by risk factors 115
Table 62. EU MR2-A – Market risk under the IMA 116
Table 63. EU MR2-B – RWA flow statements of market risk exposures under the IMA 116
Table 64. Trading Book. Impact on earnings in Lehman scenario 117
Table 65. Trading Book. Stress resampling 118
Table 66. Breakdown of book value, EAD and RWAs of equity investments and capital instruments 122
Table 67. Exposure in equity investments and capital instruments 122
Table 68. Breakdown of RWAs, equity investments and capital instruments by applicable approach 122
Table 69. Variation in RWAs for Equity Risk 123
Table 70. Realized profit and loss from sales and settlements of equity investments and capital instruments 123
Table 71. Valuation adjustments for latent revaluation of equity investments and capital instruments 123
Table 72. Variations in interest rates. Impact on net interest income and economic value 126
Table 73. Loan to Stable Customer Deposits (LtSCD) 129
Table 74. Table 74.LCR main LMU 129
Table 75. Liquidity inflows. Residual maturities by contractual periods 130
Table 76. Liquidity outflows. Residual maturities by contractual periods 130
Table 77. Maturity of wholesale issues of Balance Euro by nature 131
Table 78. Maturity of wholesale issues of Bancomer by nature 131
Table 79. Maturity of wholesale issues of Compass by nature 131
Table 80. Maturity of wholesale issues of Garanti by nature 132
Table 81. Maturity of wholesale issues of South America by nature 132
Table 82. EU LIQ1: LCR disclosure template 133
Table 83. Committed assets over total assets rate. 134
Table 84. Mortgage-covered bonds. 135
Table 85. Public-covered bonds 135

Index of tables BBVA. PILAR III 2017 P. 11
Table 86. Internationalization-covered bonds. 135
Table 87. Encumbered and unencumbered Assets 136
Table 88. Collateral received 136
Table 89. Sources of encumbrance 136
Table 90. Characteristics of the Operational Risk management model 139
Table 91. Regulatory capital for Operational Risk 142
Table 92. LRSum - Summary reconciliation of accounting assets and leverage ratio exposures 146
Table 93. Composition of the Remuneration Committee 148
Table 94. Settlement and payment system for annual variable remuneration 154
Table 95. Total remuneration of the Identified Staff in 2017 159
Table 96. Extraordinary remuneration of the Identified Staff in 2017 160
Table 97. Variable remuneration from pre-2017 periods 160
Table 98. Remunerations of the identified staff in 2017 by activity areas 161
Table 99. Number of people with total remuneration in excess of €1 million in 2017 161

Index of ChartsBBVA. PILAR III 2017 P. 12
Index of chartsChart 1: Fully-loaded CET1 ratio by year 32
Chart 2: Distribution of RWAs by risk type eligible in Pillar I 34
Chart 3: Breakdown of RWAs by exposure class and approach 37
Chart 4: BBVA Group’s Core Metrics 44
Chart 5: Scheme of BBVA Group Risk Appetite Framework 44
Chart 6: Distribution by geographical area of credit risk exposure 55
Chart 7: Advanced measurement approach: EAD by obligor category 79
Chart 8: Advanced measurement approach: Average weighted PD by EAD 79
Chart 9: Advanced measurement approach: Average weighted LGD by EAD 80
Chart 10: Advanced measurement approach: RWAs by obligor category 80
Chart 11: Comparative analysis of expected loss: Retail mortgages 81
Chart 12: Comparative analysis of expected loss: Consumer finance 81
Chart 13: Comparative analysis of expected loss: Credit cards 81
Chart 14: Comparative analysis of expected loss: Automobiles 82
Chart 15: Comparative analysis of expected loss: SMEs and Developers 82
Chart 16: Comparative analysis of expected loss: Mexico Credit Cards 82
Chart 17: Comparative analysis of expected loss: Mexico Corporates 82
Chart 18: EAD for derivatives broken down by risk 85
Chart 19: Functions carried out in the securitisation process and degree of involvement of the Group 98
Chart 20: Trading Book. VaR without smoothing 115
Chart 21: Trading Book. Validation of the Market Risk Measurement model for BBVA S.A. Hypothetical backtesting (EU MR4) 118
Chart 22: Trading Book. Validation of the Market Risk Measurement model for BBVA S.A. Real backtesting (EU MR4) 119
Chart 23: Trading Book. Validation of the Market Risk Measurement model for BBVA Bancomer. Hypothetical backtesting (EU MR4) 119
Chart 24: Trading Book. Validation of the Market Risk Measurement model for BBVA Bancomer. Real backtesting (EU MR4) 120
Chart 25: Operational risk management framework: Three lines of defense 138
Chart 26: BBVA Group’s Operational Risk profile 142
Chart 27: Operational Risk profile by risk and country 143
Chart 28: Leverage ratio evolution 146

exeCutIve summaryBBVA. PILAR III 2017 P. 13
Executive summary
BBVA is a customer-centric global financial services group founded in 1857. BBVA is present in more than 30 countries. It is a solid leader in Spain, and the biggest financial institution in Mexico; it has franchises that are leaders in South America and the Sunbelt region of the United States; and is the largest shareholder in the Turkish bank Garanti.
Its diversified business is focused on high-growth markets, and it views technology as a key sustainable competitive advantage.
business strategy and model
BBVA Group made significant progress during 2017 on its transformation process, firmly underpinned by the Group’s Purpose and six Strategic Priorities. The Bank’s strategy has been strengthened with a particular focus on digitalisation and customer experience under a new tagline, “Creating Opportunities”, as well as the Values established to steer the behavior of the Organisation as a whole. It is a transformation process that is necessary to adapt to the new environment for the financial industry described above, and preserve its leadership.
our vision and aspiration
a) Technological Developments
The new technological developments (big data, artificial intelligence, blockchain, cloud, data processing, biometrics, etc.) represent a great advance in the improvement of customer experience. They allow automatic analysis of data and algorithms and provide easy access to the best available solutions in the market and more beneficial conditions by default. Technological innovations reduce unit costs thanks to process automation and scalability.
b) Change in consumer needs
Customers are seeking a new type of banking relationship and are demanding greater value-added services based on new needs. Technology is enabling these new demands to be met.
The use of mobile devices has led to changes in the distribution model. Consumers are permanently connected, accustomed to digital experiences and use multiple devices and applications. The number of mobile banking users worldwide has grown exponentially in recent years and customers are increasingly interacting through these devices.
c) New players
It has to be recalled that new players are entering the financial industry, specializing in specific parts of the value chain (payments, financing, asset management, insurance, etc.). These players include FinTech companies and large digital corporations (Google, Amazon, etc.), which are now competing with banks in the new environment, with very attractive value propositions that have a great potential.
d) The data
Data form the crucial element for helping people take financial decisions, provided customers consent to their data being used.
In this regard, BBVA believes it is essential to foster a climate of mutual trust with customers, given that data is a crucial element for better understanding them. Making intelligent use of data enables BBVA to provide customers with personalised services that offer higher value-added, which in turn will help build trust and cement the relationship.
e) Regulatory reform
The financial industry is facing an environment that is characterised by huge regulatory reform that has been carried out globally in recent years, which has resulted in regulatory changes in diverse areas ranging from solvency, liquidity, separation of activities, bank resolution, as well as affecting investment banking activities.
In this context, the main objective of BBVA Group’s transformation strategy, i.e. its aspiration, is to strengthen its relationship with customers. Customers should be the main beneficiaries of this new environment in which financial services are becoming more democratic.
To achieve this, BBVA is redefining its value proposition, focused on its customers’ real needs, helping them make financial decisions through a clear, transparent and integrated solutions that generate trust.
exeCutIve summaryBBVA. PILAR III 2017 P. 14
BBVA’s value proposition must also be easy and accessible; in other words, a proposition that offers access to services at any time, from any place and by the means chosen by each individual customer, whether on a do-it-yourself basis via digital channels, or through human interaction.
highlights
BBVA Group’s net attributable profit for 2017 was €3.519 billion. It was affected by the registration of unrealised losses from its stake in Telefónica S.A. as a result of the changes in the latter’s share price.
Once more, there was a notably good performance of the more recurring revenue, and control of operating expenses.
The year-on-year comparison of the data on the Group’s balance sheet and business activity have been affected by the operations underway (the sale of BBVA Chile and of the real-estate business in Spain), which as of December 31, 2017 were reclassified as non-current assets and liabilities held for sale.
Management of liquidity and funding in BBVA aims to finance the recurring growth of the banking business at suitable maturities and costs, using a wide range of instruments that provide access to a large number of alternative sources
of finance, always in compliance with current regulatory requirements.
The level of the BBVA Group’s liquidity coverage ratio (LCR) remained comfortably above 100% throughout 2017, without including liquidity transfers between subsidiaries; in other words, no kind of excess liquidity in the subsidiaries abroad is considered in the calculation of the consolidated ratio. As of December 31, 2017, the LCR stood at 128%. Although this requirement is only established at Group level, the minimum level is easily exceeded in all the subsidiaries.
BBVA Group’s risk quality metrics have continued to perform positively throughout the year. Since the end of 2016, non-performing loans continued their declining trend, been reduced 13.2% and the Group’s non-performing loan ratio recorded a further improvement strongly influenced by the decline in non-performing loans.
As regards solvency, BBVA Group’s fully-loaded CET1 ratio stood at 11.04% at the end of December 2017, in line with the target of 11%. This ratio has increased by 14 basis points since the end of 2016, leveraged on organic earning generation and reduction of risk weighted asset capital consumption.
The following sections present details related to the Group’s solvency. The Management Report, which is attached to the BBVA Group Consolidated Financial Statements, presents the main indicators of the Group’s activity and profitability.

IntroduCtIonBBVA. PILAR III 2017 P. 15
Introduction
regulatory environment in 2017
Legal Context
As a Spanish credit institution, BBVA is subject to Directive 2013/36/EU of the European Parliament and of the Council dated June 26, 2013, on access to the activity of credit institutions and investment firms (“Directive CRD IV”) amending Directive 2002/87/EC and repealing Directives 2006/48/EC and 2006/49/EC by means of which the EU began, as of January 1 2014, to implement the capital reforms agreed within the framework of Basel III, thus establishing a period of gradual implementation for certain requirements until January 1 2019. The major regulation governing the solvency of credit institutions is Regulation (EU) No 575/2013 of the European Parliament and of the Council dated June 26, 2013, on prudential requirements for credit institutions and investment firms, amending Regulation (EU) No 648/2012 (“CRR” and, jointly with Directive CRD IV and any other CRD IV implementation measure, “CRD IV”), which is complemented by several binding Regulatory Technical Standards that apply directly to EU member states, there being no need to implement national measures. Directive CRD IV was transposed to Spanish national law by means of Royal Decree-Law 14/2013 dated November 29 (“RD-L 14/2013”), Law 10/2014, Royal Decree 84/2015 dated February 13 (“RD 84/2015”), Bank of Spain Circular 2/2014 dated January 31 and Circular 2/2016 dated February 2 (“Bank of Spain Circular 2/2016”).
In order to strike a balance between risk sensitivity, simplicity and comparability, the Basel Committee has reformed the Basel III framework. The main amendments are focused on internal models, the standard credit risk method, the market risk framework, operational risk and capital floors in the advanced measurement approach based on the standardised approach. The reform has been approved by the Basel Committee meeting on December 8, 2017, with an implementation date of January 1, 2022. In the case of capital
floors, its introduction is gradual over a period of 5 years, from a floor of 50% on January 1, 2022 to 72.5% on January 1, 2027. The Committee has also introduced an additional leverage ratio for global systemically important banks (G-SIBs).
In Europe, on November 23, 2016 the European Commission published a new reform package amending both the prudential banking regime (CRR IV) and the resolution regime (Bank Recovery and Resolution Directive, BRRD). This revision includes the implementation of international standards into European legislation (regulation later than 2010 adopted by the Basel Committee and the total loss absorbing capacity (TLAC), the final design of the Minimum Requirement for own funds and Eligible Liabilities (MREL) along with a package of technical improvements. At the same time, a proposal has also been put forward to harmonise the hierarchy of senior debt creditors within the European Union. Publication of this proposal is only the first step in the European legislative process. As of today discussions continue within the European Council and Parliament with the aim of reaching an agreement on the texts that will be the subject of negotiation between the European Commission, the European Council and the European Parliament. However, on December 27, 2017 the Official Journal of the European Union (OJEU) published the agreement reached by the fast-track procedure relating to the following three aspects of the reform:
1) A transitional period of 5 years (2018-2022) during which the banks will be allowed to mitigate partially the negative impact of the increased provisions under the new IFRS 9 accounting standard on their CET1 capital.
2) An additional period of three years (2018-2020) during which exposure with respect to central governments or central banks of the Member States denominated and financed in a currency of another Member State remains exempt from calculation at the limit on large risks.
3) Creation of a new category of subordinated senior debt in the hierarchy of bank creditors that will be eligible for the purposes of TLAC.

IntroduCtIonBBVA. PILAR III 2017 P. 16
With respect to securitisations, the European Commission published a proposal in 2015 designed to facilitate the development of a securitisation market in Europe. The package consisted of 2 draft Regulations:
1) Securitisation Regulation: Combines the rules applicable to all the securitisations including high-quality securitisation (simple, transparent and standardised (STS) securitisation), which is now dispersed across several legal provisions. This rationalises and simplifies the existing rules and establishes a general system for defining STS securitisation.
2) Text modifying the CRR with respect to the capital requirements for securitisation positions. Gives a more risk-sensitive treatment to STS securitisations.
These two regulations were published in the OJEU on December 28, 2017, and are applicable starting January 1, 2019.
At the same time, the Basel Pillar III framework is being revised by the Basel Committee on Banking Supervision (BCBS), which has divided the process into three phases.
The disclosure requirements derived from the first phase of the review were published in January 2015, replacing the disclosure requirements published in 2014 (modified in July 2009).
Subsequently in a second phase, the BCBS reviewed the disclosure requirements included in all the Basel rules currently in force and consolidated in the Pillar III framework in the document “Pillar 3 Disclosure Requirements - Consolidated and Enhanced Framework,” which was published in March 2017. This consolidated and enhanced framework includes the following elements:
Consolidation of all the BCBS disclosure requirements current in Pillar 3.
Two improvements in the Pillar 3 framework: a dashboard with the key prudential metrics for a bank and a new disclosure requirement for prudent valuation adjustments.
Reviews and additions to the Pillar 3 rule derived from the reform underway of the regulatory policy framework: disclosure requirements relating to the system of total loss absorption capacity (TLAC) for G-SIB and revised market risk disclosure requirements.
In February 2018, the BCBS has published a consultation on the third phase of the revision of the Pillar III framework, which includes, among others, new information disclosure requirements derived from the conclusion of the Basel III reforms. This consultation ends on May 28, 2018.
The disclosure requirements for the first phase of the review of Pillar 3 entered into force in December 2016, while the disclosure requirements for the second phase have different implementation dates, with the first phase coinciding with the close of 2017.
In order for all European institutions to implement the Basel review in such a way as to meet CRR Part Eight requirements on this matter, in December 2016 the European Banking Authority (“EBA”) published its final guidelines on regulatory disclosure (“Guidelines on Revised Pillar 3 Disclosures Requirements”). The implementation date for these guidelines is the close of the financial year 2017. However, it was recommended that global systemically important banks (“G-SIB”) should undertake a partial implementation at the close of the financial year 2016.
Annex 5 of this report (see document “Pillar III 2017 Annexes”) gathers the correspondence of the articles of CRR Part Eight on information disclosure with the different headings of the document (or other public documents) where the required information is located.
In an exercise of transparency, as of December 31, 2017, BBVA includes all the standard templates on disclosure of information recommended by the different regulators. They can be seen in the following table:

IntroduCtIonBBVA. PILAR III 2017 P. 17
Disclosure requirements
Template Guidelines on disclosure requirements EBA/GL/2016/11 Pillar III SectionEU-OV1 Overview of RWAs 2.4
EU-LI1Differences between the accounting and regulatory scopes of consolidation and the mapping of financial statement categories with regulatory risk categories
1.1.3
EU-LI2 Main sources of the differences between the regulatory exposure amounts and carrying values in financial statements 1.1.3
EU-LI3 Outline of the differences in the scopes of consolidation (entity by entity) Pillar III Annexes
EU-INS1 Non-deducted participations in insurance undertakings N/A
EU-CR1-A Credit quality of exposures by exposure class and instrument 3.2.3.4
EU-CRB-B Total and average net amount of exposures 3.2.3.2
EU-CRB-C Geographical breakdown of exposures 3.2.3.3
EU-CR1-C Credit quality of exposures by geography 3.2.3.3
EU-CRB-D Concentration of exposures by industry or counterparty types 3.2.3.5
EU-CR1-B Credit quality of exposures by industry or counterparty types 3.2.3.5
EU-CRB-E Maturity of exposures 3.2.3.6
EU-CR1-D Ageing of past-due exposures 3.2.3.6
EU-CR2-A Changes in the stock of general and specific credit risk adjustments 3.2.3.8
EU-CR2-B Changes in the stock of defaulted and impaired loans and debt securities 3.2.3.8
EU-CR1-E Non-performing exposures and forborne exposures 3.2.3.9
EU-CR4 Standardised approach: Credit risk exposure and Credit Risk Mitigation effects 3.2.4.3
EU-CR5 Standardised approach 3.2.4.3
EU-CR6 IRB Approach: Credit risk exposures by exposure class and PD range 3.2.5.2
EU-CR9 IRB Approach: Backtesting of PD per exposure class 3.2.5.2
EU-CR8 RWA flow statements of credit risk exposures under the IRB approach 3.2.5.2
EU-CR10 (1) IRB: Specialised lending 3.2.5.4
EU-CR10 (2) IRB: Equity 3.2.5.5
EU-CCR5-A Impact of netting and collateral held on exposure values 3.2.6.2
EU-CCR1 Analysis of counterparty credit risk exposure by approach 3.2.6.2
EU-CCR3 Standardised approach: counterparty credit risk exposures by regulatory portfolio and risk 3.2.6.2.1
EU-CCR4 IRB Approach: counterparty credit risk exposure by portfolio and PD scale 3.2.6.2.2
EU-CCR5-B Composition of collateral for exposures to counterparty credit risk 3.2.6.2.3
EU-CCR6 Credit derivatives exposures 3.2.6.2.4
EU-CCR2 Credit valuation adjustment (CVA) capital charge 3.2.6.3
EU-CCR8 Exposures to central counterparty clearing houses 3.2.6.4
EU-CR3 Credit risk mitigation techniques overview 3.2.8.3
EU-MR1 Market risk under the standardised approach 3.3.3
EU-MR3 IMA values for trading portfolios 3.3.4.2.2
EU-MR2-A Market risk under the internal model approach (IMA) 3.3.4.2.2
EU-MR2-B RWA flow statements of market risk exposures under the IMA approach 3.3.4.2.2
EU-MR4 Trading Book. Validation of the Market Risk Measurement Model 3.3.4.2.4
Template Guidelines on disclosure of liquidity information (EBA/GL/2017/01) Pillar III SectionEU-LIQ1 Guidelines on disclosure of Liquidity information 3.7.5
Template Leverage ratio - Commission Implementing Regulation (EU) 2016/200 Pillar III SectionLRSum Summary of the reconciliation of accounting assets and exposure corresponding to the Leverage Ratio 4.1
LRCom Common Leverage Ratio disclosure table Pillar III Annexes
LRSpl Breakdown of balance-sheet exposures Pillar III Annexes
Template Own Fund requirements - Commission Implementing Regulation (EU) 1423/2013 Pillar III SectionTemplate for presenting the main characteristics of capital instruments Pillar III Annexes
Template with information on temporary Own Funds Pillar III Annexes
Template Anticyclical capital buffer Commission Delegated Regulation (EU) 2015/1555 Pillar III SectionDistribution by geographic areas of the credit exposure for calculation of the countercyclical capital buffer. Introduction
Amount of the countercyclical capital buffer specific to each entity Introduction
Template Pillar III disclosure requirements - Basel Supervision Committee Pillar III SectionSEC1 Securitisation exposure in the investment portfolio 3.2.7.4
SEC4 Exposure to securitisation in the banking portfolio and associated regulatory capital requirements (bank that acts as investor) 3.2.7.5
SEC3Exposure to securitisation in the banking portfolio and associated regulatory capital requirements (bank that acts as originator or sponsor)
3.2.7.6.2
IntroduCtIonBBVA. PILAR III 2017 P. 18
Composition of Capital
The regulations require institutions to have a higher and better quality capital level, increase capital deductions and review the requirements associated with certain assets. Unlike the previous framework, the minimum capital requirements are complemented with requirements for capital buffers and others relating to liquidity and leverage. Bank capital under CRD IV mainly comprises of the elements described in section 3.1 herein.
The most relevant aspects affecting the elements making up common equity and risk-weighted assets are detailed in greater depth in section 2.4 of this document.
In this regard, article 92 of the CRR establishes that credit institutions must maintain at all times, at both individual and consolidated level, a total capital ratio of 8% of their risk-weighted assets (commonly referred to as the Pillar 1 requirement). At least 6% of the total capital ratio must comprise Tier 1 capital, of which 4.5% must in any case comprise Common Equity Tier 1 capital (CET1), and the remaining 2% may be completed with Tier 2 capital instruments.
Notwithstanding the application of the Pillar 1 requirement, CRD IV allows for competent authorities to require that credit institutions maintain more shareholders’ equity than the Pillar 1 requirements to cover risks other than those already covered by the Pillar 1 requirement (this power of the competent authority is commonly known as Pillar 2).
Furthermore, in accordance with CRD IV, credit institutions must comply with the “combined requirement of capital buffers” as of 2016. The “combined buffer requirement” has incorporated five new capital buffers: (i) the capital conservation buffer; (ii) the buffer for global systemically important banks (the “G-SIB buffer”); (iii) the countercyclical capital buffer specific to each bank; (iv) the buffer for other systemically important financial institutions (the “D-SIB buffer”); and (v) the buffer against systemic risks. The “combined capital buffer requirement” must be met with Common Equity Tier 1 capital (“CET1”) in addition to that which is provided to meet the minimum capital required by “Pillar 1” and Pillar 2”.
Both the capital conservation buffer as well as the EISM buffer (where appropriate) will apply to credit institutions, as it establishes a percentage over 0%.
The buffer for global systemically important banks applies to those institutions on the list of global systemically important banks (“G-SIBs”), which is updated annually by the Financial Stability Board (“FSB”). Given that BBVA was excluded from the list of global systemically important financial institutions in 2016, as of January 1, 2017, the G-SIB buffer did not apply
to BBVA in 2017 (notwithstanding the possibility that the FSB or the supervisor may in the future include BBVA on that list). BBVA was also not on the 2017 list, as of January 1, 2018, so this buffer was not applicable to BBVA in 2018 either.
For more details on the quantitative indicators for assessing the global systemically important banks, see the document “G-SIBs Information” in the section Shareholders and Investors / Financial Information on the BBVA Group website (published in April): https://shareholdersandinvestors.bbva.com/financials/.
The Bank of Spain has extensive discretionary powers as regards the countercyclical capital buffer peculiar to each bank, the buffer for other systemically important financial institutions (which are those institutions considered to be systemically important local financial institutions “D-SIB”) and the buffer against systemic risks (to prevent or avoid systemic or macroprudential risks). The European Central Bank (ECB) has the powers to issue recommendations in this respect following the entry into force on November 4 2014 of the Single Supervisory Mechanism (SSM).
In December 2015, the Bank of Spain agreed to set the countercyclical capital buffer that applies to credit exposures in Spain at 0% as of January 1 2016. These percentages will be reviewed every quarter, as the Bank of Spain decided in 2017 to keep the countercyclical capital buffer at 0% for the first quarter of 2018.
As far as BBVA is concerned, after the supervisory review and evaluation process (“SREP”) conducted in 2017, the ECB has required that BBVA, as of January 1 2018 maintain (i) a CET1 phased-in ratio of 8.438% at consolidated level and 7.875% at individual level; and (ii) a phased-in total capital adequacy ratio of 11.938% at consolidated level and 11.375% at individual level.
The ECB’s decision establishes that the total capital adequacy ratio of 11.938% at consolidated level consists of: (i) the minimum CET1 ratio required by Pillar 1 (4.5%); (ii) the minimum additional Tier 1 capital ratio (“AT1”) level required by Pillar 1 (1.5%); (iii) the minimum Tier 2 ratio required by Pillar 1 (2%); (iv) the CET 1 ratio required by Pillar 2 (1.5%); (v) the capital conservation buffer (which is 1.875% in phased-in CET 1 terms); and (vi) the O-SII buffer (which is 0.563% in phased-in CET 1 terms).
As of December 31, 2017, BBVA had a fully-loaded consolidated CET1 ratio of 11.04%, strengthening the Group’s capital position, since 2016, with a phased-in ratio of 11.67%.
The following chart presents the distribution by geographic areas of the credit exposure for calculation of the countercyclical capital buffer:

IntroduCtIonBBVA. PILAR III 2017 P. 19
Table 1. Geographical breakdown of relevant credit exposures for the calculation of the countercyclical capital buffer (Million Euros. 12-31-17)
General credit exposures (1) Trading book exposure Securitisation exposure Own funds requirementsOwn funds
requirements weights
Countercyclical capital buffer
rateExposure
value for SA
Exposure value for
IRBSum of long and short
position of trading book
Trading book exposure value for
internal modelsExposure
value for SA
Exposure value for
IRB
of which: General credit
exposures
Of which: Trading book
exposures
Of which: Securitisation
exposures TotalGeographical breakdown Sweden 116 100 - (16) - - 12 - - 12 0.05% 2.00%Norway 3 17 - 4 - - 1 - - 1 0.00% 1.50%Hong Kong 1 659 - - - - 16 - - 16 0.07% 1.25%
Total countries with countercyclical capital buffer stablished
120 776 - (11) - - 28 - - 28 0.13%
Spain 27,472 150,317 10 72 0 3,147 5,969 0 66 6,035 28.23% -USA 55,127 7,011 6,790 (1) 4,250 - 4,027 0 71 4,098 19.17% -Turkey 51,679 670 13,432 1 - - 3,275 3 - 3,278 15.33% -Mexico 33,544 23,552 82 241 63 - 2,745 63 3 2,811 13.15% -Chile 15,729 440 30,776 0 - - 901 3 - 903 4.23% -Peru 14,908 754 3,380 - - - 898 2 - 900 4.21% -Colombia 12,520 489 13,767 - - - 756 10 - 766 3.58% -Argentina 6,378 253 1,558 1 - - 432 22 - 453 2.12% -Portugal 4,840 1,248 30 (7) - - 279 2 - 281 1.31% -France 752 4,317 - (42) - - 235 - - 235 1.10% -
Total countries without countercyclical capital buffer but with own funds requirements greater than 1%
222,950 189,050 69,823 265 4,314 3,147 19,516 104 140 19,761 92.43%
Other areas 11,104 22,856 219 (111) - 1 1,589 1 0 1,590 7.44% -
Total countries without countercyclical capital buffer but with own funds requirements less than 1%
11,104 22,856 219 (111) - 1 1,589 1 0 1,590 7.44%
Total 234,174 212,682 70,042 143 4,314 3,148 21,133 105 140 21,378 100%(1) Credit exposures exclude exposures to Central Governments or Central Banks, Regional Governments or Local Authorities, Public sector entities, Multilateral Development Banks, International Organizations and Institutions in accordance with art. 140.4 of Directive 2013/36/
EU
AmountTotal risk exposure amount 362,875Institution specific countercyclical buffer rate (2) 0.001%Institution specific countercyclical buffer requirement 4 (2) Countercyclical capital buffer calculated as of December 2017 in accordance with Commission Delegated Regulation (EU)
2015/1555

IntroduCtIonBBVA. PILAR III 2017 P. 20
Leverage Ratio
In order to provide the financial system with a metric that serves as a backstop to capital levels, irrespective of the credit risk, a measure complementing all the other capital indicators has been incorporated into Basel III and transposed to the solvency regulations. This measure, the leverage ratio, can be used to estimate the percentage of the assets financed with Tier 1 capital.
Although the carrying amount of the assets used in this ratio is adjusted to reflect the bank’s current or potential leverage with a given balance-sheet position, the leverage ratio is intended to be an objective measure that may be reconciled with the financial statements.
As of December 31, 2017, BBVA Group had a Leverage Ratio of 6.53% (fully loaded), and a phased-in ratio of 6.62%, above the target set at 3%, and continuing to compare very favorably with the rest of its peer group.

1. General InformatIon requIrementsBBVA. PILAR III 2017 P. 21
1. General information requirements
1.1. Corporate name and differences between the consolidable group for the purposes of the solvency regulations and accounting criteria 22
1.1.1. Corporate name and scope of application 22
1.1.2. Differences in the consolidable group for the purposes of the solvency regulations and accounting criteria 22
1.1.3. Reconciliation of the Public Balance Sheet from the accounting perimeter to the regulatory perimeter 23
1.1.4. Main changes to the Group’s scope of consolidation in 2017 26
1.2. Identification of dependent institutions with capital resources below the minimum requirement. Possible impediments to capital transfer 27
1.3. Exemptions from capital requirements at the individual or sub-consolidated level 27

1. General information requirementsBBVA. PILAR III 2017 P. 22
1.1. Corporate name and differences between the consolidable group for the purposes of the solvency regulations and accounting criteria
1.1.1. Corporate name and scope of application
Banco Bilbao Vizcaya Argentaria, S.A. (hereinafter “the Bank” or “BBVA”) is a private-law entity subject to the laws and regulations governing banking entities operating in Spain. It carries out its activity through branches and agencies across the country and abroad.
The Bylaws and other public information are available for consultation at its registered address (Plaza San Nicolás, 4 Bilbao) and on its corporate website (www.bbva.com).
The Solvency Regulations are applicable at the consolidated level for the whole Group.
1.1.2. Differences in the consolidable group for the purposes of the solvency regulations and accounting criteria
BBVA Group’s Consolidated Annual Report are presented in accordance with the International Financial Reporting Standards as adopted by the European Union (“EU-IFRS”) in effect as of December 31 2017, taking into consideration Bank of Spain Circular 4/2004, dated December 22, and its successive amendments, and other provisions of the regulatory financial reporting framework applicable to the Group in Spain.
On the basis of accounting criteria, companies are considered to form part of a consolidated group when the controlling institution holds or can hold, directly or indirectly, control of them. An institution is understood to control another entity when it is exposed, or is entitled to, variable returns as a result of its involvement in the subsidiary and has the capacity to influence those returns through the power it exercises on the subsidiary. For such control to exist, the following aspects must be fulfilled:
a) Power: An investor has power over a subsidiary when it has current rights that provide it with the capacity to direct its relevant activities, i.e. those that significantly affect the returns of the subsidiary.
b) Returns: An investor is exposed, or is entitled to variable returns, as a result of its involvement in the subsidiary when the returns obtained by the investor for such involvement may vary based on the economic performance of the subsidiary. Investor returns may be positive only, negative only or both positive and negativ.
c) Relationship between power and returns: An investor has control over a subsidiary when it not only has power over the subsidiary and is exposed, or is entitled to, variable returns for its involvement in the subsidiary, but also has the capacity to use its power to influence the returns it obtains due to its involvement in the subsidiary.
Therefore, in drawing up the Group’s Consolidated Annual Report, all dependent companies and consolidated structured entities have been consolidated by applying the full consolidation method.
Jointly-controlled entities, as well as joint ventures (those over which joint control arrangements are in place), are valued using the equity method.
The list of all the companies forming part of BBVA Group is included in the appendices to the Group’s Consolidated Annual Report.
For the purposes of the solvency regulations, the consolidated group comprises the following subsidiaries:
Credit institutions.
Investment services companies.
Investment companies with variable capital.
Companies managing mutual funds, together with companies managing pension funds, whose sole purpose is the administration and management of the aforementioned funds.

1. General InformatIon requIrementsBBVA. PILAR III 2017 P. 23
Companies managing mortgage securitisation funds and asset securitisation funds.
Venture capital companies and venture capital fund managers.
Entities whose main activity is holding shares.
Likewise, the special-purpose entities whose main activity implies a prolongation of the business of any of the institutions included in the consolidation, or includes the rendering of back-office services to these, will also form part of the consolidated group.
However, insurance entities and some service firms do not form part of consolidated groups of credit institutions.
Therefore, for the purposes of calculating solvency requirements, and hence the drawing up of this Prudential Relevance Report, the scope of consolidated entities is different from the scope defined for the purposes of drawing up the Group’s Consolidated Financial Statements.
The effect of the difference between the two regulations is basically due to:
The difference between the balance contributed by entities (largely insurance, real-estate and financial companies) that are consolidated in the Group’s Consolidated Annual
Report by the full consolidation method and consolidated for the purposes of solvency by applying the equity method. The details of these companies are available in Annexes of the file Pillar III 2017 Annexes, available in the section for Shareholders and Investors/Financial Information on the Group’s website; the balance is mainly composed of the companies BBVA Seguros, Seguros BBVA Bancomer and Garanti Emeklilik.
The entry of the balance from institutions (mainly financial) that are not consolidated at the accounting level but for purposes of solvency (by the proportional integration method), mainly Altura Markets. The details of these companies is available in the file Pillar III 2017 Annexes, available on the Group’s website.
1.1.3. Reconciliation of the Public Balance Sheet from the accounting perimeter to the regulatory perimeter
As explained in Note 32 of the Group’s Consolidated Annual Report, this section includes an exercise in transparency aimed at offering a clear view of the process of reconciliation between the book balances reported in the Public Balance Sheet (attached to the Group’s Consolidated Annual Report) and the book balances this report uses (regulatory scope), revealing the main differences between both scopes.
Table 2. Reconciliation of the Public Balance Sheet from the accounting perimeter to the regulatory perimeter (Million Euros)
Public Balance Sheet Headings
Public Balance
Sheet
Insurance companies and real-estate finance
companies (1)
Jointly-controlled entities and other
adjustments (2)Regulatory
balance sheetCash and balances with central banks and other demand deposits
42,680 - 24 42,704
Financial assets held for trading 64,695 2,206 - 66,901 Other financial assets designated at fair value through profit or loss
2,709 (2,061) - 648
Available for sale financial assets 69,476 (19,794) - 49,682 Loans and receivables 431,521 (1,805) 764 430,480 Held-to-maturity investments 13,754 - - 13,754 Hedging derivatives 2,485 (90) (1) 2,394 Fair value changes of the hedged items in portfolio hedges of interest rate risk
(25) - - (25)
Investments in entities accounted for using the equity method
1,588 3,294 (80) 4,802
Non-current assets held for sale (3) 23,853 (334) 3 23,522 Other assets 37,323 595 5 37,923 Total Assets 690,059 (17,989) 715 672,785 (1) Balances corresponding to the companies not consolidated for solvency purposes, but for accounting purposes(2) Other adjustments correspond to other intra-group removals and other homogenization adjustments(3) As of December 31, 2017, derived from the binding offer to purchase by the The Bank of Nova Scotia Group of the company BBVA Chile (see section 1.1.4), this share has been
reclassified as a non-current asset held for sale, while under the solvency perimeter BBVA Chile continues consolidating by Global Integration and, therefore, integrating its assets and liabilities in the corresponding headings. However, only for comparative purposes, are shown in this table, under the solvency perimeter, its assets grouped under the heading Non-Current Assets held for Sale

1. General InformatIon requIrementsBBVA. PILAR III 2017 P. 24
The following table also shows the risks to which each one of the items on the regulatory balance sheet is exposed:
Table 3. EU LI1 - Differences between the accounting and regulatory scopes of consolidation and the mapping of the financial statements categories with regulatory risk categories (Million Euros. 12-31-17)
Carrying values as reported in published financial statements
Carrying Values under scope of regulatory
consolidation (1)
Carrying values of items:
Subject to credit risk framework
Subject to counterparty credit
risk framework
Subject to the Securitisation
frameworkSubject to the market
risk framework
Not subject to capital requirements or
subject to deduction from capital
AssetsCash, cash balances at central banks and other demand deposits
42,680 43,458 43,458 - - - -
Financial assets held for trading 64,695 69,201 - 39,709 - 69,201 - Financial assets designated at fair value through profit or loss 2,709 648 648 - - 648 - Available-for-sale assets 69,476 51,072 46,117 - 4,891 65 - Loans and receivables 431,521 443,809 412,075 25,356 2,658 - 3,719 Held-to-maturity investments 13,754 13,754 13,616 - 139 - - Hedging derivatives 2,485 2,416 - 2,416 - 2,416 - Fair value changes of the hedged items in portfolio hedges of interest rate risk
(25) (25) - - - - (25)
Investments in subsidiaries, joint ventures and associates 1,588 4,807 4,623 - - - 183 Insurance or reinsurance assets 421 2,142 - - - - 2,142 Tangible assets 7,191 6,885 6,885 - - - - Intangible assets 8,464 8,394 - - - - 8,394 Tax assets (2) 16,888 16,830 15,633 - - - 1,197 Other assets 4,359 4,286 4,286 - - - - Non-current assets and disposal groups held for sale 23,853 5,108 5,108 - - - - Total assets 690,059 672,785 552,448 67,482 7,688 72,330 15,611
LiabilitiesFinancial liabilities held for trading 46,182 49,106 - - - 39,092 10,014 Financial liabilities designated at fair value through profit or loss 2,222 - - - - - - Financial liabilities at amortized cost 543,713 553,816 - 40,742 - - 513,074 Hedging derivatives 2,880 2,659 - - - 2,659 - Fair value changes of the hedged items in portfolio hedges of interest rate risk
(7) (7) - - - - (7)
Liabilities under insurance contracts 9,223 - - - - - - Provisions 7,477 6,884 559 - - - 6,324 Tax liabilities 3,298 2,711 1,464 - - - 1,247 Equity refundable on demand - - - - - - - Other liabilities 4,550 4,482 - - - - 4,482 Liabilities included in disposal groups classified as held for sale 17,197 - - - - - - Total Liabilities 636,735 619,651 2,024 40,742 - 41,752 535,134 (1) As of December 31, 2017, derived from the binding offer to purchase by the The Bank of Nova Scotia Group of the company BBVA Chile (see section 1.1.4), this share has been reclassified as a non-current asset held for sale. Under the solvency perimeter BBVA Chile continues consolidating by Global Integration and, therefore, integrating its assets and liabilities in the corresponding headings. (2) Deferred tax assets amount to 4,175 Million Euros, which deducted from deferred tax liabilities (1,464 Million Euros), consume 250% RWAs. The consumption of RWAs for this net amounts to 6,778 Million Euros(*) For the purpose of presenting the table, when a single item is associated with the capital requirements according to more than one risk framework, it is showed in all the columns corresponding to the capital requirements to which it is associated. As a result, the sum of the values of the columns by type of risk may be greater than the carrying value according to the scope of regulatory consolidation

1. General InformatIon requIrementsBBVA. PILAR III 2017 P. 25
A table summarizing the main sources of the differences between the amount of exposure in regulatory terms (EAD)
and the book balances according to the Financial Statements is presented below.
Table 4. EU LI2 - Main sources of the differences between regulatory original exposure amounts and carrying values in financial statements (Million Euros. 12-31-17)
Items subject to:
TotalCredit risk framework
Counterparty credit risk framework
Securitisation framework
Market risk framework
Asset carrying value amount under scope of regulatory consolidation (as per template LI1) 699.948 552.448 67.482 7.688 72.330
Liabilities carrying value amount under regulatory scope of consolidation (as per template LI1 ) 80.470 (2.024) 40.742 - 41.752
Total net amount under regulatory scope of consolidation (82.031) 56.315 (24.038) (226) (114.082)Amount of off-balance-sheet 184.889 184.889 - - - Counterparty risk in derivatives (includes the add-on) 13.586 - 13.586 - - Differences due to netting standards (netting, long/short positions) (150.050) - (35.968) - (114.082)Non-eligibility of the balances corresponding to accounting hedges (derivatives and adjustments for macro-hedging)
(25) (25) - - -
Non-eligibility of the balances corresponding to accounting hedges (portfolio hedges)
(505) (505) - - -
Non-eligibility of other financial assets (mainly balances of guarantees provided in cash)
(7.570) (5.905) (1.665) - -
Non-eligibility of other financial assets (mainly other guarantees) (3.176) (3.176)Non-eligibility of accounts without loan book risk (premiums, transaction costs) - - - - - Non-eligibility of underlying assets of Securitisations (226) - - (226) - Accounting Provisions (1) 5.861 5.852 9 - - Corresponding amount of credit risk mitigation techniques (CRM) 119 119 0 - - Corresponding amount of credit conversion factors (CCF) (124.499) (124.499) - - - Other (435) (435) - - - Exposure amounts considered for regulatory purposes 698.386 606.739 84.186 7.461 - (1) Includes provisions for exposures to credit risk via advanced method. The provisions of the credit risk exposures via standard method amounting to 8,023 million euros are not included.
The following table breaks down the credit risk and counterparty amounts by the items of the Public Balance
Sheet by EO, EAD and RWAs, which are the risk concepts on which this Document is based.
Table 5. Credit and Counterparty Credit Risk headings of the Public Balance Sheet for EO, EAD and RWAs (Million Euros. 12-31-17)
Credit Risk(4)
Public Balance Sheet Headings OE(1) EAD(2) RWAs(3)
Cash, cash balances at central banks and other demand deposits 43,461 43,460 5,009 Financial assets held for trading 34,713 29,714 8,646 Financial assets designated at fair value through profit or loss 648 648 750 Available-for-sale assets 50,102 54,566 9,072 Loans and receivables 649,209 512,531 244,367 Investments in subsidiaries, joint ventures and associates 4,631 4,631 10,682 Tangible assets 6,713 6,713 6,869 Tax assets 11,457 11,457 16,270 Other assets 4,221 4,221 3,583 Non-current assets and disposal groups held for sale 5,134 5,100 5,098 Assets sold under a purchase agreement 25,344 25,344 141 Total Assets + Liabilities 835,632 698,386 310,487 (1)OE: Original Exposure(2)EAD: OE net of provisions, adjustments and CRM(3)RWAs: EAD after taking into account risk-weights(4)Excluding funds for CCP defaults

1. General InformatIon requIrementsBBVA. PILAR III 2017 P. 26
1.1.4. Main changes to the Group’s scope of consolidation in 2017
Investments
On February 21, 2017, BBVA Group reached an agreement to acquire 41,790,000,000 shares of Turkiye Garanti Bankasi, A.S. (Garanti Bank) from Dogus Holding A.S. and Dogus Arastirma Gelistirme ve Musavirlik Hizmetleri A.S., representing 9.95% of its share capital. On March 22, 2017, the purchase agreement was competed by which the total BBVA stake in Garanti Bank is now 49.85%.
Ongoing divestments
Offer for the acquisition of the BBVA, S.A. stake in BBVA Chile
On November 28, 2017, BBVA received a binding offer (the “Offer”) from the group The Bank of Nova Scotia (“Scotiabank”) for the purchase of its stake in Banco Bilbao Vizcaya Argentaria, Chile (“BBVA Chile”) for approximately USD 2.2 billion (€1.85 billion), as well as other Group companies in Chile with activities linked to this banking business (among them, BBVA Seguros Vida, S.A.). BBVA’s total direct and indirect stake in BBVA Chile is around 68.19% of its share capital. On December 5, 2017, BBVA announced it accepted the Offer and signed a sale agreement.
The Offer received does not include BBVA Group’s stake in the companies dedicated to the auto finance business in the Forum Group, or in other companies of the group in Chile dedicated to BBVA Group’s corporate activities.
The closing of this deal is subject to receiving the corresponding regulatory approval. Derived from this transaction, in the Group’s Consolidated Financial Statements most of the assets and liabilities from BBVA Chile are registered under the heading of Non-Current Assets Held for Sale, while under the perimeter of solvency, BBVA Chile
is still consolidated by the full integration method, and thus integrates its assets and liabilities under the corresponding headings.
Agreement for the creation of a joint venture and transfer of the real-estate business in Spain
On November 29, 2017, BBVA reached an agreement with a subsidiary of Cerberus Capital Management, L.P. (“Cerberus”), for the creation of a joint venture to which it will transfer BBVA’s real-estate business in Spain (the “Business”). In executing this agreement, BBVA will transfer the Business to a single company (the “Company”), and at the closing date of the transaction, it will sell 80% of the shares in the Company to Cerberus.
The Business includes: (i) foreclosed real-estate owned (hereinafter, the “REOs”), for a gross value of approximately €13 billion, based on a starting point of the situation of the REOs as of June 26, 2017; and (ii) the assets and employees needed for the autonomous management of the Business. For the purpose of the agreement with Cerberus, the whole Business has been valued at approximately €5 billion.
Taking into account the valuation of the whole Business as mentioned, and assuming that all the REOs of the Business will be transferred to the Company as of June 26, 2017, the sale price of this 80% of the shares will be approximately €4 billion. The final price paid will be determined by the volume of REOs actually included, which may vary depending on factors such as sales between the reference date of June 26, 2017 and the closing date of the transaction, and compliance with the normal conditions for transactions of this type.
The deal as a whole is subject to receiving the appropriate authorisations from the competent authorities. This deal will not have any significant impact on the consolidated financial statements.

1. General InformatIon requIrementsBBVA. PILAR III 2017 P. 27
1.2. Identification of dependent institutions with capital resources below the minimum requirement. Possible impediments to capital transfer
There is no institution in the Group not included in the consolidated Group for the purpose of the solvency regulations whose capital is below the regulatory minimum requirement.
The Group operates mainly in Spain, Mexico, the United States, Turkey and South America. The Group’s banking subsidiaries around the world are subject to supervision and regulation (with respect to issues such as compliance
with a minimum level of regulatory capital) by a number of regulatory bodies.
The obligation to comply with these capital requirements may affect the capacity of these banking subsidiaries to transfer funds (e.g. via dividends) to the parent company.
In some jurisdictions in which the Group operates, the regulations lay down that dividends may only be paid with the funds available by regulation for this purpose.
1.3. Exemptions from capital requirements at the individual or sub-consolidated level
In accordance with the exemption from capital requirements compliance for Spanish credit institutions belonging to a consolidated group (at individual or subconsolidated level) established in the CRR, the Group obtained exemption from the supervisor on December 30, 2009 for the following companies (this exemption was ratified through ECB decision 1024/2013):
Banco Industrial de Bilbao, S.A.
Banco Occidental, S.A
In addition, for the establishment of Financiero de Crédito de Portugal (BBVA IFIC, S.A.), the BCE has decided not to apply individual prudential or liquidity requirements.
It is also worth noting that on February 10, 2017 the European Central Bank accepted the relinquishment of the bank file presented by Banco de Promoción de Negocios, S.A. which thus was no longer a credit institution regulated by the solvency regulations.

2. own funds and CapItalBBVA. PILAR III 2017 P. 28
2. Own funds and Capital
2.1. Characteristics of the eligible capital resources 29
2.2. Amount of capital 31
2.3. Bank risk profile 33
2.4. Breakdown of minimum capital requirements by risk type 34
2.5. Procedure employed in the internal capital adequacy assessment process 37

2. own funds and CapItalBBVA. PILAR III 2017 P. 29
2.1. Characteristics of the eligible capital resources
The following are considered for the purpose of calculating the minimum capital requirements under the solvency regulations: the elements and instruments corresponding to Tier 1 capital, which is defined as the sum of Common Equity Tier 1 capital (CET1) and additional Tier 1 capital (AT1), as defined in Part Two, Title I, Chapters I to III of the CRR, as well as their corresponding deductions, in accordance with articles 36 and 56, respectively.
Also considered are the elements of Tier 2 capital defined in Part Two of Chapter IV, section I of the CRR. The deductions defined as such in section II of the same Chapter are also considered.
In line with the stipulations of the solvency regulation, the level of Common Equity Tier 1 capital essentially comprises the following elements:
a) Capital and share premium: this includes the elements described in article 26 section 1, articles 27, 28 and 29 of the CRR and the EBA list referred to in article 26 section 3 of the CRR.
b) Accumulated gains: In accordance with article 26. 1 c), the gains that may be used immediately and with no restriction to hedge any risks or losses are included (mainly reserves, including the reserves of the consolidated companies).
c) Other accumulated income and other reserves: Under this heading will be classified mainly the reserves of consolidated companies, and (including the associated exchange-rate differences) the valuation adjustments associated with the available-for-sale portfolio.
d) Minority shareholdings: includes the sum of the ordinary Level 1 capital instruments of a subsidiary that arise in the process of its global consolidation and are attributable to natural or legal third persons.
e) Temporary benefits: included is the net income referring to the perimeter of credit institutions, deducting the amount corresponding to interim and final dividend payments, as set out in article 26, section 2 of the CRR. Also included is the balance of the equity account listing remuneration from equity instruments.
Capital is, moreover, adjusted mainly through the following deductions:
f) Additional value adjustments: The adjustments originated by the prudent valuation of the positions at fair value are included, as set out in article 105 of the CRR.
g) Intangible assets: these are included net of the corresponding tax liabilities, as set out in article 36, section 1, letter b) and article 37 of the CRR. It mainly includes goodwill, software and other intangible assets.
h) Deferred tax assets: These are understood to be assets for deferred taxes that depend on future returns, excluding those deriving from temporary differences (net of the corresponding tax liabilities when the conditions established in article 38.3 of the CRR are met), as per article 36.1 c) and article 38 of the CRR, mainly loss carryforwards (LCFs).
i) Reserves at fair value connected to losses or gains by cash flow hedging: Includes value adjustments of cash flow hedging of financial instruments not valued at fair value, including expected cash flows in accordance with article 33 a) of the CRR.
j) Expected losses in equity instruments: The losses arising from the calculation of risk-weighted exposures through the method based on internal ratings are included, as set out in article 36.1 b) of the CRR.
k) Profit or losses at fair value: These are derived from the entity’s credit risk itself, in accordance with article 33 b) of the CRR.
l) Direct and indirect holdings of own instruments (treasury stock): includes the shares and other securities booked as own funds that are held by any of the Group’s consolidated entities, together with those held by non-consolidated entities belonging to the economic Group, as set out in article 33. 1 f) and article 42 of the CRR. It mainly includes finance for own shares, synthetic treasury stock and own securities.
m) Securitisation: securitisations that receive a risk weighting of 1.250% are included, as set out in article 36.1 k) ii) of the CRR.
n) Transitional Common Equity Tier 1 capital: Considered as such are unrealised fair value gains and losses, in accordance with articles 467 and 468 of the CRR, as well as all the fair value gains and losses arising from the institution’s own credit risk related to derivative liabilities (DVA) under article 33 c).
o) Qualifying deductions of common equity Tier 1: this includes the deductions that exceed the additional Tier 1 capital, as described in article 36.1 b) of the CRR.

2. own funds and CapItalBBVA. PILAR III 2017 P. 30
The application of some of the above deductions (mainly intangible assets and LCFs) shall be carried out gradually over a transition period of 5 years starting in 2014 (phased in), as set out in the current regulation.
Other deductions that may be applicable are significant stakes in financial institutions and assets for deferred taxes arising from temporary differences that exceed the 10% limit of the CET1, and the deduction for exceeding the overall 17.65% limit of the CET1 according to article 48.2 of the CRR.
In addition, the Group includes as total eligible capital the additional Tier 1 capital instruments defined in article 51, 85 and 484 of the CRR, including the corresponding adjustments, in accordance with article 472 of the CRR:
p) Equity instruments and issue premiums classified as liabilities: This heading includes the perpetual contingent convertible securities that meet the conditions set out in article 51 and 52.1 of the CRR.
q) Elements referred to in article 484.4 of the CRR: This section includes the preferred securities issued by the Group.
r) Qualifying Tier 1 capital included in the consolidated additional capital issued by affiliates and held by third parties: Included as additional consolidated Tier 1 capital is the amount of Tier 1 capital from the subsidiaries, calculated in accordance with article 85 of the CRR and applying the phased-in percentages corresponding transitional period established by article 480 of the CRR.
s) Temporary adjustments of additional Tier 1 capital: This includes the adjustments considered in article 472 of the CRR as measures established for gradual adoption of the new capital ratios.
Finally, the entity also includes Tier 2 as eligible capital. Combined with what is indicated in Article 87 of the CRR, it is made up of the following elements:
t) Equity instruments and Tier 2 share premiums: Understood as the funding that, for credit seniority purposes, comes behind all the common creditors. The issues, moreover, have to fulfill a number of conditions which are laid out in article 63 of the CRR.
u) Amounts of the eligible elements, under article 484: Tier 2 capital includes the subordinated debt received by the Group that does not meet the conditions set out in article 63 of the CRR, but is acceptable in the transitional regulatory capital under article 484 of the CRR.
v) Qualifying capital instruments included in the consolidated Tier 2 capital issued by subsidiaries and held by third parties: these instruments are included under articles 87 and 88 of the CRR, by applying the phased-in percentages corresponding to the transitional period established by article 480 of the CRR.
w) Adjustment for credit risk: A calculation is made of the surplus resulting between the allowances for impairment losses on assets and provisions for risks related to exposures calculated as per the IRB Approach on the losses they are expected to incur, for the part that is below 0.6% of the risk-weighted exposures calculated according to this method.
The Annex available on the Group’s website presents the Group’s issuance of perpetual contingent convertible securities and issuance of preference shares, which as explained above, form part of additional Tier 1 capital.
This Annex also details the Group’s issues of subordinated debt as of December 31, 2017, calculated as Tier 2 capital.

2. own funds and CapItalBBVA. PILAR III 2017 P. 31
2.2. Amount of capital
The table below shows the amount of total eligible capital, net of deductions, for the different items making up the capital base as of December 31, 2017 and December 31, 2016, in accordance with the disclosure requirements for information
relating to temporary capital set out by Implementing Regulation (EU) No. 1423/2013 of the Commission dated December 20, 2013:
Table 6. Amount of capital (Million Euros)
Eligible capital resources 12-31-17 12-31-16a) Capital and share premium 27,259 27,210
b) Retained earnings 25,504 23,688
c) Other accumulated earnings (and reserves) (8,710) (5,500)
d) Minority interests 5,446 6,969
e) Net attrib. profit and interim and final Group dividends 1,436 1,973
Ordinary Tier 1 Capital before other reglamentary adjustments 50,935 54,339
f) Additional value adjustments (332) (250)
g) Intangible assets (6,627) (5,675)
h) Deferred tax assets (755) (453)
i) Fair value reserves related to gains o losses on cash flow hedges (193) -
j) Expected losses in equity (20) (16)
k) Profit or losses on liabilities measured at fair value - -
l) Direct and indirect holdings of own instruments (278) (181)
m) Securitisations tranches at 1250% (39) (62)
n) Temporary CET1 adjustments (324) (332)
o) Admisible CET1 deductions (26) -
Total Common Equity Tier 1 regulatory adjustments (8,594) (6,969)
Common Equity Tier 1 (CET1) 42,341 47,370
p) Equity instruments and share premium classified as liabilities 5,751 5,423
q) Items referred in Article 484 (4) of the CRR 142 691
r) Qualifying Tier 1 capital included in consolidated AT1 capital (including minority interests not included in row d) issued by subsidiaries and held by third parties)
403 383
Additional Tier 1 before reglamentary adjustments 6,296 6,497
s) Temporary adjustments Tier 1 (1,657) (3,783)
Total reglamentary adjustments of Additional Tier 1 (1,657) (3,783)
Additional Tier 1 (AT1) 4,639 2,713
Tier 1 (Common Equity Tier 1+Additional Tier 1) 46,980 50,083
t) Equity instruments and share premium 1,759 2,357
u) Amount of the admissible items, pursuant to Article 484 - -
v) Admissible shareholders' funds instruments included in consolidated Tier 2 issued by subsidiaries and held by third parties 6,438 5,915
-Of which: instruments issued by subsidiaries subject to ex-subsidiary stage 317 350
w) Credit risk adjustments 601 538
Tier 2 before reglamentary adjustments 8,798 8,810
Tier 2 reglamentary adjustments - -
Tier 2 8,798 8,810
Total Capital (Total capital = Tier 1 + Tier 2) 55,778 58,893
Total RWA's 362,875 388,951
CET 1 (Phased-In) 11.67% 12.18%
CET 1 (fully-loaded) 11.04% 10.90%
Tier 1 (Phased-In) 12.95% 12.88%
Tier 1 (fully-loaded) 12.76% 12.46%
Total Capital (Phased-In) 15.37% 15.14%
Total Capital (fully-loaded) 15.14% 14.71%

2. own funds and CapItalBBVA. PILAR III 2017 P. 32
As of December 31, 2017, the phased-in Common Equity Tier 1 (CET1) stood at 11.67%, accounting a decrease with respect to December 2016 of 51 basis points. The negative effect on the minority interests and deductions due to the regulatory phase-in calendar of 80% in 2017 compared to 60% in 2016 has an impact of -57 basis points which is compensated by the organic generation of capital leaning against the recurrence of the results, net of dividends paid and remunerations.
It is also worth noting that in 2017 there were corporate operations that had an impact on CET1, particularly the acquisition of an additional 9.95% stake in Garanti Bank, the sale of 1.7% of the stake in CNCB and the capital increase of Banco Francés (the Group’s subsidiary in Argentina), with an impact of approximately -9 basis points on CET1.
Additionally, BBVA Group has registered on December 2017 losses of €1.123 billion due to the unrealized losses from its stake in Telefónica. However, this impact does not affect the Group’s equity or solvency, as the losses were already included at this date.
In 2017 the Group continued to strengthen its capital position with two new issuances classified as additional Tier 1 (contingent convertible) for €500m and USD 1.0 billion, respectively (the latter issued in the U.S. market, with a prospectus registered with the Securities and Exchange Commission (SEC), for which as of December 31, 2017 authorization had still not been received for inclusion in the Group’s capital ratios. This authorization was finally received at the start of 2018).
At Tier 2, in 2017 BBVA, S.A. issued subordinated debt for a value of approximately €1.5 billion. In addition, Garanti Bank issued Tier 2 capital for USD 750, pending supervisory confirmation for its inclusion in the Group’s regulatory ratios; the impact of this issue was of an additional +10 bps of Tier 2 as of December 31, 2017.
It is worth mentioning that during 2017, senior non-preferred debt was issued for €1.79 billion, strengthening the Group’s capacity to absorb losses and aiming to comply with the minimum requirement for own funds and eligible liabilities (MREL).Lastly, the total phased-in ratio stood at 15.37%, for the reasons explained above.
In addition, the Group is pending information from the ECB of an update in the methodology of calculating exchange-rate risk. As of December 31, 2017 it would have had a positive impact of 4 bps on the fully-loaded CET1 ratio.
Chart 1: Fully-loaded CET1 ratio by year
10,9011,04
0,61
CET 1FL (Dec 16)
CET 1FL (Dec 17)
Profit net from dividends and AT1
remunerations
-0,24
RWA
-0,09
Corporate Operations
-0,14
Others
(1) Other effects mainly includes the balance of eligible minority interests, regulatory deductions and market value of the available-for-sale portfolios
These capital levels are above the requirements established by the ECB in its SREP letter and the systemic buffers applicable to BBVA Group for the CET1 ratio in 2017 (11.125%).
With respect to changes in risk-weighted assets, a reduction was recorded of around 7% with respect to December 2016, largely due to the depreciation of currencies against the euro and an efficient management and assignment of the Group’s capital in line with its strategic objectives.
Annex III, available on the Group’s website, shows the features of the main capital instruments with the aim of reflecting the characteristics of an entity’s capital instruments, with the level of detail required by regulations, and in accordance with Implementing Regulation (EU) No. 1423/2013 of the Commission dated December 20, 2013.
The process followed is shown below, in accordance with the recommendations issued by the EBA. Based on the shareholders’ equity reported in the Group’s Consolidated Annual Report and by applying the deductions and adjustments shown in the table below, the regulatory capital figure eligible for solvency purposes is arrived at:

2. own funds and CapItalBBVA. PILAR III 2017 P. 33
Eligible capital resources 12-31-17 12-31-16Capital 3,267 3,218Share premium 23,992 23,992Retained earnings, revaluation reserves and other reserves 25,443 23,641Other equity instruments (net) 54 54Treasury shares (96) (48)Attributable to the parent company 3,519 3,475Attributed dividend (1,043) (1,510)
Total Equity 55,136 52,821Value adjustments (8,792) (5,458)Minority interests 6,979 8,064
Shareholders´ equity 53,323 55,428Intangible assets (6,627) (5,675)Fin. treasury shares (48) (82)Indirect treasury shares (134) (51)
Deductions (6,809) (5,808)Temporary CET 1 adjustments (273) (129)
Capital gains from the Available-for-sale debt instruments portfolio (256) (402)
Capital gains from the Available-for-sale equity portfolio (17) 273
Differences from solvency and accounting level (189) (120)
Equity not eligible at solvency level (462) (249)
Other adjustments and deductions (3,711) (2,001)Common Equity Tier 1 (CET 1) 42,341 47,370Additional Tier 1 before Regulatory Adjustments 6,296 6,497
Total Regulatory Adjustments of Aditional Tier 1 (1,657) (3,783)Tier 1 46,980 50,083Tier 2 8,798 8,810Total Capital (Tier 1 + Tier 2) 55,778 58,893
Total Minimum equity required (1) 40,370(1) Calculated over capital requirements of 11.125%
2.3. Bank risk profile
BBVA Group has a General Risk Management and Control Model (hereinafter, the “Model”) adapted to its business model, organisation and the geographic areas in which it operates. It allows it to operate within the framework of the control and risk management strategy defined by the Bank’s company bodies and adapt to an economic and regulatory environment, addressing management globally and adapted to the circumstances at any particular time. The Model establishes a system of risk management that is adapted to the entity’s risk profile and strategy.
The risks inherent in the business that make up the risk profile of BBVA Group are as follows:
Credit risk: Credit risk arises from the probability that one party to a financial instrument will fail to meet its contractual obligations for reasons of insolvency or inability to pay and cause a financial loss for the other party. This includes counterparty risk, issuer credit risk, liquidation risk and country risk.
Counterparty risk: The credit risk corresponding to derivative instruments, repurchase and resale transactions, securities or commodities lending or borrowing transactions and deferred settlement transactions.
Credit valuation adjustment (CVA) risk: Its aim is to reflect the impact on the fair value of the counterparty’s credit risk.
Market risk: Market risk originates in the possibility that there may be losses in the value of positions held due to movements in the market variables that affect the valuation of financial products and assets in trading activity.
Operational risk: Operational risk is defined as the one that could potentially cause losses due to human errors, inadequate or faulty internal processes, system failures or external events. This definition includes legal risk, but excludes strategic and/or business risk and reputational risk.
Table 7. Reconciliation of the Public Balance Sheet from the accounting perimeter to the regulatory perimeter (Million Euros)

2. own funds and CapItalBBVA. PILAR III 2017 P. 34
Structural risks: These are divided into structural interest-rate risk (movements in interest rates that cause alterations in an entity’s net interest income and equity value) and structural exchange-rate risk (exposure to variations in exchange rates originating in the Group’s foreign companies and in the provision of funds to foreign branches financed in a different currency from that of the investment).
Liquidity risk: Risk of an entity having difficulties in duly meeting its payment commitments, and where it does not
have to resort to funding under burdensome terms which may harm the bank’s image or reputation.
Reputational risk: Considered to be the potential loss in earnings as a result of events that may negatively affect the perception of the Group’s different stakeholders.
The chart below shows the total risk-weighted assets broken down by type of risk (where the credit risk encompasses the counterparty risk) as of December 31, 2017 and December 31, 2016:
Chart 2: Distribution of RWAs by risk type eligible in Pillar I
86.0%
3.2%1.3%
9.6%2017
Tota l C redit Risk
Tota l Trading-book Activity Risk
Exchange Rat e Risk(Standardized approach)
Operational Risk 87.0%
3.2%1.0%
8.8%2016
(*) Credit Risk includes Risk by CVA adjustment
2.4. Breakdown of minimum capital requirements by risk type
In accordance with article 92 of the CRR, the entities must at all times comply with the following capital requirements:
a) Common Equity Tier 1 capital ratio of 4.5%, obtained as the level of Common Equity Tier 1 capital expressed as a percentage on the total amount of risk-weighted assets.
b) Common Equity Tier 1 capital ratio of 6%, obtained as the level of Common Equity Tier 1 capital expressed as a percentage on the total amount of risk-weighted assets.
c) Total capital ratio of 8%, obtained as the capital expressed as a percentage on the total amount of risk-weighted assets.
Regardless of article 92 of the CRR, after the Supervisory Review and Evaluation Process (SREP), in 2018 the minimum Common Equity Tier 1 ratio level should be 8.438%. As of December 31, 2017 the Group has a phased-in CET1 ratio of 11.67%, above the regulatory requirement.
The total amount of capital requirements is made up mainly of the following items:
Credit and dilution risk
Weighted exposures for credit and dilution risk, excluding the amount of risk-weighted exposures for the trading book. When calculating the risk-weighted exposures, the credit institutions may apply the standard method or the method based on internal ratings, when allowed by the competent authorities.
Counterparty Risk
Counterparty risk-weighted exposures corresponding to repo and derivative operations (section 3.2.6. of the present Document).
Market risk
It arises mainly in the trading book and includes capital requirements determined with respect to position risk in debt and equity instruments, exchange-rate risk and commodity risk.

2. own funds and CapItalBBVA. PILAR III 2017 P. 35
Structural exchange-rate risk
Capital requirements determined with respect to structural exchange-rate risk.
Credit valuation adjustment risk
The capital requirements with respect to the credit valuation adjustment risk resulting from OTC derivative instruments that are not credit derivatives recognised for the purpose of reducing the amount of credit risk-weighted exposures.
Operational risk
The capital requirements determined in accordance with Title III of the CRR with respect to operational risk.
In addition, as stated in the introductory section of the present Document, Basel III, unlike the previous framework, introduces capital buffers as a complement to the minimum capital requirements. A transition period ending in 2019 has been established to facilitate the adaptation of financial institutions to the minimum capital requirements.
The third part of the CRR sets out the capital requirements, in accordance with the Basel III framework, as well the techniques for calculating the different minimum regulatory capital ratios.
The total for capital requirements are shown below, broken down by type of risk as of December 31, 2017 and December 31, 2016. The positions in securitisation (standardised and advanced measurement approaches), equity and counterparty risk are broken down separately:
Table 8. EU OV1 Overview of RWAs (Million Euros)
RWA (1)Minimum Capital
Requirements (2) (3)
12-31-17 12-31-16 (4) 12-31-17Credit Risk (excluding CCR) 286,368 309,046 22,909 Of which the standardised approach (5) 198,715 215,908 15,897 Of which the foundation IRB (FIRB) approach - - - Of which the advanced IRB (AIRB) approach 83,577 89,589 6,686 Of which equity IRB under the simple risk-weighted approach (6) 4,076 3,548 326
CCR 9,459 11,888 757 Of which mark to market 7,844 9,473 628 Of which original exposure - - - Of which the standardised approach - - - Of which the Internal model method (IMM) - - - Of which risk exposure amount for contributions to the default fund of a CCP 49 93 4 Of which CVA 1,566 2,321 125
Settlement Risk - - -
Securitisation exposures in the banking book (after the cap) 1,751 1,477 140 Of which IRB approach 827 332 66 Of which IRB supervisory formula approach (SFA) - - - Of which internal assessment approach (IAA) - - - Of which standardised approach 924 1,144 74
Market Risk 16,018 16,370 1,281 Of which the standardised approach 7,408 7,112 593 Of which IMA 8,611 9,258 689
Operational Risk 34,755 34,323 2,780 Of which basic indicator approach 6,204 6,444 496 Of which the standardised approach 10,102 10,781 808 Of which IRB approach 18,449 17,098 1,476 Amounts below the thresholds for deduction (subject to 250% risk weight) 14,525 15,848 1,162 Floor Adjustment - - - TOTAL 362,875 388,951 29,030 (1) Risk-weighted assets according to the transitional period (phased-in)(2) Multiplied by 8% of RWAs(3) Under CET 1 requirements (7.625%) after the supervisory evaluation process (SREP), the requirements amount to 27,669 million euros. Under Total Capital requirements (11.125%),
the requirements amount to 40,370 million euros(4) Shown for comparative purposes only and corresponds to proforma data as of December 2016(5) Deferred tax assets arising from temporary differences, which are not deducted from own funds (subject to a risk weight of 250%) are excluded, in accordance with Article 48.4 CRR.
This amount is up to 6,778 and 7,653 at 31 December 2017 and 31 December 2016, respectively(6) Equity, calculated under the simple risk-weighted approach and internal model method, is included. Significant investments in financial sector entities and insurers that are not
deducted from eligible own funds (subject to a risk weight of 250%) are excluded, in accordance with Article 48.4 CRR. This amount rises to 7,747 and 8,195 as at 31 December 2017 and 31 December 2016, respectively.

2. own funds and CapItalBBVA. PILAR III 2017 P. 36
The chart below shows the risk-weighted assets broken down by risk and the capital requirements broken down by type of
risk and categories of exposure, as of December 31 2017 and December 31 2016:
Table 9. Capital requirements by risk type and exposure class (Million Euros)
Exposure Class and risk typeCapital requirements (2) RWA's (1)
12-31-17 12-31-16 12-31-17 12-31-16Credit Risk 16,684 18,239 208,554 227,987Central governments or central banks 2,381 2,408 29,759 30,106Regional governments or local authorities 100 79 1,252 989Public sector entities 52 75 654 941Multilateral development banks 1 3 14 33International organisations - - - -Institutions 463 510 5,793 6,370Corporates 7,328 8,301 91,600 103,761Retail 3,134 3,266 39,177 40,821Secured by mortgages on immovable property 1,569 1,702 19,609 21,276Exposures in default 420 465 5,248 5,807Exposures associated with particularly high risk 296 175 3,694 2,193Covered bonds - - - -Claims on institutions and corporates with a short-term credit assesment 0 7 5 87Collective investments undertakings 2 11 24 140Other exposures 938 1,237 11,725 15,463Securitisation exposures 74 92 924 1,144Securitisation exposures 74 92 924 1,144
TOTAL CREDIT RISK BY STANDARDISED APPROACH 16,758 18,330 209,478 229,131
Credit Risk 6,673 7,179 83,408 89,741Central governments or central banks 94 44 1,172 552Institutions 474 489 5,931 6,114Corporates 4,531 4.879 56,643 60,983
Of which: Specialised lending 804 965 10,056 12.061
Of which: SMEs 646 777 8,077 9.710
Of which: Others 3,081 3.137 38,510 39.212
Retail 1,573 1.767 19,661 22,091
Of which: Secured by real estate property 661 855 8,268 10.690
Of which: Qualifying revolving 541 590 6,764 7.376
Of which: Other SMEs 129 120 1,612 1.503
Of which: Other Non-SMEs 241 202 3,017 2.523
Equity 1,342 1,331 16,775 16,639On the basis of method:
Of which: Simple approach 765 863 9,562 10,782
Del que: PD/LGD approach 396 392 4,953 4,896
Del que: Intern models 181 77 2,261 961
On the basis of nature:
Of which: Listed instruments 433 528 5,412 6,598
Of which: Not listed instruments in sufficiently diversified portfolios 909 803 11,363 10,042
Securitisation exposures 66 27 827 332Securitisation exposures 66 27 827 332
TOTAL CREDIT RISK BY IRB APPROACH 8,081 8,537 101,009 106,713TOTAL CONTRIBUTIONS TO THE DEFAULT FUND OF A CCP 4 7 49 93TOTAL CREDIT RISK 24,843 26,875 310,536 335,937SETTLEMENT RISK - - - -Standardised approach: 226 246 2,829 3,071
Of which: Price Risk by fixed income exposures 197 211 2,461 2,638
Of which: Price Risk by Securitisation exposures 2 1 20 17
Of which: Price Risk by correlation 11 5 142 63
Of which: Price Risk by stocks and shares 16 19 197 234
Of which: Commodities Risk 1 9 9 118
IRB: Market Risk 689 741 8,611 9,258TOTAL TRADING BOOK RISK 915 986 11,439 12,329FOREING EXCHANGE RISK (STANDARDISED APPROACH) 366 323 4,579 4,041CVA RISK 125 186 1,566 2,321OPERATIONAL RISK 2,780 2,746 34,755 34,323
CAPITAL REQUIREMENTS 29,030 31,116 362,875 388,951(1) Risk-weighted assets according to the transitional period (phased-in)(2) Multiplied by 8% of RWAs

2. own funds and CapItalBBVA. PILAR III 2017 P. 37
Below is a breakdown of the percentage of RWAs calculated according to the standardised approach and advanced
approach for each exposure class for credit, counterparty and securitisation risk.
Chart 3: Breakdown of RWAs by exposure class and approach
96%
49%62% 67%
53%
100% 100% 100% 100% 100% 100% 100% 100% 100%
67%
4%
51%38% 33%
47%
100%
33%
Cen
tral
Gov
ernm
ents
or
Cen
tral
Ban
ks
Inst
itut
ions
Cor
pora
tes
Ret
ail
Sec
urit
izat
ion
expo
sure
s
Reg
iona
l Gov
ernm
ents
or
Loc
al A
utho
riti
es
Pub
lic s
ecto
r en
titi
es
Mul
tila
tera
l de
velo
pmen
t ban
ks
Sec
ured
by
mor
tgag
es
on im
mov
able
pro
pert
y
Exp
osur
es i
n d
efau
lt
Exp
osur
es as
soci
ated
wit
h pa
rtic
ular
ly h
igh
risk
Cla
ims
on in
stit
utio
ns
and
corp
orat
es w
ith
a sh
ort-
term
cre
dit
asse
smen
t
Col
lect
ive
in
vest
men
ts
unde
rtak
ings
Oth
er e
xpos
ures
Equ
ity
(2)
Tot
al
Standard Advanced (1)
(1) Table 28 of the report sets out the models and portfolios authorised by the supervisor for the purpose of their use in calculating own funds. (2) RWAs in the equity portfolio are calculated according to the methods indicated in article 155 of the CRR
2.5. Procedure employed in the internal capital adequacy assessment process
The Group carries out the internal capital assessment process in accordance with the Capital Requirements Directive 2013/36/EU and guidelines on collection of information relating to ICAAP for the purpose of the supervisory review and evaluation process (SREP) published by the European Banking Authority.
As part of the internal capital assessment process, the Group assesses and quantifies all the risks that may significantly affect its capital position and extracts a conclusion on its capital adequacy from a holistic medium-term perspective.
The Group applies a proportionate approach that aims to ensure the bank’s survival and continuous compliance with all the legal and internal requirements. As well as the regulatory and accounting perspectives, the Group bases its analysis on its capital adequacy position in a sound internal approach that assesses its capital position from an economic point of view that integrates both the quantification of risk capital needs covered in the Basel Pillar I and the needs due to risks not included in it.
The following are some of the points are assessed within the internal capital adequacy assessment process:
Business and strategy model, describing both the changes planned by the bank in the current business model and its underlying activities such as the relationship between the business strategy and internal capital adequacy assessment.
Internal governance, risk management and the control framework, reviewing the processes and mechanisms that ensure that the bank has a sound and integrated framework for managing present and future material risks.
Risk appetite framework, describing the correspondence between this framework and the bank’s business strategy and model.
Identification and assessment of risks (including credit, operational, market, liquidity and other asset and liability risks) and quantification of the capital necessary to cover them, with a quantitative reconciliation between the Pillar I and Pillar II approaches.
Planning of capital under baseline and stress scenarios, projecting the capital base of the Group, the parent and its main subsidiaries over the next three years and analyzing capital sufficiency in accordance with the regulatory requirements and the internal objectives set out by the entity for the close of the period, also dealing with the planned capital actions.
This internal capital adequacy assessment process concludes with submission to the supervisor of an annual report on the process. The report pays a key role in the review and evaluation methodology applied by the Single Supervisory Mechanism, and is an important element for determining capital requirements under Pillar II.

3. rIsksBBVA. PILAR III 2017 P. 38
3. Risks
3.1. General Risk Management and Control Model 40
3.1.1. Governance and organisation 40
3.1.2. Risk Appetite Framework 43
3.1.3. Decisions and processes 44
3.1.4. Assessment, monitoring and reporting 45
3.1.5. Infrastructure 46
3.1.6. Risk culture 46
3.2. Credit and counterparty risk 47
3.2.1. Scope and nature of the Credit Risk measurement and reporting systems for capital framework purposes 47
3.2.2. Definitions and accounting methodologies 48
3.2.3. Information on credit risks 50
3.2.4. Information on the standardised approach 61
3.2.5. Information on the IRB approach 66
3.2.6. Information on counterparty risk 85
3.2.7. Information on securitisations 96
3.2.8. Information on credit risk mitigation techniques 105
3.2.9. RWA density by geographical area 108
3.2.10. Risk protection and reduction policies. Supervision strategies and processes 109
3.3. Market risk 110
3.3.1. Scope and nature of the market risk measurement and reporting systems 110
3.3.2. Differences in the trading book for the purposes of applying the solvency regulations and accounting criteria 111
3.3.3. Standardised approach 111
3.3.4. Internal models 112

3. rIsksBBVA. PILAR III 2017 P. 39
3.4. Structural risk in the equity portfolio 121
3.4.1. Scope and nature of the structural risk in the equity portfolio measurement and reporting systems 121
3.4.2. Differentiation between portfolios held for sale and those held for strategic purposes 121
3.4.3. Book value and exposure of equity investments and capital instruments contained in above portfolios 122
3.4.4. Risk-weighted assets of equity investments and capital instruments 122
3.4.5. Profit and loss and adjustments for valuation of equity investments and capital instruments 123
3.5. Structural exchange-rate risk 123
3.5.1. Scope and nature of the exchange-rate risk measurement and reporting systems 123
3.6. Interest-Rate Risk 124
3.6.1. Scope and nature of the interest-rate risk measurement and reporting systems 124
3.6.2. Nature of interest rate risk and key hypotheses 125
3.6.3. Variations in interest rates 126
3.7. Liquidity Risk 126
3.7.1. Liquidity and Funding Strategy and Planning 126
3.7.2. Governance and monitoring 127
3.7.3. Liquidity and funding performance in 2017 129
3.7.4. Liquidity prospects 131
3.7.5. LCR disclosure 132
3.7.6. Assets committed in finance transactions 134
3.8 Operational risk 137
3.8.1. Operational Risk definition 137
3.8.2. Operational Risk methodology 137
3.8.3. Model based on 3 lines of defense 138
3.8.4. Principles of BBVA’s Operational Risk management model 138
3.8.5. Methods used 141
3.8.6. The Group’s Operational Risk profile 142

3. rIsksBBVA. PILAR III 2017 P. 40
3.1. General risk management and Control model
As explained in section 2.3 of this Document, BBVA Group has a general risk management and control model adapted to its business model, organisational system and the geographic areas in which it operates, enabling it to carry out its activities within the framework of the risk management and control strategy and policy defined by BBVA S.A.’s governing bodies.
This Model is applied comprehensively in the Group and is made up of the basic elements set out below:
Governance and organisation
Risk Appetite Framework
Decisions and processes
Evaluation, monitoring and reporting
Infrastructure
The Group promotes the development of a risk culture that ensures the consistent application of the Risk Management and Control Model within the Group and guarantees that the risk function is understood and permeates throughout all the levels of the organisation.
3.1.1. Governance and organisation
The risk governance model in BBVA is characterised by the special involvement of its corporate bodies, both in establishing the risk strategy and in the continuous monitoring and supervising its implementation.
Thus, as explained below, it is the corporate bodies that approve the risk strategy and the corporate policies for the different types of risks. The risk function is responsible within the scope of its management for implementing and developing the risk strategy, reporting to the corporate bodies.
The responsibility for the day-to-day management of risks lies with the businesses, whose activity is carried out in accordance with the policies, rules, procedures, infrastructures and controls defined by the risk management function, based on the framework set by the corporate bodies.
To carry out this work adequately, the risk function in the BBVA Group has been set up as a single, global function that is independent of the commercial areas.
3.1.1.1. Governing bodies
The Board of Directors (hereinafter “the Board”) determines the risk strategy and supervises the internal information and control systems. Specifically, in relation to the risk strategy, the Board approves the Group’s Risk Appetite statement, the core metrics and the main metrics by type of risk, as well as the General Risk Management and Control Model.
The Board of Directors is also responsible for approving and monitoring the strategic and business plan, the annual budgets and management goals, as well as the investment and funding policy, in a consistent way and in line with the approved Risk Appetite Framework. For this purpose, the processes for defining the Risk Appetite Framework proposals and strategic and budgetary planning at Group level are coordinated by the executive area for submission to the Board.
To ensure that the Risk Appetite Framework is integrated into management, on the basis established by the Board of Directors, the Executive Committee (EC) approves the metrics by type of risk in relation to profitability and income recurrence and the Group’s basic structure of limits (core limits) at geographic area, risk type, asset type and portfolio level. This Committee also approves specific corporate policies for each type of risk.
Lastly, the Board of Directors has set up a committee specializing in risks, the Risk Committee (RC), that assists the Board and the Executive Committee in determining the Group’s risk strategy and the risk limits and policies, respectively, analyzing and assessing beforehand the proposals submitted to those bodies. In 2017, the Risk Committee held 20 meetings
The amendment of the Group’s risk strategy and of its elements is the exclusive power of the BBVA Board of Directors, while the Executive Committee is responsible for amending the metrics by type of risk within its scope of decision and the Group’s basic structure of limits, when applicable. In both cases, the amendments follow the same decision-making process described above, so the proposals for amendment are submitted by the executive area (CRO) and later analysed, first by the Risk Committee, for later submission to the Board of Directors or to the Executive Committee, as appropriate.
Moreover, the Risk Committee, the Executive Committee and the Board itself conduct proper monitoring of the risk strategy implementation and of the Group’s risk profile. The

3. rIsksBBVA. PILAR III 2017 P. 41
risks function regularly reports on the development of the Group’s Risk Appetite Framework metrics to the Board in general every quarter and to the Executive Committee every month, after their analysis by the Risk Committee, whose role in this monitoring and control work is particularly relevant.
In addition to ongoing supervision and control which performs the risk function and reports to the governing bodies, in the event of deviation from the maximum appetite levels (or maximum capacity) set for the core metrics or by type of risk, or in the event of an over-limit in the basic structure, as approved by the governing bodies, the Risk Committee is informed of the situation, following analysis by the executive areas in the relevant top-level committees. Following the Risk Committee report, the situation is reported to the governing bodies that approved the exceeded metric. In any event, the pertinent corrective measures will be reported and must be agreed by the governing bodies or, at the executive level, by the corresponding area, as appropriate.
3.1.1.2. The risk function: Committees organisation and structure
The head of the risk function at executive level, the Group Chief Risk Officer (CRO), carries out his duties with the independence, authority, rank, experience, knowledge and resources required. The CRO is appointed by the Bank’s Board of Directors, as a member of its senior management, and has direct access to its corporate bodies (the Board of Directors, the Executive Committee and the Risk Committee), to which he reports regularly on the risk situation in the Group.
To perform his functions better, the CRO is supported by a structure made up of cross-cutting risk units in the corporate area and specific risk units in the Group’s geographical and/or business areas.
Each of these units, within their scope of competence, carries out risk management and control functions and ensures the implementation of the corporate policies and rules approved at the Group level in a consistent manner, adapting them if necessary to the local requirements and reporting to the local governing bodies.
The Chief Risk Officers of these geographical and/or business areas report both to the Group Chief Risk Officer and to the head of their geographical and/or business area. This system of co-dependence aims to ensure the independence of the local risk function from the operational functions, and enables its alignment with the Group’s corporate policies and objectives with respect to risks.
As mentioned above, the risk function comprises the corporate area risk units, which carry out cross-cutting functions, and the risk units of the geographical and/or business areas.
The corporate area risk units develop and submit to the Group Chief Risk Officer (CRO) the proposal for the Group’s Risk Appetite Framework, the corporate policies, rules, procedures and global infrastructures within the framework of action approved by the corporate bodies; they ensure their correct application and report directly or through the Group CRO to the Bank’s corporate bodies. Their functions include:
• Management of the different types of risks at Group level, in accordance with the strategy defined by the corporate bodies.
• Planning of risks in line with the Risk Appetite Framework principles defined by the Group.
• Monitoring and control of the Group’s risk profile in relation to the Risk Appetite Framework approved by the Bank’s corporate bodies, providing precise and reliable information with the frequency and in the format required.
• Performance of prospective analyses that can evaluate compliance with the Risk Appetite Framework in stress scenarios and analysis of the mechanisms for mitigating the effect.
• Management of the technological and methodological developments required for implementing the Model in the Group.
• Design of the Group’s Internal Risk Control model and definition of the methodology, corporate criteria and procedures for identifying and prioritizing the risk inherent in each unit’s activities and processes.
• Validation of the models used and the results obtained by them to verify whether they are appropriate to the different uses to which they are applied.
The risk units in the geographic areas and/or business units develop and submit to the Chief Risk Officer of the geographical and/or business area the Risk Appetite Framework proposal applicable in each geographical and/or business area, independently and always within the Group’s strategy/Risk Appetite Framework.
Moreover, they ensure that the approved corporate policies and rules approved at Group level are applied consistently, adapting them where appropriate to local requirements; providing the adequate infrastructures for the management and control of their risks, within the global risk infrastructure framework defined by the corporate areas, and reporting to the corporate bodies and senior management, as applicable.
Thus the local risk units work with the corporate risk units with the aim of adapting to the risk strategy at Group level and pooling all the information necessary to monitor changes in risks.

3. rIsksBBVA. PILAR III 2017 P. 42
The risk function’s decision-making process is supported by a structure of committees. The Global Risk Management Committee (GRMC) is the top-level committee in the risk function. It proposes, analyses, and approves, where appropriate, different issues such as the internal risk regulatory framework, the procedures and infrastructures needed to identify, evaluate, measure and manage the risks faced by the Group in carrying out its businessand the determination of risk limits by portfolio or counterparty.
The members of this Committee are the Group CRO and the heads of the risk units of the corporate area and the most representative geographical and/or business areas.
The GRMC operates through various support committees, including the following:
Global Credit Risk Management Committee: Its aim is to analyse and take decisions related to wholesale credit risk admission.
Wholesale Credit Risk Management Committee: Its aim is to analyse and take decisions related to wholesale credit risk admission from certain customer segments in BBVA Group.
Work Out Committee: Its aim is to be informed of the decisions taken according to the delegation framework in reference to the risk proposals of the customers classified in groups 1 and 2 of the Watch List and the customers classified as non-performing in certain customer segments in BBVA Group. It also sanctions proposals for additions, cancellations and modifications in the Special Monitoring.
Information, Monitoring & Reporting Committee: Guarantees the existence and proper development of the aspects relating to information management, risk monitoring and reporting with a comprehensive and cross-cutting approach.
Asset Allocation Committee: An executive level for analysis and decision-making on all matters which, with respect to credit risk, are related to the processes aimed at obtaining a combination and composition of portfolios that under the restrictions imposed by the Risk Appetite framework can maximise the economic benefit subject to an adequate profitability of risk-adjusted capital.
Technology & Analytics Committee: Its aim is to guarantee correct decision-making in relation to the design, development, implementation and use of the technological tools and risk models needed for their correct management within BBVA Group.
Global Market Risk Unit Global Committee (CGGMRU): Its aim is to formalise, supervise and communicate trading risk in all the Global Markets business units, as well as coordinating and approving the decisions essential to GMRU activity, and preparing and proposing the corporate regulation of the unit.
Corporate Operational Risk Admission and Outsourcing Committee: Its purpose is to identify, evaluate and analyse the operational risks of new businesses, new products and services and outsourcing initiatives.
Retail Risk Committee: Its aim is to guarantee that the practices and processes governing the retail credit risk cycle are aligned with the approved/target risk tolerance levels and the business growth and development as defined in the Group’s corporate strategy.
AM Global Risk Steering Committee: Its aim is to develop and coordinate the necessary strategies, policies, procedures and infrastructures to identify, assess, measure and manage the material risks facing the institution in developing its business linked to BBVA Asset Management.
Global Insurance Risk Committee: Its aim is to guarantee alignment and communication between all BBVA Group’s Insurance Risk Units, for which it will apply the standardised principles, policies, tools and metrics in the different geographic areas, with the aim of maintaining the correct integration of risk management in the Group’s insurance activities.
Operations Committee (COPOR): Its aim is to analyse and make decisions with respect to the operations of the different geographic areas in which Global Markets is present.
Each geographical and/or business area has its own risk management committee (or committees), with objectives and content similar to those of the corporate area, which develop their functions consistently and in line with the corporate risk policies and regulations.
Under this organisational scheme, the risks function ensures the integration and application throughout the Group of the risk strategy, the regulatory framework, the infrastructures and standardised risk and controls. It also benefits from the knowledge and proximity to customers in each geographical and/or business area, and conveys the corporate risk culture to the Group’s different levels. Moreover, this organisation enables the risks function to conduct and report to the corporate bodies the integrated monitoring and control of the entire Group’s risks.

3. rIsksBBVA. PILAR III 2017 P. 43
3.1.1.3. Internal Risk Control and Internal Validation
The Group has a specific Internal Risk Control unit. Its main function is to ensure there is a sufficient internal regulatory framework, a process and measures defined for each type of risk identified in the Group (and for those other types of risk for which the Group may be potentially affected). It controls their application and operation, as well as ensuring the integration of the risk strategy into the Group’s management.
The Internal Risk Control unit verifies the performance of their duties by the units that develop the risk models, manage processes and execute controls. Its scope of action is global both from the geographical point of view and as regards the types of risks.
The Group’s Head of Internal Risk Control is responsible for the function and reports on its activities and informs of its work plans to the Group CRO and the Board’s Risk Committee, assisting it on any matters where requested. For this purpose, Internal Risk Control department includes a Technical Secretary’s Office to provide the necessary technical support for the Committee to better perform its duties.
At hierarchical level, it is independent of the units that manage the processes and implement the controls. It is made up of a team with expertise in the processes of managing the different types of risks, and is divided into two levels: corporate, which gives it a global and standardised vision of the control model; and local, in the business and/or geographic areas, which incorporates the knowledge it gains from proximity to the processes and risk activities carried out within its scope. This two-level structure gives it global and cross-cutting responsibility with respect to all the units making up the corporate risk area, and all the risk types managed in the units.
In addition, the Group has an Internal Validation unit, which reviews the performance of its duties by the units that develop the risk models and of those that use them in management. Its functions include review and independent validation at internal level of the models used for the control and management of risks in the Group.
3.1.2. Risk Appetite Framework
The Group’s Risk Appetite Framework is approved by the Board of Directors and determines the risks and their level that the Group is prepared to assume to achieve its business objectives, considering an organic evolution of its business. These are expressed in terms of solvency, liquidity and funding, profitability, and income recurrence or other metrics, which are reviewed periodically as well as in case of material changes in the entity’s business or relevant corporate transactions. The determination of the Risk Appetite
Framework has the following objectives:
Make explicit the maximum levels of risk that the Group is prepared to assume, both at Group level and at geographical and/or business level.
Establish guidelines for action and a management framework for the medium-long term that prevents actions (both at Group and geographical and/or business level) that may compromise the Group’s future viability.
Establish a framework for relating with the geographical and/or business areas that preserves their decision-making autonomy while ensuring their consistent performance and preventing divergent behavior.
Establish a common language across the whole organisation and develop a risk culture geared toward compliance with it.
Alignment with the new regulatory requirements, making communication with regulators, investors and other stakeholders easier, thanks to an integrated and stable risk management framework.
The Risk Appetite Framework is expressed through the following elements:
Risk Appetite Statement: includes the general principles of the Group’s risk strategy and the target risk profile. The Group’s Risk Appetite Statement in 2017 is:
BBVA Group’s risk policy is designed to achieve a moderate risk profile for the Bank through: prudent management and a responsible universal banking business model targeted to value creation, risk adjusted return and recurrence of results; diversified by geograpy, asset class, portfolio and clients; with presence in emerging and developed countries, maintaining a medium/low risk profile in every country and focusing on a long-term relationship with the client.
Core metrics: Based on the Risk Appetite Statement, statements are issued that specify the general principles of risk management in terms of solvency, liquidity, funding, profitability and recurring revenue.
• Solvency: a sound capital position, maintaining resilient capital buffer from regulatory and internal requirements that supports the regular development of banking activity even under stress situations. As a result, BBVA proactively manages its capital position, which is tested under different stress scenarios from a regular basis.
• Liquidity and funding: a sound balance-sheet structure to sustain the business model. Maintenance of an adequate volume of stable resources, a diversified wholesale funding structure, which limits the weight of short-term funding and ensures access to the different

3. rIsksBBVA. PILAR III 2017 P. 44
funding markets, optimizing costs and preserving a cushion of liquid assets to overcome a liquidity survival period under stress scenarios.
• Profitability and income recurrence: a sound margin-generation capacity based on the diversification of assets, a stable funding and a customer focus; combined with a moderate risk profile that limits credit losses even under stress situations; all focused on allowing income stability and maximizing the risk-adjusted profitability.
Moreover, the core metrics reflect, in quantitative terms, the principles and the target risk profile set out in the Risk Appetite statement and are aligned with the Group’s strategy. Each core metric has three thresholds (the “traffic-light” approach), ranging from usual management of the businesses to higher levels of deterioration: Management reference, maximum appetite and maximum capacity. BBVA Group’s core metrics in 2017 are those specified in the following chart:
Chart 4: BBVA Group’s Core Metrics
Metric
SolvencyEconomic Solvency
Regulatory Solvency: CET1 Fully Loaded
Liquidity and FundingLoan to Stable Costumer Deposits (LTSCD)
Liquidity Coverage Ratio (LCR)
Income recurrence and profitability
Net Margin / Average Total Assets
Cost of Risk
Return on Equity (ROE)
Metrics by type of risk: based on the core metrics for each type of risk, statements are established that set out the general principles of risk management and a number of metrics are calibrated, whose observance enables compliance with the core metrics and the Group’s Risk Appetite statement. Metrics by type of risk have a maximum risk appetite threshold.
The basic structure of limits (Core limits): they shape the Risk Appetite Framework at geographic area, risk type, asset type and portfolio level, ensuring that management is within the metrics by type of risk.
In addition to this Framework, there is a level of management limits that is defined and managed by the risks function when developing the basic structure of limits, with the aim of ensuring that proactive management of risks by risk subcategory within each type or by sub-portfolio respects that basic structure of limits, and in general with the established Risk Appetite Framework.
The basic scheme of BBVA’s Risk Appetite Framework is outlined in the following chart:
Chart 5: Scheme of BBVA Group Risk Appetite Framework
Statement
CORE METRICS
BY TYPE OF RISK
CORE LIMITS
MANAGEMENTLIMITS
Sta
tem
ent
Sta
tem
ent
RIS
K A
PP
ET
ITE
FR
AM
EW
OR
KThe corporate risks area works together with the various geographical and/or business areas to define their Risk Appetite Framework, so that it is coordinated with, and integrated into the Group’s Risk Appetite Framework, making sure that its profile is in line with the one defined.
The Risk Appetite Framework expresses the levels and types of risk that the Bank is willing to assume to be able to implement its strategic plan with no relevant deviations, even in situations of stress. The Risk Appetite Framework is integrated within management, and the processes for defining the Risk Appetite Framework proposals is coordinated with the strategic and budgetary planning at Group level.
The core metrics of the BBVA Risk Appetite Framework measure the Group’s performance in terms of solvency, liquidity, funding and profitability, and income recurrence. Most of the core metrics are accounting and/or regulatory metrics, and are therefore regularly disclosed to the market in the BBVA Group’s annual and quarterly financial reporting.
During 2017, Risk Appetite metrics trended consistently with the profile established according to the operating limits set or marked by the different areas in the organisation.
3.1.3. Decisions and processes
The transfer of the Risk Appetite Framework to ordinary management is underpinned by three basic aspects:
A standardized set of regulations
Risk planning
A comprehensive management of risks throughout their life cycle

3. rIsksBBVA. PILAR III 2017 P. 45
3.1.3.1. A uniform body of regulations
The corporate risks area is responsible for defining and proposing corporate policies, specific regulations, procedures and schemes for delegation, by which the risk decisions have to be adopted within the Group.
This process aims for the following objectives:
Hierarchy and structure: well-structured information through a clear and simple hierarchy that clearly relates documents that depend on each other.
Simplicity: an appropriate and sufficient number of documents.
Standardisation: a standardised document name and content.
Accessibility: easy search and access to documentation through the Corporate Risk Management Library.
The approval of corporate policies for all kinds of risks corresponds to the Bank’s corporate bodies, while the corporate risk area approves the rest of the regulations.
The risk units of the geographical and/or business areas comply with this body of regulations and, where necessary, adapt it to local requirements, in order to have a decision-making process that is appropriate to the local level and in line with the Group’s policies.
If such adaptation is necessary, the local risks area must inform the corporate GRM area, which has to ensure consistency in the body of regulations at Group level. Where appropriate, it must thus give its prior approval to the modifications proposed by the local risk areas.
3.1.3.2. Risk planning
Risk planning ensures integration in the Risk Appetite Framework through a cascade process of establishing limits and return adjusted to the target risk, where the function of the corporate area and of the geographical and/or business area risk units is to guarantee that this process is aligned with the Group’s Risk Appetite Framework in terms of solvency, profitability, liquidity and funding, profitability and income recurrence.
This process is equipped with tools for aligning and monitoring the Risk Appetite Framework defined at the aggregated level by business areas, legal entities, risk types, concentrations and any other level considered necessary.
The process of risk planning is aligned and taken into consideration within the rest of the Group’s planning framework to ensure consistency.
3.1.3.3. Integrated management
All risks must be managed in an integrated fashion during their life cycle, based on differentiated treatment according to their type.
The risk management cycle is made up of 5 elements:
Planning: with the aim of ensuring that the Group’s activities are consistent with the target risk profile and guaranteeing solvency in the development of the strategy.
Assessment: a process focused on identifying all the risks inherent to the activities carried out by the Group.
Formalisation: includes the risk origination, approval and formalisation stages.
Monitoring and reporting: continuous and structured monitoring of risks and preparation of reports for internal and/or external (market, investors, etc.) consumption.
Active portfolio management: focused on identifying business opportunities, in both existing portfolios and in new markets, businesses or products.
3.1.4. Evaluation, monitoring and reporting
Evaluation, monitoring and reporting is a cross-cutting element that ensures the Model has a dynamic and anticipatory vision, making possible compliance with the Risk Appetite Framework approved by the corporate bodies, even under unfavorable scenarios. This process is carried out with the following aims:
Evaluate compliance of the Risk Appetite Framework at the present time, through monitoring of the fundamental metrics, metrics by risk type and the basic limits structure.
Evaluate compliance of the Risk Appetite Framework in the future through projection of the Risk Appetite variables, both in a baseline scenario determined by the budget, and in a specific risk scenario determined by stress tests.
Identify and value the risk factors and scenarios that may compromise compliance of the Risk Appetite Framework through the development of a repository of risks and an analysis of their impact.
Act to mitigate the impact on the Group of the risk factors and scenarios identified, ensuring the risk remains within the target risk profile.
Supervise the key variables that do not form a direct part of Risk Appetite Framework, but that condition its compliance. These may be both external and internal.

3. rIsksBBVA. PILAR III 2017 P. 46
To carry out this process, which is integrated into the activity of the corporate and geographical and/or business risk units, the following phases must be developed:
Identification of the risk factors, which has the aim of generating a map with the most relevant risk factors that could compromise the Group’s performance with respect to the thresholds defined in the Risk Appetite Framework.
Evaluation of the impact: Consists of evaluating what impact the materialisation of one or more risk factors identified in the previous phase could have on the Risk Appetite Framework metrics, if a given scenario occurs.
Response to undesirable situations and proposed measures for adjusting the situation: The overruns of the thresholds will be associated with an analysis of the measures for adjustments at the corresponding level that allow a dynamic management of the situation, even before it takes place.
Monitoring: Aims to avoid ex ante losses through supervision of the Group’s current risk profile and the risk factors identified.
Reporting: Aims to give information on the risk profile assumed, offering precise, complete and reliable data to the corporate bodies and senior management with the frequency and detail required by the nature, importance and complexity of the risks.
3.1.5. Infrastructure
Infrastructure constitutes the element that must ensure that the Group has the human and technological resources required for effective management and supervision of risks, performance of the functions included in the Group’s risk model, and achievement of its objectives.
With respect to human resources, the Group’s risk function has an adequate workforce in terms of number, skills, knowledge and experience.
With respect to technology, the Group’s risk function ensures the integrity of the management information systems and the provision of the infrastructure required to support risk management, including the tools appropriate to the needs derived from the different types of risks in their admission, management, valuation and monitoring.
The principles according to which the Group’s risk technology is governed are:
Uniformity: the criteria are consistent across the whole Group, ensuring the same risk treatment at each geographical and/or business level.
Integration in the management: the tools incorporate the corporate risk policies and are applied in the Group’s day-to-day management.
Automation of the main processes making up the risk management cycle.
Appropriateness: adequate supply of information at the appropriate time.
Through the Risk Analytics function, the Group has a corporate framework that develops measurement techniques and models, covering all the types of risk and the different purposes, and involving a uniform language for all the activities and geographical/business areas.
The execution is decentralised, allowing the Group’s global scope to be used to the full. The idea is to develop the existing risk models continuously and generate others that cover the new range of businesses that are being deployed, with the aim of strengthening anticipation and proactiveness that characterise the risk function in the Group.
Equally, the risk units of the geographical and/or business areas must ensure they have sufficient means from the point of view of resources, structures and tools to develop risk management in accordance with the corporate model.
3.1.6. Risk culture
The Group promotes the development of a risk culture that ensures the consistent application of the risk management and control model within the Group and guarantees that the risk function is understood and permeates all the levels of the organisation.
The culture transfers to all the levels of the organisation the implications involved in the Group’s activities and businesses from the perspective of risk. The risk culture is organised through a number of levers, including the following:
Communication: Promotes the spread of the Model, and particularly the principles that should govern risk management in the Group consistently and comprehensively across the organisation, through the most appropriate channels.
GRM has a variety of channels for communication that facilitate the transfer of information and knowledge between the different teams in the function and the Group, adapting the frequency, formats and recipients according to the objective, making it easier to establish the basic principles of the risk function. Thus the culture of risks and the prudent management model begin with the corporate bodies and the Group’s management and are transmitted across the whole organisation.

3. rIsksBBVA. PILAR III 2017 P. 47
Training: its main aim is to disseminate and establish the model of prudent risk management across the organisation, ensuring standards in the skills and knowledge of the different persons involved in the risk management processes.
Well defined and implemented training ensures continuous improvement of the skills and knowledge of the Group’s professionals, and in particular of the GRM area, and is based on four aspects that aim to develop each of the needs of the GRM group by increasing its knowledge and
skills in different fields such as: finance and risks, tools and technology, management and expertise, and languages.
Motivation: An area where the aim is for the incentives of the teams in the risk function to support the risk management strategy, values and culture of the function at all levels. It includes remuneration and all the other elements associated with motivation, such as the working environment, etc. that contribute to achieving the Model’s objectives.
3.2. Credit and counterparty risk
3.2.1. Scope and nature of the Credit Risk measurement and reporting systems for capital framework purposes
Credit risk arises from the probability that one party to a financial instrument will fail to meet its contractual obligations for reasons of insolvency or inability to pay and cause a financial loss for the other party.
It is the most important risk for the Group and includes counterparty risk, issuer risk, settlement risk and country risk management.
BBVA Group has a risk strategy determined by the Board of Directors of the parent company, which establishes the Group’s Risk Appetite statement and the core and main metrics by type of risk in which it is materialised, as well as the General Risk Management and Control Model.
On the basis of what is approved by the Board of Directors, BBVA’s Executive Committee establishes the Corporate Policies and specific limits for each type of risk, to enable the Group to take up a position within the parameters established by the Board.
The Risk Committee assists the Board of Directors to determine the Group’s risk policy and the Executive Committee to determine the limits and risk policy strategy, analyzing and assessing in advance the proposals submitted to these governing bodies.
The Risk Committee, Executive Committee and the Board itself conduct proper monitoring of the risk strategy implementation and of the Group’s risk profile.
Based on the risk strategy determined by the Board of Directors, and following the report of the Risk Committee, the Executive Committee values and, where appropriate,
approves as part of the basic limits structure, the proposed Asset Allocation core limit with the determined level of disaggregation. The limits are established annually, at maximum levels of exposure by type of portfolio.
The asset allocation limits to portfolios, businesses and risks will be defined taking into account the established metrics in terms of exposure and composition of portfolios, and must be geared to maximizing the Group’s added generation of recurring economic earnings, subject to a framework of restrictions resulting from the definition of the target risk profile.
The Corporate Risk Area will establish risk concentration thresholds: individual, per portfolio and sector. Individual concentration will be limited to its impact on solvency (CET1). The portfolio and sector concentration will be in terms of EAD, under the cuts by retail portfolio/wholesale sector. Herfindahl indices are used for the individual portfolio concentration index, taking the 1,000 first counterparties in terms of EAD, as well as the sum of the exposure of the 20 biggest counterparties in relation to the solvency impact.
The Business Areas must work in line with the global vision and defined metrics, optimizing each of the portfolios for which they are responsible in terms of risk/return, within the Group’s limits and policies.
The existing gaps with respect to the target portfolio must be identified at global level and transmitted to the Business Areas, establishing plans at global and local level to adapt the risk to the predefined target profile and taking into account the future expected performance of the portfolios.
For managing risks and capital, BBVA quantifies its credit risk using two main metrics: expected loss (“EL”) and economic capital (“EC”). Expected loss reflects the average value of losses and is considered a business cost; Economic capital

3. rIsksBBVA. PILAR III 2017 P. 48
is the amount of capital considered necessary to cover unexpected losses if actual losses are greater than expected losses.
These risk metrics are combined with information on profitability in value-based management, thus building the profitability-risk binomial into decision-making, from the definition of business strategy to approval of individual loans, price setting, assessment of non-performing portfolios, incentives to areas in the Group, etc.
There are three essential parameters in the process of calculating the EL and EC measurements: the probability of default (“PD”), loss given default (“LGD”) and exposure at default (“EAD”), mainly based on the estimate of credit conversion factors (“CCF”). They are generally estimated using the available historical information and are assigned to operations and customers according to their particular characteristics.
In this context, the credit rating tools (ratings and scorings) assess the risk in each customer/transaction according to their credit quality by assigning them a score, which is used to assign risk metrics together with other additional information: transaction seasoning, loan to value ratio, customer segment, etc.
Section 3.2.5.1 of this Document details the definitions, methods and data used by the Group to determine the capital requirements for estimating and validating the parameters of probability of default (PD), loss given default (LGD) and exposure at default (EAD).
3.2.2. Definitions and accounting methodologies
3.2.2.1. Definitions of non-performing assets and impaired positions
A financial asset is considered impaired for accounting purposes when there is objective evidence that events have occurred which have a negative impact on the future cash flows that were estimated at the time the transaction was arranged.
Objective evidence of impairment of a financial asset or group of financial assets includes observable data about the following aspects:
Significant financial difficulties on the part of the obligor.
Continued delays in payment of interest or principal.
Refinancing or restructuring of debt caused by the financial difficulties of the counterparty.
Bankruptcy and other types of reorganisation/winding-up is considered likely.
Disappearance of a financial asset from an active market due to financial difficulties.
Observable data that indicate a reduction in future flows from initial recognition such as adverse changes in the status of counterparty payments (payment delays, drawing credit on cards up to the limit, etc.).
Domestic or local economic conditions are correlated with default in financial assets (increase in the unemployment rate, fall in property prices, etc.).
The classification of financial assets impaired for reasons of customer default is done in an objective way and on an individual basis according to the following criterion:
The total amount of debt instruments, irrespective of the holder and the guarantee involved, with an amount past due for more than ninety days for principal, interest or contractually agreed expenses, unless they should be classified directly as write-offs.
Contingent liabilities in which the guaranteed party has incurred default.
Debt instruments classified as impaired through the accumulation of balances in default for an amount exceeding 20% of the overall amounts pending collection will also be included.
Financial assets impaired for reasons other than customer default, which are those for which there is a reasonable doubt about their total reimbursement under the terms and conditions agreed by contract, are classified individually for all risks whose individual amount is significant.
Write-off risks are those debt instruments whose recovery is deemed remote and should be derecognised as assets.
3.2.2.2. Methods for determining value adjustments for impairment of assets and provisions
The impairment on financial assets is calculated by type of instrument and other circumstances that may affect them, taking into account the guarantees received by the holders of the instruments to assure (fully or partially) the performance of the transactions. BBVA Group recognises impairment charges directly against the impaired asset when the likelihood of recovery is deemed remote, and uses an offsetting or allowance account when it records provisions made to cover estimated losses on their full value.

3. rIsksBBVA. PILAR III 2017 P. 49
The amount of the deterioration of debt instruments valued at their amortised cost is determined differently according to whether the impairment losses are calculated individually or collectively. First, it is determined whether there is objective evidence of individual impairment of individually significant assets, and as a group for financial assets that are not individually significant. If there is no objective evidence of deterioration in a financial asset evaluated individually, the asset will be included in a group of financial assets with similar credit risk characteristics and its deterioration will be evaluated as a group.
3.2.2.2.1. Impairment losses determined individually
The amount of impairment losses recorded by these instruments coincides with the positive difference between their respective book values and the present values of future cash flows. These cash flows are discounted using the original effective interest rate. If a financial instrument has a variable interest rate, the discount rate for measuring any impairment loss is the current effective rate determined under the contract.
As an exception to the rule described above, the market value of quoted debt instruments is deemed to be a fair estimate of the present value of their future cash flows.
The estimation of future cash flows for debt instruments considers the following:
All sums expected to be recovered during the remaining life of the instrument, including those that may arise from collateral and credit enhancements, if any (once deduction has been made of the costs required for their foreclosure and subsequent sale). Impairment losses include an estimate for the possibility of collecting accrued, past-due and uncollected interest.
The various types of risk to which each instrument is subject.
The circumstances under which the collections will foreseeably take place
3.2.2.2.2. Impairment losses determined collectively
For group analysis of impairment, the financial assets are grouped by similar risk characteristics indicating the debtor’s ability to make its payments under the contractual terms. Based on this analysis the impairment of loans not individually significant are estimated, distinguishing between those that present objective evidence of impairment from those that do not present objective evidence of impairment, as well as the impairment of significant loans for which the Group has determined that there is no objective evidence of impairment.
1: The PD and LGD is calculated for accounting purposes using a Point-in-time (“PIT”) approach
With respect to financial assets that do not show any objective evidence of impairment, the Group applies statistical procedures using its historical experience and other specific information to estimate incurred losses incurred by the Group resulting from events that have occurred as of the date of preparation of the consolidated financial statements, but that are not known and are only identified individually after the presentation of the statements. This calculation is a temporary step until the losses are identified specifically at individual level, when these financial instruments will be separated from the group of financial assets without objective evidence of impairment.
Quantification of losses incurred takes into account three basic factors: exposure at default, probability of default and loss given default.
Exposure at default (EAD) is the amount of risk exposure at the date of default by the counterparty.
Probability of default (PD1) is the probability of the counterparty failing to meet its principal and/or interest payment obligations. This probability reflects the current conditions of the portfolio at each date of preparation of the financial statements and is estimated taking into account the main characteristics of the credit quality of the counterparty/transaction.
Loss given default (LGD1) is the estimate of the loss arising in the event of default. It depends mainly on the characteristics of the transaction and the valuation of the related guarantees or collateral.
The calculation of LGD at each date of the balance sheet estimates the current value of the cash flows expected to be obtained during the remaining life of the financial asset. The recoverable amount of effective collateral will be estimated based on the valuation of the property, discounting the adjustments needed to capture adequately the uncertainty the potential fall in value up to the time of foreclosure and sale, plus foreclosure costs, maintenance costs and sale costs.
3.2.2.2.3. Methods used to determine provisions for contingent risks and commitments
Non-performing contingent exposures and commitments, except for letters of credit and other guarantees, are to be provisioned for an amount equal to the estimation of the sums expected to be disbursed that are deemed to be non-recoverable, applying criteria of valuation prudence. When calculating the provisions, criteria similar to those established for non-performing assets for reasons other than customer default are applied.

3. rIsksBBVA. PILAR III 2017 P. 50
In any event, letters of credit and other guarantees provided which are classified as non-performing will be covered by applying similar criteria to those set out in the preceding section on value adjustments for asset impairment.
Likewise, the inherent loss associated with letters of credit and other guarantees provided that are in force and not impaired is covered by applying similar criteria to those set out in the preceding section on impairment losses determined collectively.
3.2.2.3. The Group’s own definition of restructured exposures
As set out in the Group’s Consolidated Annual Report, a restructured transaction is understood to be one that for economic or legal reasons related to the holder’s (or holders’) current or foreseeable financial difficulties, the financial conditions are modified to facilitate payment of the debt (principal and interest) because the holder cannot, or is considered will not be able to, comply with these conditions on time and in full, even when such modification is included in the contract.
In any event, restructured transactions are considered to be those where a haircut is applied or assets are received to reduce the debt, or whose conditions are modified to extend its maturity, change the repayment schedule to reduce the amount of payments in the short term or their frequency, or establish or extend the initial grace period of the principal, interest or both; except where it can be proved that the conditions are modified for reasons other than the financial difficulties of the holder and are similar to those applied in the market at the time of modification to transactions granted to customers with a similar risk profile.
In March 2017 the ECB published guidance for dealing with non-performing loans. Section 4 of this guidance is for restructured operations and contains details of the public information to be disclosed in this respect.
3.2.2.4. Standards in interpretations issued but not yet effective as of December 31, 2017. IFRS 9 - Instruments
As specified in Note 2.3 of the Group’s Report, on July 24, 2014 the International Accounting Standards Board (IASB) issued IFRS 9, which for the annual periods starting January 1, 2018 replaces IAS 39 and includes requirements for the classification and valuation of the financial assets and liabilities, the deterioration of financial assets and hedge accounting.
The Group has assessed the estimated impact on its consolidated financial statements of the initial application of IFRS 9. The estimated impact of adopting this standard
on the Group’s capital as of January 1, 2018 is based on the assessments made to date. The real impacts of adopting the standards as of January 1, 2018 may change because:
The Group has not concluded the tests or the evaluation of the controls of its new IT systems; and
The new accounting policies and methodologies may be subject to modifications until the Group presents its financial statements that include the final impact as of the date of initial application.
As of the date when the consolidated Annual Report was drafted, the average estimated impact on the fully loaded CET1 ratio would be a reduction of approximately 31 basis points and the estimated impact on the volume of provisions would be an increase of approximately 10% on the current level of provisions.
However, the European Parliament and Commission have established a transitional mechanism for applying IFRS 9 on capital ratios, which is voluntary for institutions. The Group intends to apply this provision.
3.2.3. Information on credit risks
3.2.3.1. Credit risk exposure
Pursuant to article 5 of the CRR, with respect to the bank capital requirements for credit risk, exposure is understood to be any asset item and all items included in the Group’s memorandum accounts involving credit risk and not deducted from the Group’s bank capital. Accordingly, mainly customer lending items are included, with their corresponding undrawn balances, letters of credit and guarantees, debt securities and capital instruments, cash and deposits in central banks and credit institutions, assets purchased or sold under a repurchase agreement (asset and liability repos), financial derivatives (nominal) and fixed assets.
The credit risk exposure specified in the following sections of this Document is broken down into the standardised credit risk approach (section 3.2.4), advanced credit risk approach (section 3.2.5) and counterparty risk (section 3.2.6) and securitisation credit risk (section 3.2.7).
In addition to the exposure to risk at the time of default and the risk-weighted assets, the table below shows the original exposure, the exposure net of provisions and the exposure applying the conversion factors under the standardised and advanced measurement approaches as of December 31, 2017 and December 31, 2016 (including counterparty risk):

3. rIsksBBVA. PILAR III 2017 P. 51
Table 10. Credit Risk exposure (Million Euros. 12-31-17)
Exposure Class
Original Exposure
(1)
Provisions
(2)
Net exposure of
provisions (3)
On-balance exposure after
credit risk mitigation
techniques (4a)
Off-balance exposure
after credit risk mitigation techniques (4b)
Exposure in the
adjusted value (5) EAD (6) RWA's (7)
RWA density
(8=(7)/(6))"
Central governments or central banks 122,404 (48) 122,356 135,156 15,397 150,553 135,914 29,759 22%Regional governments or local authorities
10,140 (8) 10,133 5,978 821 6,799 6,516 1,252 19%
Public sector entities 1,556 (4) 1,552 1,635 854 2,490 1,701 654 38%Multilateral development banks 93 (1) 93 191 21 212 191 14 7%International organisations 1 - 1 1 1 1 - 0%Institutions 22,176 (17) 22,159 14,875 3,088 17,963 16,289 5,793 36%Corporates 132,075 (1,613) 130,461 77,564 42,493 120,057 93,319 91,600 98%Retail 92,773 (1,246) 91,527 53,441 33,393 86,834 55,645 39,177 70%Secured by mortgages on immovable property
49,883 (339) 49,545 48,416 511 48,927 48,740 19,609 40%
Exposures in default 9,753 (4,645) 5,108 4,384 536 4,920 4,684 5,248 112%Exposures associated with particularly high risk
2,557 (68) 2,489 2,463 1 2,464 2,463 3,694 150%
Covered bonds - - - - - - - - 0%Claims on institutions and corporates with a short-term credit assesment
25 - 25 25 - 25 25 5 20%
Collective investments undertakings 34 () 34 9 26 34 24 24 100%Other exposures 21,200 (34) 21,166 27,897 2,574 30,471 29,274 11,725 40%Securitisation exposures 4,314 - 4,314 4,314 - 4,314 4,314 924 21%TOTAL STANDARDISED APPROACH 468,985 (8,023) 460,963 376,350 99,714 476,064 399,100 209,478 52%Central governments or central banks 6,817 (4) - 7,801 660 8,461 8,131 1,172 14%Institutions 97,127 (71) - 72,271 5,446 77,717 75,314 5,931 8%Corporates 134,011 (3,447) - 73,875 58,182 132,057 103,323 56,643 55%
Corporates (SMEs) 18,015 (1,821) - 14,089 3,555 17,644 15,651 10,056 64%
Corporates: Specialised lending 9,325 (109) - 8,370 955 9,325 9,111 8,077 89%
Corporates: Others 106,670 (1,518) - 51,416 53,672 105,088 78,561 38,510 49%
Retail 117,747 (2,339) - 97,721 19,922 117,643 101,576 19,662 19%
Of which: garantizados con bienes inmuebles
84,366 (1,192) - 79,848 4,497 84,345 80,073 8,268 10%
Of which: Secured by mortgages on immovable property
20,625 (527) - 6,023 14,603 20,625 9,154 6,764 74%
Of which: Others 12,756 (620) - 11,851 823 12,674 12,350 4,629 37%
Retail: Other SMEs 3,857 (198) - 2,975 805 3,780 3,464 1,612 47%
Retail: Other Non-SMEs 8,899 (421) - 8,876 18 8,894 8,885 3,017 34%
Securitisation exposures 757 - - 757 - 757 757 827 109%TOTAL IRB APPROACH 356,459 (5,861) - 252,425 84,211 336,636 289,101 84,235 29%TOTAL CREDIT RISK DILUTION AND DELIVERY 825,445 (13,884) 460,963 628,775 183,925 812,700 688,201 293,713 43%
Equity 7,798 (1,244) - 7,798 - 7,798 7,798 16,775 215%
Simple Approach 3,881 (90) - 3,881 - 3,881 3,881 9,562 246%
Not listed instruments in sufficiently diversified portfolios
3,705 (88) - 3,705 - 3,705 3,705 8,989 243%
Listed in exchange-traded markets 176 (2) - 176 - 176 176 573 327%
PD/LGD Approach 3,390 (1,123) - 3,390 - 3,390 3,390 4,953 146%
Intern Models 527 (31) - 527 - 527 527 2,261 429%
TOTAL CREDIT RISK 833,242 (15,128) 460,963 636,573 183,925 820,498 695,999 310,487 45%(1) Gross exposure of provisions before credit risk mitigation techniques, excluding contributions to the default of a CCP(2) Includes provisions and adjustments due to impairment of financial assets and contingent risks and commitments(3) Exposures are only adjusted by provisions in those cases that are calculated by Standardised approach(4a)(4b) Eligible credit mitigation techniques are included, either on-balance or off-balance, according to Chapter 4 of CRR(5) It corresponds to the exposure in the adjusted value by eligible credit mitigation techniques(6) Exposure to credit risk at default, calculated as (4a)+((4b)*CCF)

3. rIsksBBVA. PILAR III 2017 P. 52
Credit Risk exposure (Million Euros. 12-31-16)
Exposure Class
Original Exposure
(1)
Provisions
(2)
Net exposure of
provisions (3)
On-balance exposure after
credit risk mitigation
techniques (4a)
Off-balance exposure
after credit risk mitigation techniques (4b)
Exposure in the
adjusted value (5) EAD (6) RWA's (7)
RWA density
(8=(7)/(6))"
Central governments or central banks 112,153 (35) 112,118 132,356 5,853 138,209 133,925 30,106 22%Regional governments or local authorities
5,290 (4) 5,286 4,804 433 5,237 5,074 989 19%
Public sector entities 5,474 (31) 5,443 2,951 368 3,319 3,097 941 30%Multilateral development banks 59 59 59 - 59 59 33 56%International organisations 6 - 6 6 - 6 5 - 0%Institutions 34,785 (48) 34,737 17,397 10,189 27,586 19,136 6,370 33%Corporates 143,236 (2,873) 140,363 87,084 39,146 126,230 106,126 103,761 98%Retail 80,221 (654) 79,567 55,313 21,123 76,436 58,042 40,821 70%Secured by mortgages on immovable property
55,296 (310) 54,986 54,028 47 54,075 54,048 21,276 39%
Exposures in default 10,112 (4,906) 5,206 4,791 265 5,056 4,991 5,807 116%Items associated with particularly high risk
1,678 (142) 1,536 1,458 17 1,475 1,462 2,193 150%
Covered bonds - - - - - - - - 0%Claims on institutions and corporates with a short-term credit assesment
406 - 406 406 - 406 406 87 21%
Collective investments undertakings 444 (2) 442 16 347 363 140 140 100%Other exposures 26,124 (124) 26,000 39,591 4,071 43,662 41,609 15,463 37%Securitisation exposures 5,183 - 5,183 5,183 - 5,183 5,183 1,144 22%TOTAL STANDARDISED APPROACH 480,467 (9,129) 471,338 405,443 81,859 487,302 433,303 229,131 53%Central governments or central banks 5,580 (78) - 6,115 1,008 7,123 6,606 552 8%Institutions 96,639 (61) - 71,733 4,109 75,842 74,199 6,114 8%Corporates 141,295 (5,279) - 79,020 60,111 139,132 109,708 60,983 56%
Corporates (SMEs) 20,956 (2,745) 17,004 3,295 20,299 18,420 12,061 65%
Corporates: Specialised lending 11,186 (166) 9,733 1,453 11,186 10,677 9,710 91%
Corporates: Others 109,153 (2,368) 52,283 55,363 107,647 80,611 39,212 49%
Retail 119,533 (2,577) - 99,243 20,259 119,503 103,291 22,092 21%
Of which: garantizados con bienes inmuebles
88,849 (1,595) - 83,636 5,187 88,823 83,894 10,690 13%
Of which: Secured by mortgages on immovable property
20,322 (512) - 5,931 14,390 20,322 9,302 7,376 79%
Of which: Others 10,362 (470) - 9,676 682 10,358 10,095 4,026 40%
Retail: Other SMEs 3,303 (137) 2,624 676 3,300 3,040 1,503 49%
Retail: Other Non-SMEs 7,059 (333) 7,052 6 7,058 7,055 2,523 36%
Securitisation exposures 858 - - 858 - 858 858 332 39%TOTAL IRB 363,905 (7,995) - 256,969 85,487 342,458 294,662 90,073 31%TOTAL CREDIT DILUTION AND DELIVERY RISK 844,372 (17,124) 471,338 662,412 167,346 829,760 727,965 319,204 44%
Equity 8,214 (121) - 8,214 - 8,214 8,214 16,639 203%
Simple Approach 4,429 (39) - 4,429 - 4,429 4,429 10,782 243%
Not listed instruments in sufficiently diversified portfolios
4,183 (36) - 4,183 - 4,183 4,183 9,990 239%
Listed in exchange-traded markets 246 (3) - 246 - 246 246 792 322%
PD/LGD Approach 3,592 (47) - 3,592 - 3,592 3,592 4,896 136%
Intern Models 193 (35) - 193 - 193 193 961 498%
TOTAL CREDIT RISK 852,586 (17,245) 471,338 670,626 167,346 837,974 736,179 335,843 46%(1) Gross exposure of provisions before credit risk mitigation techniques, excluding contributions to the default of a CCP(2) Includes provisions and adjustments due to impairment of financial assets and contingent risks and commitments(3) Exposures are only adjusted by provisions in those cases that are calculated by Standardised approach(4a)(4b) Eligible credit mitigation techniques are included, either on-balance or off-balance, according to Chapter 4 of CRR(5) It corresponds to the exposure in the adjusted value by eligible credit mitigation techniques(6) Exposure to credit risk at default, calculated as (4a)+((4b)*CCF)

3. rIsksBBVA. PILAR III 2017 P. 53
3.2.3.2. Average value of the exposures in 2017 and 2016.
The table below shows the average value of exposure to credit risk in 2017 and 2016, for both the advanced measurement
and standardised approaches for each one of the exposure categories:
Table 11. EU CRB-B – Total and average net amount of exposures (includes counterparty credit risk) (Million Euros)
12-31-17 12-31-17Net value of exposures at the
end of the period (4Q) (1)Average net exposures over the
periodCentral governments or central banks 6,813 5,591Institutions 97,056 88,605Corporates 130,564 131,251
Of which: Specialised lending 9,216 10,075
Of which: SMEs 16,195 16,367
Retail 115,408 116,630
Secured by real estate property 83,174 84,417
Qualifying revolving 20,098 21,090
Other retail 12,136 11,123
SMEs 3,659 3,325
Non-SMEs 8,477 7,797
Equity 7,798 8,217TOTAL IRB APPROACH 357,639 350,294Central governments or central banks 122,356 122,111Regional governments or local authorities 10,133 7,718Public sector entities 1,552 2,849Multilateral development banks 93 101International organisations 1 2Institutions 22,159 25,831Corporates 130,461 130,715
Of which: SMEs 21,002 22,061Retail 91,527 87,309
Of which: SMEs 24,258 26,000Secured by mortgages on immovable property 49,545 52,696
Of which: SMEs 9,009 9,161Exposures in default 5,108 4,973Exposures associated with particularly high risk 2,489 2,602Covered bonds - -Claims on institutions and corporates with a short-term credit assesment 25 197Collective investments undertakings 34 86Equity exposures - -Other exposures 21,166 22,492TOTAL STANDARDISED APPROACH 456,649 459,681TOTAL 814,288 809,976(1) The table above shows net original exposure of COREP statements about Credit Risk and CCR by standardised and IRB approach

3. rIsksBBVA. PILAR III 2017 P. 54
Net EO of provisions (2)
Exposure Class (1) Spain Turkey Eurasia Mexico USASouth
AmericaOther areas Total
Central governments or central banks 594 0 431 135 4,231 974 448 6,813 Institutions 44,341 26 48,044 505 2,543 540 1,056 97,056 Corporates 61,137 499 36,571 18,512 10,291 2,246 1,307 130,564
Of which: Specialised lending 3,541 239 4,285 1 303 275 572 9,216
Of which: SMEs 15,016 3 209 925 5 29 7 16,195
Retail 101,320 1 576 13,371 41 65 34 115,408
Secured by real estate property 82,528 1 526 13 36 44 26 83,174
Qualifying revolving 6,684 0 33 13,356 4 15 6 20,098
Other retail 12,108 0 18 1 1 6 2 12,136
SMEs 3,650 - 8 0 0 1 0 3,659
Non-SMEs 8,459 0 9 1 1 5 2 8,477
Equity 5,771 157 263 811 201 468 126 7,798 TOTAL IRB APPROACH 213,164 683 85,886 33,333 17,308 4,294 2,972 357,639 Central governments or central banks 63,669 16,533 11,186 14,475 6,037 10,456 0 122,356 Regional governments or local authorities 687 31 84 2,030 7,135 166 - 10,133 Public sector entities 2 75 29 756 - 689 - 1,552 Multilateral development banks - 5 36 - 3 48 - 93 International organisations 0 - 1 - 0 - - 1 Institutions 1,265 2,467 6,867 6,033 1,826 3,509 193 22,159 Corporates 3,326 31,413 8,300 15,076 46,746 24,941 660 130,461
Of which: SMEs 1,391 9,557 931 328 3,663 5,035 96 21,002 Retail 13,354 25,767 1,928 12,008 14,656 23,790 23 91,527
Of which: SMEs 6,523 10,917 420 258 2,250 3,886 3 24,258 Secured by mortgages on immovable property 4,751 8,506 2,332 10,685 9,360 13,851 60 49,545
Of which: SMEs 321 5,854 311 2,237 1 287 - 9,010 Exposures in default 1,401 1,583 516 471 296 839 2 5,108 Exposures associated with particularly high risk 169.95 146.724 0.069 417.955 1054.884 699.757 0 2489.339Covered bonds - - - - - - - - Claims on institutions and corporates with a short-term credit assesment
0 - 16 8 - - - 25
Collective investments undertakings 1 - 26 - 8 (0) - 34 Equity exposures - - - - - - - - Other exposures 9,227 1,988 350 4,846 1,718 3,037 0 21,166 TOTAL STANDARDISED APPROACH 97,853 88,516 31,670 66,807 88,840 82,026 937 456,649 TOTAL 311,017 89,199 117,556 100,140 106,147 86,320 3,909 814,288 (1) Geographical areas have been determined based on the counterparty's origin(2) The table above shows net original exposure of COREP statements about Credit Risk and CCR by standardised and IRB approach
3.2.3.3. Distribution by geographic area
The following chart present the distribution by geographic areas of the original exposure net of provisions, by the
obligor’s country. The distribution includes exposure under the standardised and advanced measurement approaches, as well as counterparty risk, but not including holding in equities.
Table 12. EU CRB-C – Geographical breakdown of exposures (includes counterparty credit risk) (Million Euros. 12-31-17)

3. rIsksBBVA. PILAR III 2017 P. 55
It also shows graphically the distribution of original exposure by geographic area, revealing the Group’s high level of geographical diversification, which constitutes one of the key levers for its strategic growth.
Chart 6: Distribution by geographical area of credit risk exposure
38%
11%14%
12%
13%
11% 0%Spain
Turkey
Eurasia
Mexico
United States
South America
Rest of the world
The next table shows the distribution by geographical area of the defaulted and impaired exposures of financial assets and contingent risks, as well as the adjustments for credit risk:
Table 13. EU CR1-C – Credit quality of exposures by geography (includes counterparty credit risk) (Million Euros. 12-31-17)
a b c d e fGross Original exposure (1)
Credit risk adjustmentAccumulated
write-offsCredit risk adjustment
charges of the period Net valuesDefaulted exposuresNon-defaulted
exposuresSpain 14,074 305,906 (8,963) 23,133 837 311,017 Turkey 2,341 88,067 (1,209) 40 842 89,199 Eurasia 1,079 117,159 (682) 288 232 117,556 Mexico 1,125 100,029 (1,014) 2,065 473 100,140 USA 958 105,790 (601) 3,408 395 106,147 South America 2,039 85,684 (1,403) 1,171 388 86,320 Other areas 68 3,852 (12) 51 73 3,909 TOTAL 21,685 806,487 (13,884) 30,156 3,240 814,288 (*) CCR is included, whose corrections for impairment as of December 31, 2017 amounted to 10 Million Euros(1) The table above shows gross original exposure of COREP statements about Credit Risk and CCR by standardised and IRB approach
3.2.3.4. Credit quality of exposure by exposure class and instrument
Below is the value of the exposures by exposure class, broken down into defaulted and non-defaulted exposures as of
December 31, 2017. This table excludes exposures subject to the Counterparty Risk framework under Part 3, Title II, Chapter IV of the CRR, as well as exposures subject to the Securitisation framework as defined in Part 3, Title II, chapter V of the CRR.

3. rIsksBBVA. PILAR III 2017 P. 56
Table 14. EU CR1-A – Credit quality of exposures by exposure class and instrument (excludes counterparty credit risk) (Million Euros. 12-31-17)
a b c d e fGross Original exposure (4) of:
Credit risk adjustment
Accumulated write-offs
Credit risk adjustment charges
of the period Net values (3)Defaulted exposures
Non-defaulted exposures
Central governments or central banks 96 5,567 4 - (74) 5,660Institutions 194 33,965 62 15 3 34,097Corporates 6,207 124,490 3,447 5,087 (1,831) 127,250
Of which: Specialised lending 331 7,814 109 3,497 (57) 8,036
Of which: SMEs 3,485 14,382 1,821 6 (924) 16,046
Of which: Others 2,392 102,294 1,518 1,583 (850) 103,168
Retail 5,397 112,342 2,339 1,609 (238) 115,400
Secured by real estate property 4,479 79,887 1,192 772 (403) 83,174
Qualifying revolving 168 20,457 527 51 15 20,098
Other retail 750 11,998 620 785 150 12,128
SMEs 367 3,483 199 100 61 3,651
Non-SMEs 383 8,515 421 685 89 8,477
Equity - 7,798 - - - 7,798TOTAL IRB APPROACH 11,894 284,163 5,852 6,711 (2,140) 290,204Central governments or central banks 141 116,594 48 9 13 116,546Regional governments or local authorities 9 10,108 8 13 4 10,100Public sector entities 1,551 4 19 (27) 1,547Multilateral development banks - 93 1 - 93International organisations 1 - - - 1Institutions 79 15,048 17 23 (32) 15,031Corporates 4,033 126,707 1,613 15,303 (1,259) 125,094Retail 2,917 92,709 1,246 3,595 592 91,463Secured by mortgages on immovable property
2,107 49,883 339 2,466 29 49,545
Exposures in default (1) 9,753 - 4,645 - (261) 5,107Exposures associated with particularly high risk (2) 40 2,518 67 153 (74) 2,490
Covered bonds - - - - - -Claims on institutions and corporates with a short-term credit assesment
- 24 () - (2) 24
Collective investments undertakings 2 34 - 9 - 34Equity exposures - - - - - -Other exposures 465 21,200 34 1,856 (91) 21,166TOTAL STANDARDISED APPROACH 9,792 436,472 8,022 23,445 (1,107) 438,242TOTAL 21,685 720,635 13,875 30,156 (3,247) 728,446Of which: Loans 20,333 424,971 13,556 431,750Of which: Debt securities 76 73,498 47 73,527Of which: Off-balance sheet exposures 1,276 184,129 273 185,132Of which: Others - 38,037 - 38,037(1) Exposures in default are additionally broken down by their respective categories of origin(2) Exposures associated with particularly high risk that are in default are reported in the column "Exposures in default", since they are not included in the total amount of the exposures in
default of the COREP of Credit Risk by standardised approach(3) Net exposure is calculated as follows:
- Net exposure by standardised approach = "Non-defaulted exposures" - "Credit risk adjustment"; except "Exposures in default" and "Items associated with particularly high risk" that are calculated as exposures by IRB approach do; - Net exposure by IRB approach = "Exposures in default" + "Non-defaulted exposures" - "Credit risk adjustment"
(4) The table above shows gross original exposure of COREP statements about Credit Risk by standardised and IRB approach
3.2.3.5. Distribution by sector
The following table shows the distribution of original exposure by economic sector (standardised and advanced measurement approach) of original exposure net of provisions for financial assets and contingency risks, excluding counterparty risk, and including equity:

P. 573. rIsksbbva. pIlar III 2017
Table 15. EU CRB-D – Concentration of exposures by industry or counterparty types (excludes counterparty credit risk) (Million Euros. 12-31-17)
Million Euros
Agriculture, forestry and
fishingMining and
quarrying Manufacturing
Electricity, gas, steam and air
conditioning supply Water supply Construction
Wholesale and retail
tradeTransport
and storage
Accommodation and food service
activitiesInformation and communication
Financial activities and
insuranceReal estate
activities
Professional, scientific and
technical activities
Administrative and support
service activities
Public administration
and defence, compulsory
social security Education
Human health services and
social work activities
Arts, entertainment and recreation
Other services
Household activities as employers of domestic
staff; Activities of households as products
of goods and services for own use
Extraterritorial organizations
activities
Individuals without
business activity Total (1)
Central governments or central banks
- - - - - - - - - - 4,281 - - - 1,378 - - - - - 5,660
Institutions 9 1 382 481 221 413 23 1,784 6 6 10,486 222 95 42 19,713 4 83 3 107 - 15 - 34,097Corporates 1,755 4,873 34,298 13,210 924 12,469 16,070 4,744 5,270 6,614 10,024 5,347 6,105 2,695 63 185 882 937 687 2 94 - 127,250
'Of which: Specialised lending 12 430 604 2,778 130 2,047 372 700 - - 107 251 386 53 58 37 49 2 19 - - - 8,036
'Of which: SMEs 516 60 2,887 150 61 3,500 2,878 666 920 219 335 1,934 649 420 4 90 248 186 323 - 16,046
'Of which: Others 1,226 4,383 30,807 10,282 733 6,923 12,820 3,377 4,350 6,395 9,582 3,162 5,070 2,222 2 58 585 749 346 2 94 - 103,168
Retail 624 47 1,833 119 54 1,881 3,809 1,412 1,464 462 231 460 1,658 662 - 224 660 300 5,510 9 - 93,983 115,400
'Secured by real estate property
412 20 1,024 35 31 1,404 2,465 1,058 1,215 346 187 219 1,412 466 - 179 534 233 4,738 7 - 67,188 83,174
'Qualifying revolving 20 1 35 1 1 31 90 28 37 12 9 9 57 19 - 7 22 10 327 - 19,382 20,098
'Other retail 191 26 774 83 22 446 1,254 326 212 103 35 232 189 177 - 37 105 58 445 1 - 7,413 12,128
'SMEs 152 23 708 79 19 362 1,109 243 148 83 23 206 126 135 - 27 87 45 76 1 - 3,651
'Non-SMEs 40 3 66 4 3 84 145 82 64 20 12 26 63 42 - 10 18 12 369 - 7,413 8,477
Equity - 68 46 3 309 - - - 3,548 2,974 279 7 (84) 28 - - 5 614 - - - 7,798TOTAL IRB APPROACH 2,388 4,921 36,582 13,856 1,202 15,073 19,902 7,939 6,740 10,630 27,996 6,309 7,865 3,314 21,182 413 1,626 1,246 6,918 11 109 93,983 290,204Central governments or central banks
- 1 8 18 - 1 - - - 40,793 - - 74,648 1 - 1,076 - - 116,546
Regional governments or local authorities
50 33 65 49 7 266 114 48 30 1 7,463 595 1,297 17 65 - - 10,100
Public sector entities 1 65 310 148 51 2 13 - - 1 7 895 22 1 30 - - - 1,547Multilateral development banks - - - - - - - - - - 44 - - - 48 - - - - - - - 93International organisations - - - - - - - - - - - - - - - - - - 1 - 1Institutions 9 - 6 7 - 13 31 - 21 12,078 254 163 15 1,601 3 48 - 784 - - - 15,031Corporates 1,558 5,764 31,176 7,951 698 4,071 15,417 7,559 3,248 3,269 7,037 10,497 3,141 2,144 6,938 853 4,829 701 8,205 37 - 125,094Retail 1,523 444 5,338 328 76 2,883 11,815 2,159 1,229 540 1,344 1,372 2,858 660 - 634 1,919 381 5,108 14 - 50,839 91,463Secured by mortgages on immovable property
509 548 2,378 1,054 27 1,553 3,871 929 1,396 382 2,372 18,644 2,154 269 - 779 1,696 210 3,664 3 - 7,105 49,545
Exposures in default 79 141 249 42 16 448 347 135 123 20 11 250 274 38 14 18 51 32 1,324 1,495 5,107Exposures associated with particularly high risk
1 2 2,158 9 2 2 166 88 4 6 1 5 - - 47 2,489
Covered bondsClaims on institutions and corporates with a short-term credit assesment
- - - - - - - - - - 25 - - - - - - - - - - - 25
Collective investments undertakings
- - - - - - - - - - 34 - - - - - - - - - - 34
Equity exposuresOther exposures 1 11 - 1 10 6 14,522 1 3 - 6,609 - - - 21,166TOTAL STANDARDISED APPROACH 3,680 6,962 39,520 9,573 950 11,176 31,511 11,069 5,998 4,232 78,541 31,155 8,632 3,137 91,608 2,904 9,843 1,340 26,869 54 2 59,486 438,242
TOTAL 6,069 11,883 76,102 23,429 2,152 26,248 51,413 19,008 12,738 14,862 106,537 37,464 16,496 6,451 112,789 3,318 11,469 2,587 33,787 65 111 153,468 728,446(1) The table above shows net original exposure of COREP statements about Credit Risk by standardised and IRB approach

3. rIsksBBVA. PILAR III 2017 P. 58
The next table shows the distribution by counterparty of the defaulted and impaired exposures of financial assets and
contingent risks, as well as their corresponding adjustments for credit risk:
Table 16. EU CR1-B – Credit quality of exposures by industry or counterparty types (excludes counterparty credit risk) (Million Euros. 12-31-17)
a b c d e fGross Original Exposure (1) of
Credit risk adjustment
Accumulated write-offs
Credit risk adjustment charges
of the period Net valuesDefaulted exposures
Non-defaulted exposures
Agriculture, forestry and fishing 252 6,001 184 49 (150) 6,069 Mining and quarrying 247 11,770 135 118 132 11,883 Manufacturing 1,561 76,056 1,515 4,293 112 76,102 Electricity, gas, steam and air conditioning supply 251 23,441 263 44 (294) 23,429 Water supply 50 2,128 27 147 (13) 2,152 Construction 5,870 22,761 2,382 1,051 65 26,248 Wholesale and retail trade 2,133 50,771 1,491 139 (572) 51,413 Transport and storage 587 18,872 451 35 (107) 19,008 Accommodation and food service activities 587 12,466 315 31 (318) 12,738 Information and communication 133 14,901 172 11 (189) 14,862 Financial activities and insurance 182 106,578 223 2,385 (236) 106,537 Real estate activities 1,158 37,124 818 147 (462) 37,464 Professional, scientific and technical activities 768 16,207 479 146 (331) 16,496 Administrative and support service activities 265 6,367 180 18 (139) 6,451 Public administration and defence, compulsory social security
217 112,635 62 2 3 112,789
Education 65 3,313 61 2 (29) 3,318 Human health services and social work activities 156 11,469 156 11 (102) 11,469 Arts, entertainment and recreation 122 2,526 61 4 (41) 2,587 Other services 640 34,157 1,010 20,305 147 33,787 Household activities as employers of domestic staff; Activities of households as products of goods and services for own use
2 64 1 0 (2) 65
Extraterritorial organizations activities 1 111 0 - (1) 111 Individuals without business activity 6,439 150,918 3,888 1,220 (722) 153,468 TOTAL 21,686 720,635 13,875 30,156 (3,247) 728,446 (1) The table above shows gross original exposure of COREP statements about Credit Risk by standardised and IRB approach

3. rIsksBBVA. PILAR III 2017 P. 59
3.2.3.6. Distribution by residual maturity
The following table shows the distribution of net original exposure by residual maturity of financial assets and
contingency risks, broken down by exposure class under the standardised and advanced measurement approaches, excluding counterparty risk and including equity positions:
Table 17. EU CRB-E – Maturity of exposures (excludes counterparty credit risk) (Million Euros. 12-31-17)
Net exposure value (1)
On demand ≤ 1 year > 1 year ≤ 5 years > 5 years
No stated maturity Total
Central governments or central banks 5 569 423 504 4,159 5,660 Institutions 394 9,657 8,704 10,839 4,504 34,097 Corporates 351 45,794 47,627 23,922 9,555 127,250
Of which: Specialised lending 19 788 1,468 5,318 442 8,036
Of which: SMEs 69 4,666 3,442 6,157 1,712 16,046
Of which: Others 264 40,339 42,717 12,447 7,402 103,168
Retail 18 1,801 6,041 86,998 20,541 115,400
Secured by real estate property 5 106 1,915 81,053 95 83,174
Qualifying revolving 0 64 21 0 20,012 20,098
Other retail 13 1,631 4,106 5,945 434 12,128
SMEs 10 1,424 874 933 409 3,651
Non-SMEs 3 207 3,232 5,012 24 8,477
Equity - - - - 7,798 7,798 TOTAL IRB APPROACH 768 57,821 62,795 122,263 46,557 290,204 Central governments or central banks 19,933 45,409 12,628 38,286 289 116,546 Regional governments or local authorities 97 484 1,505 7,990 25 10,100 Public sector entities 706 630 168 42 1 1,547 Multilateral development banks - 55 37 - - 93 International organisations - 1 - 0 0 1 Institutions 4,707 5,479 3,852 769 224 15,031 Corporates 10,478 39,071 52,262 21,850 1,433 125,094 Retail 3,505 37,647 25,214 15,956 9,141 91,463 Secured by mortgages on immovable property 2,080 6,073 8,785 32,604 2 49,545 Exposures in default 70 578 450 2,025 1,985 5,107 Exposures associated with particularly high risk 0 1,227 1,080 182 1 2,489 Covered bonds - - - - - - Claims on institutions and corporates with a short-term credit assesment
1 24 - - - 25
Collective investments undertakings - - 20 8 6 34 Equity exposures - - - - - - Other exposures 1,821 5,328 38 - 13,978 21,166 TOTAL STANDARDISED APPROACH 43,398 142,006 106,039 119,713 27,086 438,242 TOTAL 44,166 199,827 168,834 241,976 73,643 728,446 (1) The table above shows net original exposure of COREP statements about Credit Risk by standardised and IRB approach
The following table shows the distribution by gross carrying amount of the loans and debt securities by residual maturity
Table 18. EU CR1-D – Ageing of past-due exposures (Million Euros. 12-31-17)
Gross carrying values (1)
≤ 30 days> 30 days ≤ 60
days> 60 days ≤ 90
days> 90 days ≤ 180
days> 180 days ≤ 1
year > 1 yearLoans 3,432 759 503 - - -Debt securities 0 - - - - -Total exposures 3,432 759 503 - - -(1) Gross carrying values on balance

3. rIsksBBVA. PILAR III 2017 P. 60
ItemValue adjustments and
provisions on balanceProvisions for contingent
liabilities and commitments TOTAL (1) 17,133
Increase in impairment charged to income 9,263 286 9,549 Decrease in impairment credited to income (5,032) (599) (5,631)Decreases due to amounts employed as value adjustments (6,038) (374) (7,166)Transfers between value adjustments (482)Other adjustments (273)BALANCE AT END OF THE YEAR 13,620 263 13,884 Of which:
For impaired portfolio 10,228 234 10,462
For current non-impaired portfolio 3,393 29 3,422 (1) Value adjustments for total credit risk (including CCR) according to COREP statements
3.2.3.8. Total impairment losses for the period
The following table shows details of impairment losses and allowances on financial assets and contingent risks and
commitments, as well as derecognition of losses recognised previously in asset write-offs recorded directly in the income statement in 2017 and 2016:
Table 20. EU CR2-A – Changes in the stock of general and specific credit risk adjustments (Million Euros. 12-31-17)
Accumulated credit risk adjustment (1)
Opening balance 17,133 Increases due to amounts set aside for estimated loan losses during the period 9,549 Decreases due to amounts reversed for estimated loan losses during the period (5,631)Decreases due to amounts taken against accumulated credit risk adjustments (6,038)Transfers between credit risk adjustments (482)Impact of exchange rate differences (1,115)Business combinations, including acquisitions and disposals of subsidiaries (8)Other adjustments 478 Closing balance 13,884 Recoveries on credit risk adjustments recorded directly to the statement of profit or loss (526)Specific credit risk adjustments directly recorded to the statement of profit or loss 3,075 (1) Value adjustments for total credit risk (including CCR) according to COREP statements
In addition, a movement in the stock of non-performing exposures in the balance sheet between December 31, 2017 and December 31, 2016 is shown below:
Table 21. EU CR2-B – Changes in the stock of defaulted and impaired loans and debt securities (Million Euros)
Gross carrying value defaulted exposures (2) (3)
Opening balance (1) 23,154 Loans and debt securities that have defaulted or impaired since the last reporting period 4,541 Returned to non-defaulted status (1,646)Amounts written off (5,758)Other changes (508)Closing balance 19,783 (1) Securitisation exposures are excluded(2) Gross carrying values on balance(3) The table above includes exposures derived from Chile as of December 31, 2017
3.2.3.7. Value adjustments for impairment losses and allowances for contingent risks and commitments
The following table presents the movement recorded in 2017 in all the value adjustments for allowances and impairment
losses of financial assets on the balance sheet; and for contingent risks and commitments.
Table 19. Value adjustments for impairment losses and allowances for contingent risks and commitments (Million Euros)

3. rIsksBBVA. PILAR III 2017 P. 61
3.2.3.9. Non-performing exposures and restructured and refinanced exposures
Below is a table with a general overview of the non-performing exposures and restructured and refinanced exposures:
Table 22. EU CR1-E – Non-performing and forborne exposures (Million Euros. 12-31-17)
Gross carrying values of performing and non-performing exposures (1) (2) Accumulated impairment and provisions and
negative fair value adjustments due to credit riskCollaterals and financial
guarantees receivedOf which:
performing but past due > 30
days y ≤ 90 days
Of which: performing
forborne
Of which: non-performing On performing exposuresOn non-performing
exposures On non-performing exposures
Of which: forborne exposures
Of which: defaulted
Of which: impaired
Of which: forborne
Of which: forborne
Of which: forborne
Debt securities 70.701 - - 66 66 66 - (21) - (28) - - -Loans and advances 470,040 1,262 9,193 19,396 19,396 19,396 12,127 (4,097) (378) (8,670) (4,616) 7,478 11,253Off-balance-sheet exposures 185,405 - 110 1,276 1,276 - 142 (327) - (251) (29) 128 18(1) The table above does not include exposures derived from Chile as of December 31, 2017(2) Gross carrying values on balance
3.2.4. Information on the standardised approach
3.2.4.1. Identification of external rating agencies
The external credit assessment institutions (ECAIs) appointed by the Group to determine the risk weightings applicable to its exposures are the following: Standard & Poors, Moody’s, Fitch and DBRS.
The exposures for which the ratings of each ECAI are used are those corresponding to the wholesale portfolios, basically involving “Sovereigns and central banks” in developed countries, and “Financial Institutions”.
In cases where a counterparty has ratings from different ECAIs, the Group follows the procedure laid down in Article 261 of the Solvency Regulations, which specifies the order of priority to be used in the assignment of ratings.
When two different credit ratings made by designated ECAIs are available for a rated exposure, the higher risk weighting will be applied. However, when there are more than two credit ratings for the same rated exposure, use is to be made of the two credit ratings that provide the lowest risk weightings. If the two lowest risk weightings coincide, then that weighting will be applied; if they do not coincide, the higher of the two will be applied.
The correspondence between the alphanumeric scale of each agency used and the risk categories used by the Group are defined in the final draft Implementing Technical Standards on the mapping of the credit assessments of the ECAI under Article 136(1) and (3) of Regulation (EU) No. 575/2013; complying with the provisions of Article 136 of the CRR.
3.2.4.2. Assignment of the credit ratings of public share issues
The number of cases and the amount of these assignments are not relevant for the Group in terms of admission and management of issuer credit risk.

3. rIsksBBVA. PILAR III 2017 P. 62
3.2.4.3. Exposure values before and after the application of credit risk mitigation techniques
The original net exposure amounts for provisions and value adjustments, exposure after risk mitigation techniques, and
RWA density for each exposure category by the standardised approach, are shown below, excluding securitisation and counterparty risk exposure which is presented in section 3.2.6 of this Report.
Table 23. EU CR4 – Standardised approach – Credit risk exposure and CRM effects (Million Euros. 12-31-17)
Exposures before CCF and CRM (1) Exposures post-CCF and CRM (2) RWA (3) and RWA Density
Exposure Class On-balance
sheet amount Off-balance
sheet amount On-balance
sheet amount Off-balance
sheet amount RWA RWA Density Central governments or cental banks 102,533 14,013 130,796 758 29,571 22%Regional governments or local authorities 9,257 843 5,948 538 1,246 19%Public sector entities 723 824 1,631 66 653 38%Multilateral development banks 72 21 191 0 14 7%International Organizations 1 0 1 0 0 0%Institutions 11,541 3,490 10,793 1,414 4,440 36%Corporates 80,252 44,841 76,054 15,755 90,120 98%Retail 57,755 33,708 53,391 2,204 39,146 70%Secured by mortgages on immovable property
49,031 513 48,416 324 19,609 40%
Exposures in default 4,571 536 4,384 299 5,247 112%Exposures associated with particularly high risk
2,488 1 2,463 0 3,694 150%
Covered bonds 0 0 0 0 0 0%Institutions and corporates with a short term credit assessment
25 0 25 0 5 20%
Collective Investment Undertakings 9 26 9 15 24 100%Equity 0 0 0 0 0 0%Other Items 21,166 0 20,979 1,376 11,725 52%Total 339,425 98,817 355,080 22,750 205,493 54%(1) OE: Original Exposure(2) EAD: Net Original Exposure of provisions, value adjustments and other exposures without risk(3) RWAs: EAD after applying risk-weights
EU CR4 – Standardised approach – Credit risk exposure and CRM effects (Million Euros. 12-31-16)
Exposures before CCF and CRM (1) Exposures post-CCF and CRM (2) RWA (3) and RWA Density
Exposure Class On-balance
sheet amount Off-balance
sheet amount On-balance
sheet amount Off-balance
sheet amount RWA RWA Density Central governments or cental banks 104,192 3,462 128,127 1,569 30,046 23%Regional governments or local authorities 4,825 434 4,776 270 983 19%Public sector entities 5,109 334 2,951 146 941 30%Multilateral development banks 59 0 59 0 33 56%International Organizations 5 0 5 0 0 0%Institutions 14,613 10,675 13,846 1,739 5,407 35%Corporates 88,528 42,734 83,141 19,042 100,409 98%Retail 58,147 21,361 55,253 2,729 40,782 70%Secured by mortgages on immovable property
54,939 47 54,028 20 21,276 39%
Exposures in default 4,939 267 4,790 200 5,807 116%Exposures associated with particularly high risk
1,518 18 1,458 4 2,193 150%
Covered bonds 0 0 0 0 0 0%Institutions and corporates with a short term credit assessment
406 0 406 0 87 22%
Collective Investment Undertakings 9 347 9 125 133 100%Equity 0 0 0 0 0 0%Other Items 25,558 421 28,666 2,017 15,463 50%Total 362,848 80,100 377,516 27,861 223,561 56%(1) OE: Original Exposure(2) EAD: Net Original Exposure of provisions, value adjustments and other exposures without risk(3) RWAs: EAD after applying risk-weights

3. rIsksbbva. pIlar III 2017 P. 63
In addition, the following tables present the amounts of net exposure, before and after the application of credit risk mitigation techniques, for different risk weightings and for the different exposure categories that correspond to the standardised method, excluding securitisation positions and counterparty credit risk exposure.
Exposure net of provisions and after applying CCF and CRM corresponding to counterparty risk are shown in table EU-CCR3 of section 3.2.6 of this report.
Table 24. Standardised approach: Exposure values before the application of credit risk mitigation techniques (Million Euros. 12-31-17)
Exposure ClassRisk Weight Total credit exposures amount
(pre CCF and pre-CRM)Of which:
unrated0% 2% 4% 10% 20% 35% 50% 70% 75% 100% 150% 250% 370% 1250% Others DeductedCentral Government or central banks 74,193 - - - 14,826 - 4,865 - - 19,361 590 2,711 - - - - 116,546 48,926 Regional government or local authorities 803 - - - 9,157 - 67 - - 73 - - - - - - 10,100 10,093 Public sector entities 2 - - - 918 - 254 - - 343 30 - - - - - 1,547 1,344 Multilateral development banks 44 - - - - - 27 - - 21 - - - - - - 93 93 International Organizations 1 - - - - - - - - - - - - - - - 1 0 Institutions - 497 - - 9,250 - 2,926 - - 2,359 - - - - - - 15,031 13,755 Corporates - - - - 358 - 309 - - 124,134 293 - - - - - 125,094 124,690 Retail - - - - - - - - 91,463 - - - - - - - 91,463 91,309 Secured by mortgages on immovable property
- - - - - 38,149 7,596 - 642 3,158 - - - - - - 49,545 49,536
Exposures in default - - - - - - - - - 3,751 1,356 - - - - - 5,107 5,103 Exposures associated with particularly high risk
- - - - - - - - - - 2,489 - - - - - 2,489 2,489
Covered bonds - - - - - - - - - - - - - - - - - - Institutions and corporates with a short-term credit assessment
- - - - 25 - - - - 0 - - - - - - 25 25
Collective investment undertakings - - - - - - - - - 34 - - - - - - 34 34 Other Items 5,371 - - - 5 - - - - 15,783 - - - - 6 - 21,166 21,060 Equity - - - - - - - - - - - - - - - - - - Total 80,415 497 - - 34,539 38,149 16,043 - 92,105 169,018 4,758 2,711 - - 6 - 438,242 368,457
Standardised approach: Exposure values before the application of credit risk mitigation techniques (Million Euros. 12-31-16)
Exposure ClassRisk Weight Total credit exposures amount
(pre CCF and pre-CRM)Of which:
unrated0% 2% 4% 10% 20% 35% 50% 70% 75% 100% 150% 250% 370% 1250% Others DeductedCentral Government or central banks 74,756 - - - 3,894 - 6,707 - - 18,931 337 3,030 - - - - 107,655 66,939 Regional government or local authorities 659 - - - 4,453 - 34 - - 113 - - - - - - 5,259 5,259 Public sector entities 48 - - - 4,670 - 122 - - 562 41 - - - - - 5,442 5,248 Multilateral development banks - - - - 11 - 34 - - 14 - - - - - - 59 59 International Organizations 5 - - - - - - - - - - - - - - - 5 2 Institutions - 856 - - 19,096 - 2,688 - - 2,480 167 - - - - - 25,288 24,238 Corporates - - - - 359 - 728 - - 130,033 142 - - - - - 131,262 131,262 Retail - - - - - - - - 79,012 493 3 - - - - - 79,508 79,508 Secured by mortgages on immovable property
- - - - - 43,490 8,559 - 686 2,251 - - - - - - 54,986 54,986
Exposures in default - - - - - - - - - 3,480 1,725 - - - - - 5,205 5,205 Exposures associated with particularly high risk
- - - - - - - - - 113 1,423 - - - - - 1,536 1,536
Covered bonds - - - - - - - - - - - - - - - - - - Institutions and corporates with a short-term credit assessment
- - - - 399 - - - - 8 - - - - - - 406 406
Collective investment undertakings - - - - - - - - - 356 - - - - - - 356 356 Other Items 9,278 - - - 112 - - - - 16,571 - - - - 17 - 25,979 25,979 Equity - - - - - - - - - - - - - - - - - - Total 84,746 856 - - 32,994 43,490 18,872 - 79,698 175,405 3,838 3,030 - - 17 - 442,946 400,983 (*) Of which: Unrated refers to exposures for which no credit rating is available made by designated ECAIs.

3. rIsksBBVA. PILAR III 2017 P. 64
Table 25. EU CR5 – Standardised approach (Million Euros. 12-31-17)
Exposure ClassRisk Weight
TotalOf which:
unrated0% 2% 4% 10% 20% 35% 50% 70% 75% 100% 150% 250% 370% 1250% Others DeductedCentral Government or central banks 102,481 - - - 2,197 - 4,214 - - 19,361 590 2,711 - - - - 131,554 53,518 Regional government or local authorities 651 - - - 5,695 - 67 - - 73 - - - - - - 6,486 6,486 Public sector entities 75 - - - 1,097 - 211 - - 283 30 - - - - - 1,697 635 Multilateral development banks 163 - - - - - 27 - - - - - - - - - 191 72 International Organizations 1 - - - - - - - - - - - - - - - 1 0 Institutions - 356 - - 8,630 - 1,027 - - 2,193 - - - - - - 12,207 11,561 Corporates - - - - 351 - 298 - - 90,870 290 - - - - - 91,808 91,427 Retail - - - - - - - - 55,595 - - - - - - - 55,595 55,435 Secured by mortgages on immovable property - - - - - 37,695 7,427 - 630 2,989 - - - - - - 48,740 48,732 Exposures in default - - - - - - - - - 3,555 1,128 - - - - - 4,683 4,681 Exposures associated with particularly high risk - - - - - - - - - - 2,463 - - - - - 2,463 2,463 Covered bonds - - - - - - - - - - - - - - - - - - Institutions and corporates with a short-term credit assessment
- - - - 25 - - - - - - - - - - - 25 24
Collective investment undertakings - - - - - - - - - 24 - - - - - - 24 24 Other Items 10,630 - - - 5 - - - - 11,714 - - - - 6 - 22,356 22,241 Equity - - - - - - - - - - - - - - - - - - Total 114,002 356 - - 18,000 37,695 13,272 - 56,225 131,062 4,501 2,711 - - 6 - 377,830 297,297
EU CR5 – Standardised approach (Million Euros. 12-31-16)
Exposure ClassRisk Weight
TotalOf which:
unrated0% 2% 4% 10% 20% 35% 50% 70% 75% 100% 150% 250% 370% 1250% Others DeductedCentral Government or central banks 99,919 - - - 2,347 - 5,132 - - 18,931 337 3,030 - - - - 129,696 84,560 Regional government or local authorities 632 - - - 4,268 - 34 - - 113 - - - - - - 5,047 4,982 Public sector entities 81 - - - 2,583 - 60 - - 333 41 - - - - - 3,097 2,904 Multilateral development banks 0 - - - 11 - 34 - - 14 - - - - - - 59 58 International Organizations 5 - - - - - - - - - - - - - - - 5 2 Institutions - 856 - - 10,875 - 1,444 - - 2,243 167 - - - - - 15,585 13,994 Corporates - - - - 359 - 743 - - 100,945 136 - - - - - 102,182 101,750 Retail - - - - - - - - 57,529 451 3 - - - - - 57,983 57,877 Secured by mortgages on immovable property - - - - - 42,650 8,531 - 686 2,181 - - - - - - 54,048 54,048 Exposures in default - - - - - - - - - 3,357 1,633 - - - - - 4,990 3,316 Exposures associated with particularly high risk - - - - - - - - - - 1,462 - - - - - 1,462 1,462 Covered bonds - - - - - - - - - - - - - - - - - - Institutions and corporates with a short-term credit assessment
- - - - 399 - - - - 8 - - - - - - 406 406
Collective investment undertakings - - - - - - - - - 133 - - - - - - 133 133 Other Items 15,149 - - - 112 - - - - 15,406 - - - - 17 - 30,684 30,384 Equity - - - - - - - - - - - - - - - - - Total 115,786 856 - - 20,953 42,650 15,978 - 58,214 144,115 3,778 3,030 - - 17 - 405,377 355,876 (*) Of which: Unrated refers to exposures for which no credit rating is available made by designated ECAIs.

3. rIsksBBVA. PILAR III 2017 P. 65
The following table presents the main variations in the period in terms of RWAs for the Credit and Counterparty Risk standardised approach:
Table 26. RWA flow statements of credit risk exposures under the standardised approach (Million Euros. 12-31-17)
Credit Risk Counterparty Credit Risk
RWA amountsCapital
Requirements RWA amountsCapital
RequirementsRWAs as of December 31, 2016 223,561 17,885 4,426 354 Asset size 7,867 629 (1,080) (86)Asset quality (996) (80) (51) (4)Model updates - - - - Methodology and policy - - - - Acquisitions and disposals - - - - Foreign exchange movements (24,939) (1,995) (234) (19)Other - - - - RWAs as of December 31, 2017 205,493 16,439 3,060 245
Risk-weighted assets in exposures subject to the standardised approach declined in 2017 by €19,434 billion. This reduction is affected by: the general appreciation of the euro against emerging currencies and the dollar, which has had an impact of -€25,173 billion, offset by the growth in credit portfolios in South America and Turkey.
The table below shows the balances of credit risk and counterparty provisions by exposure categories, as of December 31, 2017 and 2016:
Table 27. Balance of loan-loss provisions, by exposure category (Standardised approach) (Million Euros.)
Exposure ClassLoan-loss provisions
2017 2016Central governments or central banks 48 35 Regional governments or local authorities 8 4 Public sector entities 4 31 Multilateral Development Banks 1 0 International organizations - - Institutions 17 48 Corporates 1,613 2,873 Retail 1,246 654 Secured by mortgages on immovable property 339 310 Exposures in default 4,645 4,906 Exposures associated with particularly high risk 68 142 Covered bonds - - Institutions and corporates with a short-term credit assessment - - Collective investments undertakings 0 2 Other exposures 34 124 TOTAL 8,023 9,130

3. rIsksBBVA. PILAR III 2017 P. 66
3.2.5. Information on the IRB approach
3.2.5.1. General information
3.2.5.1.1. Authorisation by the supervisor to use the IRB model
The following is a list of the models authorised by the supervisor for use in the calculation of capital requirements.
Table 28. Models authorized by the supervisor for the purpose of their use in the calculation of capital requirements
Institution Portfolio Portfolio Number of models Model description
BBVA S.A.
Financial institutions 4 1 Rating, 1 PD model, 1 LGD model, 1 EAD modelPublic institutions 5 1 Rating, 1 PD model, 2 LGD models, 1 EAD modelSpecialized finance 2 1 Slotting criteria, 1 EAD modelDevelopers 4 1 Rating, 1 PD model, 1 LGD model, 1 EAD modelSmall Corporates 5 1 Rating, 1 PD model, 2 LGD models, 1 EAD modelMedium-sized Corporates 5 1 Rating, 1 PD model, 2 LGD models, 1 EAD modelLarge Corporates 5 1 Rating, 1 PD model, 2 LGD models, 1 EAD modelMortgages 6 2 Scorings, 2 PD models, 1 LGD model, 1 EAD modelConsumer finance 5 2 Scorings, 2 PD models, 1 LGD modelCredit cards 10 2 Scorings, 2 PD models, 3 LGD models, 3 EAD modelsCredit cards 3 2 Scorings, 1 PD model, 1 LGD model
BBVA IrelandFinancial institutions 4 1 Rating, 1 PD model, 1 LGD model, 1 EAD modelLarge Corporates 5 1 Rating, 1 PD model, 2 LGD models, 1 EAD model
BBVA Bancomer Retail Revolving (Credit Cards) 11 4 Scorings, 5 PD models, 1 LGD model, 1 modelo de EAD modelLarge Corporates 5 1 Rating, 1 PD model, 2 LGD models, 1 EAD modelMedium-sized Corporates 5 1 Rating, 1 PD model, 2 LGD models, 1 EAD model
BBVA Group Equity 1 1 capital model
The main types of rating models used in the IRB portfolios are ratings for wholesale portfolios and proactive and reactive scorings in the case of retail portfolios.
Rating models
The rating models give contracts/customers a score that orders customers according to their credit quality.
This score is determined by the characteristics of the transactions, economic and financial conditions of the customer, information on payment behavior, credit bureau, etc.
PDs
Based on this score a probability of default (PD) can be assigned to the contract level or customer level through the PD models that transform scores into probabilities of default.
If the data used in these calculations do not cover a complete economic cycle, the additions to NPL and probability of default depend on the phase of the cycle used. As a result, an adjustment has to be made to the cycle to consider this question. It will vary depending on the economic situation and will allow an average PD to be determined over the cycle.
In the case of low default portfolios, the Group uses a variety of techniques to estimate the PDs, such as the use of external default data, or ECAI references.
LGD
The method used to estimate the loss given default is the “Workout LGD”, based on the discount of the cash flows of defaulted exposure, recovered at different points of time.
According to the quantitative requirements, to calculate the RWAs a LGD has to be estimated that includes the slowdowns in the economic cycle, called the “DLGD” (the LGD at the bottom of the cycle).
In the case of low default portfolios the Group uses a variety of techniques to estimate LGD, such as the use of LGD data from external studies or empirical estimates, either of sets of low default portfolios (LDPs), or extrapolations of non-LDP portfolios.
CCF
Finally, the conversion factors or CCF are defined as the percentage of the undrawn balance that is expected to be used before the default. It tends to be estimated under a cohort approach based on the historically observed defaults.
A cohort is a 12-month window that has a reference date (close of each month) and contains all the non-performing transactions whose default date is within the cohort. All the transactions will need a contracting date before the reference date. A CCF is calculated in each cohort considering all the defaults included in it.

3. rIsksBBVA. PILAR III 2017 P. 67
The approval of the models by the supervisor includes both own estimations of the probability of default (PD), loss given default (LGD) and the internal estimation of credit conversion factors (CCFs).
The Group maintains its calendar established for receiving approval for additional Advanced Internal Models in different risk classes and geographical areas.
3.2.5.1.2. Structure of internal rating systems and relationship between internal and external ratings
The Group has rating tools for each one of the exposure categories listed in the Basel Accord.
The retail portfolio has scoring tools for determining the credit quality of transactions on the basis of information on the transaction itself and on the customer. The scoring models are algorithms calculated using statistical methods that score each transaction. This score reflects the transaction’s level of risk and is in direct relation to its probability of default (PD).
These decision models are the basic tool for deciding who should receive a loan and the amount to be granted, thereby contributing to both the arrangement and management of retail-type loans.
For the wholesale portfolio, the Group has rating tools that, unlike scorings, do not assess transactions but rather customers. The Group has different tools for rating the various customer segments: small companies, corporates, government and other government agencies, etc. In those wholesale portfolios where the number of defaults is very low (sovereign risks, corporates, financial institutions) the internal information is supplemented by the benchmarks of external rating agencies.
The PD estimates made by the Group are transferred to the Master Scale, enabling a comparison to be made with the scales used by external agencies. This is shown below
Table 29. Master Scale of BBVA’s rating
External rating Internal rating Probability of default (basic points)Standard & Poor's List Reduced List (22 groups) Average Minimum from >= MaximumAAA AAA 1 - 2AA+ AA+ 2 2 3AA AA 3 3 4AA- AA- 4 4 5A+ A+ 5 5 6A A 8 6 9A- A- 10 9 11BBB+ BBB+ 14 11 17BBB BBB 20 17 24BBB- BBB- 31 24 39BB+ BB+ 51 39 67BB BB 88 67 116BB- BB- 150 116 194B+ B+ 255 194 335B B 441 335 581B- B- 785 581 1,061CCC+ CCC+ 1,191 1,061 1,336CCC CCC 1,500 1,336 1,684CCC- CCC- 1,890 1,684 2,121CC+ CC+ 2,381 2,121 2,673CC CC 3,000 2,673 3,367CC- CC- 3,780 3,367 4,243
3.2.5.1.3. Use of internal estimations for purposes other than the calculation of capital requirements
The Group’s internal estimations are a vital component of management based on value creation, giving rise to criteria for assessing the risk-return trade-off.
These measures have a broad range of uses, from the adoption of strategic business decisions through to the individual admission of transactions.
Specifically, internal estimates are used in everyday business in support of credit-risk management through their inclusion
in admission and monitoring processes, as well as in the pricing of transactions.
The management use of performance metrics that consider expected loss, economic capital and risk-adjusted return enables the monitoring of portfolios and the assessment of non-performing positions, among others.
3.2.5.1.4. Process for managing and recognizing the effects of credit risk mitigation
Mitigation is an iterative process whose purpose is to recognise the benefits of the existence of collateral and

3. rIsksBBVA. PILAR III 2017 P. 68
guarantees, ordering them from the highest to the lowest credit quality.
The Group uses risk mitigation techniques for exposures pertaining to the wholesale portfolio by replacing the obligor’s PD with that of the guarantor, in those cases in which the latter is eligible and its PD is lower than the obligor’s. In retail admission processes, the scoring contains the effect of the guarantor, and the recovery flows that are forthcoming throughout the cycle reflect the recoveries related to the guarantees associated with the contracts. This means that the effect of the guarantees is taken into account in the actual estimation of the loss given default for retail portfolios.
3.2.5.1.5. Control mechanisms for internal rating systems
The Entity has a management framework for rating systems that includes all the phases of its life cycle: from the time when a need that triggers the construction or modification of a model is identified, until its use and monitoring.
An appropriate monitoring allows detection of unexpected behavior, identification of incorrect use and even anticipation when changes in the risk profile of the portfolios or products require corrective action to be taken. The monitoring of the risk rating systems is made with a frequency that is appropriate to the nature of the model, the availability of new data, modeling techniques and the importance of its use in management. This is analysed from a twofold perspective: performance and use.
The monitoring of the performance has the aim of detecting deficiencies in the performance of the rating systems for risk anticipating its deterioration over time. It permits the determination whether they operate correctly, helping to verify that the components of the model operate as expected. The framework for monitoring performance can identify weaknesses and identify plans of action needed to ensure correct operation. This analytic framework, a fundamental component of the planning of risk models, establishes the minimum criteria that must be taken into account, as well as the metrics and thresholds to alert undesired behavior.
The monitoring of the use aims to check that the model is used generally, for the planned uses, and appropriately. This control mechanism allows continued detection of deviations from the planned use of models, as well as the establishment of action plans for their correction.
In addition, the entity has an independent area in place for developers of rating systems and the departments responsible for their monitoring. It carries out periodic validations in all geographic areas, reviewing both the construction and performance of rating systems and their possible uses (estimates of capital and provisions, setting limits, stress tests, etc.).
The various aspects to be improved are detected during the review process are reflected in the validation reports by setting recommendations. These reports are presented to the established Risk Committees, together with the state of the action plans associated with the recommendations, to ensure their resolution and the proper operation of the rating systems at any time.
3.2.5.1.6. Description of the internal rating process
There follows a description of the internal classification processes according to each customer category:
Central banks and central governments: For this segment, the assignment of ratings is made by the Risk units appointed for this purpose, which periodically analyse this type of customers, rating them according to the parameters included in the corresponding rating model. There are 3 different methods currently in use for assigning country ratings: (i) ratings from external agencies, used for developed nations, emerging countries with elevated incomes and emerging countries where the Group has little risk; (ii) internal rating based on a proprietary tool used for emerging countries where the Group has an appreciable risk; and lastly (iii) the country risk ratings published by the Belgian export credit agency (which manages the quantitative model used by the OECD to assign its country risk ratings) for countries of marginal importance for the Group that have no external ratings. Sovereign ratings are generated in local and foreign currency for all the tools, as well as a transfer rating, which evaluates the risk of inconvertibility/transfer restrictions.
In the case of emerging countries with presence of BBVA subsidiaries or branches, the rating in local currency is adjusted to that obtained by the emerging countries tool under the authorisation of the Risk Committee assigned for this purpose.
Institutions: The rating of Public Institutions is generally provided by the risk units responsible for their approval, on a yearly basis, coinciding with the review of customer risk or with the reporting of their accounts.
In the case of financial institutions, the Risk unit responsible makes a regular classification of these customers, continuously monitoring them on domestic and international markets. External ratings are a key factor in assigning ratings for financial institutions.
Large Companies: Includes the rating of exposures with corporate business groups. The result is affected both by indicators of business risk (evaluation of the competitive environment, business positioning, regulation, etc.) and financial risk indicators (size of the group by sales, cash generation, levels of debt, financial flexibility, etc.).

3. rIsksBBVA. PILAR III 2017 P. 69
In accordance with the characteristics of the large companies segment, the rating model is global in nature, with specific algorithms by sector of activity and geographical adaptations. The rating of these customers is generally calculated within the framework of the annual risk review process, or the admission of new operations.
The responsibility for the assessment lies with the units originating the risk, while those approving it validate it when the decision is taken.
Medium-sized companies: This segment also takes into account quantitative factors derived from economic and financial information, and qualitative factors that are related to the age of the company, the sector, management quality, etc. and alert factors derived from risk monitoring.
As in the Corporate segment, the rating tends to run parallel to the admission process, so the responsibility for rating lies with the unit proposing the risk, while the decision-making level is in charge of validating it.
Small Businesses: As in the case of medium-sized companies, this segment also takes into account quantitative factors derived from economic and financial information, and qualitative factors that are related to the age of the company, the sector, management quality, etc. and alert factors derived from risk monitoring. Similarly, the rating tends run parallel with the admission process, so the responsibility for rating is with the unit proposing the risk, while the decision-making level is in charge of validating it.
Specialised Finance: For classifying this segment, the Group has chosen to apply the supervisory slotting criteria approach, as included in the Basel Accord of June 2004 and in the Solvency Regulation (CRR article 153.5).
Developers: The rating of real-estate developers covers the rating of both the customers who are developers and the individual real-estate projects. Its use makes it easier to monitor and rate projects during their execution phase, as well as enriching the admission processes.
BBVA Bancomer companies: This segment also takes into account quantitative factors derived from economic and financial information and bureau information, as well as qualitative factors related to the age of the company, the sector, the quality of its management, etc. The rating tends to run parallel to the admission process, so that responsibility for the rating is with the unit originating the risk, while the decision-making body validates it.
In general in the wholesale area, the rating of customers is not limited to admission, as the ratings are updated according to new information available at any time (economic and financial data, changes in the company, external factors, etc.)
Retail: This has been broken down into each one of the exposure categories referred to by the correlations provided for in the sections defined in the Solvency Regulation.
One of the most important processes in which scoring is fully integrated at the highest level and in all decision-making areas is the Group’s process for approving retail transactions. Scoring is an important factor for the analysis and resolution of transactions and it is a mandatory requirement to include it in decision-making on risk in those segments for which it has been designed. In the process of marketing and approving retail transactions, the manager is responsible for marketing management, the credit quality and the profitability, in other words, the customer’s integrated management, attending to the processes of admission, monitoring and control.
The rating process is as follows for each specific category of retail exposure:
a. Mortgages, consumer finance and retail credit cards - Spain: The manager collects data on the customer (personal, financial, banking relationship information) and on the transaction (LTV, amount, maturity, destination etc.) and calculates the rating of the transaction with the scoring. The decision of whether it is approved is made based on the results of applying the model.
b. Consumer Finance Autos Spain: The financing request may enter through the call center or be directly recorded in web application by our authorised dealers. The necessary information on the customer (personal, financial information, authorisation of the consultation to the external bureau of credit) and on the transaction (maturity, amount, etc.) is recorded to rate the transaction with the scoring. Once the validity of the information provided is obtained, the decision of whether to approve it is made based on the results of applying the model.
c. Retail Revolving (BBVA Bancomer credit cards): The manager or specialist party gathers the necessary information on the customer (personal, financial information and authorisation of the consult from the external bureau of credit) and on the transaction (limit requested) to rate the transaction with the scoring. There are additional processes for validating and checking this information through the back office or operational support areas. The decision of whether it is approved is made based on the results of applying the model.
Behavioral: Every month all the active cards are rated according to their transactional behavior and payment status.
Proactive: Each month all the customers who have asset positions in credit cards, consumer finance or mortgages
3. rIsksBBVA. PILAR III 2017 P. 70
and liabilities positions are rated, based on information on internal behavior and flows.
d. Proactive - Spain: Each month all the customers who have asset positions in credit cards, consumer finance or mortgages and first and second in liability seniority, are rated according to information on their behavior.
Equity: For its portfolio position registered as equity, the Group is applying the rating obtained for customers as a result of their rating in the lending process.
3.2.5.1.7. Definitions, methods and data for estimating and validating risk parameters
The estimation of the parameters is based on the uniform definition of default established at Group level. Specifically, for a contract or customer to be considered in a situation of default, the provisions of current regulations must be met.
Specifically, there are two approaches within the Group for considering default and estimating parameters:
The contract-level approach is applied within the sphere of retail risk. Each customer transaction is dealt with as an independent unit in terms of credit risk. Therefore, non-compliance with credit obligations to the bank is handled at the transaction level, regardless of the behavior of the customer with respect to other obligations.
The customer-level approach is applied to the remainder of the portfolio. The significant unit for defining default is the customer’s sum of contracts, which enter a situation of default en masse when the customer defaults.
In addition, to avoid including defaults for small amounts in the estimations, defaulted volumes are to pass through a materiality filter that depends on the type of customer and transaction.
Estimating parameters
In the case of Spain and Mexico, the Group has an RAR information system that reflects exposure to credit risk in the Group’s different portfolios included in advanced internal models.
This information system guarantees the availability of historical data recorded by the Group, which are used to estimate the parameters of Probability of Default (PD), Loss Given Default (LGD) and Credit Conversion Factors (CCF). These are then used to calculate the regulatory capital using the advanced measurement approach, economic capital and expected loss by credit risk.
Other sources of information for the Bank may be used in addition, depending on any new needs detected in the
estimation process. Internal estimations of the PD, LGD and CCF parameters are made for all the Group’s portfolios.
In the case of low default portfolios (LDP), in which the number of defaults tends to be insufficient for obtaining empirical estimates, use is made of data from external agencies that are merged with the internal information available and expert criteria.
The following shows the estimation methodologies used for the PD, LGD and CCF risk parameters, for the purpose of calculating the capital requirements.
Probability of default (PD)
The methodology used for estimating the PD in those cases that have a mass of internal data of sufficient size is based on the creation of pools of exposures. The pools proposed with a view to calibration are defined by pooling contracts together seeking to achieve intra-group uniformity in terms of credit quality and differentiation with all the other risk groups. The largest possible number of pools is defined in order to allow a suitable discrimination of risk.
The fundamental metric used for making these groupings is the score, being supplemented by other metrics relevant to PD that are proven to be sufficiently discriminating depending on the portfolio.
Once the pools of exposures have been defined, the average empirical PD recorded for each one is obtained and adjusted to the cycle. This metric provides stable estimates over the course of the economic cycle, referred to as PD-TTC (through the cycle). This calculation considers the portfolio’s track record and provides long-term levels of PD.
In low default portfolios (LDPs) the empirical PDs observed by external credit assessment institutions are used to obtain the PD of internal risk groups.
Finally, in customer-focused portfolios there is a Master Scale, which is simply a standard and uniform rule for credit levels that makes it possible to make comparisons of credit quality in the Group’s different portfolios.
Loss given default (LGD)
As a general rule, the method used to estimate LGD in portfolios with a sufficient number of defaults is Workout LGD. Here, the LGD of a contract is obtained as a quotient of the sum of all the financial flows recorded during the recovery process that takes place when a transaction defaults, and the transaction’s exposure at the time of default.

3. rIsksBBVA. PILAR III 2017 P. 71
This estimate is made by considering all the historical data recorded in internal systems. When making the estimates, there are transactions that have already defaulted but for which the recovery process is still ongoing. The loss given default recorded at the time of the estimate is therefore higher than it will ultimately be. The necessary adjustments are made in these cases so as not to distort the estimate.
These estimates are made by defining uniform risk groups in terms of the nature of the operations that determine loss given default. They are made in such a way that there are enough groups for each one to be distinguishable and receive a different estimate.
In keeping with the guidelines set out by the rules, the estimates are made by distinguishing between wholesale and retail type exposures.
There is insufficient historical experience to make a robust estimate in low default portfolios (LDP) using the Workout LGD method, so external sources of information are used, combined with internal data to provide the portfolio with a representative rate of loss given default.
The loss given default rates estimated according to the internal databases the Group holds are conditioned to the moment of the cycle of the data window used, since loss given default varies over the economic cycle. Hence, the following concepts can be defined: long-run loss given default (LRLGD), downturn loss given default (DLGD), and best-estimate loss given default (LGD BE).
LRLGD is calculated by making an adjustment to capture the difference between the loss given default obtained empirically with the available sample and the average loss given default observed throughout the economic cycle if the observation of the cycle is complete.
In addition, the LGD observed in a period of stress in the economic cycle, the downturn loss given default (DLGD) is determined.
These estimates are made for those portfolios whose loss given default is noticeably sensitive to the cycle. The different ways in which the recovery cycles can conclude are determined for each portfolio where this LGD in conditions of stress has not yet been observed, and the level these parameters would have in a downturn situation are estimated.
Finally, LGD BE is determined according to the LGD observed in the BE period, which aims to cover the defaults closest in time to the present, in other words those that have been
produced at a time of the economic cycle that is similar to the present and that also correspond to a very similar portfolio to the present one.
However, for defaulted transactions, the LGD at the worst time will be the LGD BE plus a stress, which is measured based on the volatility of LGD in the BE period.
Credit conversion factor (CCF)
As with the two preceding parameters, the exposure at the moment of default is another of the necessary inputs for calculating expected loss and regulatory capital. A contract’s exposure usually coincides with its balance. However, this does not hold true in all cases.
For example, for those products with explicit limits, such as credit cards or credit lines, the exposure should incorporate the potential increase in the balance that may be recorded up to the time of default.
In observance of regulatory requirements, exposure is calculated as the drawn balance, which is the real risk at any specific moment, plus a percentage (CCF) of the undrawn balance, which is the part that the customer can still use until the available limit is reached. Therefore, the CCF is defined as the percentage of the undrawn balance that is expected to be used before default occurs.
CCF is estimated by using the cohort approach, analyzing how the exposure varies from a pre-established reference date through to the moment of default, obtaining the average performance according to the relevant metrics.
Different approaches are used for wholesale and retail type exposures. The contract approach analyses the exposure’s evolution until the contract’s moment of breach of contract, whereas the customer approach analyses changes in the exposure through to the time of default by the customer.
Once again, in low default portfolios (LDP) there is insufficient historical experience to make a reliable calculation with the Workout LGD method defined. In this case, too, use is made of external sources that are combined with internal data to provide a representative CCF of the portfolio.
3.2.5.2. Exposure values by category and PD range
The following table presents the information on credit risk as of December 31, 2017 (excluding counterparty risk, which is set out in detail in Table CCR4 in section 3.2.6.2.2) using the internal ratings-based (IRB) approach, by obligor grade for the different categories of exposure:

3. rIsksBBVA. PILAR III 2017 P. 72
Table 30. EU CR6 – IRB approach – Credit risk exposures by exposure class and PD range (Million Euros)
PD Scale as of 12-31-17 (1)
Original on-balance sheet
gross exposureOff-balance sheet
exposures pre CCF Average CCF (2)
EAD post CRM and post-CCF
Average PD (3)
Number of obligors
Average LGD (4)
Average Maturity (days) (5) RWAs
RWA Density EL
Value adjustments
and provisionsPrudential portfolios for FIRB approach - - - - - - - - - - - - Prudential portfolios for AIRB approach 206,089 85,560 43.55% 224,504 5.71% 11,479,545 34.27% 83,577 37.23% 4,635 (6,975)Central governments or central banks 5,288 376 49.92% 6,977 0.42% 134 27.93% 67 409 5.86% 5 (4)0,00<0,15 4,543 136 49.90% 6,466 0.03% 37 26.87% 69 179 2.77% 1 (2)0,15<0,25 96 72 49.97% 183 0.20% 20 42.73% 59 18 9.82% 0 (0)0,25<0,50 77 1 38.95% 121 0.30% 6 48.77% 60 48 40.14% 0 (0)0,50<0,75 117 0 0.00% 88 0.59% 6 37.95% 94 35 39.41% 0 (0)0,75<2,50 9 25 50.00% 4 1.50% 9 35.52% 50 3 73.75% 0 (0)2,50<10,00 356 125 50.07% 89 4.70% 40 40.20% 74 121 136.44% 2 (1)10,00<100,00 1 9 50.21% 5 21.22% 2 20.00% 5 5 103.12% 0 (0)100(Default) 88 8 50.00% 21 100.00% 14 9.86% 59 0 0.69% 2 (1)Institutions 27,398 6,761 55.89% 12,560 0.96% 1,869 40.79% 44 3,988 31.75% 55 (62)0,00<0,15 18,770 4,486 55.51% 9,991 0.08% 948 41.41% 47 2,262 22.64% 3 (7)0,15<0,25 3,506 908 62.81% 752 0.20% 196 37.03% 44 291 38.64% 1 (1)0,25<0,50 3,587 816 54.02% 743 0.31% 200 33.59% 39 324 43.58% 1 (1)0,50<0,75 510 158 62.91% 336 0.51% 121 36.57% 33 214 63.81% 1 (0)0,75<2,50 466 346 50.76% 461 1.22% 183 44.23% 40 515 111.69% 2 (1)2,50<10,00 326 43 53.17% 147 3.70% 146 47.97% 42 250 169.99% 3 (4)10,00<100,00 40 3 50.75% 42 19.65% 28 45.50% 40 107 255.01% 4 (2)100(Default) 193 1 86.52% 88 100.00% 47 46.95% 42 26 29.19% 41 (46)Corporate SMEs 14,260 3,606 43.93% 15,502 22.70% 43,278 47.68% 48 9,935 64.09% 1,666 (1,821)0,00<0,15 1,147 621 43.51% 1,835 0.12% 5,134 51.85% 56 520 28.32% 1 (4)0,15<0,25 566 274 42.88% 1,015 0.20% 2,308 47.79% 43 381 37.50% 1 (2)0,25<0,50 1,031 362 43.33% 1,402 0.31% 4,106 51.77% 47 704 50.19% 2 (6)0,50<0,75 1,331 373 45.19% 1,505 0.51% 5,310 49.66% 46 896 59.49% 4 (6)0,75<2,50 3,132 974 45.33% 3,201 1.20% 10,460 47.19% 46 2,623 81.94% 18 (18)2,50<10,00 3,344 764 43.51% 2,943 4.22% 10,329 43.47% 42 3,369 114.49% 53 (194)10,00<100,00 413 63 42.47% 309 16.06% 1,523 39.91% 62 501 162.06% 20 (14)100(Default) 3,296 174 41.01% 3,291 100.00% 4,108 47.63% 63 942 28.62% 1,568 (1,577)Corporate Non-SMEs 50,757 53,929 50.58% 76,577 3.51% 13,759 42.12% 55 37,614 49.12% 800 (1,518)0,00<0,15 17,194 26,765 49.16% 30,981 0.11% 2,647 43.27% 59 8,885 28.68% 15 (34)0,15<0,25 5,071 7,709 48.55% 9,200 0.20% 1,432 43.39% 56 3,687 40.07% 8 (12)0,25<0,50 8,859 8,240 51.01% 13,089 0.31% 2,277 43.15% 62 6,927 52.93% 18 (28)0,50<0,75 7,693 7,907 57.82% 11,311 0.49% 2,280 41.65% 54 7,395 65.38% 23 (18)0,75<2,50 5,567 1,872 45.44% 5,420 1.02% 2,548 40.33% 45 4,806 88.67% 22 (19)2,50<10,00 3,539 1,157 55.76% 3,650 3.36% 1,721 40.32% 44 4,486 122.90% 50 (93)10,00<100,00 596 126 49.99% 646 13.13% 105 31.44% 23 957 148.13% 28 (17)100(Default) 2,239 153 44.49% 2,279 100.00% 749 27.88% 49 470 20.64% 635 (1,297)Retail - Mortgage exposures 79,867 4,499 4.99% 80,073 6.09% 1,102,494 17.74% - 8,268 10.33% 907 (1,192)0,00<0,15 58,258 3,219 5.00% 58,412 0.05% 852,045 16.15% - 1,333 2.28% 5 (6)0,15<0,25 3,609 49 4.98% 3,611 0.20% 41,780 22.57% - 347 9.60% 2 (2)0,25<0,50 2,740 410 4.98% 2,760 0.33% 38,939 25.23% - 423 15.31% 2 (3)0,50<0,75 2,097 242 4.98% 2,108 0.50% 28,012 25.26% - 443 20.99% 3 (3)0,75<2,50 4,066 333 4.98% 4,081 1.11% 49,623 22.96% - 1,305 31.98% 10 (15)2,50<10,00 3,981 205 4.98% 3,988 4.76% 45,473 20.58% - 2,642 66.26% 38 (240)

3. rIsksBBVA. PILAR III 2017 P. 73
PD Scale as of 12-31-17 (1)
Original on-balance sheet
gross exposureOff-balance sheet
exposures pre CCF Average CCF (2)
EAD post CRM and post-CCF
Average PD (3)
Number of obligors
Average LGD (4)
Average Maturity (days) (5) RWAs
RWA Density EL
Value adjustments
and provisions10,00<100,00 637 41 4.98% 639 17.89% 7,550 23.08% - 826 129.34% 26 (26)100(Default) 4,478 0 5.10% 4,474 100.00% 39,072 18.35% - 949 21.21% 821 (898)Retail - Other exposures SMEs 3,037 812 60.79% 3,456 13.36% 121,952 54.38% - 1,608 46.54% 241 (198)0,00<0,15 196 175 58.87% 299 0.12% 16,665 54.81% - 37 12.34% 0 (0)0,15<0,25 90 53 61.10% 122 0.20% 5,308 55.92% - 23 18.62% 0 (0)0,25<0,50 186 80 60.95% 234 0.31% 9,094 56.07% - 58 24.97% 0 (0)0,50<0,75 284 116 60.37% 350 0.51% 12,120 54.72% - 116 33.23% 1 (1)0,75<2,50 702 200 63.29% 811 1.20% 26,454 54.22% - 394 48.61% 5 (3)2,50<10,00 1,019 151 61.09% 1,073 4.56% 36,181 55.06% - 713 66.43% 27 (16)10,00<100,00 207 25 57.59% 209 19.80% 7,592 51.55% - 197 94.45% 21 (13)100(Default) 354 12 52.51% 359 100.00% 8,538 52.00% - 70 19.56% 186 (165)Retail - Other exposures Non-SMEs 8,879 19 53.51% 8,885 5.66% 821,034 53.15% - 3,017 33.95% 209 (421)0,00<0,15 3,981 10 57.50% 3,987 0.06% 306,838 53.49% - 358 8.97% 1 (3)0,15<0,25 435 1 53.48% 436 0.19% 47,482 56.72% - 103 23.74% 0 (1)0,25<0,50 727 1 57.41% 728 0.33% 76,924 58.58% - 254 34.88% 1 (2)0,50<0,75 581 1 66.46% 581 0.55% 60,010 58.33% - 273 46.96% 2 (3)0,75<2,50 1,039 2 60.09% 1,038 1.19% 115,016 54.76% - 640 61.66% 7 (9)2,50<10,00 1,596 4 44.74% 1,597 4.35% 160,905 49.55% - 1,204 75.35% 34 (101)10,00<100,00 138 0 56.86% 136 21.62% 17,374 50.89% - 161 117.76% 15 (14)100(Default) 383 1 0.00% 383 100.00% 36,485 38.82% - 25 6.50% 149 (288)Retail - qualifying revolving (QRRE) 6,023 14,603 21.44% 9,154 6.63% 9,374,525 72.87% - 6,764 73.90% 505 (527)0,00<0,15 942 4,804 29.27% 2,348 0.04% 3,132,253 48.08% - 33 1.39% 0 (1)0,15<0,25 16 48 33.95% 32 0.21% 67,924 51.56% - 2 5.86% 0 (0)0,25<0,50 160 355 20.92% 234 0.33% 247,187 63.39% - 26 11.05% 1 (0)0,50<0,75 376 1,745 11.61% 578 0.52% 542,379 76.76% - 108 18.74% 2 (2)0,75<2,50 989 3,059 15.03% 1,449 1.21% 1,234,690 80.05% - 540 37.28% 14 (12)2,50<10,00 2,414 4,057 19.96% 3,224 5.40% 2,872,090 83.71% - 3,549 110.07% 147 (137)10,00<100,00 959 533 30.35% 1,120 21.65% 1,131,749 83.54% - 2,498 222.91% 203 (233)100(Default) 168 0 17.80% 168 100.00% 146,253 82.01% - 9 5.27% 137 (142)Equity 3,390 - 3,390 0.52% - 80.94% - 4,953 146.10% 12 (1,123)0,00<0,15 2,174 - - 2,174 0.14% - 89.86% - 2,604 119.78% 3 0,15<0,25 86 - - 86 0.20% - 65.00% - 88 103.05% 0 0,25<0,50 1 - - 1 0.31% - 65.00% - 1 123.80% 0 0,50<0,75 4 - - 4 0.51% - 65.00% - 5 152.20% 0 0,75<2,50 1,108 - - 1,108 1.25% - 65.00% - 2,212 199.65% 9 2,50<10,00 18 - - 18 2.55% - 65.00% - 41 236.04% 0 10,00<100,00 - - - - - - - - - - - 100(Default) - - - - - - - - - - - Corporate - Specialized lending 7,190 955 77.58 7,931 - 500 0.00% - 7,021 88.53% 234 (109)Total Advanced Approach 206,089 85,560 43.55% 224,504 5.71% 11,479,545 34% 83,577 37% 4,635 (6,975)(1) PD intervals according to RPDR document(2) Calculated as EAD after CCF for off-balance exposures over total off-balance exposure before CCF(3) Corresponds to PD by EAD-weighted debtor category(4) Corresponds to LGD by EAD-weighted debtor category(5) Corresponds to the EAD-weighted debtor expiration in days

3. rIsksBBVA. PILAR III 2017 P. 74
EU CR6 – IRB approach – Credit risk exposures by exposure class and PD range (Million Euros)
PD Scale as of 12-31-16 (1)
Original on-balance sheet
gross exposureOff-balance sheet
exposures pre CCF Average CCF (2)
EAD post CRM and post-CCF
Average PD (3)
Number of obligors
Average LGD (4)
Average Maturity (days) (5) RWAs
RWA Density EL
Value adjustments
and provisionsPrudential portfolios for FIRB approach - - - - - - - - - - - Prudential portfolios for AIRB approach 211,002 87,864 44.09% 229,701 6.52% 11,145,699 33.93% 89,589 39.00% 5,239 (7,873)Central governments or central banks 4,372 651 47.99% 4,684 1.33% 159 27.21% 70 430 9.17% 16 (75)0,00<0,15 3,594 73 49.98% 4,197 0.04% 45 26.08% 64 185 4.40% 1 (2)0,15<0,25 97 205 44.86% 139 0.20% 17 41.76% 42 42 30.14% 0 (0)0,25<0,50 91 48 57.59% 71 0.31% 18 43.62% 59 36 50.05% 0 (0)0,50<0,75 137 24 42.21% 35 0.51% 11 48.98% 113 36 103.36% 0 - 0,75<2,50 30 2 42.04% 31 0.88% 7 50.74% 102 44 142.32% 0 - 2,50<10,00 185 227 50.86% 158 3.98% 38 28.79% 77 80 50.74% 2 (2)10,00<100,00 - 1 52.83% 0 21.22% 4 20.00% 48 0 104.29% 0 (0)100(Default) 237 72 48.93% 53 100.00% 19 24.30% 67 7 13.52% 13 (71)Institutions 26,687 6,393 60.22% 10,394 1.19% 1,631 36.72% 43 3,547 34.12% 50 (58)0,00<0,15 15,729 4,469 60.04% 6,247 0.08% 678 39.06% 48 1,311 20.98% 2 (6)0,15<0,25 2,886 537 64.86% 940 0.20% 147 36.11% 38 308 32.80% 1 (0)0,25<0,50 6,116 958 51.62% 1,719 0.31% 267 28.79% 45 727 42.30% 2 (0)0,50<0,75 673 190 75.82% 536 0.51% 120 33.44% 37 252 46.92% 1 (3)0,75<2,50 651 128 52.92% 598 1.10% 184 36.95% 46 507 84.77% 2 (1)2,50<10,00 310 96 62.23% 225 4.35% 144 38.31% 41 303 134.65% 4 (7)10,00<100,00 75 15 53.06% 44 18.77% 53 46.42% 41 109 249.45% 4 (3)100(Default) 249 1 46.82% 84 100.00% 38 41.65% 61 29 34.82% 35 (38)Corporate SMEs 17,432 3,363 43.35% 18,672 24.86% 41,784 45.24% 63 12,171 65.18% 2,030 (2,751)0,00<0,15 1,014 559 42.84% 1,754 0.12% 3,552 52.12% 80 546 31.12% 1 (8)0,15<0,25 580 205 45.90% 855 0.20% 2,096 52.06% 51 348 40.71% 1 (5)0,25<0,50 1,052 319 45.54% 1,443 0.31% 3,788 50.71% 59 712 49.33% 2 (9)0,50<0,75 1,728 420 42.73% 2,029 0.50% 5,229 46.47% 56 1,248 61.53% 5 (12)0,75<2,50 3,659 734 45.78% 3,728 1.18% 11,415 46.09% 52 2,927 78.51% 20 (30)2,50<10,00 4,585 872 40.64% 4,220 4.29% 10,858 39.71% 56 4,530 107.35% 72 (368)10,00<100,00 411 65 43.14% 289 14.98% 976 36.89% 41 449 155.58% 16 (33)100(Default) 4,403 190 41.36% 4,354 100.00% 3,870 43.93% 93 1,411 32.40% 1,913 (2,287)Corporate Non-SMEs 51,509 55,741 51.15% 79,986 4.67% 11,664 41.79% 62 38,225 47.79% 1,074 (2,365)0,00<0,15 16,853 28,921 50.46% 33,207 0.11% 2,634 43.04% 74 9,395 28.29% 15 (32)0,15<0,25 6,306 7,625 49.04% 10,120 0.20% 1,180 43.36% 39 4,355 43.04% 9 (67)0,25<0,50 9,000 8,472 52.33% 13,110 0.31% 1,780 43.14% 60 6,961 53.09% 17 (36)0,50<0,75 6,265 6,571 54.65% 9,312 0.50% 1,781 41.35% 56 5,981 64.23% 19 (38)0,75<2,50 6,056 2,613 53.94% 6,986 1.07% 1,897 41.33% 52 6,142 87.91% 31 (23)2,50<10,00 3,278 976 46.14% 3,286 3.33% 1,543 38.42% 49 3,624 110.29% 42 (198)10,00<100,00 545 254 55.24% 671 17.46% 102 28.37% 47 1,018 151.75% 38 (25)100(Default) 3,205 309 50.48% 3,295 100.00% 747 27.38% 52 750 22.76% 902 (1,947)Retail - Mortgage exposures 83,659 5,190 4.98% 83,894 6.00% 1,142,943 18.66% - 10,690 12.74% 983 (1,595)0,00<0,15 56,559 3,732 4.98% 56,738 0.05% 811,018 17.43% - 1,504 2.65% 5 (25)0,15<0,25 3,205 50 4.98% 3,207 0.21% 37,146 22.34% - 309 9.62% 1 (2)0,25<0,50 4,529 448 4.98% 4,551 0.31% 67,560 21.52% - 584 12.84% 3 (9)0,50<0,75 3,133 260 4.98% 3,146 0.52% 44,265 21.84% - 578 18.38% 4 (6)0,75<2,50 5,285 417 4.98% 5,303 1.14% 68,893 21.71% - 1,625 30.65% 13 (28)2,50<10,00 5,327 218 4.98% 5,333 4.84% 61,633 20.85% - 3,629 68.04% 53 (507)

3. rIsksBBVA. PILAR III 2017 P. 75
PD Scale as of 12-31-16 (1)
Original on-balance sheet
gross exposureOff-balance sheet
exposures pre CCF Average CCF (2)
EAD post CRM and post-CCF
Average PD (3)
Number of obligors
Average LGD (4)
Average Maturity (days) (5) RWAs
RWA Density EL
Value adjustments
and provisions10,00<100,00 1,198 65 4.98% 1,201 19.63% 14,103 22.51% - 1,536 127.90% 53 (78)100(Default) 4,423 0 4.52% 4,415 100.00% 38,325 19.27% - 924 20.94% 851 (939)Retail - Other exposures SMEs 2,621 676 61.44% 3,033 8.64% 97,469 60.08% - 1,500 49.46% 164 (137)0,00<0,15 62 38 58.40% 84 0.14% 3,739 58.75% - 12 14.75% 0 (1)0,15<0,25 97 53 60.27% 129 0.20% 4,902 59.23% - 25 19.38% 0 (1)0,25<0,50 208 92 61.01% 265 0.31% 9,016 58.94% - 68 25.75% 0 (2)0,50<0,75 319 99 62.44% 380 0.51% 11,766 60.41% - 135 35.49% 1 (4)0,75<2,50 843 228 61.87% 984 1.20% 30,884 60.13% - 515 52.34% 7 (12)2,50<10,00 818 150 60.63% 907 4.30% 31,380 60.03% - 631 69.64% 23 (21)10,00<100,00 80 15 73.12% 90 15.08% 1,862 56.06% - 80 88.43% 8 (9)100(Default) 194 2 45.05% 195 100.00% 3,920 64.03% - 34 17.31% 125 (88)Retail - Other exposures Non-SMEs 7,053 6 42.37% 7,055 6.84% 714,520 52.79% - 2,523 35.76% 207 (333)0,00<0,15 2,924 1 32.49% 2,924 0.06% 239,268 53.75% - 261 8.92% 1 (3)0,15<0,25 298 0 34.16% 298 0.19% 37,016 57.27% - 72 24.00% 0 (1)0,25<0,50 542 1 51.10% 542 0.32% 63,309 57.99% - 185 34.15% 1 (2)0,50<0,75 480 1 53.99% 480 0.56% 55,567 57.45% - 224 46.55% 2 (3)0,75<2,50 849 1 51.99% 849 1.20% 104,404 54.29% - 521 61.32% 5 (7)2,50<10,00 1,452 1 49.85% 1,452 4.40% 162,027 48.89% - 1,079 74.29% 31 (34)10,00<100,00 136 0 27.63% 136 21.68% 18,757 50.14% - 156 115.30% 15 (23)100(Default) 373 1 0.00% 373 100.00% 34,172 40.80% - 25 6.81% 152 (260)Retail - qualifying revolving (QRRE) 5,931 14,391 23.42% 9,302 6.62% 9,135,528 74.41% - 7,376 79.29% 499 (512)0,00<0,15 685 3,975 31.09% 1,921 0.04% 2,595,733 48.38% - 27 1.41% 0 (1)0,15<0,25 13 42 34.86% 28 0.21% 55,043 52.34% - 2 5.96% 0 (0)0,25<0,50 85 129 30.46% 125 0.30% 168,343 50.79% - 10 7.98% 0 (0)0,50<0,75 366 1,540 12.90% 564 0.51% 441,285 77.83% - 103 18.22% 2 (2)0,75<2,50 997 3,564 17.34% 1,615 1.19% 1,344,096 80.55% - 611 37.81% 15 (12)2,50<10,00 2,692 4,554 23.57% 3,766 5.32% 3,176,974 83.46% - 4,149 110.17% 168 (153)10,00<100,00 948 586 32.58% 1,139 21.62% 1,225,741 80.72% - 2,469 216.80% 199 (221)100(Default) 146 0 24.14% 146 100.00% 128,313 77.81% - 6 4.20% 113 (124)Equity 3,592 - - 3,592 0.18% - 87.90% - 4,896 136.30% 6 (47)0,00<0,15 2,412 - - 2,412 0.14% - 89.33% - 2,866 118.83% 3 (47)0,15<0,25 769 - - 769 0.20% - 85.54% - 1,342 174.46% 1 - 0,25<0,50 316 - - 316 0.31% - 89.61% - 543 171.90% 1 - 0,50<0,75 95 - - 95 0.51% - 65.00% - 144 152.23% 0 - 0,75<2,50 - - - - - - - - - - - - 2,50<10,00 - - - - - - - - - - - - 10,00<100,00 - - - - - - - - - - 0 - 100(Default) - - - - - - - - - - - - Corporate - Specialized lending 8,145 1,453 1 9,089 - 1 - - 8,233 90.59% 211 - Total Advanced Approach 211,002 87,864 44.09% 229,701 6.52% 11,145,699 33.93% 89,589 39.00% 5,239 (7,873)(1) PD intervals according to RPDR document(2) Calculated as EAD after CCF for off-balance exposures over total off-balance exposure before CCF(3) Corresponds to PD by EAD-weighted debtor category(4) Corresponds to LGD by EAD-weighted debtor category(5) Corresponds to the EAD-weighted debtor expiration in days

3. rIsksBBVA. PILAR III 2017 P. 76
With the aim of providing calculation data for the validation of the reliability of calculating PD, the table below gives a comparison of the PDs used in calculating the IRB capital with the effective default rates of the Group’s obligors for credit and counterparty risks, for the Group’s main geographic areas (BBVA S.A. and Bancomer).
Specifically, the table compares the PD used in calculating capital by the advanced approach with the effective default rates of obligors.
The criteria adopted for presenting the information of the standard EBA table are as follows:
Portfolio: The breakdown of the portfolios corresponds to that recommended by the supervisor, excluding the equity positions.
PD scale: Corresponds to the master rating scale in section 3.2.5.1.2 (Table 28).
External rating equivalent: Uses the equivalence between the PDs and the external ratings described in section 3.2.5.1.2.
Weighted PD and arithmetic average PD by obligors: Uses the PD after mitigation, i.e. which associated with guarantors.
Number of obligors: Presents the obligors at the close of the year and at the close of the previous year.
Defaulted obligors: For the purpose of guaranteeing the traceability of the table, columns “g” and “h” of the standard table have been combined to report the information on transactions/customers that defaulted at some time in the last 12 months, so that the defaulted obligors in the last year are shown for each PD range.
Average historical annual default rate: This presents the annual default rate of the last five years.
Table 31. EU CR9 – IRB approach – Backtesting of PD per exposure class (BBVA S.A. 12-31-17)
PD RangeExternal rating equivalent
Weighted average PD
Arithmetic average PD by
obligors
Number of obligors Defaulted obligors in the
yearAverage historical
annual default rateDecember 31,
2017 December 31,
2016 Central governments or central banks 0.00<0.02 AAA 0.01% 0.01% 4 4 - -0.02<0.03 AA+ 0.02% 0.02% 2 2 - -0.03<0.04 AA 0.03% 0.03% - 1 - -0.04<0.05 AA- 0.04% 0.04% 9 4 - -0.05<0.06 A+ 0.05% 0.05% 6 3 - -0.06<0.09 A 0.08% 0.08% - 21 - -0.09<0.11 A- 0.10% 0.10% 8 7 - -0.11<0.17 BBB+ 0.14% 0.14% 9 5 - -0.17<0.24 BBB 0.20% 0.20% 20 19 - -0.24<0.39 BBB- 0.30% 0.30% 7 19 - -0.39<0.67 BB+ 0.52% 0.53% 7 12 - -0.67<1.16 BB 0.88% 0.88% 2 7 - -1.16<1.94 BB- 1.50% 1.50% 7 3 - 50.00%1.94<3.35 B+ 2.55% 2.55% 13 30 - 14.29%3.35<5.81 B 4.41% 4.41% 20 2 - -5.81<10.61 B- 7.85% 7.85% 8 6 1 20.00%10.61<100,00 C 21.22% 21.22% 2 4 - -100.00 (Default) D 100.00% 100.00% 14 19 - -Institutions 0.00<0.02 AAA 0.03% 0.03% 9 13 - -0.02<0.03 AA+ 0.03% 0.03% 9 10 - -0.03<0.04 AA 0.03% 0.03% 22 16 - -0.04<0.05 AA- 0.04% 0.04% 78 100 - -0.05<0.06 A+ 0.05% 0.05% 244 215 - -0.06<0.09 A 0.08% 0.08% 238 188 - -0.09<0.11 A- 0.10% 0.10% 479 486 - 0.01%0.11<0.17 BBB+ 0.14% 0.14% 1,190 1,183 1 0.01%0.17<0.24 BBB 0.20% 0.20% 754 784 1 0.02%0.24<0.39 BBB- 0.31% 0.31% 360 421 - 0.43%0.39<0.67 BB+ 0.51% 0.51% 226 277 1 0.07%0.67<1.16 BB 0.88% 0.88% 107 202 1 2.02%1.16<1.94 BB- 1.50% 1.50% 170 100 - -1.94<3.35 B+ 2.55% 2.54% 76 88 1 0.59%3.35<5.81 B 4.41% 4.41% 31 54 2 4.08%5.81<10.61 B- 7.86% 8.01% 42 41 1 -10.61<100 C 19.78% 19.67% 22 79 - -100.00 (Default) D 100.00% 100.00% 91 77 - -Corporate - SMEs 0.00<0.02 AAA 0.03% 0.03% 104 21 - -0.02<0.03 AA+ 0.03% 0.03% 18 5 - 9.09%

3. rIsksBBVA. PILAR III 2017 P. 77
PD RangeExternal rating equivalent
Weighted average PD
Arithmetic average PD by
obligors
Number of obligors Defaulted obligors in the
yearAverage historical
annual default rateDecember 31,
2017 December 31,
2016 0.03<0.04 AA 0.03% 0.03% 12 7 - -0.04<0.05 AA- 0.05% 0.05% 40 - - -0.05<0.06 A+ 0.05% 0.05% 13 7 - -0.06<0.09 A 0.07% 0.07% 26 5 - -0.09<0.11 A- 0.10% 0.10% 2,814 1,815 1 0.07%0.11<0.17 BBB+ 0.14% 0.14% 2,469 1,917 4 0.15%0.17<0.24 BBB 0.20% 0.20% 2,342 2,238 3 0.08%0.24<0.39 BBB- 0.31% 0.31% 4,029 3,870 9 0.37%0.39<0.67 BB+ 0.51% 0.51% 5,146 5,041 16 0.59%0.67<1.16 BB 0.88% 0.88% 5,420 5,396 39 1.05%1.16<1.94 BB- 1.50% 1.50% 4,910 5,009 55 0.45%1.94<3.35 B+ 2.55% 2.54% 4,469 4,549 92 3.04%3.35<5.81 B 4.41% 4.41% 2,979 2,776 76 9.98%5.81<10.61 B- 8.47% 8.58% 2,961 2,967 197 3.36%10.61<100 C 15.56% 16.36% 1,553 1,009 71 9.24%100.00 (Default) D 100.00% 100.00% 4,191 3,959 - -Corporate - Non-SMEs 0.00<0.02 AAA - - - - - -0.02<0.03 AA+ 0.03% 0.03% 26 - - -0.03<0.04 AA 0.03% 0.03% 30 - - 3.03%0.04<0.05 AA- 0.04% 0.04% 21 - - 4.17%0.05<0.06 A+ 0.05% 0.05% 43 - 1 7.69%0.06<0.09 A 0.08% 0.08% 296 - 2 1.16%0.09<0.11 A- 0.10% 0.10% 977 - - 0.01%0.11<0.17 BBB+ 0.14% 0.14% 1,575 - 9 0.02%0.17<0.24 BBB 0.20% 0.20% 1,504 - 3 0.10%0.24<0.39 BBB- 0.31% 0.31% 2,223 - 4 0.33%0.39<0.67 BB+ 0.51% 0.51% 1,991 - 13 0.44%0.67<1.16 BB 0.88% 0.88% 1,190 - 9 1.24%1.16<1.94 BB- 1.51% 1.50% 711 - 3 3.74%1.94<3.35 B+ 2.55% 2.55% 678 - 12 3.61%3.35<5.81 B 4.41% 4.41% 369 - 27 13.13%5.81<10.61 B- 9.18% 9.21% 185 - 31 1.38%10.61<100 C 14.10% 18.89% 72 - 17 23.24%100.00 (Default) D 100.00% 100.00% 551 - - -Retail - Mortgage exposures 0.00<0.02 AAA 0.03% 0.03% 425,773 345,748 71 0.02%0.02<0.03 AA+ 0.03% 0.03% 91,467 81,098 65 0.08%0.03<0.04 AA 0.03% 0.03% 15,066 15,798 11 0.04%0.04<0.05 AA- 0.05% 0.05% 137,763 114,384 89 0.07%0.05<0.06 A+ 0.06% 0.06% 12,625 42,790 19 0.06%0.06<0.09 A 0.07% 0.07% 79,387 68,091 89 0.20%0.09<0.11 A- 0.09% 0.09% 32,317 64,817 67 0.20%0.11<0.17 BBB+ 0.14% 0.14% 57,647 78,292 165 0.22%0.17<0.24 BBB 0.20% 0.21% 41,780 37,146 119 0.39%0.24<0.39 BBB- 0.33% 0.32% 38,939 67,560 207 0.43%0.39<0.67 BB+ 0.50% 0.52% 28,012 44,265 218 0.90%0.67<1.16 BB 0.82% 0.84% 26,559 38,006 353 1.49%1.16<1.94 BB- 1.67% 1.68% 23,064 30,887 513 2.59%1.94<3.35 B+ 2.72% 2.71% 16,889 23,370 888 5.36%3.35<5.81 B 3.85% 3.85% 11,762 16,126 1,347 12.17%5.81<10.61 B- 7.29% 7.25% 16,822 22,131 2,451 14.89%10.61<100 C 17.89% 18.29% 7,550 14,107 2,368 37.61%100.00 (Default) D 100.00% 100.00% 39,072 38,327 - -Retail - Other exposures SMEs 0.00<0.02 AAA - - - - - -0.02<0.03 AA+ - - - - - -0.03<0.04 AA - - - - - -0.04<0.05 AA- - - - - - -0.05<0.06 A+ - - - - - -0.06<0.09 A - - - 1 - -0.09<0.11 A- 0.10% 0.10% 11,473 314 - -0.11<0.17 BBB+ 0.14% 0.14% 5,331 3,440 2 0.10%0.17<0.24 BBB 0.20% 0.20% 5,349 4,947 10 0.07%0.24<0.39 BBB- 0.31% 0.31% 9,193 9,106 31 0.22%0.39<0.67 BB+ 0.51% 0.51% 12,242 11,898 70 0.21%0.67<1.16 BB 0.88% 0.88% 13,614 15,030 138 0.63%1.16<1.94 BB- 1.50% 1.50% 13,238 16,388 239 1.10%1.94<3.35 B+ 2.55% 2.55% 14,627 14,503 309 1.64%3.35<5.81 B 4.41% 4.41% 12,355 9,565 432 2.88%5.81<10.61 B- 8.00% 8.07% 9,971 7,932 643 4.82%10.61<100 C 19.83% 19.43% 7,795 1,892 244 4.01%100.00 (Default) D 100.00% 100.00% 8,653 3,920 - -

3. rIsksBBVA. PILAR III 2017 P. 78
PD RangeExternal rating equivalent
Weighted average PD
Arithmetic average PD by
obligors
Number of obligors Defaulted obligors in the
yearAverage historical
annual default rateDecember 31,
2017 December 31,
2016 Retail - Other exposures Non-SMEs 0.00<0.02 AAA 0.03% 0.03% 109,370 84,643 39 0.01%0.02<0.03 AA+ 0.03% 0.03% 12,758 12,793 14 0.02%0.03<0.04 AA 0.03% 0.03% 30,512 29,546 4 0.01%0.04<0.05 AA- 0.05% 0.05% 782 1,358 6 0.00%0.05<0.06 A+ 0.05% 0.05% 14,125 16 13 0.04%0.06<0.09 A 0.07% 0.07% 52,443 43,750 65 0.07%0.09<0.11 A- 0.10% 0.10% 20,076 14,501 37 0.13%0.11<0.17 BBB+ 0.13% 0.13% 66,777 52,661 99 0.12%0.17<0.24 BBB 0.19% 0.19% 47,482 37,017 166 0.27%0.24<0.39 BBB- 0.33% 0.33% 76,925 63,309 354 0.36%0.39<0.67 BB+ 0.55% 0.55% 60,011 55,569 433 0.66%0.67<1.16 BB 0.88% 0.88% 60,232 54,822 689 0.37%1.16<1.94 BB- 1.52% 1.52% 54,792 49,584 803 1.78%1.94<3.35 B+ 2.62% 2.62% 58,578 56,271 1,178 1.30%3.35<5.81 B 4.48% 4.48% 72,510 73,417 2,393 2.75%5.81<10.61 B- 7.39% 7.44% 29,825 32,343 1,760 7.49%10.61<100 C 21.62% 21.46% 17,376 18,758 4,144 27.52%100.00 (Default) D 100.00% 100.00% 36,485 34,172 - -Retail - qualifying revolving (QRRE) 0.00<0.02 AAA 0.03% 0.03% 2,329,553 1,910,664 368 0.01%0.02<0.03 AA+ 0.03% 0.03% 200,306 173,347 154 0.06%0.03<0.04 AA 0.03% 0.03% 74,047 59,020 82 0.08%0.04<0.05 AA- 0.04% 0.04% 103,172 81,096 93 0.07%0.05<0.06 A+ 0.05% 0.05% 62,530 54,909 105 0.13%0.06<0.09 A 0.07% 0.07% 126,848 115,188 285 0.16%0.09<0.11 A- 0.10% 0.10% 64,513 51,810 118 0.18%0.11<0.17 BBB+ 0.14% 0.14% 171,283 149,699 668 0.31%0.17<0.24 BBB 0.21% 0.20% 67,924 55,043 163 0.27%0.24<0.39 BBB- 0.30% 0.30% 195,989 168,340 1,071 0.45%0.39<0.67 BB+ 0.49% 0.51% 137,800 113,095 1,122 0.76%0.67<1.16 BB 0.91% 0.93% 168,930 154,058 2,342 1.17%1.16<1.94 BB- 1.58% 1.55% 71,915 60,458 1,184 1.89%1.94<3.35 B+ 2.62% 2.60% 121,293 101,689 3,121 2.43%3.35<5.81 B 4.37% 4.39% 64,420 57,992 2,189 3.87%5.81<10.61 B- 7.43% 7.45% 46,855 46,302 2,785 5.15%10.61<100 C 14.77% 15.53% 33,622 19,226 2,639 8.89%100.00 (Default) D 100.00% 100.00% 33,994 22,497 - -Corporate - Especialized lending 861 840 3
EU CR9 – IRB approach – Backtesting of PD per exposure class (Bancomer. 12-31-17)
PD RangeExternal rating equivalent
Weighted average PD
Arithmetic average PD by
obligors
Number of obligors Defaulted obligors in the
yearAverage historical
annual default rateDecember 31,
2017 December 31,
2016 Corporate - SMEs 0.00<0.02 AAA - - - - - -0.02<0.03 AA+ 0.03% 0.03% - - - -0.03<0.04 AA 0.04% 0.04% - - - -0.04<0.05 AA- 0.05% 0.05% - - - -0.05<0.06 A+ 0.06% 0.06% - - - -0.06<0.09 A 0.08% 0.08% - - - -0.09<0.11 A- 0.10% 0.10% - - - -0.11<0.17 BBB+ 0.14% - - - - -0.17<0.24 BBB 0.20% 0.20% 138 8 - -0.24<0.39 BBB- 0.31% 0.31% 358 158 - -0.39<0.67 BB+ 0.53% 0.53% 517 502 - -0.67<1.16 BB 0.85% 0.85% 492 799 - -1.16<1.94 BB- 1.42% 1.42% 338 892 - -1.94<3.35 B+ 2.46% 2.46% 249 664 - -3.35<5.81 B 4.12% 4.12% 111 265 - -5.81<10.61 B- 7.34% 7.38% 63 132 - -10.61<100,00 C 15.42% 15.42% 30 4 - -100.00 (Default) D - - - - - -Corporate - Non-SMEs 0.00<0.02 AAA - - - - - -0.02<0.03 AA+ - - - - - -0.03<0.04 AA - - - - - -

3. rIsksBBVA. PILAR III 2017 P. 79
PD RangeExternal rating equivalent
Weighted average PD
Arithmetic average PD by
obligors
Number of obligors Defaulted obligors in the
yearAverage historical
annual default rateDecember 31,
2017 December 31,
2016 0.04<0.05 AA- - - - - - -0.05<0.06 A+ 0.05% 0.05% 2 1 - -0.06<0.09 A 0.08% 0.08% 15 7 - -0.09<0.11 A- 0.10% 0.10% 14 4 - -0.11<0.17 BBB+ 0.13% 0.13% 66 16 - -0.17<0.24 BBB 0.18% 0.18% 124 48 - -0.24<0.39 BBB- 0.11% 0.11% 348 183 4 -0.39<0.67 BB+ 0.44% 0.44% 513 175 11 0.91%0.67<1.16 BB 0.84% 0.84% 439 180 22 1.94%1.16<1.94 BB- 1.24% 1.24% 393 223 23 1.46%1.94<3.35 B+ 2.40% 2.40% 301 187 12 1.15%3.35<5.81 B 4.20% 4.20% 172 100 14 3.06%5.81<10.61 B- 7.97% 7.97% 95 46 7 3.88%10.61<100 C - - 36 9 - 6.25%100.00 (Default) D 100.00% 100.00% 216 166Retail - qualifying revolving (QRRE) 0.00<0.02 AAA - - - - - -0.02<0.03 AA+ - - - - - -0.03<0.04 AA - - - - - -0.04<0.05 AA- - - - - - -0.05<0.06 A+ - - - - - -0.06<0.09 A - - - - - -0.09<0.11 A- - - - - - -0.11<0.17 BBB+ 0.15% 0.15% 1 - - -0.17<0.24 BBB - - - - - -0.24<0.39 BBB- 0.38% 0.38% 51,198 3 - 0.15%0.39<0.67 BB+ 0.53% 0.53% 404,579 328,190 777 0.21%0.67<1.16 BB 0.89% 0.89% 452,764 572,130 2,292 0.42%1.16<1.94 BB- 1.52% 1.52% 541,081 557,450 4,149 0.74%1.94<3.35 B+ 2.63% 2.63% 692,988 831,725 8,682 1.12%3.35<5.81 B 4.56% 4.56% 803,451 961,825 14,869 1.64%5.81<10.61 B- 7.92% 7.92% 1,143,083 1,177,441 25,234 1.92%10.61<100 C 21.80% 21.80% 1,098,127 1,206,515 42,675 3.22%100.00 (Default) D 100.00% 100.00% 112,259 105,816
The information contained in the above tables is set out below in graphic format (including counterparty risk):
Chart 7: Advanced measurement approach: EAD by obligor category
6,606
74,199
109,707103,291
3,5928,131
75,314
103,323 101,576
3,390
CentralGovernments or
Central Banks
Institutions SMEs Retail Equity
EAD by category 2016 EAD by category 2017
Chart 8: Advanced measurement approach: Average weighted PD by EAD
1.1%0.4%
8.5%
6.2%
0.2%0.7% 0.3%
6.6% 6.3%
0.5%
CentralGovernments or
Central Banks
Institutions SMEs Retail Equity
Weighted average PD by EAD 2016 Weighted average PD by EAD 2017

3. rIsksBBVA. PILAR III 2017 P. 80
Chart 9: Advanced measurement approach: Average weighted LGD by EAD
29.0%
13.3%
42.5%
28.0%
79.0%
26.1%15.1%
42.9%
27.1%
80.9%
CentralGovernments or
Central Banks
Institutions SMEs Retail Equity
Weighted average LGD by EAD 2016 Weighted average LGD by EAD 2017
Chart 10: Advanced measurement approach: RWAs by obligor category
5526,114
60,983
22,091
4,8961,172
5,931
56,643
19,662
4,953
CentralGovernments
or CentralBanks
Institutions SMEs Retail Equity
RWAs by ca tegory 2017RWAs by category 2016 RWAs density by category 2017
The following table presents the main variations in the year in terms of RWAs for the Credit Risk and Counterparty advanced measurement approach:
Table 32. EU CR8 – RWA flow statements of credit risk exposures under the IRB approach (Million Euros)
Credit Risk Counterparty Credit RiskRWA amounts Capital Requirements RWA amounts Capital Requirements
RWAs as of December 31, 2016 84,694 6,776 5,048 404 Asset size 492 39 34 3 Asset quality (2,055) (164) (182) (15)Model updates 568 45 - - Methodology and policy - - - - Acquisitions and disposals (2,271) (182) - - Foreign exchange movements (3,015) (241) (116) (9)Other 211 17 - - RWAs as of December 31, 2017 78,624 6,290 4,784 383
2 The LGD (PIT) methodology allows for a better measurement of observed losses. For more recent years, given that the recovery processes have not concluded, the best estimate of final LGD is included.
Risk-weighted assets in exposures subject to the internal model declined in 2017 by €6.334 billion. This reduction is affected by: the general appreciation of the euro (particularly significant due to its impact on portfolios denominated in dollars and Mexican pesos), which has had an impact of -€3.131 billion, or nearly 50% of the total reduction; the improved credit portfolio profile, the sale of some non-strategic assets, mainly the portfolio of fixed-income instruments, which have offset the organic growth, and the update of the model carried out in Bancomer’s Corporates portfolio.
3.2.5.3. Comparative analysis of the estimations made
The following charts compare the expected loss adjusted to the cycle calculated according to the Group’s internal estimates for the main portfolios approved by the European Central Bank, with the effective loss incurred between 2001 and 2017. They also present the average effective loss between 2001 and 2017 in accordance with the following:
Expected loss: expected regulatory loss calculated with the internal estimates based on calibrations in force as of 2017, and adapted to the economic cycle, i.e. the annual average expected loss in an economic cycle.
Observed loss: effective loss calculated as the ratio of gross additions to NPA over the average observed exposure multiplied by the estimated point in time severity2.
Average: effective average loss (2001-2017), which is the average of effective losses for each year (light blue solid line).
The effective loss is the annual loss incurred. It must be less than the expected loss adjusted to the cycle in the best years of an economic cycle, and greater during years of crisis.
The comparison has been made for the portfolios of Mortgages, Consumer Finance Credit Cards and (2004-2017) Autos (retail), and SMEs and Developers (2009-2017), all of them in Spain and Portugal. In Mexico, the comparison

3. rIsksBBVA. PILAR III 2017 P. 81
has been carried out for the Credit Card portfolio (2006-2017 window) and SMEs and Large Companies (2006-2017 window). Regarding the categories of Institutions (Public and Financial Institutions) and Corporates, historical experience shows that there is such a small number of defaulted exposures (Low Default Portfolios) that it is not statistically significant, and hence the reason the comparison is not shown.
The charts show that during the years of biggest economic growth, in general the effective loss was significantly lower than the expected loss adjusted to the cycle calculated using internal models.
The contrary was the case after the start of the crisis. This is in line with the major economic slowdown and the financial difficulties of households and companies, above all in the case of developers and construction companies.
The fact that in some portfolios the average observed loss is greater than the estimated loss is consistent with the fact that the observed time window may be worse than what would be expected in a complete economic cycle. In fact, this window has fewer expansive years than crisis years. This is not representative of a complete economic cycle.
Retail Mortgages:
Starting in 2007, the effective losses are above the expected loss adjusted to the cycle, as they are losses incurred in years of crisis. The effective losses are lower than that adjusted to the cycle, demonstrating the conservative nature of the regulatory estimate.
Chart 11: Comparative analysis of expected loss: Retail mortgages
0.0%
0.1%
0.2%
0.3%
0.4%
0.5%
0.6%
0.7%
0.8%
2001 2003 2005 2007 2009 2011 2013 2015 2017
Observed Loss Average Expected Loss
Consumer finance
The chart shows that during the years of biggest economic growth the effective loss was lower than the expected loss adjusted to the cycle. The contrary was the case starting in 2007. This is in line with the major economic slowdown and the financial difficulties of households. In any case, the comparison between the expected loss adjusted to the cycle and effective loss shows conservative levels.
Chart 12: Comparative analysis of expected loss: Consumer finance
0.0%
2.0%
4.0%
6.0%
8.0%
2001 2003 2005 2007 2009 2011 2013 2015 2017
Observed Loss Average Expected Loss
Credit cards:
As in the case of Mortgages and Consumer Finance, the observed loss is lower than the Expected Loss adjusted to the cycle calculated using internal models at best periods of the cycle, and higher during its worst periods.
Chart 13: Comparative analysis of expected loss: Credit cards
0.0%
0.2%
0.4%
0.6%
0.8%
1.0%
1.2%
1.4%
1.6%
2004 2006 2008 2010 2012 2014 2016
Observed Loss Average Expected Loss
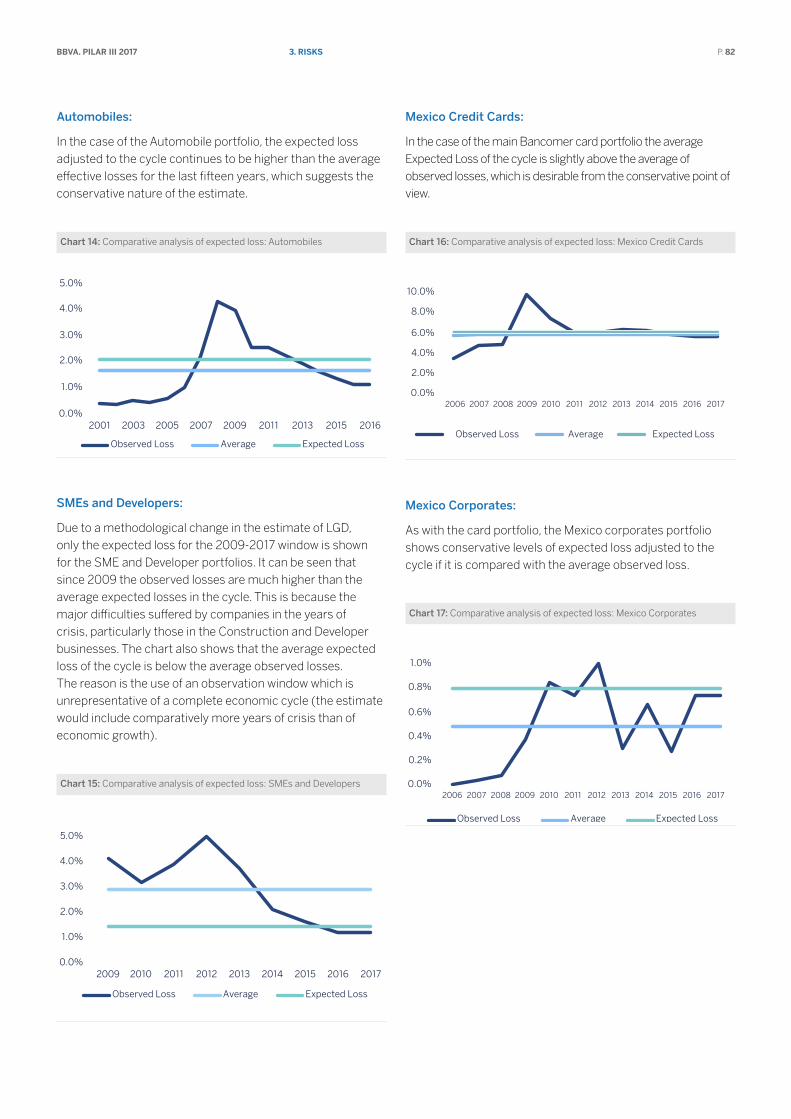
3. rIsksBBVA. PILAR III 2017 P. 82
Automobiles:
In the case of the Automobile portfolio, the expected loss adjusted to the cycle continues to be higher than the average effective losses for the last fifteen years, which suggests the conservative nature of the estimate.
Chart 14: Comparative analysis of expected loss: Automobiles
0.0%
1.0%
2.0%
3.0%
4.0%
5.0%
2001 2003 2005 2007 2009 2011 2013 2015 2016
Observed Loss Average Expected Loss
SMEs and Developers:
Due to a methodological change in the estimate of LGD, only the expected loss for the 2009-2017 window is shown for the SME and Developer portfolios. It can be seen that since 2009 the observed losses are much higher than the average expected losses in the cycle. This is because the major difficulties suffered by companies in the years of crisis, particularly those in the Construction and Developer businesses. The chart also shows that the average expected loss of the cycle is below the average observed losses. The reason is the use of an observation window which is unrepresentative of a complete economic cycle (the estimate would include comparatively more years of crisis than of economic growth).
Chart 15: Comparative analysis of expected loss: SMEs and Developers
0.0%
1.0%
2.0%
3.0%
4.0%
5.0%
6.0%
2009 2010 2011 2012 2013 2014 2015 2016 2017
Observed Loss Average Expected Loss
Mexico Credit Cards:
In the case of the main Bancomer card portfolio the average Expected Loss of the cycle is slightly above the average of observed losses, which is desirable from the conservative point of view.
Chart 16: Comparative analysis of expected loss: Mexico Credit Cards
12.0%
10.0%
8.0%
6.0%
4.0%
2.0%
0.0%2006 2007 2008 2009 2010 2011 2012 2013 2014 2015 2016 2017
Observed Loss Average Expected Loss
Mexico Corporates:
As with the card portfolio, the Mexico corporates portfolio shows conservative levels of expected loss adjusted to the cycle if it is compared with the average observed loss.
Chart 17: Comparative analysis of expected loss: Mexico Corporates
0.0%
0.2%
0.4%
0.6%
0.8%
1.0%
1.2%
2006 2007 2008 2009 2010 2011 2012 2013 2014 2015 2016 2017
Observed Loss Average Expected Loss
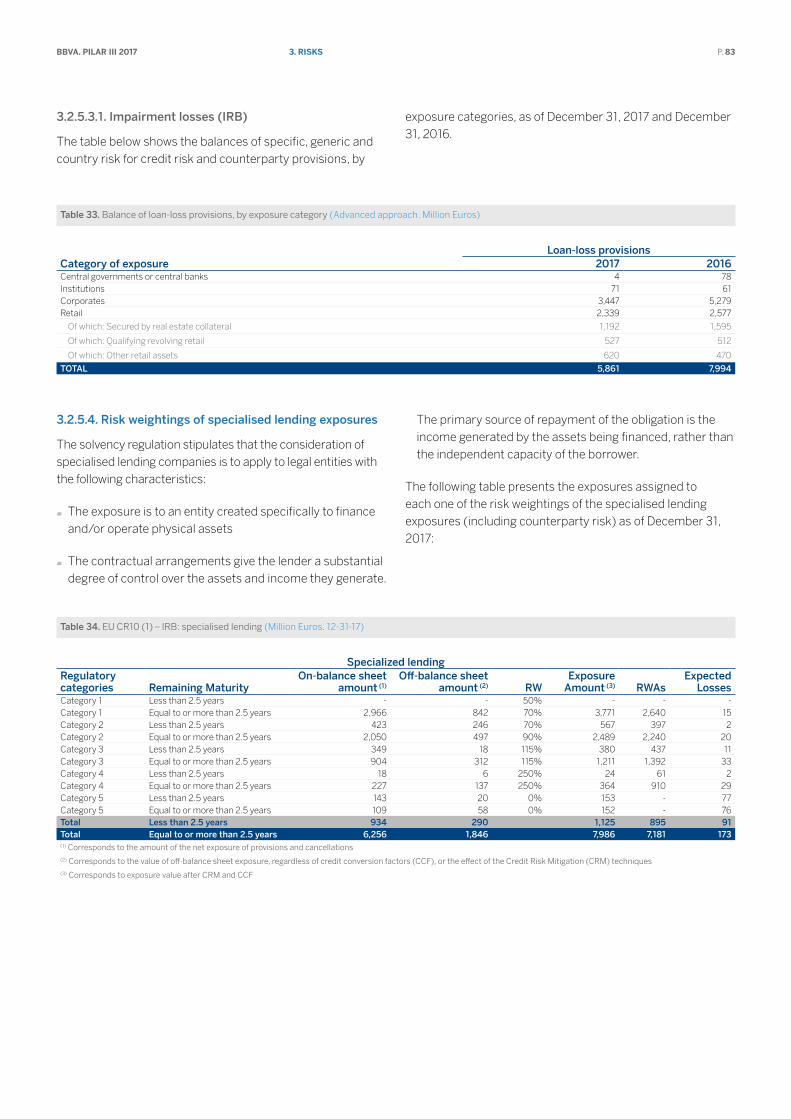
3. rIsksBBVA. PILAR III 2017 P. 83
3.2.5.3.1. Impairment losses (IRB)
The table below shows the balances of specific, generic and country risk for credit risk and counterparty provisions, by
exposure categories, as of December 31, 2017 and December 31, 2016.
Table 33. Balance of loan-loss provisions, by exposure category (Advanced approach. Million Euros)
Category of exposure Loan-loss provisions
2017 2016Central governments or central banks 4 78Institutions 71 61Corporates 3,447 5,279Retail 2,339 2,577
Of which: Secured by real estate collateral 1,192 1,595
Of which: Qualifying revolving retail 527 512
Of which: Other retail assets 620 470
TOTAL 5,861 7,994
3.2.5.4. Risk weightings of specialised lending exposures
The solvency regulation stipulates that the consideration of specialised lending companies is to apply to legal entities with the following characteristics:
The exposure is to an entity created specifically to finance and/or operate physical assets
The contractual arrangements give the lender a substantial degree of control over the assets and income they generate.
The primary source of repayment of the obligation is the income generated by the assets being financed, rather than the independent capacity of the borrower.
The following table presents the exposures assigned to each one of the risk weightings of the specialised lending exposures (including counterparty risk) as of December 31, 2017:
Table 34. EU CR10 (1) – IRB: specialised lending (Million Euros. 12-31-17)
Specialized lendingRegulatory categories Remaining Maturity
On-balance sheet amount (1)
Off-balance sheet amount (2) RW
Exposure Amount (3) RWAs
Expected Losses
Category 1 Less than 2.5 years - - 50% - - - Category 1 Equal to or more than 2.5 years 2,966 842 70% 3,771 2,640 15 Category 2 Less than 2.5 years 423 246 70% 567 397 2 Category 2 Equal to or more than 2.5 years 2,050 497 90% 2,489 2,240 20 Category 3 Less than 2.5 years 349 18 115% 380 437 11 Category 3 Equal to or more than 2.5 years 904 312 115% 1,211 1,392 33 Category 4 Less than 2.5 years 18 6 250% 24 61 2 Category 4 Equal to or more than 2.5 years 227 137 250% 364 910 29 Category 5 Less than 2.5 years 143 20 0% 153 - 77 Category 5 Equal to or more than 2.5 years 109 58 0% 152 - 76 Total Less than 2.5 years 934 290 1,125 895 91 Total Equal to or more than 2.5 years 6,256 1,846 7,986 7,181 173 (1) Corresponds to the amount of the net exposure of provisions and cancellations(2) Corresponds to the value of off-balance sheet exposure, regardless of credit conversion factors (CCF), or the effect of the Credit Risk Mitigation (CRM) techniques(3) Corresponds to exposure value after CRM and CCF

3. rIsksBBVA. PILAR III 2017 P. 84
EU CR10 (1) – IRB: specialised lending (Million Euros. 12-31-16)(4)
Specialized lendingRegulatory categories Remaining Maturity
On-balance sheet amount (1)
Off-balance sheet amount (2) RW
Exposure Amount (3) RWAs
Expected Losses
Category 1 Less than 2.5 years - - 50% - - - Category 1 Equal to or more than 2.5 years 3,148 1,174 70% 4,168 2,918 17 Category 2 Less than 2.5 years 820 438 70% 1,083 758 4 Category 2 Equal to or more than 2.5 years 2,404 804 90% 3,050 2,745 24 Category 3 Less than 2.5 years 292 22 115% 341 393 9 Category 3 Equal to or more than 2.5 years 754 380 115% 1,088 1,251 30 Category 4 Less than 2.5 years 35 9 250% 41 103 3 Category 4 Equal to or more than 2.5 years 426 190 250% 617 1,542 48 Category 5 Less than 2.5 years 151 6 0% 145 - 53 Category 5 Equal to or more than 2.5 years 115 18 0% 143 - 53 Total Less than 2.5 years 1,297 475 1,610 1,254 70 Total Equal to or more than 2.5 years 6,848 2,566 9,067 8,456 171 (1) Corresponds to the amount of the net exposure of provisions and cancellations(2) Corresponds to the value of off-balance sheet exposure, regardless of credit conversion factors (CCF), or the effect of the Credit Risk Mitigation (CRM) techniques(3) Corresponds to exposure value after CRM and CCF(4) The table above is showed only for comparision purposes and corresponds to the proforma as of December 2016
3.2.5.5. Risk weightings of equity exposures
The following table presents the exposures assigned to each one of the risk weightings of equity exposures as of December 31, 2017.
Table 35. EU CR10 (2) – IRB: Equity (Million Euros. 12-31-17)
Equity under the IRB approach
Categories On-balance sheet
amount (1) Off-balance sheet
amount (2) RW Exposure
Amount (3) RWAs Capital
Requirements Simple method - Private Equity Exposures 525 - 190% 525 998 80Simple method - Exchange-traded equity exposures
170 - 290% 170 493 39
Simple method - Other Equity Exposures 88 - 370% 88 324 26Exposures subject to 250% risk weighting 3,098 - 250% 3099 7,747 620Intern model 527 - 527 2,261 181PD/LGD method 3,390 - 3390 4,953 396Total 7,798 - 7,798 16,775 1,342(1) Corresponds to the amount of the net exposure of provisions and cancellations(2) Corresponds to the value of off-balance sheet exposure, regardless of credit conversion factors (CCF), or the effect of the Credit Risk Mitigation (CRM) techniques. As of December 31,
2017 derivatives on shares are included as on-balance sheet(3) Corresponds to exposure value after CRM and CCF
EU CR10 (2) – IRB: Equity (Million Euros. 12-31-16)
Equity under the IRB approach
Categories On-balance sheet
amount (1) Off-balance sheet
amount (2) RW Exposure
Amount (3) RWAs Capital
Requirements Simple method - Private Equity Exposures 840 - 190% 840 1,595 128 Simple method - Exchange-traded equity exposures
198 - 290% 198 575 46
Simple method - Other Equity Exposures 113 - 370% 113 417 33 Exposures subject to 250% risk weighting 3,278 - 250% 3,278 8,195 656 Intern model 193 - 193 961 77 PD/LGD method 3,592 - 3,592 4,896 392 Total 8,214 - 8,214 16,639 1,331(1) Corresponds to the amount of the net exposure of provisions and cancellations(2) Corresponds to the value of off-balance sheet exposure, regardless of credit conversion factors (CCF), or the effect of the Credit Risk Mitigation (CRM) techniques. As of December 31,
2017 derivatives on shares are included as on-balance sheet(3) Corresponds to exposure value after CRM and CCF

3. rIsksBBVA. PILAR III 2017 P. 85
In addition, section 3.4 shows detailed information on structural equity risk.
3.2.6. Information on counterparty risk
Counterparty exposure involves that part of the original exposure corresponding to derivative instruments,
repurchase and resale transactions, securities lending transactions and deferred settlement transactions.
The following table shows the amount in terms of EAD of the counterparty risk, broken down by product and risk:
Table 36. Counterparty risk. EAD derivatives by product and risk (Million Euros. 12-31-17)
Foreign-exchange risk
Interet rate risk Equity risk
Commodity risk Credit risk Other risks TOTAL
Term operations 7,314 - 14 - - - 7,328FRAs - 0 - - - - 0Swaps - 16,337 35 - - - 16,373Options 133 1,790 338 - - - 2,261Other products - - - - 353 - 353TOTAL 7,446 18,128 387 - 353 - 26,314
Counterparty risk. EAD derivatives by product and risk (Million Euros. 12-31-16)
Foreign-exchange risk
Interet rate risk Equity risk
Commodity risk Credit risk Other risks TOTAL
Term operations 3,901 2 7 - - - 3,910FRAs - 8 - - - - 8Swaps - 19,186 34 - - - 19,220Options 379 2,515 1,137 1 - - 4,031Other products - - - - 704 - 704TOTAL 4,280 21,711 1,178 1 704 - 27,873
Chart 18: EAD for derivatives broken down by risk
28.30%
68.89%
1.47% 1.34%
Exchange-rate derivatives
Interest-rate derivatives
Equity derivatives
Credit derivatives
3.2.6.1. Policies for managing counterparty risk
3.2.6.1.1. Methodology: allocation of internal capital and limits to exposures subject to counterparty risk
The Group has an economic model for calculating internal capital through exposure to counterparty risk in treasury operations. This model has been implemented in the Risk unit systems in Market areas. It is used to measure the credit exposures for each of the counterparties for which the entity operates.
The generation of exposures is undertaken in a manner that is consistent with those used for the monitoring and control of credit risk limits. The time horizon is divided up into intervals, and the market risk factors (interest rates, exchange rates, etc.) underlying the instruments that determine their valuation are simulated for each interval.
The exposures are generated from 500 different scenarios using the Monte Carlo method for risk factors (subject to counterparty risk) and applying the corresponding mitigating factors to each counterparty (i.e. applying collateral and/or netting arrangements as applicable).
The correlations, loss given defaults, internal ratings and associated probabilities of default are consistent with the Group’s economic model for general credit risk.
The capital for each counterparty is then calculated using the exposure profile and taking into account the analytical formula adopted by Basel. This figure is modified by an adjustment factor for the possible maturity subsequent to one year of the operations in a similar vein to the general approach adopted by Basel for the treatment of credit risk.
Counterparty limits are specified within the financial programs authorised for each subsidiary within the line

3. rIsksBBVA. PILAR III 2017 P. 86
item of treasury limits. It stipulates both the limit and the maximum maturity for the transaction.
The businesses that generate counterparty risk are subject to risk limits that control both bilateral risk and risk with CCPs. When setting these limits for each business area and segment, and to ensure their correct application, the corresponding capital consumption and revenue generated by this operation are taken into account.
There is also a risk committee that analyses individually the most significant transactions to assess (among other aspects) the relationship between profitability and risk.
The consumption of transactions within the limits is measured in terms of mark-to-market valuation plus the potential risk with Monte Carlo Simulation methodology (95% confidence level) and bearing in mind possible mitigating factors (such as netting, break clauses and collateral contracts).
Management of consumption by lines in the Markets area is carried out through a corporate platform that enables online monitoring of the limits and availabilities established for the different counterparties and customers. This control is completed by independent units of the business area to guarantee proper segregation of functions.
3.2.6.1.2. Policies for ensuring the effectiveness of collateral and establishing the value adjustments for impairment to cover this risk
The Group negotiates agreements with its customers to mitigate counterparty risk within the legal frameworks applicable in each of the countries where it operates. These agreements regulate the exchange of guarantees as a mechanism to reduce exposure derived from transactions that generate counterparty risk.
The assets covered by these agreements include cash, as well as financial assets with a high asset quality. In addition, the agreements with customers include mechanisms that allow the immediate replacement of the collateral if its quality is impaired (for example, a reduction in the market value or adverse changes in the asset rating).
Mitigation by netting transactions and by collateral only reduces the consumption of limits and capital if there is a positive opinion on their immediate effectiveness in case of the counterparty’s default or insolvency.
The MENTOR tool has been specifically designed to store and process the collateral contracts concluded with counterparties. This application enables the existence of collateral to be taken into account at the transaction level (useful for controlling and monitoring the status of specific
operations) as well as at the counterparty level. Furthermore, said tool feeds the applications responsible for estimating counterparty risk by providing all the necessary parameters for considering the impact of mitigation in the portfolio due to the agreements signed.
Likewise, there is also an application that reconciles and adjusts the positions serving the Collateral and Risks units.
In order to guarantee the effectiveness of collateral contracts, the Group carries out a daily monitoring of the market values of the operations governed by such contracts and of the deposits made by the counterparties. Once the amount of the collateral to be delivered or received is obtained, the collateral demand (margin call), or the demand received, is carried out at the intervals established in the contract, usually daily.
If significant variations arise from the process of reconciliation between the counterparties, after a reconciliation in economic terms, they are reported by the Collateral unit to the Risks unit for subsequent analysis and monitoring. Within the control process, the Collateral unit issues a daily report on the guarantees which includes a description by counterparty of the exposure and collateral, making special reference to those guarantee deficits at or beyond the set warning levels.
Financial assets and liabilities may be the object of netting, in other words presentation for a net amount in the balance sheet, only when the Group’s entities comply with the provisions of IAS 32 - Paragraph 42, and thus have the legally obliged right to offset the amounts recognised, and the intention to settle the net amount or to divest the asset and pay the liability at the same time.
In addition, the Group has assets and liabilities on the balance sheet that are not netted and for which there are master netting agreements, but for which there is neither the intention nor the right to settle. The most common types of events that trigger netting of reciprocal obligations include the bankruptcy of the credit institution in question, swiftly accumulating indebtedness, default, restructuring or the winding up of the entity.
In the current market context, derivatives are arranged under a variety of framework contracts, with the most general being those developed by the International Swaps and Derivatives Association (ISDA), and for the Spanish market the Framework Agreement for Financial Transactions (FAFT). Practically all portfolio derivative operations have been concluded under these master contracts, including in them the netting clauses referred to in the above point as Master Netting Agreements, considerably reducing the credit exposure in these instruments. In addition, in the contracts concluded with professional counterparties, annexes are included with collateral agreements called Credit Support

3. rIsksBBVA. PILAR III 2017 P. 87
Annexes (CSA), thus minimizing exposure to a possible counterparty insolvency.
At the same time, the Group has a high volume of assets bought and sold under repurchase agreements traded through clearing houses that use mechanisms to reduce counterparty risk, as well as through various master contracts in bilateral operations, the most common being the Global
Master Repurchase Agreement (GMRA), which is published by the International Capital Market Association (ICMA). This tends to have clauses added relating to the exchange of collateral within the main body of the master contract itself.
The following summary table presents the potential effects of netting and collateral agreements in derivative operations as of December 31, 2017:
Table 37. Assets and liabilities subject to contractual netting rights (Million Euros . 12-31-17)
Offsetting of financial instruments
Gross Recognized Amount (A)
Non-offsetted gross amount (D)
Offsetted balance
sheet amounte (B)
Net amount presented
on balance sheet (C=A-B)
Amount related to recognized
financial instruments
Collateral (including
cash)Net amount
(E=C-D)AssetsTrading and hedging derivatives 53,709 11,584 42,125 27,106 7,442 7,578 Repurchase agreement (Repos) 25,413 56 25,356 26,223 141 (1,008) Total assets 79,122 11,641 67,482 53,328 7,583 6,570 LiabilitiesTrading and hedging derivatives 53,396 11,644 41,752 27,106 8,328 6,318 Repurchase agreements (Repos) 40,798 56 40,742 40,158 21 563 Total liabilities 94,194 11,701 82,494 67,264 8,349 6,881
Assets and liabilities subject to contractual netting rights (Million Euros . 12-31-16)
Non-offsetted gross amount (D)
Offsetting of financial instruments
Gross Recognized Amount (A)
Offsetted balance
sheet amounte (B)
Net amount presented
on balance sheet (C=A-B)
Amount related to recognized
financial instruments
Collateral (including
cash)Net amount
(E=C-D)AssetsTrading and hedging derivatives 61,757 13,587 48,170 32,146 6,571 9,453 Repurchase agreement (Repos) 25,593 2,912 22,681 23,080 174 (573) Total assets 87,350 16,499 70,851 55,226 6,745 8,880 LiabilitiesTrading and hedging derivatives 60,518 14,080 46,439 32,146 7,272 7,021 Repurchase agreements (Repos) 49,475 2,912 46,563 47,915 176 (1,528) Total liabilities 109,993 16,991 93,001 80,061 7,448 5,492
3.2.6.1.3. Policies on the risk of adverse effects due to correlations
Derivatives contracts may give rise to potential adverse correlation effects between the exposure to the counterparty and its credit quality (wrong-way-exposures).
The Group has specific policies for treating these kinds of exposures, which establish:
How to identify transactions subject to adverse correlation risk.
A specific admission procedure transaction by transaction.
Measurements appropriate to the risk profile with adverse correlation.
Control and monitoring of the transaction.
3.2.6.1.4. Impact of collateral in the event of a downgrade in credit quality
In derivatives transactions, as a general policy the Group does not subscribe collateral contracts that involve an increase in the amount to be deposited in the event of the Group being downgraded.
The general criteria applied to date with banking counterparties is to establish a zero threshold within collateral contracts, irrespective of the mutual rating; provision will be made as collateral of any difference that arises through mark-to-market valuation. During 2017, with the entry into force of the regulatory obligations for exchange of margins for derivatives that are not offset in the clearing houses, all the
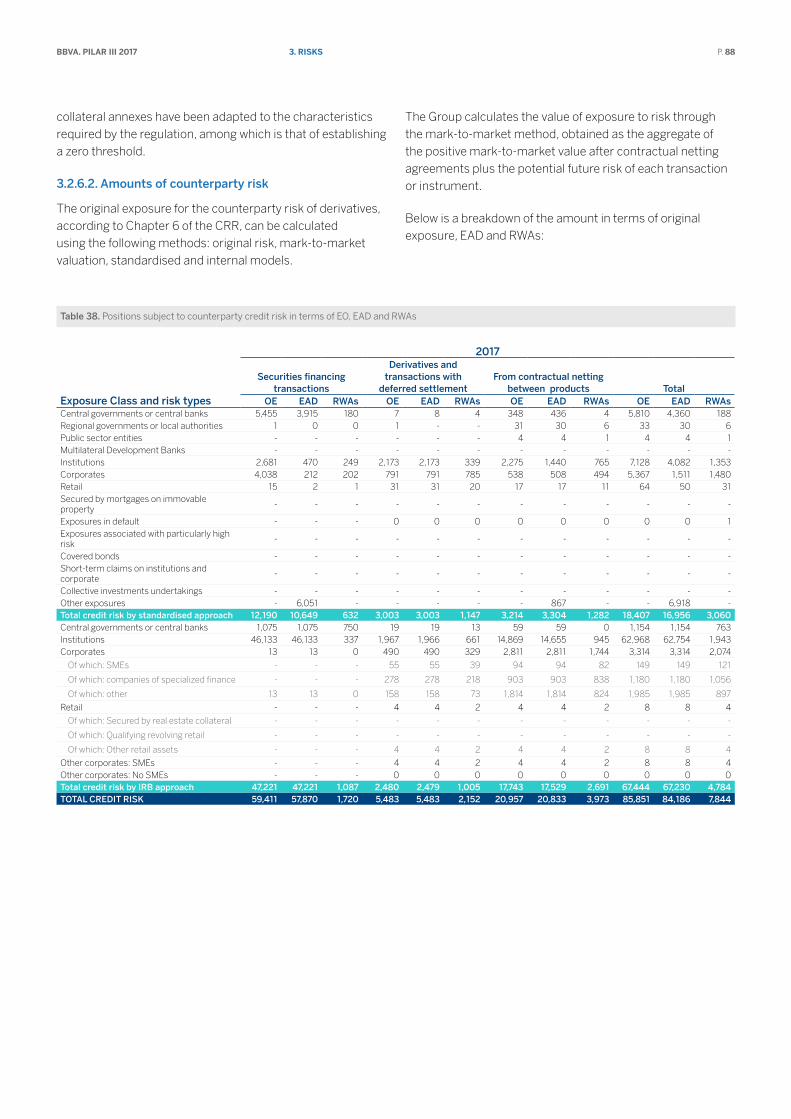
3. rIsksBBVA. PILAR III 2017 P. 88
collateral annexes have been adapted to the characteristics required by the regulation, among which is that of establishing a zero threshold.
3.2.6.2. Amounts of counterparty risk
The original exposure for the counterparty risk of derivatives, according to Chapter 6 of the CRR, can be calculated using the following methods: original risk, mark-to-market valuation, standardised and internal models.
The Group calculates the value of exposure to risk through the mark-to-market method, obtained as the aggregate of the positive mark-to-market value after contractual netting agreements plus the potential future risk of each transaction or instrument.
Below is a breakdown of the amount in terms of original exposure, EAD and RWAs:
Table 38. Positions subject to counterparty credit risk in terms of EO, EAD and RWAs
Exposure Class and risk types
2017
Securities financing transactions
Derivatives and transactions with
deferred settlementFrom contractual netting
between products TotalOE EAD RWAs OE EAD RWAs OE EAD RWAs OE EAD RWAs
Central governments or central banks 5,455 3,915 180 7 8 4 348 436 4 5,810 4,360 188 Regional governments or local authorities 1 0 0 1 - - 31 30 6 33 30 6 Public sector entities - - - - - - 4 4 1 4 4 1 Multilateral Development Banks - - - - - - - - - - - - Institutions 2,681 470 249 2,173 2,173 339 2,275 1,440 765 7,128 4,082 1,353 Corporates 4,038 212 202 791 791 785 538 508 494 5,367 1,511 1,480 Retail 15 2 1 31 31 20 17 17 11 64 50 31 Secured by mortgages on immovable property
- - - - - - - - - - - -
Exposures in default - - - 0 0 0 0 0 0 0 0 1 Exposures associated with particularly high risk
- - - - - - - - - - - -
Covered bonds - - - - - - - - - - - - Short-term claims on institutions and corporate
- - - - - - - - - - - -
Collective investments undertakings - - - - - - - - - - - - Other exposures - 6,051 - - - - - 867 - - 6,918 - Total credit risk by standardised approach 12,190 10,649 632 3,003 3,003 1,147 3,214 3,304 1,282 18,407 16,956 3,060 Central governments or central banks 1,075 1,075 750 19 19 13 59 59 0 1,154 1,154 763 Institutions 46,133 46,133 337 1,967 1,966 661 14,869 14,655 945 62,968 62,754 1,943 Corporates 13 13 0 490 490 329 2,811 2,811 1,744 3,314 3,314 2,074
Of which: SMEs - - - 55 55 39 94 94 82 149 149 121
Of which: companies of specialized finance - - - 278 278 218 903 903 838 1,180 1,180 1,056
Of which: other 13 13 0 158 158 73 1,814 1,814 824 1,985 1,985 897
Retail - - - 4 4 2 4 4 2 8 8 4
Of which: Secured by real estate collateral - - - - - - - - - - - -
Of which: Qualifying revolving retail - - - - - - - - - - - -
Of which: Other retail assets - - - 4 4 2 4 4 2 8 8 4
Other corporates: SMEs - - - 4 4 2 4 4 2 8 8 4 Other corporates: No SMEs - - - 0 0 0 0 0 0 0 0 0 Total credit risk by IRB approach 47,221 47,221 1,087 2,480 2,479 1,005 17,743 17,529 2,691 67,444 67,230 4,784 TOTAL CREDIT RISK 59,411 57,870 1,720 5,483 5,483 2,152 20,957 20,833 3,973 85,851 84,186 7,844

3. rIsksBBVA. PILAR III 2017 P. 89
Positions subject to counterparty credit risk in terms of EO, EAD and RWAs
Exposure Class and risk types
2016
Securities financing transactions
Derivatives and transactions with
deferred settlementFrom contractual netting
between products TotalOE EAD RWAs OE EAD RWAs OE EAD RWAs OE EAD RWAs
Central governments or central banks 4,072 3,855 51 13 13 - 378 362 8 4,463 4,229 59 Regional governments or local authorities - - - 4 4 1 23 23 5 27 27 5 Public sector entities - - - 0 0 0 - - - 0 0 0 Multilateral Development Banks - - - - - - - - - - - - Institutions 4,661 325 45 1,857 1,857 427 2,930 1,369 491 9,448 3,551 963 Corporates 6,461 1,342 957 1,461 1,461 1,448 1,180 1,140 948 9,102 3,944 3,352 Retail - - - 48 48 32 12 12 7 59 59 39 Secured by mortgages on immovable property
- - - - - - - - - - - -
Exposures in default - - - 0 0 0 0 0 0 0 0 0 Exposures associated with particularly high risk
- - - - - - - - - - - -
Covered bonds - - - - - - - - - - - - Short-term claims on institutions and corporate
- - - - - - - - - - - -
Collective investments undertakings 85 6 6 0 0 0 0 0 0 85 6 6 Other exposures - 9,305 - 21 21 0 0 1,600 0 21 10,925 0 Total credit risk by standardised approach 15,279 14,833 1,059 3,403 3,403 1,908 4,524 4,506 1,459 23,205 22,742 4,426 Central governments or central banks 428 428 4 31 31 10 98 98 36 556 556 50 Institutions 47,302 47,302 547 2,806 2,806 804 13,451 13,373 1,093 63,558 63,480 2,444 Corporates - - - 534 534 398 3,117 3,117 2,153 3,650 3,650 2,551
Of which: SMEs - - - 46 46 44 114 114 109 160 160 153
Of which: companies of specialized finance - - - 251 251 236 1,337 1,337 1,241 1,588 1,588 1,477
Of which: other - - - 237 237 118 1,665 1,665 803 1,902 1,902 921
Retail - - - 2 2 1 4 4 2 7 7 3
Of which: Secured by real estate collateral - - - - - - - - - - - -
Of which: Qualifying revolving retail - - - - - - - - - - - -
Of which: Other retail assets - - - 2 2 1 4 4 2 7 7 3
Other corporates: SMEs - - - 2 2 1 4 4 2 6 6 3 Other corporates: No SMEs - - - 0 0 0 0 0 0 0 0 0 Total credit risk by advanced approach 47,729 47,729 551 3,373 3,373 1,212 16,669 16,591 3,284 67,772 67,694 5,048 TOTAL CREDIT RISK 63,008 62,562 1,610 6,776 6,776 3,120 21,193 21,097 4,743 90,977 90,435 9,473
From the amounts shown in the table above, those referring to the counterparty risk in the trading book are shown below:
Table 39. Amounts of counterparty risk in the trading book (Million Euros)
Counterparty Risk Trading Book Activities
2017 2016Mtm Method Internal Models (IMM) Mtm Method Internal Models (IMM)
Standardised Approach 194 - 269 - Advanced Approach 296 - 360 - Total 490 - 629 -
The Group currently has a totally residual amount of capital requirements for trading-book activity liquidation risk.
The following table presents the amounts in million euros involved in the counterparty risk of derivatives as of December 31, 2017 and December 31, 2016:

3. rIsksBBVA. PILAR III 2017 P. 90
Table 40. EU CCR5-A – Impact of netting and collateral held on exposure values (1) (Million Euros . 12-31-17)
Gross positive fair value or net carrying amount Netting benefits
Netted current credit exposure Collateral held
Net credit exposure
Derivatives (2) 42,125 (29,327) 12,798 (6,029) 6,769SFTs 25,979 (644) 25,335 (26,219) (884)Cross-product netting - - - - -Total 68,104 (29,972) 38,133 (32,248) 5,885(1) SFTs includes both relative amount of recognised financial instruments and collaterals that are not netted on balance sheet but reduce credit risk.
Collaterals of derivatives correspond only to those that mitigate for capital purpose(2) Positive mark to market of derivatives is include
Below is a complete overview of the methods used to calculate the regulatory requirements for counterparty credit risk and the main parameters of each method (excluding
requirements for CVA and exposures offset through a CCP, which are shown in tables CCR2 and CCR8, respectively).
Table 41. EU CCR1 – Analysis of CCR exposure by approach (Million Euros)
12-31-17 12-31-16Replacement
Cost / Current market value
Potential future credit
exposure
EAD post-CRM RWAs
Replacement Cost / Current
market value
Potential future credit
exposure
EAD post-CRM RWAs
Mark to market 12,514 10,254 21,213 6,001 12,476 15,098 24,205 7,762 Internal Model Method (for derivatives and SFTs) - - - - - - Simple Approach for credit risk mitigation (for SFTs) - - - - - - - - Comprehensive Approach for credit risk mitigation (for SFTs)
- - 56,937 1,643 - - 61,421 1,557
VaR for SFTs - - - - - - - - Total 12,514 10,254 78,150 7,644 12,476 15,098 85,626 9,319
3.2.6.2.1. Counterparty risk by standardised approach
The following table presents a breakdown of exposure to counterparty credit risk (following mitigation and CCF techniques) calculated using the standardised method, by exposure class and risk weighting:

3. rIsksBBVA. PILAR III 2017 P. 91
Table 42. EU CCR3 – Standardised approach – CCR exposures by regulatory portfolio and risk (Million Euros. 12-31-17)
Exposure ClassRisk weight
TotalOf which:
unrated0% 2% 4% 10% 20% 50% 70% 75% 100% 150% OthersCentral governments or central banks 4,058 - - - - 226 - - 75 0 - 4,360 3,619 Regional government or local authorities - - - - 30 - - - - - - 30 8 Public sector entities - - - - 4 - - - - - - 4 4 Multilateral development banks - - - - - - - - - - - - - International organisations - - - - - - - - - - - - - Institutions - 1,099 72 - 1,778 322 - - 812 - - 4,082 3,937 Corporates - - - - 3 46 - - 1,458 4 - 1,511 1,505 Retail - - - - - - - 50 - - - 50 50 Institutions and corporates with a short term credit assessment - - - - - - - - - - - - - Other items 6,918 - - - - - - - - 0 - 6,918 6,918 Total 10,976 1,099 72 - 1,816 594 - 50 2,345 5 - 16,955 16,043
EU CCR3 – Standardised approach – CCR exposures by regulatory portfolio and risk (Million Euros. 12-31-16)
Exposure ClassRisk weight
TotalOf which:
unrated0% 2% 4% 10% 20% 50% 70% 75% 100% 150% OthersCentral governments or central banks 4,121 - - - - 97 - - 11 - - 4,229 4,180 Regional government or local authorities - - - - 27 - - - - - - 27 27 Public sector entities - - - - - - - - - - - - - Multilateral development banks - - - - - - - - - - - - - International organisations - - - - - - - - - - - - - Institutions - 523 197 - 2,120 381 - - 329 1 - 3,551 3,101 Corporates - - - - 220 783 - 7 2,933 - - 3,944 2,941 Retail - - - - - - - 59 - - - 59 59 Institutions and corporates with a short term credit assessment - - - - - - - - - - - - - Other items 10,925 - - - - - - - 7 - - 10,932 10,929 Total 15,046 523 197 - 2,368 1,261 - 66 3,280 1 - 22,742 21,238 (*) Of which: Unrated refers to exposures for which no credit rating is available made by designated ECAIs.
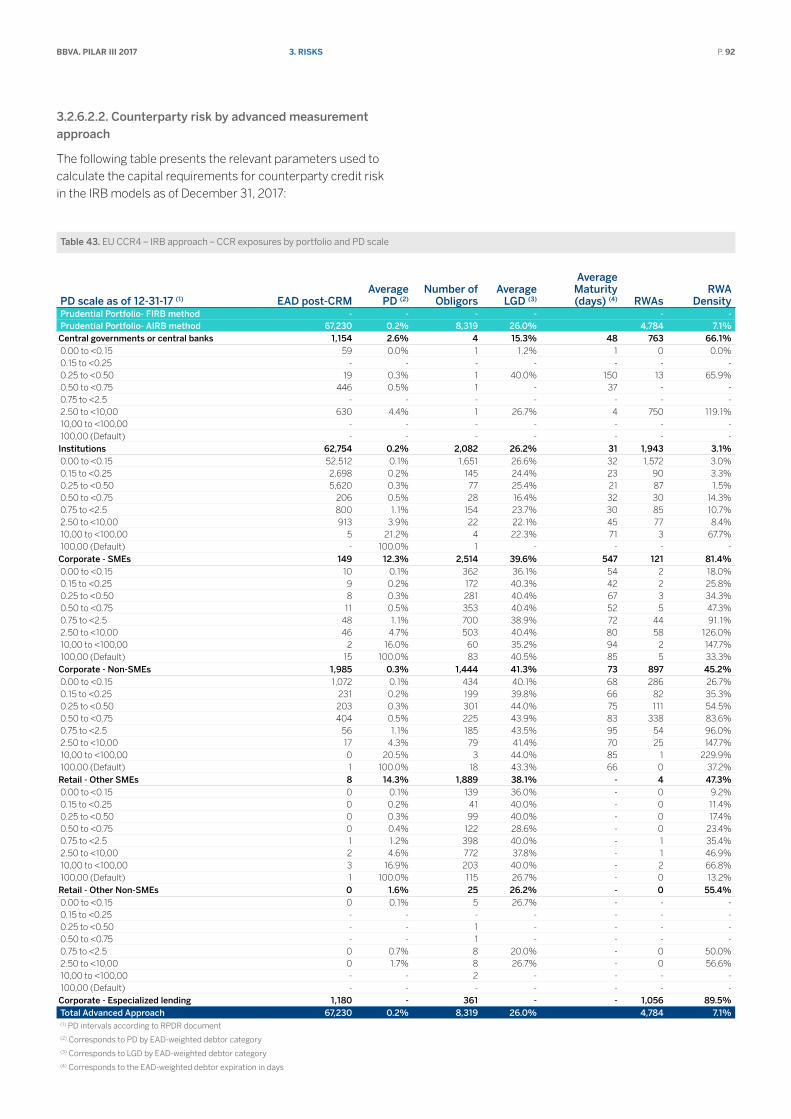
3. rIsksBBVA. PILAR III 2017 P. 92
3.2.6.2.2. Counterparty risk by advanced measurement approach
The following table presents the relevant parameters used to calculate the capital requirements for counterparty credit risk in the IRB models as of December 31, 2017:
Table 43. EU CCR4 – IRB approach – CCR exposures by portfolio and PD scale
PD scale as of 12-31-17 (1) EAD post-CRM Average
PD (2)Number of
ObligorsAverage
LGD (3)
Average Maturity (days) (4) RWAs
RWA Density
Prudential Portfolio- FIRB method - - - - - - Prudential Portfolio- AIRB method 67,230 0.2% 8,319 26.0% 4,784 7.1%Central governments or central banks 1,154 2.6% 4 15.3% 48 763 66.1%0.00 to <0.15 59 0.0% 1 1.2% 1 0 0.0%0.15 to <0.25 - - - - - - - 0.25 to <0.50 19 0.3% 1 40.0% 150 13 65.9%0.50 to <0.75 446 0.5% 1 - 37 - - 0.75 to <2.5 - - - - - - - 2.50 to <10,00 630 4.4% 1 26.7% 4 750 119.1%10,00 to <100,00 - - - - - - - 100,00 (Default) - - - - - - - Institutions 62,754 0.2% 2,082 26.2% 31 1,943 3.1%0.00 to <0.15 52,512 0.1% 1,651 26.6% 32 1,572 3.0%0.15 to <0.25 2,698 0.2% 145 24.4% 23 90 3.3%0.25 to <0.50 5,620 0.3% 77 25.4% 21 87 1.5%0.50 to <0.75 206 0.5% 28 16.4% 32 30 14.3%0.75 to <2.5 800 1.1% 154 23.7% 30 85 10.7%2.50 to <10,00 913 3.9% 22 22.1% 45 77 8.4%10,00 to <100,00 5 21.2% 4 22.3% 71 3 67.7%100,00 (Default) - 100.0% 1 - - - - Corporate - SMEs 149 12.3% 2,514 39.6% 547 121 81.4%0.00 to <0.15 10 0.1% 362 36.1% 54 2 18.0%0.15 to <0.25 9 0.2% 172 40.3% 42 2 25.8%0.25 to <0.50 8 0.3% 281 40.4% 67 3 34.3%0.50 to <0.75 11 0.5% 353 40.4% 52 5 47.3%0.75 to <2.5 48 1.1% 700 38.9% 72 44 91.1%2.50 to <10,00 46 4.7% 503 40.4% 80 58 126.0%10,00 to <100,00 2 16.0% 60 35.2% 94 2 147.7%100,00 (Default) 15 100.0% 83 40.5% 85 5 33.3%Corporate - Non-SMEs 1,985 0.3% 1,444 41.3% 73 897 45.2%0.00 to <0.15 1,072 0.1% 434 40.1% 68 286 26.7%0.15 to <0.25 231 0.2% 199 39.8% 66 82 35.3%0.25 to <0.50 203 0.3% 301 44.0% 75 111 54.5%0.50 to <0.75 404 0.5% 225 43.9% 83 338 83.6%0.75 to <2.5 56 1.1% 185 43.5% 95 54 96.0%2.50 to <10,00 17 4.3% 79 41.4% 70 25 147.7%10,00 to <100,00 0 20.5% 3 44.0% 85 1 229.9%100,00 (Default) 1 100.0% 18 43.3% 66 0 37.2%Retail - Other SMEs 8 14.3% 1,889 38.1% - 4 47.3%0.00 to <0.15 0 0.1% 139 36.0% - 0 9.2%0.15 to <0.25 0 0.2% 41 40.0% - 0 11.4%0.25 to <0.50 0 0.3% 99 40.0% - 0 17.4%0.50 to <0.75 0 0.4% 122 28.6% - 0 23.4%0.75 to <2.5 1 1.2% 398 40.0% - 1 35.4%2.50 to <10,00 2 4.6% 772 37.8% - 1 46.9%10,00 to <100,00 3 16.9% 203 40.0% - 2 66.8%100,00 (Default) 1 100.0% 115 26.7% - 0 13.2%Retail - Other Non-SMEs 0 1.6% 25 26.2% - 0 55.4%0.00 to <0.15 0 0.1% 5 26.7% - - - 0.15 to <0.25 - - - - - - - 0.25 to <0.50 - - 1 - - - - 0.50 to <0.75 - - 1 - - - - 0.75 to <2.5 0 0.7% 8 20.0% - 0 50.0%2.50 to <10,00 0 1.7% 8 26.7% - 0 56.6%10,00 to <100,00 - - 2 - - - - 100,00 (Default) - - - - - - - Corporate - Especialized lending 1,180 - 361 - - 1,056 89.5%Total Advanced Approach 67,230 0.2% 8,319 26.0% 4,784 7.1%(1) PD intervals according to RPDR document(2) Corresponds to PD by EAD-weighted debtor category(3) Corresponds to LGD by EAD-weighted debtor category(4) Corresponds to the EAD-weighted debtor expiration in days

3. rIsksBBVA. PILAR III 2017 P. 93
EU CCR4 – IRB approach – CCR exposures by portfolio and PD scale
PD scale as of 12-31-16 (1) EAD post-CRM Average
PD (2)Number of
ObligorsAverage
LGD (3)
Average Maturity (days) (4) RWAs
RWA Density
Prudential Portfolio- FIRB method - - - - - - Prudential Portfolio- AIRB method 67,694 0.3% 6,029 25.4% 5,048 7.5%Central governments or central banks 556 0.6% 9 12.9% 112 50 9.0%0.00 to <0.15 73 0.0% 2 26.4% 90 9 12.2%0.15 to <0.25 52 0.2% 2 44.0% 182 35 67.6%0.25 to <0.50 1 0.3% 1 20.0% 151 0 34.1%0.50 to <0.75 1 0.5% 1 20.0% 166 0 44.2%0.75 to <2.5 429 0.8% 3 6.8% 73 5 1.3%2.50 to <10,00 - 0.0% - 0.0% - - 0.0%10,00 to <100,00 - 0.0% - 0.0% - - 0.0%100,00 (Default) - 0.0% - 0.0% - - 0.0%Institutions 63,480 0.3% 973 25.6% 39 2,444 3.8%0.00 to <0.15 52,247 0.1% 716 26.8% 39 1,720 3.3%0.15 to <0.25 956 0.2% 45 19.2% 30 74 7.8%0.25 to <0.50 4,353 0.3% 46 21.6% 38 145 3.3%0.50 to <0.75 3,587 0.5% 35 14.3% 31 108 3.0%0.75 to <2.5 1,255 1.2% 79 27.6% 38 125 9.9%2.50 to <10,00 634 4.4% 20 23.1% 58 93 14.7%10,00 to <100,00 448 19.3% 32 22.2% 55 179 39.9%100,00 (Default) - 0.0% - 0.0% - - 0.0%Corporate - SMEs 160 12.8% 2,232 39.4% 89 153 95.3%0.00 to <0.15 5 0.1% 225 40.5% 68 1 18.2%0.15 to <0.25 3 0.2% 150 40.7% 66 1 27.3%0.25 to <0.50 7 0.3% 240 40.1% 47 2 30.4%0.50 to <0.75 15 0.5% 314 40.8% 89 7 48.3%0.75 to <2.5 36 1.0% 681 34.5% 81 32 90.2%2.50 to <10,00 76 4.6% 496 41.0% 119 101 131.9%10,00 to <100,00 2 19.0% 37 41.4% 93 3 131.3%100,00 (Default) 16 100.0% 89 40.6% 115 6 35.5%Corporate - Non-SMEs 1,902 0.4% 1,066 42.8% 79 921 48.4%0.00 to <0.15 1,128 0.1% 260 42.6% 81 394 34.9%0.15 to <0.25 232 0.2% 165 41.3% 63 102 44.2%0.25 to <0.50 161 0.3% 186 43.9% 80 96 59.9%0.50 to <0.75 229 0.5% 197 43.6% 77 181 78.9%0.75 to <2.5 130 1.2% 153 43.3% 86 118 91.3%2.50 to <10,00 20 4.4% 76 43.1% 85 27 136.9%10,00 to <100,00 1 16.1% 8 43.0% 86 1 208.7%100,00 (Default) 3 100.0% 21 41.9% 73 1 29.0%Retail - Other SMEs 6 6.2% 1,467 37.0% - 3 45.7%0.00 to <0.15 0 0.1% 16 40.0% - 0 10.0%0.15 to <0.25 0 0.2% 45 40.0% - 0 14.4%0.25 to <0.50 0 0.3% 90 40.0% - 0 17.2%0.50 to <0.75 0 0.5% 132 40.0% - 0 23.6%0.75 to <2.5 1 0.8% 534 26.7% - 1 35.5%2.50 to <10,00 3 5.1% 620 40.0% - 2 48.6%10,00 to <100,00 1 21.6% 30 40.0% - 1 70.2%100,00 (Default) - 0.0% - 0.0% - - 0.0%Retail - Other Non-SMEs 0 1.2% 10 31.2% - 0 50.7%0.00 to <0.15 - 0.0% - 0.0% - - 0.0%0.15 to <0.25 - 0.0% 1 0.0% - - 0.0%0.25 to <0.50 - 0.0% - 0.0% - - 0.0%0.50 to <0.75 - 0.0% 2 0.0% - - 0.0%0.75 to <2.5 0 1.2% 2 40.0% - 0 45.2%2.50 to <10,00 0 1.3% 4 20.0% - 0 57.7%10,00 to <100,00 - 0.0% 1 0.0% - - 0.0%100,00 (Default) - 0.0% - 0.0% - - 0.0%Corporate - Especialized lending 1,588 272 93.0%Total Advanced Approach 67,694 0.3% 6,029 25.4%
- 1,477 5,048 7.5%
(1) PD intervals according to RPDR document(2) Corresponds to PD by EAD-weighted debtor category(3) Corresponds to LGD by EAD-weighted debtor category(4) Corresponds to the EAD-weighted debtor expiration in days

3. rIsksBBVA. PILAR III 2017 P. 94
3.2.6.2.3. Composition of collateral for counterparty risk exposures
a table with a breakdown of all the types of collateral contributed or received by the Group to strengthen or reduce
exposure to counterparty credit risk related to derivate transactions and securities financing transactions as of December 31, 2017 is presented below:
Table 44. EU CCR5-B – Composition of collateral for exposures to CCR (Million Euros. 12-31-17 )
Collateral used in derivative transactions Collateral used in SFTsFair Value of Collateral received Fair Value of posted Collateral Fair Value of
Collateral received Fair Value of posted
Collateral Segregated (1) Unsegregated (2) Segregated (1) Unsegregated (2)
Cash- domestic currency 4 2,353 7 - 29,053 24,244 Cash- other currencies 0 1,549 6 160 11,025 1,735 Domestic sovereign debt - - - - 10,852 17,000 Other sovereign debt - 12 - - 5,591 8,938 Government agency debt - 4 - 4 330 477 Corporate bonds - 468 - - 3,891 10,088 Equity securities - 0 - - - 3,207 Other collateral - 1,638 - - 5,554 447 Total 5 6,024 13 163 (1) Refers to collateral that is held in a bankruptcy-remote manner in the meaning of Article 300 in the CRR. (2) Refers to collateral that is not held in a bankruptcy-remote manner. (*) Only collaterals which are considered as capital mitigation are included
EU CCR5-B – Composition of collateral for exposures to CCR (Million Euros. 12-31-16)
Collateral used in derivative transactions Collateral used in SFTsFair Value of Collateral received Fair Value of posted Collateral Fair Value of
Collateral received Fair Value of posted
Collateral Segregated (1) Unsegregated (2) Segregated (1) Unsegregated (2)
Cash- domestic currency 1 2,193 21 100 29,723 22,449 Cash- other currencies 1,612 652 11 - 16,840 151 Domestic sovereign debt - - - - 8,246 8,111 Other sovereign debt - - - - 10,521 26,023 Government agency debt - 25 - 9 108 290 Corporate bonds - 12 - - 1,844 10,786 Equity securities - 2,205 - - - 2,581 Other collateral - 13 - - 2,038 124 Total 1,613 5,100 32 109 69,320 70,516 (1) Refers to collateral that is held in a bankruptcy-remote manner in the meaning of Article 300 in the CRR. (2) Refers to collateral that is not held in a bankruptcy-remote manner. (*) Only collaterals which are considered as capital mitigation are included
3.2.6.2.4. Credit derivative transactions
The table below shows the amounts corresponding to transactions with credit derivatives, broken down into purchased and sold derivatives:
Table 45. EU CCR6 – Credit derivatives exposures (Million Euros. 12-31-17)
Credit derivative hedges Other credit derivativesProtection Bought Protection Sold
Notionals 13,848 16,333 Single-name credit default swaps 5,374 5,929 - Index credit default swaps 8,374 8,265 - Total return swaps - 2,039 - Credit options 100 100 - Other credit derivatives - - - Fair Values (451) 423 - Positive fair value (asset) 48 441 - Negative fair value (liability) (499) (18) -

3. rIsksBBVA. PILAR III 2017 P. 95
EU CCR6 – Credit derivatives exposures (Million Euros. 12-31-16)
Credit derivative hedges Other credit derivativesProtection Bought Protection Sold
Notionals 9,325 10,074 Single-name credit default swaps 5,126 5,641 - Index credit default swaps 1,654 1,609 - Total return swaps 1,565 1,895 - Credit options 100 50 - Other credit derivatives 880 880 - Fair Values (34) (43) - Positive fair value (asset) 112 150 - Negative fair value (liability) (145) (193) -
As of year-end 2017 and 2016, the Group did not use credit derivatives in brokerage activities as collateral.
3.2.6.3. CVA charge requirements
The surcharge for CVA in Capital refers to the additional surcharge in capital on account of the unexpected CVA adjustment loss, for which there are two approaches:
Standardised Approach (Art. 384 CRR): application of a standard regulatory formula. The formula applied is an analytical approximation to the calculating of the CVA VaR by supposing that the counterparty spreads depend on a single systematic risk factor and on its own idiosyncratic factor, both variables distributed by independent normal distributions, assuming a 99% confidence level.
Advanced Approach (Art 383 CRR): based on the market risk VaR approach, which requires a calculation of the
“CVA VaR”, assuming the same confidence level (99%) and time horizon (10 days), as well as a stressed scenario. As of December 31, 2017 and December 31, 2016, the Group has no surcharge for CVA calculated under the advanced approach.
Procedures for calculating the valuation of adjustments and reserves
Credit valuation adjustments (CVA) and debit valuations adjustments (DVA) are incorporated into derivative valuations of both assets and liabilities, to reflect the impact on fair value of the counterparty credit risk and own credit risk, respectively. (See Note 8 of the Group’s Consolidated Financial Statements for more information).
The amounts in million euros involved in the adjustments by credit risk as of December 31, 2017 and December 31, 2016 are below:
Table 46. EU CCR2 – CVA capital charge (Million Euros. 12-31-17)
Exposure value RWATotal portfolios subject to the advanced method - - (i) VaR component (included 3x multiplier) - - (ii) SVaR component (included 3x multiplier) - - All portfolios subject to the standardised method 7,865 1,566 Total subject to the CVA capital charge 7,865 1,566
EU CCR2 – CVA capital charge (Million Euros. 12-31-16)
Exposure value RWATotal portfolios subject to the advanced method - - (i) VaR component (included 3x multiplier) - - (ii) SVaR component (included 3x multiplier) - - All portfolios subject to the standardised method 10,181 2,321 Total subject to the CVA capital charge 10,181 2,321

3. rIsksBBVA. PILAR III 2017 P. 96
The variations in terms of RWAs during the period are below:
Table 47. Variations in terms of RWAs of CVA (Million Euros)
CVARWAs as of December 31, 2016 2,321Effects Asset size (755)RWAs as of December 31, 2017 1,566
The variations in terms of RWAs by CVA in the analysis period are caused mainly by review and optimisation of the scope of positions subject to CVA.
3.2.6.4. Exposures to central counterparty entities
The following table presents a complete overview of the exposures to central counterparty entities by type of exposure (arising from transactions, margins, contributions to the guarantee fund) and their corresponding capital requirements:
Table 48. EU CCR8 – Exposures to CCPs (Million Euros)
12-31-17 12-31-16EAD post CRM RWA EAD post CRM RWA
Exposures to QCCPs (total) 7,703 186 6,373 242 Exposures for trades at QCCPs (excluding initial margin and default fund contributions); of which 5,903 119 4,633 119
(i) OTC Derivatives 482 11 435 13
(ii) Exchange-traded derivatives 689 14 427 9
(iii) Securities financing transactions (SFTs) 824 16 965 19
(iv) Netting sets where cross-product netting has been approved 3,909 78 2,806 79
Segregated initial margin 1,558 - 526 - Non-segregated initial margin 155 18 1,116 30 Pre-funded default fund contributions 87 49 97 92 Alternative calculation of own funds requirements for exposures - - - Exposures to non-QCCPs (total) 246 84 176 34 Exposures for trades at non-QCCPs (excluding initial margin and default to contributions; of which 132 80 176 34
(i) OTC Derivatives 17 17 - -
(ii) Exchange-traded derivatives 6 3 - -
(iii) Securities financing transactions (SFTs) 109 60 176 34
(iv) Netting sets where cross-product netting has been approved - - - -
Segregated initial margin 110 - - - Non-segregated initial margin 4 4 - - Pre-funded default fund contributions 0 0 - - Unfunded default fund contributions - - - -
3.2.7. Information on securitisations
3.2.7.1. General characteristics of securitisations
3.2.7.1.1. Purpose of securitisation
The Group’s current policy on securitisation considers a program of recurrent issuance, with a deliberate diversification of securitised assets that adjusts their volume to the Bank’s capital requirements and to market conditions.
This program is complemented by all the other finance and equity instruments, thereby diversifying the need to resort to wholesale markets.
The definition of the strategy and the execution of the operations, as with all other wholesale finance and capital management, is supervised by the Assets & Liabilities Committee, with the pertinent internal authorisations obtained directly from the Board of Directors or from the Executive Committee.
The main aim of securitisation is to serve as an instrument for the efficient management of the balance sheet, above all as a source of liquidity at an efficient cost, obtaining liquid assets through eligible collateral, as a complement to other financial instruments. In addition, there are other secondary objectives associated with the use of securitisation instruments, such as freeing up of regulatory capital by transferring risk and the freeing of potential excess over the expected loss, provided it is allowed by the volume of the first-loss tranche and risk transfer.
Main risk exposure in securitisation operations:
1. Default risk
Consists in the obligor not paying at the due date and in the correct way the contractual obligations assumed (for example, potential non-payment of installments).
In the particular case of securitisations, the entities provide information to investors on the situation of the

3. rIsksBBVA. PILAR III 2017 P. 97
securitised loan portfolio. In this respect, it is worth noting that transactions transferred to the Securitisation Fund do not include defaults, or at most, if there is one, in no case do they exceed 30 days of non-payment, demonstrating the high quality of transactions that are securitised. The rating agencies take this element closely into account when analyzing the credit risk of transactions.
BBVA monitors the changes in these indicators with the aim of establishing specific action plans in the different products, in order to correct any deviations that are leading to a deterioration in credit quality.
Monthly information is available on all these indicators to monitor them, in some cases daily. It includes flows of additions, recoveries, irregular investment and the non-performing loan ratio. The information is obtained through different applications and reports prepared in the Risks area.
BBVA’s philosophy of recovery for unpaid loans consists of defining an operating system that allows a speedy and efficient correction of the irregular situation. It is based on a highly personalised management, with a key role being played by the Recovery Manager and his close and ongoing relationship with the debtor.
The main guarantee is always the mortgage on the asset that is the object of acquisition and finance, or on the primary residence. In addition, there are frequent personal guarantees issued by the holders of the loan or the guarantors, which reinforce the repayment of the debt and quality of the risk. The rights to collection before insurance companies are also subrogated in favor of the Bank in cases where there is damage to the mortgaged building due to fire or other duly stipulated causes.
2. Early repayment risk
This derives from the potential total or partial prepayment by the obligor of the amounts corresponding to the securitised loans, which could imply that the maturity of the securitisation bonds calculated at the time of the issue is shorter than the maturity of the loans transferred to the Fund.
This risk is basically manifested due to the variations of market interest rates, but despite its importance it is not the only determining factor; to this have to be added other more personal elements, such as inheritance, divorce, change of residence, etc.
In the specific case of our securitisations, this risk is very limited, as the maturity date of the securitisation bond issue is set according to the maturity of the last loan of the portfolio used.
3. Liquidity risk
At times it is noted that a possible limited liquidity of the markets in which the bonds are traded could constitute a risk derived from the securitisation processes.
Although it is true that an entity may not undertake to contract in the secondary market one of the bonds issued by the Securitisation Fund, and thus provide liquidity to the funds, the securitisation process itself consists of converting illiquid assets that form part of the Bank’s balance sheet into liquid assets in the form of securitisation bonds, which give the possibility for trading and transferring them in a regulated market. This would not be the case if they were not subject to the securitisation process.
In addition, understanding liquidity risk as the possible time mismatch between the maturities of the collections generated by the loans and the payments the bonds originate, BBVA has not so far made any securitisation issues in which there is a divergence between collections and payments. The entities that have programs for commercial paper issuance, in which this risk is typically present, mitigate it with the use of liquidity lines that are included in the structure of the Fund.
3.2.7.1.2. Functions performed by the securitisation process and degree of involvement
The Group’s degree of involvement in its securitisation funds is not usually restricted to the mere role of assignor and administrator of the securitised portfolio.

3. rIsksBBVA. PILAR III 2017 P. 98
Chart 19: Functions carried out in the securitisation process and degree of involvement of the Group
Interest-rate swap
Subordinated loan
Expenses loan
Loan administrator
Payment agent
Financialintermediary
Europea de TitulizacionesSGFT
Cedant
FTA (Emiter)
Class A1 Class A2 Class A3 Class B Class COffered to investors
Financing of initial cost
FR financing
Principal and interestrepayment
Interest payment Repayment of principal Nominal bond value
Fees
Loans
Bond interest rate +margin+ administrator’scommission
Loan interest
Sale of loans Bomd suscription
Variable fees
Fees
Fees
Principal and interestrepayment
Repayments and interest
As can be seen in the above chart, the Group has usually taken additional roles such as:
Payment Agent.
Provider of the treasury account.
Provider of the subordinated loan and of the loan for start-up costs, with the former being the one that finances the first-loss tranche, and the latter financing the fund’s fixed expenditure.
Administrative agent of the securitised portfolio
The Group has not assumed the role of sponsor of securitisations originated by third-party institutions.
The Group’s balance sheet maintains the first-loss tranches of all securitisations performed.
It is worth noting that the Group has maintained a consistent line in the generation of securitisation operations since the credit crunch, which began in July 2007.
In addition, the Group has carried out its first synthetic securitisation, introducing this new operating procedure as an additional source of release of regulatory capital.
3.2.7.1.3. Methods used for the calculation of risk-weighted exposures in its securitisation activity
The methods used to calculate risk-weighted exposures in securitisations are:
The standard securitisation method: When this method is used for fully securitised exposures, in full or in a predominant manner if it involves a mixed portfolio.
The IRB approach: When internal models are used for securitised exposures, in full or in a predominant manner. Within the alternatives of the IRB approach, use is made of the model based on external ratings.
3.2.7.2. Accounting treatment of securitisation
3.2.7.2.1. Criteria for removing or maintaining assets subject to securitisation on the balance sheet
The accounting procedure for the transfer of financial assets depends on the manner in which the risks and benefits associated with securitised assets are transferred to third parties.
Financial assets are only removed from the consolidated balance sheet when the cash flows they generate have dried up or when their implicit risks and benefits have been substantially transferred out to third parties.

3. rIsksBBVA. PILAR III 2017 P. 99
The Group is considered to substantially transfer the risks and benefits when these account for the majority of the overall risks and benefits of the securitised assets.
When the risks and benefits of transferred assets are substantially conveyed to third parties, the financial asset transferred is deregistered from the consolidated balance sheet, and any right or obligation retained or created as a result of the transfer is simultaneously recognised.
In many situations, it is clear whether the entity has substantially transferred all the risks and benefits associated with the transfer of an asset or not. However, when it is not sufficiently clear if the transfer took place or not, the entity evaluates its exposure before and after the transfer by comparing the variation in the amounts and the calendar of the net cash flows of the transferred asset. Therefore, if the exposure to the variation in the current value of the net cash flows of the financial asset does not significantly change as a result of the transfer, it is understood that the entity has not substantially transferred all the risks and benefits associated with the ownership of the asset.
When the risks and/or benefits associated with the financial asset transferred are substantially retained, the asset transferred is not deregistered from the consolidated balance sheet and continues to be valued according to the same criteria applied prior to the transfer.
In the specific case of securitisation funds to which Group institutions transfer their loan-books, existing contractual rights other than voting rights are to be considered with a view to analyzing their possible consolidation. It is also necessary to consider the design and purpose of each fund, as well as the following factors (among others):
Evidence of the practical ability to direct the relevant activities of the funds according to the specific needs of the business (including the decisions that may arise in particular circumstances only).
Possible existence of special relations with the funds.
The Group’s implicit or explicit commitments to back the funds.
Whether the Group has the capacity to use its power over the funds to influence the amount of the returns to which it is exposed.
Thus, there are cases where the Group is highly exposed to the existing variable returns and retains decision-making powers over the institution, either directly or through an agent. In these cases, the securitisation funds are consolidated with the Group.
3.2.7.2.2. Criteria for the recognition of earnings in the event of the removal of assets from the balance sheet
In order for the Group to recognise the result generated on the sale of financial instruments, the sale has to involve the corresponding removal from the accounts, which requires the fulfillment of the requirements governing the substantial transfer of risks and benefits as described in the preceding point.
The result will be reflected on the income statement, being calculated as the difference between the book value and the net value received including any new additional assets obtained minus any liabilities assumed.
When the amount of the financial asset transferred matches the total amount of the original financial asset, the new financial assets, financial liabilities and liabilities for the provision of services, as appropriate, that are generated as a result of the transfer will be recorded according to their fair value.
3.2.7.2.3. Key hypothesis for valuing risks and benefits retained on securitised assets
The Group considers that a substantial withholding is made of the risks and benefits of securitisations when the subordinated bonds of issues are kept and/or it grants subordinated finance to the securitisation funds that mean substantially retaining the credit losses expected from the loans transferred.
3.2.7.3. Risk transfer in securitisation activities
A securitisation fulfills the criterion of significant and effective transfer of risk, and therefore falls within the solvency framework of the securitisations, when it meets the conditions laid down in Articles 244.2 and 243.2 of the CRR.
3.2.7.4. Securitisation exposure in the investment portfolio and financial instruments held for trading
The table below shows the amounts in terms of EAD of investment and trading book by type of exposure:

3. rIsksBBVA. PILAR III 2017 P. 100
Table 49. SEC1: Securitisation exposures in the banking book (Million Euros. 12-31-17)
12-31-17Bank acts as originator Bank acts as sponsor Bank acts as investor
Traditional Synthetic Subtotal Traditional Synthetic Subtotal Traditional Synthetic Subtotal Retail (total)- of which - - - - - - 4,635 - 4,635 Residential mortgage - - - - - - 4,447 - 4,447 Credit card - - - - - - 188 - 188 Other retail exposures - - - - - - - - - Re-Securitisation - - - - - - - - - Wholesale (total)- of which 97 2,391 2,488 338 338 Loans to corporates 56 2,391 2,447 - - - 51 - 51 Commercial mortgage - - - - - - 1 - 1 Lease and receivables 42 - 42 - - - - - - Other wholesale - - - - - - 285 - 285 Re-Securitisation - - - - - - - - -
SEC1: Securitisation exposures in the banking book (Million Euros. 12-31-16)
12-31-16Bank acts as originator Bank acts as sponsor Bank acts as investor
Traditional Synthetic Subtotal Traditional Synthetic Subtotal Traditional Synthetic Subtotal Retail (total)- of which 14 - 14 - - - 5,485 - 5,485 Residential mortgage - - - - - - 5,232 - 5,232 Credit card - - - - - - 253 - 253 Other retail exposures 14 - 14 - - - - - - Re-Securitisation - - - - - - - - - Wholesale (total)- of which 107 - 107 - - - 434 - 434 Loans to corporates 65 - 65 - - - 61 - 61 Commercial mortgage - - - - - - 2 - 2 Lease and receivables 42 - 42 - - - - - - Other wholesale - - - - - - 372 - 372 Re-Securitisation - - - - - - - - -
As of December 31 2017 and December 31 2016, the Group has no securitisation exposure in the financial instruments held for trading.
3.2.7.5. Investment or retained securitisations
The table below shows the amounts in terms of EAD and RWAs of investment securitisation positions by type of
exposure, tranches and weighting ranges corresponding to the securitisations and their corresponding capital requirements as of December 31, 2017 and December 31, 2016.

3. rIsksBBVA. PILAR III 2017 P. 101
Table 50. SEC4: Securitisation exposures in the banking book and associated capital requirements (Bank acting as investor) (Million Euros. 12-31-17)
Exposure values (by RW bands) Exposure values (by regulatory approach) RWA (by regulatory approach) Capital requirement after cap
≤20% RW >20% to 50% RW
>50% to 100% RW
>100% to <1250% RW
1250% RW
IRB RBA (including
IAA) IRB SFA SA/SSFA 1250%
IRB RBA (including
IAA) IRB SFA SA/SSFA 1250%
IRB RBA (including
IAA) IRB SFA SA/SSFA 1250%
Total Exposures 4,475 432 20 6 39 655 - 4,279 39 146 - 924 12 - - - Traditional Securitisation 4,475 432 20 6 39 655 - 4,279 39 146 - 924 12 - - - Of which Securitisation 4,475 432 20 6 39 655 - 4,279 39 146 - 924 12 - - - Of which retail underlying 4,247 328 15 6 39 574 - 4,022 39 124 - 856 10 - - - Of which wholesale 228 105 5 - 1 81 - 256 1 23 - 68 2 - - - Of which re-Securitisation - - - - - - - - - - - - - - - - - Of which senior - - - - - - - - - - - - - - - - - Of which non-senior - - - - - - - - - - - - - - - - - Synthetic Securitisation - - - - - - - - - - - - - - - - - Of which Securitisation - - - - - - - - - - - - - - - - - Of which retail underlying - - - - - - - - - - - - - - - - - Of which wholesale - - - - - - - - - - - - - - - - - Of which re-Securitisation - - - - - - - - - - - - - - - - - Of which senior - - - - - - - - - - - - - - - - - Of which non-senior - - - - - - - - - - - - - - - - -
SEC4: Securitisation exposures in the banking book and associated capital requirements (Bank acting as investor) (Million Euros. 12-31-16)
Exposure values (by RW bands) Exposure values (by regulatory approach) RWA (by regulatory approach) Capital requirement after cap
≤20% RW >20% to 50% RW
>50% to 100% RW
>100% to <1250% RW
1250% RW
IRB RBA (including
IAA) IRB SFA SA/SSFA 1250%
IRB RBA (including
IAA) IRB SFA SA/SSFA 1250%
IRB RBA (including
IAA) IRB SFA SA/SSFA 1250%
Total Exposures 5,214 542 87 15 62 731 - 5,127 62 207 - 1,144 Traditional Securitisation 5,214 542 87 15 62 731 - 5,127 62 207 - 1,144 Of which Securitisation 5,214 542 87 15 62 731 - 5,127 62 207 - 1,144 Of which retail underlying 4,912 434 63 15 61 621 - 4,803 61 178 - 1,051 Of which wholesale 303 107 24 - 0 110 - 324 0 29 - 93Of which re-Securitisation - - - - - - - - - - - - - - - - - Of which senior - - - - - - - - - - - - - - - - - Of which non-senior - - - - - - - - - - - - - - - - - Synthetic Securitisation - - - - - - - - - - - - - - - - - Of which Securitisation - - - - - - - - - - - - - - - - - Of which retail underlying - - - - - - - - - - - - - - - - - Of which wholesale - - - - - - - - - - - - - - - - - Of which re-Securitisation - - - - - - - - - - - - - - - - - Of which senior - - - - - - - - - - - - - - - - - Of which non-senior - - - - - - - - - - - - - - - - -
12 12 12 10 2
- 74 - 74- 74- 68- 6
- 17 - 92 - - - 17 - 92 - - 17 - 92 - - 14 - 84 - - 3 - 8 -

3. rIsksBBVA. PILAR III 2017 P. 102
Below are the main variations in terms of RWAs during the period related to the investment and retained securitisations:
Table 51. Variation in terms of RWAs of investment and retained Securitisations (Million Euros)
Securitisation RiskRWAs as of December 31, 2016 1,477Effects Activity 274RWAs as of December 31, 2017 1,751
3.2.7.6. Originated securitisations
3.2.7.6.1. Rating agencies used
The external credit assessment institutions (ECAI) that have been involved in the Group’s issues that fulfill the criteria of risk transfer and fall within the securitisations solvency framework are, generally, Fitch, Moody’s, S&P and DBRS. The types of securitisation exposure for which each agency is used are, with no differentiation between the different agencies, all the asset types that tend to be used as residential mortgage loans, loans to SMEs and small companies, consumer finance and autos and leasing.
In all the SSPEs, the agencies have assessed the risk of the entire issuance structure:
Awarding ratings to all bond tranches.
Establishing the volume of the credit enhancement.
Establishing the necessary triggers (early termination of the restitution period, pro-rata amortisation of AAA classes, pro-rata amortisation of series subordinated to AAA and amortisation of the reserve fund, amongst others).
In each and every one of the issues, in addition to the initial rating, the agencies carry out regular quarterly monitoring.
3.2.7.6.2. Breakdown of securitised balances by type of asset
The table below shows the amounts in terms of EAD and RWAs of investment securitisation positions originated by type of exposure, tranches and weighting ranges corresponding to the securitisations and their corresponding capital requirements as of December 31, 2017 and December 31, 2016.

3. rIsksBBVA. PILAR III 2017 P. 103
Table 52. SEC3: Securitisation exposures in the banking book and associated regulatory capital requirements (Bank acting as originator or as sponsor) (Million Euros. 12-31-17)
Exposure values (by RW bands) Exposure values (by regulatory approach) RWA (by regulatory approach) Capital requirement after cap
≤20% RW
>20% to 50%
RW
>50% to 100%
RW >100% to
<1250% RW 1250%
RW
IRB RBA (including
IAA) IRB SFA SA/SSFA 1250%
IRB RBA (including IAA)
IRB SFA SA/SSFA 1250%
IRB RBA (including IAA)
IRB SFA SA/SSFA 1250%
Total Exposures 2,343 - 2 0 143 2,346 - - 143 132 - - 549 Traditional Securitisation - - 2 0 95 2 - - 95 0 - - 72 Of which Securitisation - - 2 0 95 2 - - 95 0 - - 72 Of which retail underlying - - - - - - - - - - - - - Of which wholesale - - 2 0 95 2 95 0 72 Of which re-Securitisation - - - - - - - - - - - - - Of which senior - - - - - - - - - - - - - Of which non-senior - - - - - - - - - - - - - Synthetic Securitisation 2,343 - - - 48 2,343 - - 48 132 - - 477 Of which Securitisation 2,343 - - - 48 2,343 - - 48 132 - - 477 Of which retail underlying - - - - - - - - - - - - - Of which wholesale 2,343 - - - 48 2,343 - - 48 132 477 Of which re-Securitisation - - - - - - - - - - - - - Of which senior - - - - - - - - - - - - - Of which non-senior - - - - - - - - - - - - -
SEC3: Securitisation exposures in the banking book and associated regulatory capital requirements (Bank acting as originator or as sponsor) (Million Euros. 12-31-16))
Exposure values (by RW bands) Exposure values (by regulatory approach) RWA (by regulatory approach) Capital requirement after cap
≤20% RW
>20% to 50%
RW
>50% to 100%
RW >100% to
<1250% RW 1250%
RW
IRB RBA (including
IAA) IRB SFA SA/SSFA 1250%
IRB RBA (including IAA)
IRB SFA SA/SSFA 1250%
IRB RBA (including IAA)
IRB SFA SA/SSFA 1250%
Total Exposures - - - - 121 - - - 121 - - - 126 - - - Traditional Securitisation - - - - 121 - - - 121 - - - 126 - - - Of which Securitisation - - - - 121 - - - 121 - - - 126 - - - Of which retail underlying - - - - 14 - - - 14 - - - 5 - - - Of which wholesale - - - - 107 - - - 107 - - - 120 - - - Of which re-Securitisation - - - - - - - - - - - - - - - - Of which senior - - - - - - - - - - - - - - - - Of which non-senior - - - - - - - - - - - - - - - - Synthetic Securitisation - - - - - - - - - - - - - - - - Of which Securitisation - - - - - - - - - - - - - - - - Of which retail underlying - - - - - - - - - - - - - - - - Of which wholesale - - - - - - - - - - - - - - - - Of which re-Securitisation - - - - - - - - - - - - - - - - Of which senior - - - - - - - - - - - - - - - - Of which non-senior - - - - - - - - - - - - - - - -
11 - - 44 - - - 6 - - - 6 - - - - - - - 6 - - - - - - - - - - - -
11 - - 38 11 - - 38
- - - - 11 - - 38
- - - - - - - - - - - -
10 10 10
- 10
- - - - - - - - - -

3. rIsksBBVA. PILAR III 2017 P. 104
The next tables give the current outstanding balance, non-performing exposures and impairment losses recognised in the period corresponding to the underlying assets of
originated securitisations, in which risk transfer criteria are fulfilled, broken down by type of asset, as of December 31, 2017 and December 31, 2016.
Table 53. Breakdown of securitized balances by type of asset (Million Euros. 12-31-17)
Type of asset Current balanceOf which: Non-performing
Exposures (1)Total impairment losses
for the periodCommercial and residential mortgagesCredit cardsFinancial leasingLending to corporates and SMEsConsumer financeReceivablesSecuritisation balancesOthersTOTAL(1) Includes the total number of impaired exposures due to non-performing or for reasons other than non-performing
Breakdown of securitized balances by type of asset (Million Euros. 12-31-16)
Type of asset Current balanceOf which: Non-performing
Exposures (1)Total impairment losses
for the periodCommercial and residential mortgages 2 8 6Credit cards - - - Financial leasing 97 13 - Lending to corporates and SMEs 73 12 0Consumer finance 3 0 1Receivables - - - Securitisation balances - - - Others - - - TOTAL 174 33 7(1) Includes the total number of impaired exposures due to non-performing or for reasons other than non-performing
In 2017 and 2016, there were no securitisations that fulfill the transfer criteria according to the requirements of the solvency regulation, and, therefore, no results were recognised.
BBVA has been the structurer of all transactions effected since 2006 (excluding the transactions for the merged companies Unnim and Catalunya Banc).
The table below shows the outstanding balance of underlying assets of securitisations originated by the Group, in which risk transfer criteria are not met. These, therefore, are not included in the solvency framework for securitisations; the capital exposed is calculated as if they had not been securitised:
Table 54. Outstanding balance corresponding to the underlying assets of the Group’s originated Securitisations, in which risk transfer criteria are not fulfilled (Million Euros)
Type of assetCurrent Balance
2017 2016Commercial and residential mortgages 28,576 28,921 Credit cards - - Financial leasing 3 3 Lending to corporates and SMEs 357 689 Consumer finance 3,036 2,266 Receivables - - Securitisation balances - - Mortgage-covered bonds - - Others - - TOTAL 31,971 31,880
1 - -- - -
64 7 42,238 16 3
- - -- -- - -
-2,304 23 7
-
- -

3. rIsksBBVA. PILAR III 2017 P. 105
In addition, the Group has carried out its first synthetic securitisation, introducing this new operating procedure as an additional source of release of regulatory capital. In a synthetic securitisation, the credit risk of the underlying loans is transferred to the securitisation funds, mainly by setting up guarantees or loan-based derivatives.
In the specific case of the Group’s first synthetic securitisation, the issue was for a total of €3.0 billion, which covers the potential losses on a portfolio of around 15,000 loans to Spanish SMEs. This was arranged by contracting a mezzanine financial guarantee facility with a European supranational body and the commitment to reinvest €1.0 billion on contracting new loans to SMEs. This operation enabled the Group to release €683m in RWAs. The nominal value of this financial guarantee is €143m.
3.2.8. Information on credit risk mitigation techniques
3.2.8.1. Hedging based on netting operations on and off the balance sheet
Within the limits established by the rules on netting in each one of its operating countries, the Group negotiates with its customers the assignment of the derivatives business to master agreements (e.g., ISDA or CMOF) that include the netting of off-balance-sheet transactions.
The clauses of each agreement determine in each case the transactions subject to netting.
The mitigation of counterparty risk exposure stemming from the use of mitigation techniques (netting plus the use of collateral agreements) leads to a reduction in overall exposure (current market value plus potential risk).
As pointed out above, financial assets and liabilities may be the object of netting, in other words presentation for a net amount on the balance sheet, only when the Group’s entities comply with the provisions of IAS 32 - Paragraph 42, and thus have the legal right to offset the amounts recognised, and the intention to settle the net amount or to divest the asset and pay the liability at the same time.
3.2.8.2. Hedging based on collateral
3.2.8.2.1. Management and valuation policies and procedures
The procedures for management and valuation of collateral are included in the Specific Collateral Rules, or in the Policies and Procedures for Retail and Wholesale Credit Risk.
These Policies and Procedures lay down the basic principles of credit-risk management, which includes the management of the collateral assigned in transactions with customers.
Accordingly, the risk management model jointly values the existence of a suitable cash flow generation by the obligor that enables them to service the debt, together with the existence of suitable and sufficient guarantees that ensure the recovery of the credit when the obligor’s circumstances render them unable to meet their obligations.
The valuation of the collateral is governed by prudential principles that involve the use of appraisal for real-estate guarantees, market price for shares, quoted value of shares in a mutual fund, etc.
The milestones under which the valuations of the collaterals must be updated in accordance with local regulation are established under these prudential principles.
With respect to the entities that carry out the valuation of the collateral, principles are in place in accordance with local regulations that govern their level of relationship and dependence with the Group and their recognition by the local regulator. These valuations will be updated by statistical methods, indices or appraisals of goods, which shall be carried out under the generally accepted standards in each market and in accordance with local regulations.
All collateral assigned is to be properly instrumented and recorded in the corresponding register, as well as receiving the approval of the Group’s legal units.
3.2.8.2.2. Types of collaterals
As collateral for the purpose of calculating equity, the Group uses the coverage established in the solvency regulations. The following are the main collaterals available in the Group:
Mortgage collateral: The collateral is the property upon which the loan is arranged.
Financial collateral: Their object is any one of the following financial assets, as per articles 197 and 198 of the solvency regulation.
• Cash deposits, deposit certificates or similar securities.
• Debt securities issued for the different categories.
• Shares or convertible bonds.
Other property and rights used as collateral. The following property and rights are considered acceptable as collateral as per article 200 of the solvency regulation.

3. rIsksBBVA. PILAR III 2017 P. 106
• Cash deposits, deposit certificates or similar instruments held in third-party institutions other than the lending credit institution, when these are pledged in favor of the latter.
• Life insurance policies pledged in favor of the lending credit institution.
• Debt securities issued by other institutions, provided that these securities are to be repurchased at a pre-set
price by the issuing institutions at the request of the holder of the securities.
The value of the exposure hedged with financial collateral and other collateral calculated using the standardised and advanced approaches, and the counterparty risk, is as follows:
Table 55. Exposure covered with financial guarantees and other collateral calculated using the standardised and advanced approaches (Million Euros)
Exposures Classes
2017 2016
Exposure covered by financial guarantees
Exposure covered by other elligible
collateralExposure covered by financial guarantees
Exposure covered by other elligible
collateralCentral governments or central banks 2,662 - 2,238 - Regional governments or local authorities 91 - 23 - Public sector entities 15 29 166 - Multilateral Development Banks - - - - International Organizations - - - - Institutions 4,097 106 7,394 - Corporates 9,165 1,388 12,338 306 Retail 870 1,287 1,263 45 Secured by mortgages on inmovable property 518 58 89 292 Exposures in default 16 0 24 11 Exposures associated with particularly high risk 1 - 0 - Covered bonds - - - - Short-term claims on institutions and corporate - - - - Collective investments undertakins - - 79 - Other exposures - - 1 - TOTAL GUARANTEES VALUE UNDER STANDARDISED APPROACH 17,435 2,867 23,614 653
Central governments or central banks 713 0 459 0 Institutions 48,818 141 49,574 677 Retail 77 854 - - Corporates 1,296 8,397 1,272 12,186 TOTAL GUARANTEES VALUE UNDER IRB APPROACH 50,904 9,392 51,305 12,862TOTAL 68,340 12,259 74,920 13,515
3.2.8.3. Hedging based on personal guarantees
According to the solvency regulations, unfunded credit protection consists of personal guarantees, including those arising from credit insurance, that have been granted by the providers of coverage defined in articles 201 and 202 of the solvency regulation.
In the category of Retail exposure under the advanced measurement approach, guarantees impact on the PD and do not reduce the amount of the credit risk in EAD.
The total value of the exposure covered with personal guarantees is as follows (including counterparty risk):

3. rIsksBBVA. PILAR III 2017 P. 107
Table 56. Exposure covered by personal guarantees. Standardised and advanced approach (Million Euros)
Exposures ClassesExposure covered by personal guarantees
2017 2016Central governments or central banks - - Regional governments or local authorities 3,247 38 Public sector entities 12 2,323 Multilateral Development Banks - - International organizations - - Institutions 508 534 Corporates 3,100 1,650 Retail 2,537 1,823 Secured by mortgages on immovable property 42 531 Exposures in default 172 115 Exposures associated with particularly high risk 24 61 Covered bonds - - Short-term claims on institutions and corporate - - Collective investments undertakings - - Other exposures 4,069 1,069 TOTAL PERSONAL GUARANTEES VALUE UNDER STANDARDISED APPROACH 13,710 8,145Central governments or central banks 621 1,105 Institutions 20,091 21,433 Retail 106 30 Corporates 8,058 6,768 Of which: SMEs 2,057 2,103 Of which: SMEs subject to corrector factor - - Of which: others 6,002 4,665 TOTAL PERSONAL GUARANTEES VALUE UNDER IRB APPROACH 28,876 29,336TOTAL 42,586 37,481
an overview of the level of use of each of the credit risk mitigation techniques employed by the Group as of December 31, 2017 is presented below:
Table 57. CR3 – CRM techniques – Overview (1) (Million Euros. 12-31-17)
Exposures unsecured -
carrying amount
Exposures secured -
Carrying amount
Exposures secured by
collateral
Exposures secured by
financial guarantees
Exposures secured by credit
derivativesTotal Loans 344,164 87,537 37,616 27,161 - Total debt securities 56,288 17,239 6,051 7,692 - Total exposures 400,451 104,777 43,666 34,853 - Of which: defaulted 8,842 2,221 1,376 374 - (1) Securitisation risk is not included
CR3 – CRM techniques – Overview (1) (Million Euros. 12-31-16)
Exposures unsecured -
carrying amount
Exposures secured -
Carrying amount
Exposures secured by
collateral
Exposures secured by
financial guarantees
Exposures secured by credit
derivativesTotal Loans 359,945 93,919 44,080 12,626 - Total debt securities 72,179 11,328 9,524 293 - Total exposures 432,188 105,183 53,604 12,919 - Of which: defaulted 9,269 2,972 2,326 587 - (1) Securitisation risk is not included
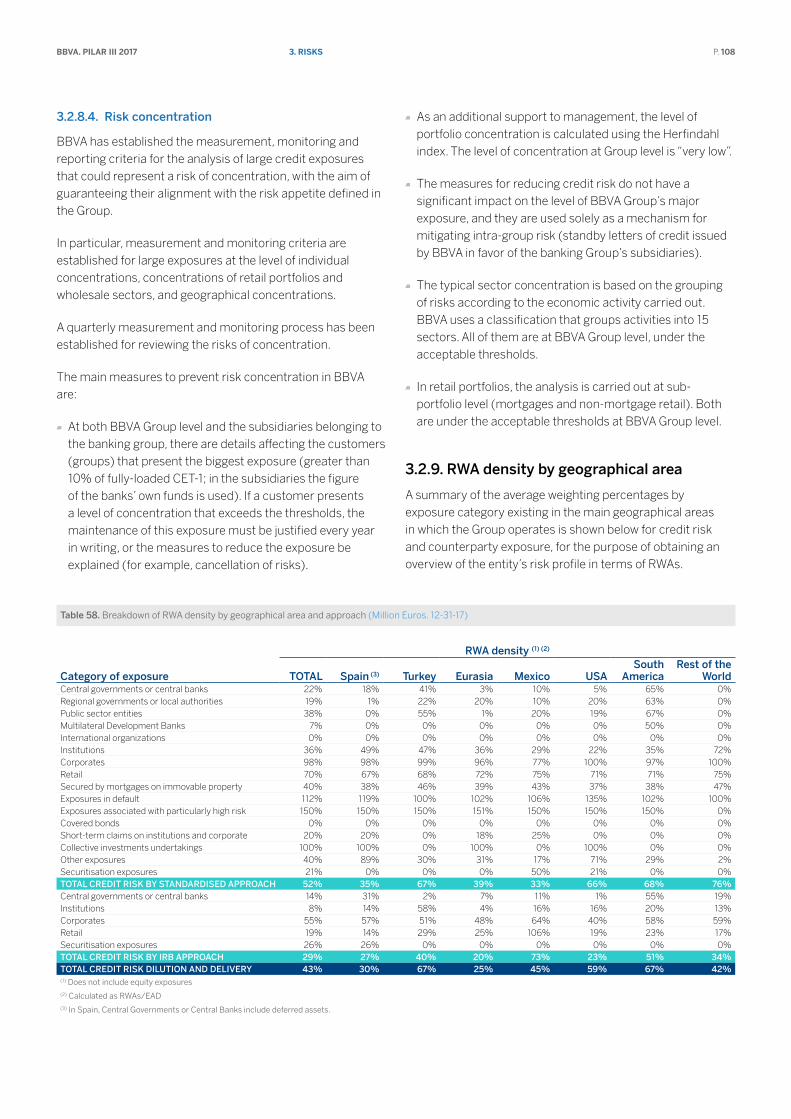
3. rIsksBBVA. PILAR III 2017 P. 108
3.2.8.4. Risk concentration
BBVA has established the measurement, monitoring and reporting criteria for the analysis of large credit exposures that could represent a risk of concentration, with the aim of guaranteeing their alignment with the risk appetite defined in the Group.
In particular, measurement and monitoring criteria are established for large exposures at the level of individual concentrations, concentrations of retail portfolios and wholesale sectors, and geographical concentrations.
A quarterly measurement and monitoring process has been established for reviewing the risks of concentration.
The main measures to prevent risk concentration in BBVA are:
At both BBVA Group level and the subsidiaries belonging to the banking group, there are details affecting the customers (groups) that present the biggest exposure (greater than 10% of fully-loaded CET-1; in the subsidiaries the figure of the banks’ own funds is used). If a customer presents a level of concentration that exceeds the thresholds, the maintenance of this exposure must be justified every year in writing, or the measures to reduce the exposure be explained (for example, cancellation of risks).
As an additional support to management, the level of portfolio concentration is calculated using the Herfindahl index. The level of concentration at Group level is “very low”.
The measures for reducing credit risk do not have a significant impact on the level of BBVA Group’s major exposure, and they are used solely as a mechanism for mitigating intra-group risk (standby letters of credit issued by BBVA in favor of the banking Group’s subsidiaries).
The typical sector concentration is based on the grouping of risks according to the economic activity carried out. BBVA uses a classification that groups activities into 15 sectors. All of them are at BBVA Group level, under the acceptable thresholds.
In retail portfolios, the analysis is carried out at sub-portfolio level (mortgages and non-mortgage retail). Both are under the acceptable thresholds at BBVA Group level.
3.2.9. RWA density by geographical area
A summary of the average weighting percentages by exposure category existing in the main geographical areas in which the Group operates is shown below for credit risk and counterparty exposure, for the purpose of obtaining an overview of the entity’s risk profile in terms of RWAs.
Table 58. Breakdown of RWA density by geographical area and approach (Million Euros. 12-31-17)
RWA density (1) (2)
Category of exposure TOTAL Spain (3) Turkey Eurasia Mexico USASouth
AmericaRest of the
WorldCentral governments or central banks 22% 18% 41% 3% 10% 5% 65% 0%Regional governments or local authorities 19% 1% 22% 20% 10% 20% 63% 0%Public sector entities 38% 0% 55% 1% 20% 19% 67% 0%Multilateral Development Banks 7% 0% 0% 0% 0% 0% 50% 0%International organizations 0% 0% 0% 0% 0% 0% 0% 0%Institutions 36% 49% 47% 36% 29% 22% 35% 72%Corporates 98% 98% 99% 96% 77% 100% 97% 100%Retail 70% 67% 68% 72% 75% 71% 71% 75%Secured by mortgages on immovable property 40% 38% 46% 39% 43% 37% 38% 47%Exposures in default 112% 119% 100% 102% 106% 135% 102% 100%Exposures associated with particularly high risk 150% 150% 150% 151% 150% 150% 150% 0%Covered bonds 0% 0% 0% 0% 0% 0% 0% 0%Short-term claims on institutions and corporate 20% 20% 0% 18% 25% 0% 0% 0%Collective investments undertakings 100% 100% 0% 100% 0% 100% 0% 0%Other exposures 40% 89% 30% 31% 17% 71% 29% 2%Securitisation exposures 21% 0% 0% 0% 50% 21% 0% 0%TOTAL CREDIT RISK BY STANDARDISED APPROACH 52% 35% 67% 39% 33% 66% 68% 76%Central governments or central banks 14% 31% 2% 7% 11% 1% 55% 19%Institutions 8% 14% 58% 4% 16% 16% 20% 13%Corporates 55% 57% 51% 48% 64% 40% 58% 59%Retail 19% 14% 29% 25% 106% 19% 23% 17%Securitisation exposures 26% 26% 0% 0% 0% 0% 0% 0%TOTAL CREDIT RISK BY IRB APPROACH 29% 27% 40% 20% 73% 23% 51% 34%TOTAL CREDIT RISK DILUTION AND DELIVERY 43% 30% 67% 25% 45% 59% 67% 42%(1) Does not include equity exposures(2) Calculated as RWAs/EAD(3) In Spain, Central Governments or Central Banks include deferred assets.

3. rIsksBBVA. PILAR III 2017 P. 109
Breakdown of RWA density by geographical area and approach (Million Euros. 12-31-16)
RWA density (1) (2)
Category of exposure TOTAL Spain (3) Turkey Eurasia Mexico USASouth
AmericaRest of the
WorldCentral governments or central banks 22% 17% 44% 4% 13% 12% 68% 0%Regional governments or local authorities 19% 10% 25% 30% 2% 20% 66% 0%Public sector entities 30% 8% 85% 70% 20% 20% 59% 0%Multilateral Development Banks 56% 0% 0% 8% 0% 0% 104% 0%International organizations 0% 0% 0% 0% 0% 0% 0% 0%Institutions 33% 5% 76% 26% 26% 21% 31% 57%Corporates 98% 95% 99% 94% 88% 99% 98% 99%Retail 70% 68% 68% 72% 74% 71% 72% 78%Secured by mortgages on immovable property 39% 39% 45% 40% 37% 37% 39% 49%Exposures in default 116% 118% 112% 102% 100% 129% 118% 100%Exposures associated with particularly high risk 150% 150% 150% 0% 150% 0% 150% 0%Covered bonds 0% 0% 0% 0% 0% 0% 0% 0%Short-term claims on institutions and corporate 22% 22% 0% 20% 0% 0% 21% 0%Collective investments undertakings 100% 100% 0% 100% 0% 100% 100% 0%Other exposures 37% 68% 49% 8% 18% 61% 27% 0%Securitisation exposures 22% 0% 0% 0% 50% 22% 0% 0%TOTAL CREDIT RISK BY STANDARDISED APPROACH 53% 33% 72% 35% 36% 65% 67% 83%Central governments or central banks 8% 21% 2% 4% 18% 1% 9% 19%Institutions 8% 15% 65% 4% 25% 23% 38% 22%Corporates 56% 58% 75% 50% 61% 44% 72% 57%Retail 21% 15% 157% 38% 105% 18% 25% 28%Securitisation exposures 39% 39% 0% 0% 0% 0% 0% 0%TOTAL CREDIT RISK BY IRB APPROACH 31% 28% 49% 21% 72% 34% 57% 44%TOTAL CREDIT RISK DILUTION AND DELIVERY 44% 30% 72% 25% 47% 61% 67% 51%(1) Does not include equity exposures(2) Calculated as RWAs/EAD(3) In Spain, Central Governments or Central Banks include deferred assets.
3.2.10. Risk protection and reduction policies. Supervision strategies and processes
In most cases, maximum exposure to credit risk is reduced by collateral, credit enhancements and other actions which mitigate the Group’s exposure. The BBVA Group applies a credit risk hedging and mitigation policy derived from an approach to the banking business focused on relationship banking.
The existence of guarantees could be a necessary but not sufficient instrument for accepting risks, as the assumption of risks by the Group requires the verification of the debtor’s capacity for repayment, or that the debtor can generate sufficient resources to allow the amortisation of the risk incurred under the agreed terms.
The policy of accepting risks is therefore organised into three different levels in BBVA Group:
Analysis of the financial risk of the operation, based on the debtor’s capacity for repayment or generation of funds.
The constitution of guarantees that are adequate for the risk assumed, in any of the generally accepted forms: monetary, secured, personal or hedge guarantees; and finally,
Assessment of the repayment risk (asset liquidity) of the guarantees received.
This is carried out through a prudent risk management policy which involves analyzing the financial risk in a transaction, based on the repayment or resource generation capacity of the credit receiver, the provision of guarantees -in any of the generally accepted ways (monetary, collateral or personal guarantees and hedging)- appropriate to the risk borne, and lastly on the valuation of the recovery risk (the asset’s liquidity) of the guarantees received.
The procedures for the management and valuation of collateral are set out in the Credit Risk Management Policies and Procedures (retail and wholesale), which establish the basic principles for credit risk management, including the management of collateral arranged in transactions with customers. The criteria for the systematic, standardised and effective treatment of collateral in credit transaction procedures in BBVA Group’s wholesale and retail banking are included in the Specific Collateral Rules.
The methods used to value the collateral are in line with the best market practices and imply the use of appraisal of real-estate collateral, the market price in market securities, the trading price of shares in mutual funds, etc. All collateral assigned must be properly drawn up and entered in the

3. rIsksBBVA. PILAR III 2017 P. 110
corresponding register. They must also have the approval of the Group’s legal units.
The following is a description of the main types of collateral for each financial instrument class:
Financial assets held for trading: The guarantees or credit enhancements obtained directly from the issuer or counterparty are implicit in the clauses of the instrument.
Derivatives and hedge accounting derivatives: In derivatives, credit risk is minimised through contractual netting agreements, where positive- and negative-value derivatives with the same counterparty are offset for their net balance. There may likewise be other kinds of guarantees, depending on counterparty solvency and the nature of the transaction.
Financial assets designated at fair value through profit or loss and available-for-sale financial assets: Guarantees or credit enhancements obtained directly from the
issuer or counterparty are inherent in the structure of the instrument.
Loans and receivables:
• Loans and advances to credit institutions: These usually only have the counterparty’s personal guarantee.
• Loans and advances to customers: Most of these operations are backed by personal guarantees extended by the counterparty. There may also be collateral to secure loans and advances to customers (such as mortgages, cash guarantees, pledged securities and other collateral), or to obtain other credit enhancements (bonds, hedging, etc.).
• Debt securities: Guarantees or credit enhancements obtained directly from the issuer or counterparty are inherent in the structure of the instrument.
Financial guarantees, other contingent risks and drawable by third parties: These have the counterparty’s personal guarantee.
3.3. market risk
3.3.1. Scope and nature of the market risk measurement and reporting systems
Market risk originates in the possibility that there may be losses in the value of positions held due to movements in the market variables that affect the valuation of financial products and assets in trading activity.
The main risks generated may be classified into the following groups:
Interest-rate risk: They arise as a result of exposure to the movement in the different interest-rate curves on which there is trading. Although the typical products generating sensitivity to movements in interest rates are money market products (deposits, futures on interest rates, call money swaps, etc.) and the traditional interest-rate derivatives (swaps, interest-rate options such as caps, floors, swaptions, etc.), practically all the financial products have some exposure to movements in interest rates due to the effect of the financial discount in valuing them.
Equity Risk: Arises as a result of movements in the price of shares. This risk is generated in spot positions in shares or any derivative products whose underlying asset is a share or an equity index. Dividend risk is a sub-risk of equity risk, as an input of any equity option. Its variability may affect the
valuation of positions and thus it is a factor that generates risk on the books.
Exchange-rate risk: It occurs due to a movement in the exchange rates of the currencies in which the position is held. As in the case of equity risk, this risk is generated in the spot foreign-currency positions, as well as any derivative product whose underlying is an exchange rate.
In addition, the quanto effect (transactions where the underlying and the nominal of the transaction are denominated in different currencies) means that in certain transactions where the underlying is not a currency an exchange-rate risk is generated that has to be measured and monitored.
Credit spread risk: Credit spread is an indicator of an issuer’s credit quality. The spread risk takes place due to variations in the levels of spread in corporate or government issuers and affects both bond and credit derivative positions.
Volatility risk: This occurs as a result of variations in the levels of implied volatility in the price of different market instruments in which derivatives are traded. This risk, unlike the others, is exclusively a component of derivative transactions and is defined as a risk of first-order convexity

3. rIsksBBVA. PILAR III 2017 P. 111
that is generated in all the possible underlying transactions where there are products with an optionality that require a volatility input for their valuation.
The metrics developed to control and monitor market risk in BBVA Group are aligned with best practices in the market and are implemented consistently across all the local market risk units.
Measurement procedures are established in terms of the possible impact of negative market conditions on the trading book of the Group’s Global Markets units, both under ordinary circumstances and in situations of heightened risk factors.
The standard metric used to measure market risk is Value at Risk (VaR), which indicates the maximum losses that may be incurred in the portfolios at a given confidence level (99%) and time horizon (one day).
Chapter 3.3.4 explains in more detail the risk measurement models used in BBVA Group, focused on internal models approved by the supervisor for BBVA S.A. and BBVA Bancomer for the purpose of calculating the capital for positions in the trading book. The two entities contribute around 70% of the market risk of the Group’s trading book. For the rest of the geographic areas (South America and Compass), the calculation of capital for the risk positions in the trading book is carried out using the standard model.
Analysis of the entity’s RWA structure demonstrates that 4% corresponds to Market Risk (including the foreign-exchange risk).
3.3.2. Differences in the trading book for the purposes of applying the solvency regulations and accounting criteria
According to the solvency regulation, the trading book shall be made up of all the positions in financial instruments and commodities that the credit institution holds for the purpose of trading or that act as hedging for other elements in this book.
With respect to this book, the rule also refers to the need to establish clearly defined policies and procedures.
For this purpose, regulatory trading book activities defined by BBVA Group include the positions managed by the Group’s Trading units, for which market risk limits are set and then monitored daily. Moreover, they comply with the other requirements defined in the solvency regulations.
The trading book as an accounting concept is not confined to any business area, but rather follows the true reflection
criteria laid down in the accounting standards. Included in this category are all the financial assets and liabilities originated, acquired or issued with the aim of short-term redemption or repurchase, whether they are part of a jointly-managed portfolio of instruments for which there is evidence of recent action to obtain short-term gains, or derivative instruments that do not comply with the definition of a collateral contract and have not been designated as hedge accounting instruments. Hence, for example, all derivatives are booked as accounting trading book unless they are hedging derivatives, regardless of whether or not they are part of the Trading units’ exposure or they come from other business areas.
3.3.3. Standardised approach
RWAs weighted for market risk under the standardised approach (excluding exchange-rate risk) account for 25% of the total of the standardised and advanced approaches.
the amounts in terms of RWAs and capital requirements by market risk calculated under the standardised approach as of December 31, 2017 and December 31, 2016 are presented below:
Table 59. EU MR1 – Market risk under the standardised approach (Million Euros. 12-31-17)
RWAsCapital
RequirementsOutright Products Interest Rate Risk 2,461 197 Equity Risk 197 16 Foreign Exchange Risk 4,579 366 Commodity Risk 9 1 Options Simplified approach Delta-plus method Scenario approach Securitisation 20 2 Correlation trading portfolio 142 11 Total 7,408 593
EU MR1 Market risk under the standardised approach (Million Euros. 12-31-16)
RWAsCapital
RequirementsOutright Products Interest Rate Risk 2,638 211 Equity Risk 234 19 Foreign Exchange Risk 4,041 323 Commodity Risk 118 9 Options Simplified approach Delta-plus method Scenario approach Securitisation 17 1 Correlation trading portfolio 63 5 Total 7,112 569
3. rIsksBBVA. PILAR III 2017 P. 112
3.3.4. Internal models
3.3.4.1. Scope of application
For the purposes of calculating capital as approved by the supervisor, the scope of application of the internal market risk model extends to BBVA S.A. and BBVA Bancomer Trading Floors.
As explained in Note 7.4 of the Group’s Consolidated Financial Statements, most of the items on the Group’s consolidated balance sheet subject to market risk are positions whose principal metric used to measure their market risk is VaR.
This Note specifies the accounting headings of the consolidated balance sheets as of December 31, 2017 and 2016 in the geographic areas with an Internal Model where there is market risk in the trading activity subject to this measurement.
3.3.4.2. Characteristics of the models used
The measurement procedures are established in terms of the possible impact of negative market conditions, both under ordinary circumstances and in situations of tension, on the trading book of the Group’s Global Markets units.
The standard metric used to measure market risk is Value at Risk (VaR), which indicates the maximum losses that may be incurred in the portfolios at a given confidence level (99%) and time horizon (one day).
This statistic is widely used in the market and has the advantage of summarizing in a single metric the risks inherent in trading activity, taking into account the relations between all of them, and providing the forecast of the losses that the trading book might incur as a result of price variations in equity markets, interest rates, exchange rates and credit. In addition, for certain positions, other risks also need to be considered, such as credit spread risk, basis risk, volatility and correlation risk.
With respect to the risk measurement models used in BBVA Group, the supervisor has authorised the use of the internal model for the calculation of capital for the risk positions in the trading book of BBVA, S.A. and BBVA Bancomer which, together, account for around 70% of the market risk of the Group’s trading book.
BBVA users a single model to calculate the regulatory requirements by risk, taking into account the correlation between the assets and thus recognizing the diversifying effect of the portfolios. The model used estimates the VaR in accordance with the “historical simulation” methodology, which involves estimating the losses and gains that would have been incurred in the current portfolio if the changing market conditions that occurred over a given period of
time were repeated. Based on this information, it infers the maximum foreseeable loss in the current portfolio with a given level of confidence.
Absolute and relative returns are used in simulating the potential variation of the risk factors, depending on the type of risk factor. Relative returns are used in the case of equity and foreign currency; while absolute returns are used in the case of spreads and interest rates.
The decision on the type of return to apply is made according to the risk factor metric subject to variation. The relative return is used in the case of price risk factors, while for interest-rate risk factors it is absolute returns.
The model has the advantage of accurately reflecting the historical distribution of the market variables and of not requiring any specific distribution assumption. The historical period used in this model is two years.
VaR figures are estimated following two methodologies:
VaR without smoothing, which awards equal weight to the daily information for the previous two years. This is currently the official methodology for measuring market risks for the purpose of monitoring compliance with risk limits.
VaR with smoothing, which weighs more recent market information more heavily. This model adjusts the historical information of each market variable to reflect the differences between historical volatility and current volatility. This metric is supplementary to the one above.
VaR with smoothing adapts itself more swiftly to the changes in financial market conditions, whereas VaR without smoothing is, in general, a more stable metric that will tend to exceed VaR with smoothing when the markets show less volatile trends, but be lower when they present upturns in uncertainty.
Furthermore, and following the guidelines established by Spanish and European regulators, BBVA incorporates additional VaR metrics to fulfill the regulatory requirements issued by the supervisor for the purpose of calculating capital for the trading book. Specifically, the new measures incorporated in the Group since December 2011 (which follow the guidelines set out by Basel 2.5) are as follows:
VaR: In regulatory terms, the charge for VaR Stress is added to the charge for VaR and the sum of both (VaR and VaR Stress) is calculated. This quantifies the losses associated with movements in the risk factors inherent in market operations (interest rate, FX, RV, credit, etc.).

3. rIsksBBVA. PILAR III 2017 P. 113
Both VaR and VaR Stress are rescaled by a regulatory multiplier set at three and by the square root of ten to calculate the capital charge.
Specific Risk: Incremental Risk Capital (IRC). Quantification of non-performing risk and downgrade risk in the rating of some positions held in the portfolio, such as bonds and credit derivatives. The specific risk capital IRC is a charge exclusively for those geographical areas with an approved internal model (BBVA S.A. and Bancomer).
The capital charge is determined based on the associated losses (at 99.9% over a time horizon of 1 year under the assumption of constant risk) resulting from the rating migration and/or default of the asset’s issuer. Also included is the price risk in sovereign positions for the indicated items.
The calculation methodology is based on the Monte Carlo simulation of the impact of defaults and rating transitions on the portfolio of positions subject to incremental risk capital. The model defining the transition and default process of a counterparty is based on the changes in a counterparty’s credit quality. Under a Merton one-factor model, which underlies the Basel or Creditmetrics model, this credit quality will correspond to the value of the issuer’s assets, depending on a systemic factor that is common to all the issuers, and an idiosyncratic factor specific to each.
All that is needed to simulate the rating transition and default process of the issuers is to simulate the systemic factor and idiosyncratic component. Once the underlying variable is available, the final rating can be obtained. The simulation of the individual credit quality of the issuers allows the losses by systemic risk and idiosyncratic risk to be obtained.
Transition matrices
The transition matrix used for calculation is estimated based on the external information of the rating transitions provided by the rating agencies. Specifically, the information provided by the Standard & Poors agency is used.
The appropriateness of using information on external transitions is justified by:
The internal ratings for the Sovereign, Emerging Sovereign Country (ESC), Financial Institution (FI) and Corporate segments (which constitute the core positions subject to incremental risk capital) are aligned with the external ratings. By way of example, the internal rating system for financial institutions is based on an algorithm that uses external ratings.
The rating agencies provide sufficient historical information to cover a complete economic cycle (rating transition information is available dating back to year 1981) and obtain a long-term transition matrix in the same way as the calculation of the regulatory capital for credit risk in the banking book long-term probabilities of default are required.
This historical depth is not available for the internal rating systems.
Although external data are used for determining the transitions between ratings, to establish the default, probabilities are used assigned by the BBVA master scale, which ensures consistency with the probabilities used for the calculations of capital in the Banking Book.
The transition matrix is recalibrated every year, based on information on transitions provided by Standard & Poor’s. A procedure has been defined to readjust the transitions in accordance with the probability of default assigned by the master scale.
Liquidity horizons
The calculation of incremental risk capital used by BBVA explicitly includes the use of positions with a hypothesis of a constant level of risk and liquidity horizons of less than one year.
The establishment of liquidity horizons follows the guidelines/criteria established by Basel in its guidelines for computing capital for incremental risk.
First, a criterion of management capacity for positions has been used for positions through liquid instruments that can hedge their inherent risks. The main instrument for hedging the price risk for rating transitions and defaults is the Credit Default Swap (CDS). The existence of this hedging instrument serves as a justification for considering a short liquidity horizon.
However, in addition to considering the existence of a liquid CDS, a distinction has to be made according to the issuer’s rating (this factor is also mentioned in the aforementioned guidelines). Specifically, between investment grade issuers or those with a rating equal to or above BBB-, and issuers below this limit.
According to these criteria, the issuers are mapped to standard liquidity horizons of 3, 6 or 12 months.
Correlation
The calculation methodology is based on a single-factor model, in which there is one factor common to all the

3. rIsksBBVA. PILAR III 2017 P. 114
counterparties. The coefficient of the model is determined by the correlation curves established by Basel for companies, financial institutions and sovereigns based on the probability of default.
The use of the Basel correlation curve ensures consistency with the calculation of regulatory capital under the IRB approach for the positions on the banking book.
Specific Risk: Securitisations and Correlation Portfolios. Capital charge for the securitisations and the correlation portfolio for potential losses associated with the rating level of a given credit structure (rating). Both are calculated using the standardised approach. The perimeter of the correlation portfolios is referred to First-to-default (FTD) type market operations and/or market CDO tranches, and only for positions with an active market and hedging capacity.
Validity tests are performed periodically on the risk measurement models used by the Group. They estimate the maximum loss that could have been incurred in the positions assessed with a given level of probability (backtesting), as well as measurements of the impact of extreme market events on the risk positions held (stress testing).
Backtesting is performed at the trading desk level as an additional control measure in order to carry out a more specific monitoring of the validity of the measurement models.
The current structure for managing market risk includes monitoring market risk limits, which consists of a system of limits based on Value at Risk (VaR), economic capital (based on VaR measurements) and VaR sub-limits, as well as stop-loss limits for each of the Group’s business units. The global limits are approved by the Executive Committee on an annual basis, once they have been analysed by the GRMC and the Risk Committee. This limits structure is developed by identifying specific risks by type, trading activity and trading desk. The market risk unit maintains consistency between the limits. The control structure in place is supplemented by limits on loss and a system of alert signals to anticipate the effects of adverse situations in terms of risk and/or result.
The review of the quality of the inputs used by the evaluation processes is based on checking the data against other sources of information accepted as standard. These checks detect errors in the historical series such as repetitions, data outside the range, missing data, etc. As well as these periodic checks of the historical data loaded, the daily data that feed these series are subject to a data quality process to guarantee their integrity.
The choice of proxies is based on the correlation detected between the performance of the factor to be entered
and the proxy factor. A Simple Linear Regression model is used, selecting the proxy that best represents the determination coefficient (R2) within the whole period for which the performance of both series is available. Next, the performance of the factor on the necessary dates is reconstructed, using the beta parameter estimated in the simple linear regression.
3.3.4.2.1. Methodology and valuation and description of the independent price verification process
The fair value is the price that would be received for selling an asset or paid for transferring a liability in an orderly transaction between market participants. It is therefore a market-based measurement, and not specific to each entity.
The fair value is reached without making any deduction in transaction costs that might be incurred due to sale or disposal by other means.
The process of determining fair value established in the Group ensures that assets and liabilities are valued correctly. At level of geographic areas, BBVA has established a structure of New Product Committees responsible for validating and approving new products or classes of assets and liabilities before their contracting. The committee members are the local areas, independent of the business, who are responsible for their valuation (see Note 7 of the Group’s Consolidated Annual Report).
These areas are responsible for ensuring as a prior step to approval that the technical and human capacities are in place, and that sufficient sources of information are available to value the assets and liabilities, in accordance with the criteria established by the Global Valuation Area and using models validated and approved by the Risk Analytics Area, which answers to Global Risk Management.
In addition, for assets and liabilities in which significant elements of uncertainty are detected in the inputs or parameters of the models used, which may affect their valuation, criteria are established to measure this uncertainty and limits are set on activity based on them. Finally, valuations obtained in this way are, as far as possible, checked against other sources, such as the valuations obtained by the business teams or other market participants.
In the initial entry, the best evidence of fair value is the list price on an active market. When these prices are not available, recent transactions on the same instrument will be consulted or the valuation will be made using mathematical measurement models that are sufficiently tried and trusted by the international financial community. In subsequent valuations, fair value will be obtained by one of the following methods:

3. rIsksBBVA. PILAR III 2017 P. 115
Level 1: Measurement using observable quoted prices for the financial instrument in question, referring to market assets (as defined by the Group’s internal policies), secured from independent sources.
Level 2: Measurement that applies techniques whose significant variables are observable market data.
Level 3: Measurement that applies techniques that use significant variables not obtained from market observable data. Model selection and validation was undertaken by control areas outside the market units.
Not all the financial assets and liabilities are accounted at fair value; when it is not possible to reliably estimate a capital instrument’s fair value, it will be valued at its cost.
(See Note 8 of the Group’s Consolidated Financial Statements for more information)
3.3.4.2.2. Market risk in 2017
In 2017, the average VaR was €27m, lower than the levels in 2016, with a maximum level for the year on January 11 of €34m.
The following values (maximum, minimum, average and at year end within the statement period) are given based on the different model types used for calculating the capital requirement:
Table 60. EU MR3 – IMA values for trading portfolios (Million Euros)
IMA values for trading portfolios (2017)VaR (10 day 99%)
1 Maximum value 752 Average value 553 Minimum value 414 Period value 57
SVaR (10 day 99%)5 Maximum value 1806 Average value 1167 Minimum value 808 Period value 127
Incremental Risk Charge (99.9%)9 Maximum value 16510 Average value 11611 Minimum value 7712 Period value 92
Below is the VaR without smoothing by risk factor for the Group:
Chart 20: Trading Book. VaR without smoothing
-
10
20
30
40
Jan-
17
Feb-
17
Mar
-17
Apr
-17
May
-17
Jun-
17
Jul-1
7
Aug
-17
Sep
-17
Oct
-17
Nov
-17
Dec
-17
Table 61. Trading Book. VaR without smoothing by risk factors (Million Euros)
VaR by risk factorsInterest-rate and
spread riskExchange- rate
risk Equity riskVega /
correlation riskDiversification
effect (*) TotalDecember 2017Average VaR for the period 25 10 3 13 (23) 27Maximum VaR for the period 27 11 2 12 (19) 34Minimum VaR for the period 23 7 4 14 (26) 22VaR at the end of the period 23 7 4 14 (26) 22
December 2016Average VaR for the period 28 10 4 11 (23) 29Maximum VaR for the period 30 16 4 11 (23) 38Minimum VaR for the period 21 10 1 11 (20) 23VaR at the end of the period 29 7 2 12 (24) 26* The diversification effect is the difference between the sum of the risk factors measured individually and the total VaR figure that reflects the implicit correlation between all the variables and scenarios used in the measurement
By type of market risk assumed by the Group’s trading book, the main risk factor in the Group continues to be the one linked to interest rates, with a weight of 48% of the total at the end of 2017 (this figure includes the spread risk), with the relative weight dropping compared to the close of 2016
(58%). Foreign exchange risk accounts for 14%, increasing this proportion slightly compared with December 2016 (13%), while equity risk and volatility and correlation risk have increased more, with a weight of 38% as at end of 2017 (vs. 29% at the end of 2016).

3. rIsksBBVA. PILAR III 2017 P. 116
In accordance with article 455 e) of the CRR, corresponding to the breakdown of information on internal market risk models, the elements comprising the shareholders’ equity
requirements referred to in articles 364 and 365 of the CRR are presented below.
Table 62. EU MR2-A – Market risk under the IMA (Million Euros. 12-31-17)
RWAs Capital RequirementsVaR 2,232 179 Previous day's VaR 716 57 Average of the daily VaR on each of the preceding sixty business days (VaRavg) x multiplication factor 2,232 179 SVaR 5,138 411 Latest SVaR 1,590 127 Average of the SVaR during the preceding sixty business days (sVaRavg) x multiplication factor (mc) 5,138 411 Incremental risk charge - IRC 1,240 99 Most recent IRC value 1,147 92 Average of the IRC number over the preceding 12 weeks 1,240 99 Comprehensive Risk Measure- CRM - - Most recent risk number for the correlation trading portfolio over the preceding 12 weeks - - Average of the risk number for the correlation trading portfolio over the preceding 12 weeks - - 8% of the own funds requirement in SA on most recent risk number for the correlation trading portfolio - - Others - - Total 8,611 689
EU MR2-A – Market risk under the IMA (Million Euros. 12-31-16)
RWAs Capital RequirementsVaR 3,006 240 Previous day's VaR 1,046 84 Average of the daily VaR on each of the preceding sixty business days (VaRavg) x multiplication factor 3,006 240 SVaR 4,412 353 Latest SVaR 1,434 115 Average of the SVaR during the preceding sixty business days (sVaRavg) x multiplication factor (mc) 4,412 353 Incremental risk charge - IRC 1,841 147 Most recent IRC value 1,551 124 Average of the IRC number over the preceding 12 weeks 1,841 147 Comprehensive Risk Measure- CRM - - Most recent risk number for the correlation trading portfolio over the preceding 12 weeks - - Average of the risk number for the correlation trading portfolio over the preceding 12 weeks - - 8% of the own funds requirement in SA on most recent risk number for the correlation trading portfolio - - Others - - Total 9,258 741
Below are the main changes in the market RWAs, calculated using the method based on internal models:
Table 63. EU MR2-B – RWA flow statements of market risk exposures under the IMA (Million Euros)
RWA flow statements of market risk exposure under IMA VaR SVaR IRC CRM Other
Total RWAs
Total Capital Requirements
RWAs as of December 31, 2016 3,006 4,412 1,841 - - 9,258 741Movement in risk levels (695) 813 (581) - - (462) (37)Model updates/changes - - - - - - -Methodology and policy - - - - - - -Acquisitions and disposals - - - - - - -Foreign Exchange movements (79) (87) (20) - - (186) (15)Other - - - - - -RWAs as of December 31, 2017 2,232 5,138 1,240 - - 8,611 689
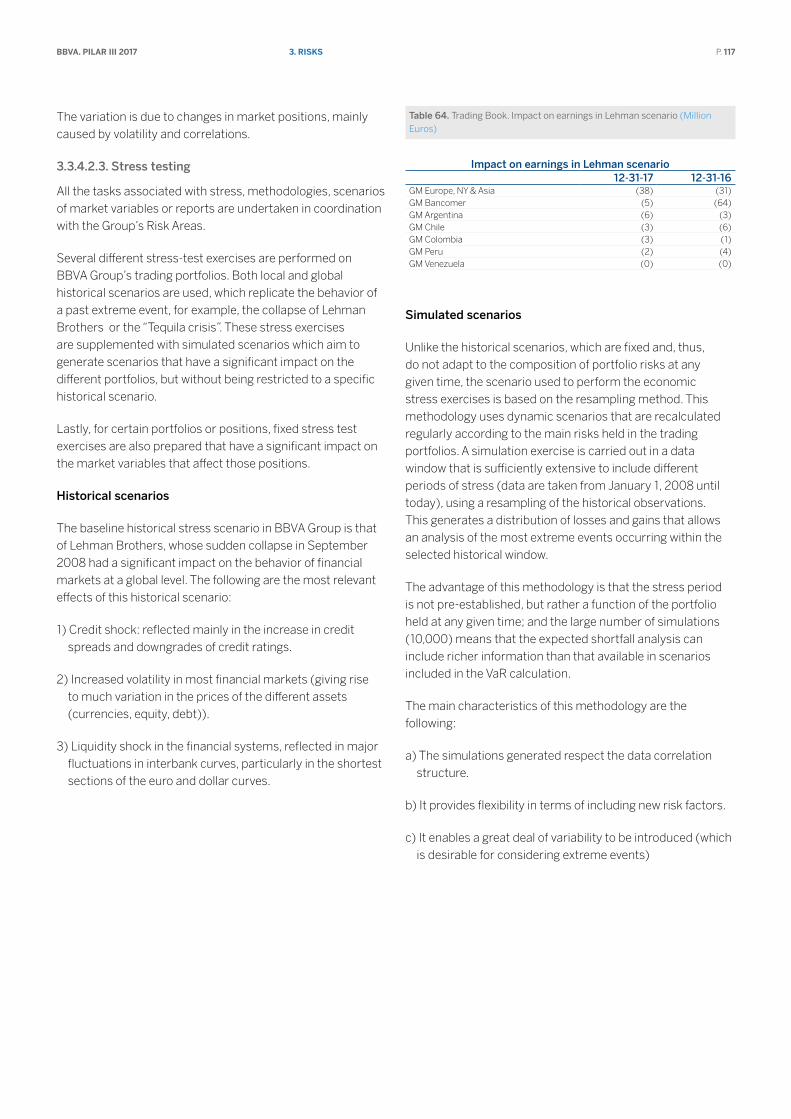
3. rIsksBBVA. PILAR III 2017 P. 117
The variation is due to changes in market positions, mainly caused by volatility and correlations.
3.3.4.2.3. Stress testing
All the tasks associated with stress, methodologies, scenarios of market variables or reports are undertaken in coordination with the Group’s Risk Areas.
Several different stress-test exercises are performed on BBVA Group’s trading portfolios. Both local and global historical scenarios are used, which replicate the behavior of a past extreme event, for example, the collapse of Lehman Brothers or the “Tequila crisis”. These stress exercises are supplemented with simulated scenarios which aim to generate scenarios that have a significant impact on the different portfolios, but without being restricted to a specific historical scenario.
Lastly, for certain portfolios or positions, fixed stress test exercises are also prepared that have a significant impact on the market variables that affect those positions.
Historical scenarios
The baseline historical stress scenario in BBVA Group is that of Lehman Brothers, whose sudden collapse in September 2008 had a significant impact on the behavior of financial markets at a global level. The following are the most relevant effects of this historical scenario:
1) Credit shock: reflected mainly in the increase in credit spreads and downgrades of credit ratings.
2) Increased volatility in most financial markets (giving rise to much variation in the prices of the different assets (currencies, equity, debt)).
3) Liquidity shock in the financial systems, reflected in major fluctuations in interbank curves, particularly in the shortest sections of the euro and dollar curves.
Table 64. Trading Book. Impact on earnings in Lehman scenario (Million Euros)
Impact on earnings in Lehman scenario12-31-17 12-31-16
GM Europe, NY & Asia (38) (31)GM Bancomer (5) (64)GM Argentina (6) (3)GM Chile (3) (6)GM Colombia (3) (1)GM Peru (2) (4)GM Venezuela (0) (0)
Simulated scenarios
Unlike the historical scenarios, which are fixed and, thus, do not adapt to the composition of portfolio risks at any given time, the scenario used to perform the economic stress exercises is based on the resampling method. This methodology uses dynamic scenarios that are recalculated regularly according to the main risks held in the trading portfolios. A simulation exercise is carried out in a data window that is sufficiently extensive to include different periods of stress (data are taken from January 1, 2008 until today), using a resampling of the historical observations. This generates a distribution of losses and gains that allows an analysis of the most extreme events occurring within the selected historical window.
The advantage of this methodology is that the stress period is not pre-established, but rather a function of the portfolio held at any given time; and the large number of simulations (10,000) means that the expected shortfall analysis can include richer information than that available in scenarios included in the VaR calculation.
The main characteristics of this methodology are the following:
a) The simulations generated respect the data correlation structure.
b) It provides flexibility in terms of including new risk factors.
c) It enables a great deal of variability to be introduced (which is desirable for considering extreme events)

3. rIsksBBVA. PILAR III 2017 P. 118
The impact of the stress tests by simulated scenarios (Stress VaR 95% at 20 days, Expected Shortfall 95% at 20 days and Stress VaR 99% at 1 day) is shown below.
Table 65. Trading Book. Stress resampling (Million Euros)
Europe Bancomer Peru Venezuela Argentina Colombia Chile TurquíaExpected Shortfall (75) (29) (8) (0) (8) (8) (9) (1)
2017Stress VaR Expected Shortfall Stress Period Stress VaR 1D
95 20 D 95 20 D 99% ResamplingTOTALGM Europe, NY & Asia (52) (75) 02/01/2008 - 02/12/2009 (18)GM Bancomer (21) (29) 12/09/2008 - 09/09/2010 (9)
3.3.4.2.4. Backtesting
The Group’s market risk measurement model needs to have a backtesting or self-validation program that assures that the risk measurements being made are appropriate.
The internal market risk model is validated on a regular basis by backtesting, in both BBVA S.A. and Bancomer.
The purpose of backtesting is to validate the quality and accuracy of the internal model used by BBVA Group to estimate the maximum daily loss for a portfolio, for a 99% confidence level and a time horizon of 250 days, by comparing the Group’s results and the risk measures generated by the model.
These tests confirmed that the internal market risk model used by BBVA S.A. and Bancomer is adequate and accurate.
Two types of backtesting were performed in 2017:
a. “Hypothetical” backtesting: the daily VaR is compared with the results obtained, not taking into account the intraday results or the changes in the portfolio positions. This validates the appropriateness of the market risk metrics for the end-of-day position.
b. “Real” backtesting: the daily VaR is compared with the total results, including intraday transactions, but discounting the possible minimum charges or fees involved. This type of backtesting incorporates the intraday risk in the portfolios.
In addition, each of these two types of backtesting was performed at risk factor or business type level, thus providing a more in-depth comparison of results versus risk measures.
Chart 21: Trading Book. Validation of the Market Risk Measurement model for BBVA S.A. Hypothetical backtesting (EU MR4)
-20.000
-15.000
-10.000
-5.000
0
+5.000
+10.000
+15.000
+20.000
09
-Jan
-17
19-J
an-1
7
29-J
an-1
7
08
-Feb
-17
18-F
eb-1
7
28-F
eb-1
7
10-M
ar-1
7
20-M
ar-1
7
30
-Mar
-17
09
-Apr
-17
19-A
pr-1
7
29-A
pr-
17
09
-May
-17
19-M
ay-1
7
29-M
ay-1
7
08
-Jun
-17
18-J
un-1
7
28-J
un-1
7
08
-Jul
-17
18-J
ul-1
7
28-J
ul-1
7
07-
Aug
-17
17-A
ug-1
7
27-A
ug-1
7
06
-Sep
-17
16-S
ep-1
7
26-S
ep-1
7
06
-Oct
-17
16-O
ct-1
7
26-O
ct-1
7
05-
Nov
-17
15-N
ov-1
7
25-N
ov-1
7
05-
Dec
-17
15-D
ec-1
7
25-D
ec-1
7
Tho
usan
ds
Eur
o
Daily VaR Losses Profits

3. rIsksBBVA. PILAR III 2017 P. 119
Chart 22: Trading Book. Validation of the Market Risk Measurement model for BBVA S.A. Real backtesting (EU MR4)
-20.000
-15.000
-10.000
-5.000
0
+5.000
+10.000
+15.000
+20.000
09
-Jan
-17
19-J
an-1
7
29-J
an-1
7
08
-Feb
-17
18-F
eb-1
7
28-F
eb-1
7
10-M
ar-1
7
20-M
ar-1
7
30
-Mar
-17
09
-Apr
-17
19-A
pr-1
7
29-A
pr-
17
09
-May
-17
19-M
ay-1
7
29-M
ay-1
7
08
-Jun
-17
18-J
un-1
7
28-J
un-1
7
08
-Jul
-17
18-J
ul-1
7
28-J
ul-1
7
07-
Aug
-17
17-A
ug-1
7
27-A
ug-1
7
06
-Sep
-17
16-S
ep-1
7
26-S
ep-1
7
06
-Oct
-17
16-O
ct-1
7
26-O
ct-1
7
05-
Nov
-17
15-N
ov-1
7
25-N
ov-1
7
05-
Dec
-17
15-D
ec-1
7
25-D
ec-1
7
Tho
usan
ds
Eur
o
Daily VaR losses profits
Chart 23: Trading Book. Validation of the Market Risk Measurement model for BBVA Bancomer. Hypothetical backtesting (EU MR4)
-400.000
-300.000
-200.000
-100.000
0
+100.000
+200.000
+300.000
+400.000
09
-Jan
-17
19-J
an-1
7
29-J
an-1
7
08
-Feb
-17
18-F
eb-1
7
28-F
eb-1
7
10-M
ar-1
7
20-M
ar-1
7
30
-Mar
-17
09
-Apr
-17
19-A
pr-1
7
29-A
pr-
17
09
-May
-17
19-M
ay-1
7
29-M
ay-1
7
08
-Jun
-17
18-J
un-1
7
28-J
un-1
7
08
-Jul
-17
18-J
ul-1
7
28-J
ul-1
7
07-
Aug
-17
17-A
ug-1
7
27-A
ug-1
7
06
-Sep
-17
16-S
ep-1
7
26-S
ep-1
7
06
-Oct
-17
16-O
ct-1
7
26-O
ct-1
7
05-
Nov
-17
15-N
ov-1
7
25-N
ov-1
7
05-
Dec
-17
15-D
ec-1
7
25-D
ec-1
7
Tho
usan
ds
Eur
o
Daily VaR Losses Profits

3. rIsksBBVA. PILAR III 2017 P. 120
Chart 24: Trading Book. Validation of the Market Risk Measurement model for BBVA Bancomer. Real backtesting (EU MR4)
-400.000
-300.000
-200.000
-100.000
0
+100.000
+200.000
+300.000
+400.000
09
-Jan
-17
19-J
an-1
7
29-J
an-1
7
08
-Feb
-17
18-F
eb-1
7
28-F
eb-1
7
10-M
ar-1
7
20-M
ar-1
7
30
-Mar
-17
09
-Apr
-17
19-A
pr-1
7
29-A
pr-
17
09
-May
-17
19-M
ay-1
7
29-M
ay-1
7
08
-Jun
-17
18-J
un-1
7
28-J
un-1
7
08
-Jul
-17
18-J
ul-1
7
28-J
ul-1
7
07-
Aug
-17
17-A
ug-1
7
27-A
ug-1
7
06
-Sep
-17
16-S
ep-1
7
26-S
ep-1
7
06
-Oct
-17
16-O
ct-1
7
26-O
ct-1
7
05-
Nov
-17
15-N
ov-1
7
25-N
ov-1
7
05-
Dec
-17
15-D
ec-1
7
25-D
ec-1
7
Tho
usan
ds
Eur
o
Daily VaR Losses Profits
3.3.4.3. Characteristics of the risk management system
The Group has a risk management system in place which is appropriate for the volume of risks managed, complying with the functions set out in the Corporate Policy on Market Risks in Market Activities.
The risk units must have:
A suitable organisation (means, resources and experience) in line with the nature and complexity of the business.
Segregation of functions and independence in decision-making.
Performance under integrity and good governance principles, driving the best practices in the industry and complying with the rules, both internal (policies,
procedures) and external (regulation, supervision, guidelines).
The existence of channels for communication with the relevant corporate bodies at local level according to their corporate governance system, as well as with the Corporate Area.
All market risks existing in the business units that carry out their activity in markets must be adequately identified, measured and assessed, and procedures must be in place for their control and mitigation.
The Global Market Risk Unit (GMRU), as the unit responsible for managing market risk at Group level, must promote the use of objective and uniform metrics for measuring the different types of risks.

3. rIsksBBVA. PILAR III 2017 P. 121
3.4. Structural risk in the equity portfolio
3.4.1. Scope and nature of the structural risk in the equity portfolio measurement and reporting systems
The BBVA Group’s exposure to structural risk in the equity portfolio basically results from the holdings in industrial and financial companies, with medium/long-term investment horizons. It includes the holdings consolidated in the Group, although their variations in value have no immediate effect on equity in this case.
This exposure is adjusted to the net positions held in derivatives on their underlying assets, which are used to modulate portfolio sensitivity to potential price variations.
The GRM corporate area acts as an independent unit that is responsible for monitoring and analyzing risks, promoting the integration of risk metrics into management and providing tools that can anticipate potential deviations from targets.
It also monitors the level of compliance with the limits set by the Executive Committee. It reports on these levels regularly to the Global Risk Management Committee (GRMC), the Board’s Risk Committee and the Executive Committee, particularly in the case of overruns of the limits set.
The mechanisms of risk control and limitation hinge on the key aspects of exposure, earnings and economic capital. The structural equity risk management metrics designed by GRM according to the corporate model contribute to effective risk monitoring by estimating the sensitivity figures and the capital necessary to cover possible unexpected losses due to the variations in the value of the companies making up the Group’s equity portfolio, at a confidence level that corresponds to the institution’s target rating, and taking into account the liquidity of the positions and the statistical behavior of the assets under consideration.
To carry out a more in-depth analysis, stress tests and sensitivity analyses are carried out from time to time against different simulated scenarios, using both past crisis situations and forecasts by BBVA Research as the base. This checks that the risks are limited and that the tolerance levels set for the Group are not endangered.
On a quarterly basis, backtesting is carried out on the risk measurement model used.
3.4.2. Differentiation between portfolios held for sale and those held for strategic purposes
3.4.2.1. Portfolios held for sale
The portfolio held for sale is reflected in accounting terms by the entry entitled available-for-sale assets. In the case of capital instruments, this portfolio will include the capital instruments of institutions that are not strategic, which are not classified as the Group’s subsidiaries, associates, or jointly controlled businesses, and that have not been included in the fair value through profit or loss category.
The financial instruments contained in the available-for-sale financial assets portfolio are valued at their fair value both in their initial entry and on subsequent valuations.
The changes in value are recorded in equity unless objective evidence exists that the fall in value is due to asset impairment, in which case the amounts recorded will be written-off from equity and moved directly to the income statement.
3.4.2.2. Portfolios held for strategic purposes
The portfolio held for strategic purposes is included for accounting purposes under the heading of available-for-sale financial assets. An investment in capital instruments is considered strategic when it has been made with the intent of setting up or maintaining a long-term operating relationship with the subsidiary, although there is no significant influence on it, if at least one of the following situations is in place:
Representation on the Board of Directors or equivalent management body in the subsidiary.
Participation in the policy setting process, including those related to dividends and other payouts.
The existence of significant transactions between the investing institution and the subsidiary.
The exchange of senior management staff.
The supply of expert information of an essential nature.

3. rIsksBBVA. PILAR III 2017 P. 122
3.4.3. Book value and exposure of equity investments and capital instruments contained in above portfolios
The accompanying table shows the book value, exposure and RWAs of held-for-sale portfolios and portfolios held for strategic purposes:
Table 66. Breakdown of book value, EAD and RWAs of equity investments and capital instruments (Million Euros)
Equity investments and capital instruments (1)
2017 2016Book value OE EAD RWAs Book value OE EAD RWAs
Portfolio available for sale 3,084 3,084 3,084 5,779 3,885 3,885 3,885 6,488 Portfolio held for strategic purposes 4,715 4,715 4,715 10,996 4,327 4,327 4,327 10,151 Total 7,798 7,798 7,798 16,775 8,213 8,213 8,213 16,639 (1) The ‘Other financial assets with changes in P&L’ portfolio has no balance.
The accompanying table shows the types, nature and amounts of the original exposures in equity investments listed or unlisted on a stock market, with an item differentiating
sufficiently diversified portfolios and other unlisted instruments:
Table 67. Exposure in equity investments and capital instruments (Million Euros)
Item
Nature of Exposure (1)
2017 2016Non-derivatives Derivatives Non-derivatives Derivatives
Exchange-traded instruments 2,403 428 3,606 144 Non-exchange traded instruments 4,967 - 4,401 62
Included in sufficiently diversified portfolios 4,967 - 4,401 62
Other instruments - - - -
Total 7,370 428 8,006 207(1) Depending on their nature, equity instruments not included in Trading Book Activity will be separated into derivatives and non-derivatives. The amount shown refers to original exposure, i.e. gross exposure of value corrections through asset impairment and provisions, before applying risk mitigation techniques.
3.4.4. Risk-weighted assets of equity investments and capital instruments
Below is a breakdown of the RWAs by applicable method corresponding to equity investments and capital instruments as of December 31, 2017 and December 31, 2016:
Table 68. Breakdown of RWAs, equity investments and capital instruments by applicable approach (Million Euros)
ConceptRWA´s (Million Euros)
Internal Models Simple method PD/LGD method Total
12/31/2017Portfolio available for sale 2,261 924 2,594 5,779Portfolio held for strategic purposes - 8,637 2,359 10,996
12/31/2016Portfolio available for sale 961 973 4,554 6,488Portfolio held for strategic purposes - 9,808 342 10,151
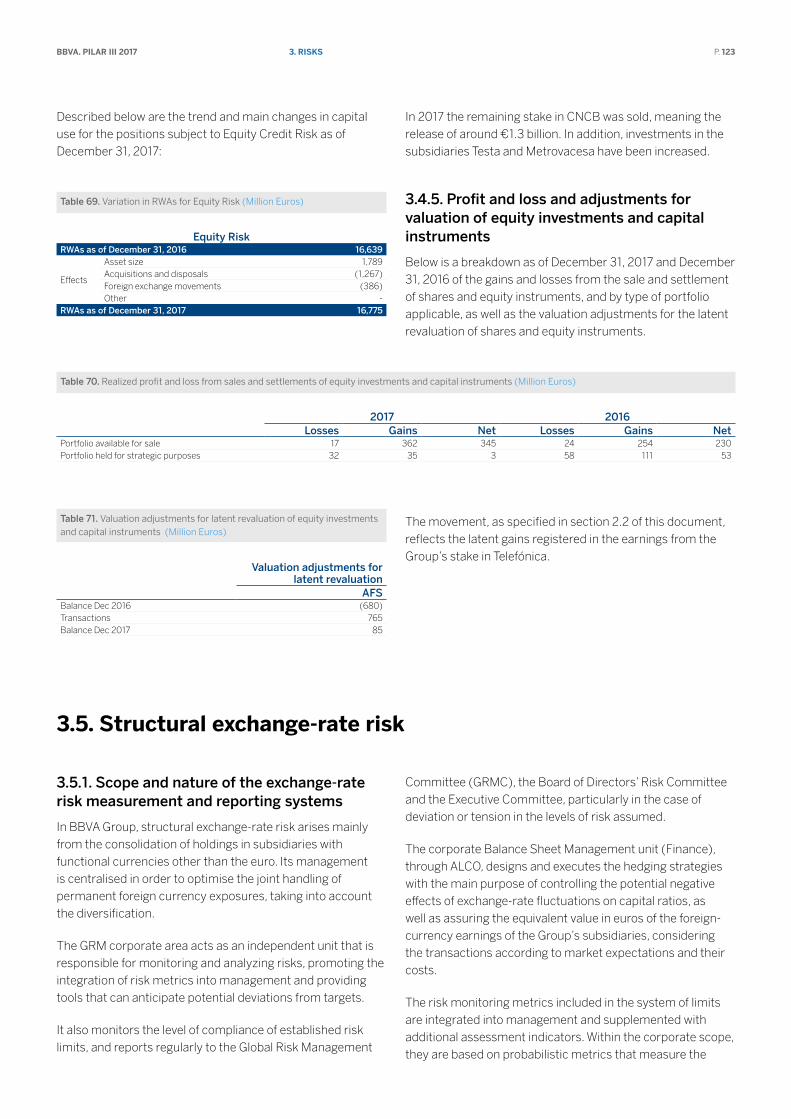
3. rIsksBBVA. PILAR III 2017 P. 123
Described below are the trend and main changes in capital use for the positions subject to Equity Credit Risk as of December 31, 2017:
Table 69. Variation in RWAs for Equity Risk (Million Euros)
Equity RiskRWAs as of December 31, 2016 16,639
Effects
Asset size 1,789 Acquisitions and disposals (1,267)Foreign exchange movements (386)Other -
RWAs as of December 31, 2017 16,775
In 2017 the remaining stake in CNCB was sold, meaning the release of around €1.3 billion. In addition, investments in the subsidiaries Testa and Metrovacesa have been increased.
3.4.5. Profit and loss and adjustments for valuation of equity investments and capital instruments
Below is a breakdown as of December 31, 2017 and December 31, 2016 of the gains and losses from the sale and settlement of shares and equity instruments, and by type of portfolio applicable, as well as the valuation adjustments for the latent revaluation of shares and equity instruments.
Table 70. Realized profit and loss from sales and settlements of equity investments and capital instruments (Million Euros)
2017 2016Losses Gains Net Losses Gains Net
Portfolio available for sale 17 362 345 24 254 230Portfolio held for strategic purposes 32 35 3 58 111 53
Table 71. Valuation adjustments for latent revaluation of equity investments and capital instruments (Million Euros)
Valuation adjustments for latent revaluation
AFSBalance Dec 2016 (680)Transactions 765 Balance Dec 2017 85
The movement, as specified in section 2.2 of this document, reflects the latent gains registered in the earnings from the Group’s stake in Telefónica.
3.5. Structural exchange-rate risk
3.5.1. Scope and nature of the exchange-rate risk measurement and reporting systems
In BBVA Group, structural exchange-rate risk arises mainly from the consolidation of holdings in subsidiaries with functional currencies other than the euro. Its management is centralised in order to optimise the joint handling of permanent foreign currency exposures, taking into account the diversification.
The GRM corporate area acts as an independent unit that is responsible for monitoring and analyzing risks, promoting the integration of risk metrics into management and providing tools that can anticipate potential deviations from targets.
It also monitors the level of compliance of established risk limits, and reports regularly to the Global Risk Management
Committee (GRMC), the Board of Directors’ Risk Committee and the Executive Committee, particularly in the case of deviation or tension in the levels of risk assumed.
The corporate Balance Sheet Management unit (Finance), through ALCO, designs and executes the hedging strategies with the main purpose of controlling the potential negative effects of exchange-rate fluctuations on capital ratios, as well as assuring the equivalent value in euros of the foreign-currency earnings of the Group’s subsidiaries, considering the transactions according to market expectations and their costs.
The risk monitoring metrics included in the system of limits are integrated into management and supplemented with additional assessment indicators. Within the corporate scope, they are based on probabilistic metrics that measure the

3. rIsksBBVA. PILAR III 2017 P. 124
maximum deviation in capital, CET1 (“Common Equity Tier 1”) ratio, and attributable profit. Probabilistic metrics enable an estimation of the overall impact of the exposure on the various currencies, considering the broad variability in listed currencies and their correlations.
The suitability of these risk assessment metrics is reviewed on a regular basis through backtesting exercises. A structural exchange-rate risk control is supplemented with an analysis of scenarios and stress with a view to proactively identifying possible future threats to the future compliance of risk appetite levels to enable the adoption, as the case may be, of the pertinent preventive actions. The scenarios are based on historical and risk model-simulated situations, and the risk scenarios provided by BBVA Research.
The level of exposure to structural exchange-rate risk in the Group has remained relatively stable since the close of 2016. The hedging policy aims to maintain the sensitivity of
the capital ratio and the Group’s earnings to changes in the exchange rates of emerging currencies, and is focused mainly on the Mexican peso and Turkish lira. The risk mitigation level of the capital adequacy ratio by the carrying amount of BBVA Group’s holdings in these currencies has remained at around 70%, and the hedging for management purposes of emerging-currency earnings amounted to 61%, focused on the Mexican peso and Turkish lira. At the close of the year, the sensitivity of the CET1 ratio to a 1% change in the euro’s exchange rate against each foreign currency is: US dollar: +1.2 bps; Mexican peso -0.1 bps; Turkish lira -0.1 bps; remaining currencies: -0.3 bps.
The RWAs of structural exchange rate risk as of December 2016 were €4,041 thousand, compared with €4,579 thousand as at end of 2017. The variations are due to the trend in structural positions and increased hedging on those positions.
3.6. Interest-Rate Risk
3.6.1 Scope and nature of the interest-rate risk measurement and reporting systems
The aim of managing balance-sheet interest rate risk is to maintain BBVA Group’s exposure to variations in interest rates at levels in line with its strategy and target risk profile.
Movements in interest rates lead to changes in a bank’s net interest income and book value, which constitute a key source of asset and liability interest-rate risk.
The extent of these impacts will depend on the bank’s exposure to changes in interest rates. This exposure is mainly the result of the time difference between the different maturity and repricing terms of the assets and liabilities on the banking book and the off-balance-sheet positions.
A financial institution’s exposure to adverse changes in market rates is a risk inherent in the banking business, while at the same time representing an opportunity to generate value. That is why the structural interest rate risk should be managed effectively and have a reasonable relation both to the bank’s capital base and the expected economic result. This function is handled by the Global ALM unit, within the Financial Management area. Through the Asset and Liability Committee (ALCO) it aims to guarantee the generation of recurrent earnings and preserve the entity’s solvency.
In pursuance of this, the ALCO develops strategies based on its market expectations, within the risk profile defined by
BBVA Group’s management bodies and balance the expected results and the level of risk assumed.
BBVA has a transfer pricing system, which centralises the Bank’s interest-rate risk on ALCO’s books and is designed to facilitate proper balance-sheet risk management.
The corporate GRM area is responsible for controlling and monitoring structural interest-rate risk, acting as an independent unit to guarantee that the risk management and control functions are properly segregated. This policy is in line with the Basel Committee on Banking Supervision recommendations. It constructs the structural interest-rate risk measurements used by the Group’s management, as well as designing models and measurement systems and developing monitoring, information and control systems. At the same time, the Global Risk Management Committee (GRMC) carries out the function of risk control and analysis reporting to the main governing bodies, such as the Executive Committee and the Board of Director’s Risk Committee.
BBVA’s structural interest-rate risk management procedure has a sophisticated set of metrics and tools that enable its risk profile to be monitored precisely. The model is based on a series of deeply analysed assumptions designed to characterise the balance sheet more accurately. Interest-rate risk measurement includes probabilistic metrics as well as calculations of the sensitivity to a parallel shift of +/- 100 basis points in the market interest-rate curves.

3. rIsksBBVA. PILAR III 2017 P. 125
There is regular measurement of the Bank’s banking book income at risk (IaR) and economic capital, defined as the maximum adverse deviations in net interest income and economic value, respectively, for a particular confidence level and time horizon.
These deviations are obtained by applying a simulation model of interest-rate curves that takes into account other sources of risks apart from directional movements, such as changes in the slope and curvature, and also the diversification between currencies and business units. The model is subject to regular internal validation, which includes backtesting.
The risk measurement model is supplemented by analysis of specific scenarios and stress tests. Stress tests have taken on particular importance in recent years. The analysis of extreme scenarios has been enhanced for this purpose in the event of a possible breakthrough in both current interest-rate levels and historical correlations and volatility. At the same time, the evaluation of scenarios forecast by the Economic Research Department has been maintained.
3.6.2 Nature of interest rate risk and key hypotheses
The Group’s exposure to variations in market interest rates is one of the main financial risks linked to the pursuit of its banking operations.
Repricing risk, which stems from the difference between the periods for reviewing interest rates or the maturity of investment transactions vis-à-vis their financing, constitutes the basic interest-rate risk to be considered. Nonetheless, other risks such as the exposure to changes in the slope and shape of interest rate curves and the risk of optionality present in certain banking transactions are also taken into consideration by risk control mechanisms.
The sensitivity measurements of the Group’s net interest income and economic value in the face of variations in market interest rates are supplemented with forecast and stress scenarios and risk measurements using curve simulation processes, thereby allowing an assessment of the impact of changes on the slope, curvature and parallel movements of varying magnitude.
Especially important in the measurement of structural interest rate risk, which is carried out every month, is the establishment of hypotheses on the changes and performance of certain items on the balance sheet, especially those involving products with no explicit or contractual due date.
The most significant of these hypotheses are those established on current and savings accounts, since they
largely condition risk levels given the volume they represent within the liabilities of the Group’s financial institutions.
A prior step to the study of these liabilities necessarily involves “account segmentation.” To do so, the balances on the balance sheet are broken down by products, analysed separately and subsequently grouped according to their common features, especially with regard to the type of customer and the criteria on the remuneration of each account, independently of the accounting standards on grouping.
A first stage involves analyzing the relationship between the trends in market interest rates and the interest rates of those accounts with no contractual due date. This relationship is established by the models which allow a determination of what the percentage impact of the variations in market interest rates is on the account’s remuneration and with what delay it occurs, for each type of account and customer and according to the interest-rate levels.
Subsequently, an analysis is made of the changes over time of the balances in each category in order to establish their overall trend against the seasonal variations in the balance. It is assumed that these seasonal variations mature in the very short term, whereas the trend in the balance is assigned a long-term maturity. This prevents oscillations in the level of risks caused by momentary variations in balances, thus favoring the stability of balance-sheet management. This breakdown of amounts is made by the regressions that best adjust historical changes to the balance over time.
Group companies have opted for different procedures to determine the maturity of transactional liabilities, taking into account the varying nature of markets and the availability of historical data. In the corporate model, a descriptive analysis of the data is used to calculate the average contractual period of the accounts and the conditioned probability of maturity for the life cycle of the product. A theoretical distribution of maturities of the trend balance is then estimated for each of the products, based on the average life of the stock and the conditioned probability.
A further aspect to be considered in the model’s hypotheses is the analysis of the prepayments (implicit optionality) associated with certain positions, especially with the loan-book, mortgage portfolios and customer deposits. Changes in market interest rates, together with other variables, may create incentives for the Bank’s customers to cancel loans or deposits early, thus modifying the future behavior of the balances on the balance sheet with respect to forecasts, in accordance with the contractual calendar of maturities.
The analysis of historical information relating to prepayments, and to other variables such as interest rates, allows an estimate of future repayments and their behavior linked to these variables.

3. rIsksBBVA. PILAR III 2017 P. 126
3.6.3 Variations in interest rates
The following tables present the average levels of interest-rate risk in terms of the sensitivity of net interest income and
economic value for the Group’s main financial institutions in 2017.
Table 72. Variations in interest rates. Impact on net interest income and economic value
Interest rate sensitivity analyses at December 2017
Impact on net interest income(*) Impact on economic value(**)
Increase of 100 basis points
Decrease of 100 basis points
Increase of 100 basis points
Decrease of 100 basis points
Europe (***) +(10% - 15%) - (5% - 10%) + (0% - 5%) - (0% - 5%)Mexico + (0% - 5%) - (0% - 5%) - (0% - 5%) + (0% - 5%)USA + (5% - 10%) - (5% - 10%) - (0% - 5%) - (0% - 5%)Turkey - (0% - 5%) + (0% - 5%) - (0% - 5%) + (0% - 5%)South America + (0% - 5%) - (0% - 5%) - (0% - 5%) + (0% - 5%)BBVA Group + (0% - 5%) - (0% - 5%) + (0% - 5%) - (0% - 5%)(*) Percentage of the projected "1 year" interest margin of each unit (**) Percentage of Core Capital per unit(***) In Europe it is considered that rate will move further downward to levels more negative than the current ones
The BBVA Group’s balance sheet has negative exposure to a fall in interest rates caused primarily by the euro and USD balance sheets. However, in Europe, the decline in rates is
limited as a result of the current interest rate level, which is very close to or even below zero, thus preventing the occurrence of extremely adverse scenarios.
3.7. Liquidity Risk
3.7.1. Liquidity and Funding Strategy and Planning
BBVA Group is a multinational financial institution whose business is focused mainly on retail and commercial banking activities. In addition to the retail business model, which forms the core of its business, the Group engages in corporate and investment banking, through the global CIB (Corporate & Investment Banking) division.
Liquidity and Funding planning is drawn up as part of the strategic processes for the Group’s budgetary and business planning, to ensure recurring growth of the banking business with suitable maturities and costs over a wide and diverse range of instruments.
The Group’s Funding and Liquidity strategy is based on the following pillars:
The principle of the funding self-sufficiency of its subsidiaries, meaning that each of the Liquidity Management Units (LMUs) must cover its funding needs independently on the markets where it operates. This avoids possible contagion due to a crisis affecting one or more of the Group’s LMUs.
Stable customer deposits as the main source of funding in all the LMUs, in accordance with the Group’s business model.
Diversification of the sources of wholesale funding, in terms of maturity, market, instruments, counterparties and currencies, with recurring access to the markets.
Compliance with regulatory requirements, ensuring the availability of ample liquidity buffers, as well as sufficient instruments as required by regulations with the capacity to absorb losses.
Compliance with the internal Liquidity Risk and Funding metrics, while adhering to the Risk Appetite level established for each LMU at any time.
Liquidity and funding risk management aims to ensure that in the short term a bank does not have any difficulties in meeting its payment commitments in due time and form, and that it does not have to make use of funding under burdensome terms, or conditions that deteriorate its image or reputation.

3. rIsksBBVA. PILAR III 2017 P. 127
In the medium term the aim is to ensure that the Group’s financing structure is ideal and that it is moving in the right direction with respect to the economic situation, the markets and regulatory changes.
This management of structural and liquidity funding is based on the principle of financial self-sufficiency of the entities that make it up. This approach helps prevent and limit liquidity risk by reducing the Group’s vulnerability during periods of high risk. This decentralised management prevents possible contagion from a crisis affecting only one or a few Group entities, which must act independently to meet their liquidity requirements in the markets where they operate.
As one aspect of this strategy, BBVA Group is organised into twelve LMUs composed of the parent and the banking subsidiaries in each geographical area, plus their dependent branches.
In addition, the policy for managing liquidity and funding risk is also based on the model’s robustness and on the planning and integration of risk management into the budgeting process of each LMU, according to the appetite for funding risk it decides to assume in its business.
3.7.2. Governance and monitoring
The responsibility for Liquidity and Funding management in normal business activity lies with the Finance area as a first line of defense in managing the risks inherent to this activity, in accordance with the principles established by the European Banking Authority EBA and in line with the most demanding standards, policies, procedures and controls in the framework established by the governing bodies. The Finance department, through the Balance-Sheet Management area, plans and executes the funding of the structural long-term gap of each LMU and proposes to the Assets and Liabilities Committee (ALCO) the actions to be taken on this matter, in accordance with the policies and limits established by the Executive Committee (EC).
The corporate Global Risk Management (GRM) area is as a second line of defense responsible for ensuring that liquidity and funding risk in the Group is managed according to the strategy approved by the Board of Directors. It is also responsible for identifying, measuring, monitoring and controlling this risk, reporting to the proper governing bodies, and providing the Group’s vision from the risk perspective.
To carry out this work adequately, the risk function in the Group has been set up as a single, global function that is independent of the management areas. This guarantees the separation of functions between the Liquidity and Funding Risk management area (Balance-Sheet Management) and the area that measures and controls risk (GRM-Structural Risks).
In addition, the Group has an Internal Risk Control unit that conducts an independent review of Liquidity and Funding Risk control and management, independently of the functions performed in this area by Internal Audit.
As a third line of defense in the Group’s internal control model, Internal Audit is in charge of reviewing specific controls and processes in accordance with an annual work plan.
Accounting and Supervisors (A&S), in its regulatory liquidity reporting function, coordinates the processes necessary to meet any requirements that may be generated at corporate and regulatory level, with the areas responsible for this reporting in each LMU, thereby ensuring the integrity of the information supplied.
As the core management element, the Group’s liquidity and funding risk objectives are determined through the Liquidity Coverage Ratio (LCR) and through the Loan-to-Stable Customer Deposits (LtSCD) ratio.
The LCR ratio is a regulatory metric that aims to guarantee the resilience of entities in a scenario of liquidity tension within a time horizon of 30 days. Within its risk appetite framework and system of limits and alerts, BBVA has established a required LCR compliance level for the entire Group and for each individual LMU. The required internal levels aim to comply efficiently and sufficiently in advance with the implementation of the 2018 regulatory requirement at a level above 100%.
The LtSCD ratio measures the relationship between net lending and stable customer funds. The aim is to preserve a stable funding structure in the medium term for each LMU making up BBVA Group, taking into account that maintaining an adequate volume of stable customer funds is key to achieving a sound liquidity profile. These stable resources in each LMU are calculated by analyzing the performance of the balances in the different customer segments identified as eligible to provide stability to the funding structure; prioritizing customer loyalty and applying greater haircuts to the funding lines for less stable customers. In order to establish the target (maximum) levels of LtSCD in each LMU and provide an optimal funding structure reference in terms of risk appetite, the corporate Structural Risks unit of GRM identifies and assesses the economic and financial variables that condition the funding structures in the different geographical areas.
The second core element in liquidity and funding risk management aims to achieve a proper diversification of the funding structure, avoiding excessive reliance on short-term funding by establishing a maximum level for the short-term funds raised, including both wholesale funding and customer funds. The residual maturity profile of long-term wholesale funding has no significant concentrations, which matches

3. rIsksBBVA. PILAR III 2017 P. 128
the schedule of planned issues to the best possible financial conditions of markets, as shown in the chart below. Finally, concentration risk is monitored at LMU level, with the aim of ensuring a correct diversification of both the counterparty and type of instrument.
The third core element is promoting the short-term resistance of the liquidity risk profile, guaranteeing that each UGL has sufficient collateral to deal with the risk of the close of wholesale markets. Basic capacity is the short-term liquidity risk management and control metric that is defined as the relationship between the available explicit assets and the maturities of wholesale liabilities and volatile funds, at different terms, with special relevance being given to 30-day maturities.
Stress tests are carried out as a fundamental element of the liquidity and funding risk monitoring scheme. They enable deviations from the liquidity targets and limits set in the appetite to be anticipated, and establish tolerance ranges in the different management areas. They also play a major role in the design of the Liquidity Contingency Plan and the definition of specific measures to be adopted to rectify the risk profile if necessary.
For each scenario, it is checked whether the LMU has a sufficient stock of liquid assets to guarantee its capacity to meet the liquidity commitments/outflows in the different periods analysed. The analysis considers four scenarios: one central and three crisis-related (systemic crisis; unexpected internal crisis with a considerable rating downgrade and/or affecting the ability to issue in wholesale markets and the perception of business risk by the banking intermediaries and the Entity’s customers; and a mixed scenario, as a combination of the two aforementioned scenarios). Each scenario considers the following factors: existing market liquidity, customer behavior and sources of funding, the impact of rating downgrades, market values of liquid assets and collateral, and the interaction between liquidity requirements and the development of the LMU’s asset quality.
Together with the results of the stress tests and the risk metrics, the early warning indicators play an important role within the corporate model and the Liquidity Contingency Plan. They are mainly indicators of the funding structure, in relation to asset encumbrance, counterparty concentration, flights of customer deposits, unexpected use of credit facilities, and of the market, which help anticipate possible risks and capture market expectations.
In order to implement this principle of anticipation, limits are set on an annual basis for the main management metrics that form part of the budgeting process for liquidity balance and finance. This framework of limits contributes to the planning of the joint future performance of:
The loan book, considering the types of assets and their degree of liquidity, a well as their validity as collateral in collateralised funding.
Stable customer funds, based on the application of a methodology for establishing which segments and customer balances are considered to be stable or volatile funds based on the principle of sustainability and recurrence of these funds.
Projection of the credit gap, in order to require a degree of self-funding that is defined in terms of the difference between the loan-book and stable customer funds.
Incorporating the planning of securities portfolios into the banking book, which include both fixed-interest and equity securities, and are classified as available-for-sale or held-to-maturity portfolios, and additionally on trading portfolios.
The structural gap projection, as a result of assessing the funding needs generated both from the credit gap and by the securities portfolio in the banking book, together with the rest of on-balance-sheet wholesale funding needs, excluding trading portfolios. This gap therefore needs to be funded with customer funds that are not considered stable or on wholesale markets.
As a result of these funding needs, BBVA Group plans the target wholesale funding structure according to the tolerance set in each LMU target.
Thus, once the structural gap has been identified and after resorting to wholesale markets, the amount and composition of wholesale structural funding is established in subsequent years, in order to maintain a diversified funding mix and guarantee that there is not a high reliance on short-term funding (short-term wholesale funding plus volatile customer funds).
In practice, the execution of the principles of planning and self-funding at the different LMUs results in the Group’s main source of funding being customer deposits, which consist mainly of demand deposits, savings deposits and time deposits.
As sources of funding, customer deposits are complemented by access to the interbank market and the domestic and international capital markets in order to address additional liquidity requirements, implementing domestic and international programs for the issuance of commercial paper and medium and long-term debt.
The process of analysis and assessment of the liquidity and funding situation and of the inherent risks is a process carried out on an ongoing basis in BBVA Group, with the participation of all the Group areas involved in liquidity and

3. rIsksBBVA. PILAR III 2017 P. 129
funding risk management. This process is carried out at both local and corporate level. It is incorporated into the decision-making process for liquidity and funding management, with integration between the risk appetite strategy and establishment and the planning process, the funding plan and the limits scheme.
A statement of the level of appropriateness of the liquidity risk management mechanisms is included as part of the Internal Liquidity Adequacy Assessment Process (ILAAP) approved by the Board of Directors in April 2017:
“To sum up, the internal assessment exercise conducted as part of this process reveals that the liquidity and funding management model is robust, with a medium-low liquidity risk profile, and shows no significant weaknesses that may entail the need for additional measures or liquid funds in addition to those currently available or planned.”
3.7.3. Liquidity and funding performance in 2017
During 2017, BBVA Group has maintained a robust and dynamic funding structure with a clearly retail nature, where customer resources represent the main source of funding.
Thus, the performance of the indicators show that the robustness of the funding structure remained steady during 2017, in the sense that all LMUs held self-funding levels with stable customer resources above the requirements.
Table 73. Loan to Stable Customer Deposits (LtSCD)
LtSCD by LMUDecember 2017 December 2016
Group (Weighted average) 110% 113%Eurozone 108% 113%Bancomer 109% 113%Compass 109% 108%Garanti 122% 124%Other LMUs 108% 107%
With respect to LCR, the Group has maintained a liquidity buffer at both consolidated and individual level in 2017. This has maintained the ratio easily above 100%, with the consolidated ratio as of December 2017 standing at 128%.
Although this requirement is only established at Group level and banks in the Eurozone, the minimum level required is easily exceeded in all the subsidiaries. It should be noted that the construction of the Consolidated LCR does not assume the transfer of liquidity between the subsidiaries, so no excess of liquidity is transferred from these entities abroad to the consolidated ratio. If the impact of these highly liquid assets is considered to be excluded, the LCR would be 149%, or 21% above the required level.
Table 74. Table 74.LCR main LMU
LCR main LMUDecember 2017
Group (Weighted average) 128%Eurozone (1) 151%Bancomer 148%Compass (2) 144%Garanti 134%(1) Perimeter: Spain, Portugal and rest of Eurasia(2) Calculated according local regulation (Fed Modified LCR)
In addition, the stress tests conducted on a regular basis reveal that BBVA maintains a sufficient buffer of liquid assets (stress buffer) to deal with the estimated liquidity outflows in a scenario resulting from the combination of a systemic crisis and an unexpected internal crisis, during a period of longer than 3 months in general for the different LMUs, including in the scenario a significant downgrade of the Bank’s rating by up to three notches.
Below is a matrix of residual maturities by contractual periods based on the supervisory prudential information as of December 31, 2017:

3. rIsksBBVA. PILAR III 2017 P. 130
Table 75. Liquidity inflows. Residual maturities by contractual periods (Million Euros. 12-31-17)
Demand Up to 1 Month 1 to 3 Months 3 to 6 Months 6 to 9 Months9 to 12
Months 1 to 2 Years 2 to 3 Years 3 to 5 Years Over 5 Years TotalASSETSCash, cash balances at central banks and other demand deposits
8,179 31,029 - - - - - - - - 39,208
Deposits in credit entities 252 4,391 181 169 120 122 116 112 157 1,868 7,488Deposits in other financial institutions 1 939 758 796 628 447 1,029 681 806 1,975 8,060Reverse repo, securities borrowing and margin lending 18,979 2,689 1,921 541 426 815 30 727 226 - 26,354Loans and Advances 267 21,203 26,323 23,606 15,380 17,516 43,973 35,383 50,809 123,568 358,028Securities' portfolio settlement 1 1,579 4,159 4,423 2,380 13,391 5,789 11,289 12,070 44,666 99,747
Table 76. Liquidity outflows. Residual maturities by contractual periods (Million Euros. 12-31-17)
Demand Up to 1 Month 1 to 3 Months 3 to 6 Months 6 to 9 Months9 to 12
Months 1 to 2 Years 2 to 3 Years 3 to 5 Years Over 5 Years TotalLIABILITIESWholesale funding - 3,648 4,209 4,238 1,227 2,456 5,772 6,432 18,391 30,162 76,535Deposits in financial institutions 6,831 5,863 1,082 2,335 392 1,714 930 765 171 1,429 21,512Deposits in other financial institutions 10,700 4,827 3,290 1,959 554 1,328 963 286 355 1,045 25,307Customer deposits 233,068 45,171 18,616 11,428 8,711 10,368 7,607 2,612 1,833 2,034 341,448Security pledge funding - 35,502 2,284 1,405 396 973 64 23,009 338 1,697 65,668Derivatives (net) - (18) (110) (116) (135) (117) (336) (91) (106) (419) (1,448)
The funding structure is clearly stable, with the loan portfolio mostly funded from customer deposits. The demand section of outflows primarily contains current accounts in the retail customer base, whose behavior is highly stable and for which, according to internal methods, the average maturity is estimated at around three years.
In the Euro LMU, there is a solid liquidity and funding situation, where activity has continued to generate liquidity through a narrowing of the Credit Gap and a reduction of the fixed-income portfolios. In addition, in 2017, the Euro LMU has issued €7,100 million, providing long-term funding under favorable price conditions.
In Mexico, the liquidity position continues to be sound and the dependence on wholesale funding is relatively low and linked to the fixed-income portfolios. In 2017, BBVA Bancomer issued a total of MXN 7 billion on the local market at maturities of 3 and 5 years.
In the United States, the control of the cost of deposits has led to a slight increase in the credit gap. At end of 2017, BBVA Compass has successfully issued senior debt with a maturity of 5 years for USD 750 million.
The liquidity situation in Turkey is comfortable, with a moderate increase in the credit gap as a result of the growth of lending spurred by the government’s Credit Guarantee Fund

3. rIsksBBVA. PILAR III 2017 P. 131
program. In 2017 Garanti Bank issued USD 2 billion in foreign currency and €1.7 billion in local currency. The syndicated loans were also renewed in the second and fourth quarter, with a new 2-year tranche.
The liquidity position in the rest of the subsidiaries has remained in a comfort zone, holding a solid position of liquidity in all jurisdictions where which the Group operates. Access to capital markets by these subsidiaries has continued with recurring issuance on the local market.
In this context of improved access to the market, BBVA has maintained its objectives of, on the one hand, strengthening the funding structure of the Group’s various franchises based on growing its self-funding from stable customer funds, and on the other, guaranteeing a sufficient buffer of fully available
liquid assets, diversifying the different sources of funding and optimizing the generation of collateral to deal with situations of tension in the markets.
3.7.4. Liquidity prospects
BBVA Group is entering 2018 with a comfortable liquidity status across its entire global footprint. The financing structure slanting toward the long term and proven access capacity to capital markets enables to comfortably meet the moderate volume of maturities expected for the upcoming quarters.
The following is a breakdown of maturities of wholesale issues of the most significant units of the Group by the nature of the issues.
Table 77. Maturity of wholesale issues of Balance Euro by nature (Million Euros. 12-31-17)
Type of issuance 2018 2019 2020 After 2020 TotalSenior debt 2,755 1,300 1,034 8,615 13,704 Mortgage-covered bonds 831 380 2,264 12,591 16,066 Public-covered bonds 150 - - 500 650 Regulatory capital instruments (1) 1,834 3,120 1,500 4,408 10,862 Other long term financial instruments - - - - - Total 5,570 4,800 4,798 26,114 41,282 (1) Regulatory capital instruments are classified in this table by terms according to their contractual maturity
Table 78. Maturity of wholesale issues of Bancomer by nature (Million Euros. 12-31-17)
Type of issuance 2018 2019 2020 After 2020 Total Senior debt 211 169 537 1,350 2,267 Mortgage-covered bonds - - - - - Public-covered bonds - - - - - Regulatory capital instruments (1) - - - 3,294 3,294 Other long term financial instruments - - - - - Total 211 169 537 4,644 5,561 (1) Regulatory capital instruments are classified in this table by terms according to their contractual maturity
Table 79. Maturity of wholesale issues of Compass by nature (Million Euros. 12-31-17)
Type of issuance 2018 2019 2020 After 2020 Total Senior debt - 500 - 625 1,126 Mortgage-covered bonds - - - - - Public-covered bonds - - - - - Regulatory capital instruments (1) - - 190 660 850 Other long term financial instruments - - - - - Total - 500 190 1,286 1,976 (1) Regulatory capital instruments are classified in this table by terms according to their contractual maturity

3. rIsksBBVA. PILAR III 2017 P. 132
Table 80. Maturity of wholesale issues of Garanti by nature (Million Euros. 12-31-17)
Type of issuance 2018 2019 2020 After 2020 Total Senior debt 358 1,130 - 1,538 3,025 Mortgage-covered bonds - - - 370 370 Public-covered bonds - - - - - Regulatory capital instruments (1) - - - 625 625 Other long term financial instruments 96 350 63 2,653 3,162 Total 454 1,480 63 5,186 7,182 (1) Regulatory capital instruments are classified in this table by terms according to their contractual maturity
Table 81. Maturity of wholesale issues of South America by nature (Million Euros. 12-31-17)
Type of issuance 2018 2019 2020 After 2020 Total Senior debt 979 1,160 810 2,882 5,831 Mortgage-covered bonds - - - - - Public-covered bonds - - - - - Regulatory capital instruments (1) 64 - - 1,681 1,745 Other long term financial instruments - - - - - Total 1,043 1,160 810 4,563 7,576 (1) Regulatory capital instruments are classified in this table by terms according to their contractual maturity
For 2018, the main goals of BBVA Group’s funding strategy is to maintain the strength of the funding structure and the diversification of the different sources of funding, ensuring the availability of sufficient levels of collateral, both for complying with regulatory ratios and for the rest of the internal metrics for monitoring liquidity risk, including stress scenarios.
3.7.5. LCR disclosure
The table below shows the consolidated LCR disclosure as of December 31, 2017, pursuant to Article 435 of Regulation
(EU) No. 575/2013. These figures are calculated as simple averages of observations made at the end of each month over the twelve months previous to each quarter, starting in September 2016. No transfer of liquidity is assumed between subsidiaries, and therefore no excess liquidity is transferred from the entities abroad to the consolidated figures displayed in the following table:

3. rIsksBBVA. PILAR III 2017 P. 133
Table 82. EU LIQ1: LCR disclosure template (Million Euros. 12-31-17)
Total unweighted value (average) Total weighted value (average)March June September December March June September December
End of the quarter 03-31-17 06-30-17 09-30-17 12-31-17 03-31-17 06-30-17 09-30-17 12-31-17Number of data points used in the calculation of averages 7 10 12 12 7 10 12 12HIGH-QUALITY LIQUID ASSETSTotal high-quality liquid assets (HQLA) 92,805 92,118 91,634 91,004CASH-OUTFLOWSRetail deposits and deposits from small business customers, of which: 199,534 200,544 201,114 201,890 15,057 15,095 15,074 15,037
Stable deposits 126,439 127,478 128,478 129,873 6,322 6,374 6,424 6,494
Less stable deposits 73,095 73,066 72,636 72,017 8,735 8,721 8,650 8,544
Unsecured wholesale funding 121,539 121,696 122,470 123,413 55,294 54,904 54,546 54,373
Operational deposits (all counterparties) and deposits in networks of cooperative banks
45,420 45,537 47,257 48,576 10,162 10,167 10,555 10,810
Non-operational deposits (all counterparties) 73,974 74,157 73,321 72,787 42,987 42,735 42,099 41,513
Unsecured debt 2,145 2,002 1,892 2,050 2,145 2,002 1,892 2,050
Secured wholesale funding 4,712 4,347 3,943 3,598Additional requirements 129,312 126,972 123,417 118,960 24,343 22,850 21,746 19,819
Outflows related to derivative exposures and other collateral requirements (1) 13,929 12,535 11,739 10,253 13,813 12,418 11,627 10,145
Outflows related to loss of funding on debt products 763 760 653 432 763 760 653 432
Credit and liquidity facilities 114,620 113,677 111,025 108,275 9,767 9,672 9,466 9,242
Other contractual funding obligations 10,754 10,580 10,442 10,343 2,049 2,079 2,007 1,936Other contingent funding obligations 1,519 1,542 1,518 1,565 1,519 1,542 1,518 1,565TOTAL CASH OUTFLOWS 102,974 100,817 98,834 96,328CASH - INFLOWSSecured lending (e.g. reverse repos) 12,072 11,653 11,123 11,183 251 256 313 404Inflows from fully performing exposures 28,566 28,349 27,791 27,418 16,898 16,777 16,338 16,257Other cash inflows 9,542 8,232 7,670 6,294 9,542 8,232 7,670 6,294(Difference between total weighted inflows and total weighted outflows arising from transactions in third countries where there are transfer restrictions or which are denominated in non-convertible currencies)(Excess inflows from a related specialised credit institutions)TOTAL CASH INFLOWS 50,180 48,234 46,584 44,895 26,691 25,265 24,321 22,955Fully exempt inflowsInflows subject to 90% capInflows subject to 75% cap 50,181 48,234 46,584 44,896 26,690 25,265 24,321 22,955TOTAL ADJUSTED VALUELIQUIDITY BUFFER 92,805 92,118 91,634 91,004TOTAL NET CASH OUTFLOWS 76,282 75,553 74,513 73,373LIQUIDITY COVERAGE RATIO (%) 122 122 123 124(1) Includes the value of collaterals that the entity should contribute in case of acredit downgrade in accordance to article 439. d) of CRR
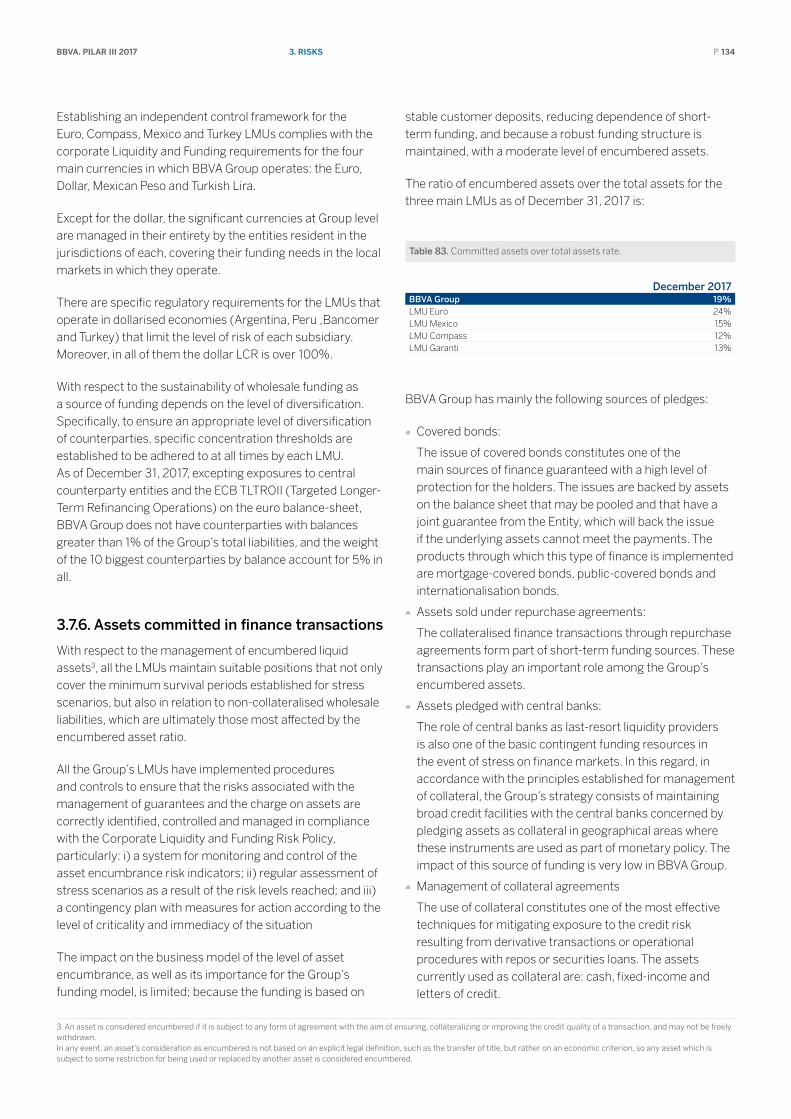
3. rIsksBBVA. PILAR III 2017 P. 134
Establishing an independent control framework for the Euro, Compass, Mexico and Turkey LMUs complies with the corporate Liquidity and Funding requirements for the four main currencies in which BBVA Group operates: the Euro, Dollar, Mexican Peso and Turkish Lira.
Except for the dollar, the significant currencies at Group level are managed in their entirety by the entities resident in the jurisdictions of each, covering their funding needs in the local markets in which they operate.
There are specific regulatory requirements for the LMUs that operate in dollarised economies (Argentina, Peru ,Bancomer and Turkey) that limit the level of risk of each subsidiary. Moreover, in all of them the dollar LCR is over 100%.
With respect to the sustainability of wholesale funding as a source of funding depends on the level of diversification. Specifically, to ensure an appropriate level of diversification of counterparties, specific concentration thresholds are established to be adhered to at all times by each LMU. As of December 31, 2017, excepting exposures to central counterparty entities and the ECB TLTROII (Targeted Longer-Term Refinancing Operations) on the euro balance-sheet, BBVA Group does not have counterparties with balances greater than 1% of the Group’s total liabilities, and the weight of the 10 biggest counterparties by balance account for 5% in all.
3.7.6. Assets committed in finance transactions
With respect to the management of encumbered liquid assets3, all the LMUs maintain suitable positions that not only cover the minimum survival periods established for stress scenarios, but also in relation to non-collateralised wholesale liabilities, which are ultimately those most affected by the encumbered asset ratio.
All the Group’s LMUs have implemented procedures and controls to ensure that the risks associated with the management of guarantees and the charge on assets are correctly identified, controlled and managed in compliance with the Corporate Liquidity and Funding Risk Policy, particularly: i) a system for monitoring and control of the asset encumbrance risk indicators; ii) regular assessment of stress scenarios as a result of the risk levels reached; and iii) a contingency plan with measures for action according to the level of criticality and immediacy of the situation
The impact on the business model of the level of asset encumbrance, as well as its importance for the Group’s funding model, is limited; because the funding is based on
3. An asset is considered encumbered if it is subject to any form of agreement with the aim of ensuring, collateralizing or improving the credit quality of a transaction, and may not be freely withdrawn. In any event, an asset’s consideration as encumbered is not based on an explicit legal definition, such as the transfer of title, but rather on an economic criterion, so any asset which is subject to some restriction for being used or replaced by another asset is considered encumbered.
stable customer deposits, reducing dependence of short-term funding, and because a robust funding structure is maintained, with a moderate level of encumbered assets.
The ratio of encumbered assets over the total assets for the three main LMUs as of December 31, 2017 is:
Table 83. Committed assets over total assets rate.
December 2017BBVA Group 19%LMU Euro 24%LMU Mexico 15%LMU Compass 12%LMU Garanti 13%
BBVA Group has mainly the following sources of pledges:
Covered bonds:
The issue of covered bonds constitutes one of the main sources of finance guaranteed with a high level of protection for the holders. The issues are backed by assets on the balance sheet that may be pooled and that have a joint guarantee from the Entity, which will back the issue if the underlying assets cannot meet the payments. The products through which this type of finance is implemented are mortgage-covered bonds, public-covered bonds and internationalisation bonds.
Assets sold under repurchase agreements:
The collateralised finance transactions through repurchase agreements form part of short-term funding sources. These transactions play an important role among the Group’s encumbered assets.
Assets pledged with central banks:
The role of central banks as last-resort liquidity providers is also one of the basic contingent funding resources in the event of stress on finance markets. In this regard, in accordance with the principles established for management of collateral, the Group’s strategy consists of maintaining broad credit facilities with the central banks concerned by pledging assets as collateral in geographical areas where these instruments are used as part of monetary policy. The impact of this source of funding is very low in BBVA Group.
Management of collateral agreements
The use of collateral constitutes one of the most effective techniques for mitigating exposure to the credit risk resulting from derivative transactions or operational procedures with repos or securities loans. The assets currently used as collateral are: cash, fixed-income and letters of credit.

3. rIsksBBVA. PILAR III 2017 P. 135
The projects subject to overcollateralisation are:
Mortgage-covered bonds.
These are mortgage bonds issued with first-rank mortgage loan collateral constituted in favor of the bank. In the case of BBVA S.A., which accounts for more than 95% of the issuance of mortgage-covered bonds in the Group, the bonds have to be overcollateralised at 125% of their nominal value, and the amount of loans that back them may not be more than 80% of the value of the collateral. The other geographic areas that issue these types of product (to a residual extent) are Garanti Bank and BBVA Chile S.A.
Public-covered bonds.
Public-covered bonds are similar to mortgage-covered bonds. They are backed by loans and credit granted by the issuer to central and regional governments, local authorities and autonomous bodies that answer to them, as well as other public-sector entities in the European Economic Area. In this case, the issues have to be overcollateralised at 143% of their nominal value. BBVA S.A. accounts for 100% of this type of issuance.
Internationalisation bonds.
These are securities guaranteed by loans and credit linked to the finance of contracts for the export of goods and services or the internationalisation of companies. The level of overcollateralisation is the same as for public-covered bonds. BBVA S.A. accounts for 100% of this type of issuance. The weight of these issues is extremely residual.
Within the Group there are units responsible for the execution, monitoring and control of issues of this type, as well as the calculation of the capacity for additional issuance, with the aim of ensuring that the Entity is not over-issued and complies with the established limits of the Encumbered Asset Ratio.
The following table shows assets contributed as collateral (loans) underlying the issue of mortgage-covered bonds, public-covered bonds and internationalisation bonds, as well as the total issued and excess capacity of issue as of December 31, 2017:
Table 84. Mortgage-covered bonds. (Million Euros. 12-31-17)
Withheld 4,088Withheld applied 4,000Withheld not applied 88Issued to Market 16,065TOTAL MORTGAGE-COVERED BONDS ISSUED 20,153ELIGIBLE COLLATERAL TO CONSIDER 46,306Maximum to issue 37,045CAPACITY TO ISSUE 16,891
Table 85. Public-covered bonds (Million Euros. 12-31-17)
Withheld 9,040Withheld applied 8,140Withheld not applied 900Issued to Market 650TOTAL PUBLIC-COVERED BONDS ISSUED 9,690ELIGIBLE COLLATERAL TO CONSIDER 16,395Maximum to issue 11,477CAPACITY TO ISSUE 1,787
Table 86. Internationalization-covered bonds. (Million Euros. 12-31-17)
Withheld 1,500Withheld applied 750Withheld not applied 750Issued to Market -TOTAL INTERNATIONALIZATION-COVERED BONDS ISSUED 1,500ELIGIBLE COLLATERAL TO CONSIDER 3,002Maximum to issue 2,101CAPACITY TO ISSUE 601
As of December 31, 2017, the assets committed (provided as collateral or security with respect to certain liabilities) and those unencumbered are as follows:
The collateral received that, as of December 31, 2017, are committed (provided as collateral or security with respect to certain liabilities) and those unencumbered are shown below. It should be noted that the value used for the purpose of this disclosure is the carrying amount and fair value, for both the assets on the balance sheet and the encumbered and unencumbered guarantees received. The balances are calculated as annual medians using as a sample the four quarters of the last year.

3. rIsksBBVA. PILAR III 2017 P. 136
Table 87. Encumbered and unencumbered Assets (Million Euros. 12-31-17)
Carrying value of encumbered assets
Fair value of encumbered assets
Carrying value of unencumbered assets
Fair value of unencumbered assets
Institution's assets 116,433 563,742Equity instruments 1,916 6,637Debt securities 30,600 31,220 70,453 69,833
Of which: covered bonds 3 3 875 863
Of which: ABSs 19 19 1,035 937
Of which: issued by general governments
25,023 25,617 54,522 53,928
Of which: issued by financial corporations
4,134 4,172 9,988 9,950
Of which: issued by non- financial corporations
1,444 1,432 2,655 2,668
Other assets 83,964 489,509
Table 88. Collateral received (Million Euros. 12-31-17)
Fair value of encumbered collateral received or own debt securities issued
Fair value of collateral received or own debt securities issued available for encumbrance
Collateral received 20,060 7,960Loans on demand - -Equity instruments 155 39Debt securities 19,777 7,832Of which: covered bonds 168 163Of which: ABSs - -Of which: issued by general governments 18,566 5,555Of which: issued by financial corporations 982 2,245Of which: issued by non- financial corporations 229 65Loans and advances other than loans on demand
131 11
Other collateral received - -Own debt securities issued other than own mortgage-covered bonds or ABSs
5 83
Own mortgage-covered bonds and ABSs issued and not yet pledged
12,942
TOTAL ASSETS, COLLATERAL RECEIVED AND OWN DEBT SECURITIES ISSUED 137,723
The sources of pledges as of December 31, 2017 are as follows:
Table 89. Sources of encumbrance (Million Euros. 12-31-17)
Matching liabilities, contingent liabilities or securities lent
Assets, collateral received and own securities issued other than mortgage-covered bonds,
public-covered bonds and ABSs encumberedCarrying amount of selected financial liabilities 121,422 136,391Derivatives 12,173 10,567Repos and other collateralized deposits 86,928 98,839Debt securities 22,365 27,238Other sources of encumbrance 540 1,414
The assets without an associated liability reflected in Table C correspond mainly to pledges issued by VISA guarantee and pledges for operating in certain markets. The collateral
received off the balance sheet is mostly reverse repurchase agreements, of which more than 90% are sovereign securities.

3. rIsksBBVA. PILAR III 2017 P. 137
3.8. operational risk
4. For BBVA, Risk Compliance is defined as the regulatory and/or reputational risk linked to Compliance Issues. The scope of such issues can vary in time depending on environment (especially regulatory) and business developments. Notwithstanding this, based on the foregoing other matters can be introduced. Whatever the case, the following will be understood as included within the aforementioned issues: • Conduct on the Markets. • Treatment of Conflicts of Interest. • Anti-Money Laundering and Combating Terrorist Financing (AML-CTF). • Personal Data Protection.
3.8.1. Operational Risk definition
BBVA accepts the definition of Operational Risk proposed by the Bank for International Settlements (BIS) in Basel: “Operational Risk is risk that may lead to losses caused by human errors, inadequate or faulty internal processes, system failures or external events, including external fraud, natural disasters, and defective service provided by third parties.” This definition excludes the strategic and/or business risk and the reputational risk (which is managed separately within BBVA Group).
The definition of Operational Risk in BBVA Group includes the following risk types:
Legal risk: Possibility of being sanctioned, fined or obliged to pay punitive damages as a result of supervisory actions or private agreements between the parties.
Regulatory compliance linked to compliance issues4 .
Risk of external fraud: Risk as a result of the commission of crimes by third persons, whether customers or not.
Risk of internal fraud: Risk from illegal actions, commission of crimes, disloyalty, abuse of trust, etc., acts of willful misconduct or for gain by members of the entity’s internal staff, as well as the performance of other unauthorised activities.
Technological risk: Risk arising from faults in the design or implementation of information systems, problems or delays generated in the execution of specific automatic processes, faulty operation of the Host systems or communications (line outages), information losses in backup devices or applications and developments for not responding to user specifications, shortcomings in the security in data processing buildings and in the security of technological infrastructure, etc.
Supplier risk: Risk originated by shortcomings in the service provided by vendors and subcontracted companies (independent businesses or those whose management is not controlled by the Group).
Fiduciary risk: As regards the administration of third-party assets - including when it acts as trustee - BBVA Group is exposed to a fiduciary risk arising from its condition of
investment manager for customers and when it provides consultancy services in investment matters. In both cases, with respect to the management of investments on behalf of third parties, it is the customer who takes on the market and credit risks, while the manager or administrator assumes the fiduciary duty of managing in the best interest of the customer. Non-compliance of the fiduciary duty could lead to losses for the Group. Moreover, the distribution of the investment products can lead to a fiduciary risk for the bank.
Operational risk is inherent to all banking activities, products, systems and processes. Its origins could be highly diverse (processes, internal and external fraud, technology, human resources, commercial practices, disasters and suppliers). Operational risk management is integrated into BBVA Group’s global risk management structure.
3.8.2. Operational Risk methodology
The Group has in place an integrated internal control and operational risk methodology.
This methodology identifies risks in organisational areas, generates analyses that prioritise risks according to the estimated residual risk (after incorporating control effects), links risks to processes and establishes an objective risk level for each risk type to identify and manage gaps by comparing it with the residual risk level.
Through its GRM unit Non-Financial Risks establishes the criteria applicable for determining BBVA Group companies in which to implement the operational risk monitoring and management/mitigation tools described in section 3.8.5.2. These criteria are based on both quantitative and qualitative aspects.
The scope of application of the Operational Risk management model revolves around the following elements:
Company.
Process: in general, OR originates in the different activities/processes carried out in the Group.
Business line: because the type of the different operational risks to which the Group is exposed, and their impact, is

3. rIsksBBVA. PILAR III 2017 P. 138
substantially different for each line of business, considering this element is fundamental for effective management of OR.
3.8.3. Model based on 3 lines of defense
Based on best operational risk management practices, BBVA Group has established and maintains an internal control model organised around three lines of defense (3LoD), as well as a governance scheme called Corporate Assurance. The Group’s internal control model has two components.
1. The first one is the model based on three lines of defense, which guarantees compliance with the most advanced internal control standards and is organised as follows:
• The Group’s business units constitute the first line of defense. They are responsible for managing current and emerging risks and implementing control procedures. It is also responsible for reporting to its business/support unit.
• The second line of defense is made up of the units specializing in control, the main ones being: Compliance, Accounting & Supervisors (Internal Financial Control), Global Risk Management (Internal Risk Control) and Engineering (specifically, Internal Operations Control and IT Control). This line collaborates in identifying current and emerging risks, defines the control policies within the scope of its cross-sector specialty, ensures that they are implemented correctly, and provides training and advice to the first line. In addition, one of its main functions is to monitor and question the control activity carried out by the first line of defense.
The control activity of the first and second line of defense is coordinated by the Internal Risk Control Unit, which will also be responsible for providing these units with a common internal control methodology.
• The third line of defense is made up of the Internal Audit unit, for which the Group assumes the guidelines of the Basel Committee on Banking Supervision and of the Institute of Internal Auditors. Its function is that of an independent and objective assurance and consulting activity designed to add value and improve the Organisation’s operations. The duties and lines of work of this unit are described below.
2. The second component is the Corporate Assurance scheme, which has the role of providing a comprehensive and standardised approach to the Board of Directors and the management bodies on the Group’s internal control situation. This provides timely information on the main control weaknesses that may arise in the different assurance processes and makes it possible to prioritise
their solution and monitor the implementation of measures for mitigating them more effectively.
To perform its duties, the model is provided with an orderly mechanism for reporting to management. This mechanism involves a number of committees that meet every four months, in which members of the senior management of the Group and its subsidiaries take part. The committees seek to understand control issues and make decisions that will have a significant impact on the objectives of the various units, both at the local level and for the consolidated Group.
Chart 25: Operational risk management framework: Three lines of defense
Business Areas Coordinated by the Area Control Manager Function and by owners of processes and controls
GRM Non-Financial Risks, Country CI and Specialists Units
The function of GRM Non-Financial Risks and Country CI is to design, maintain and update the group operational risk framework and verify its due application in the business and support areas
Define procedures, systems and applications
Elaboration of reports to Senior Managers
Internal Audit In general, verifies compliance with the general operational risk framework, applies independent review besides group control, processes and systemtesting
3.8.4. Principles of BBVA’s Operational Risk management model
Operational Risk management in BBVA Group must include at least the following:
Be aligned with the Risk Appetite Framework.
Anticipate the potential operational risks to which the Group would be exposed as a result of new or modified products, activities, processes or systems or outsourcing decisions and establish procedures to enable their evaluation and reasonable mitigation prior to their implementation.
Establish methodologies and procedures to enable a regular reassessment of the relevant operational risks to which the Group is exposed in order to adopt appropriate mitigation measures in each case, once the identified risk and the cost of mitigation (cost/benefit analysis) have been considered, while preserving the Group’s solvency at all times.

3. rIsksBBVA. PILAR III 2017 P. 139
Identify the causes of the operational losses sustained by the Group and establish measures to reduce them. Procedures must therefore be in place to enable the capture and analysis of the operational events that cause those losses.
Analyse the events that have caused operational risk losses in other institutions in the financial sector and promote, where appropriate, the implementation of the measures needed to prevent them from occurring in the Group.
Identify, analyse and quantify events with a low probability of occurrence and high impact which, due to their exceptional nature, may possibly not be included in the losses database or, if they are, have unrepresentative impacts, in order to ensure their mitigation.
Have effective governance in place in which the functions and responsibilities of the Areas and Bodies involved in OR management are clearly defined.
Table 90. Characteristics of the Operational Risk management model
Soundness
Depth
Integrated management
Forward looking
Continuous improvement
These principles reflect BBVA Group’s vision of OR, which is based on the premise that the events that occur as a result of OR have an ultimate cause that should always be identified. The control of the causes significantly reduces the impact of
the events. The OR management tools provide information on the origin of OR and assist in its mitigation.
Irrespective of the adoption of all possible measures and controls to prevent or reduce both the frequency and severity of OR events, BBVA ensures that it has sufficient capital at all times to cover the expected or unexpected losses that may arise.
GRM Non-Financial Risks proposes the general policies that guide management and enable control of the Group’s operational risk.
These principles aim to reasonably ensure (cost-benefit analysis) that the relevant operational risks to which the Group is exposed in carrying out its activities are identified, assessed and managed consistently with the Risk Appetite Framework, thus preserving the Group’s solvency.
The OR is managed in BBVA Group from two different and complementary viewpoints:
The “ex-ante” point of view entails identifying, assessing and prioritizing potential operational risks to enable their mitigation.
From this standpoint, OR is managed in a proactive and preventive way by the Areas and Units exposed. This management is integrated into the day-to-day decision-making process and is focused on the analysis of the causes of OR to enable its mitigation.
The “ex-post” point of view entails assessing the exposure to OR and measuring its consequences, i.e. the historical cost of the events that have occurred. From this perspective, OR management uses tools associated with the consequences of OR not only to complement OR management, but also to feed the calculation of capital use for those Group areas that operate under advanced OR measurement approaches.

3. rIsksBBVA. PILAR III 2017 P. 140
3.8.4.1. Operational Risk admission process
Although strictly speaking there is no true OR admission process, such as the one carried out, for example, in Credit Risk, BBVA Group considers that the assimilation presented in this section is useful for controlling this risk and contributes to its mitigation. The aim of this process is to: anticipate the potential operational risks to which the Group may be exposed as a result of the emergence or modification of new products, activities, processes or systems and outsourcing decisions and ensure that they are implemented only after adopting suitable mitigation measures in each case.
The Group has a specific governance model for OR admission embodied in different Committees that are admission vehicles in the different areas in which the emergence of OR is concentrated: new businesses, new products, systems, outsourcing decisions, etc.
3.8.4.2. Operational Risk monitoring and management/mitigation tools
3.8.4.2.1. Risk and Control Self-Assessment
An appropriate management of OR requires the establishment of methodologies and procedures to identify, assess and follow this risk type, in order to implement suitable mitigation measures in each case.
This will be done by comparing the level of risk assumed and the cost of mitigation.
BBVA Group’s OR management methodology has the following phases:
Establishment of the model’s perimeter, identifying the companies and activities that may give rise to significant OR. These companies and activities are associated with their processes using the taxonomy established by the Group. The processes are the starting point for identifying the OR factors.
Identification of potential and real OR factors based on the review of the processes, applying self-assessment techniques that are completed and checked against other relevant information.
Prioritisation of the OR factors through the calculation of the inherent risk: estimation of the exposure to risk in an adverse and conservative environment without considering the existence of possible controls. Prioritisation is used to separate the critical factors from the non-critical ones by applying cut-off points.
For critical risks, the controls that contribute to their reduction are identified, documented and tested, and based on their effectiveness the residual risk (which incorporates the reducing effect of the controls, where applicable) is calculated.
A specific target is set for each critical risk that constitutes the level of risk considered acceptable. In those risks in which the residual risk is higher than the target risk there is a gap between both that requires that the risk be mitigated through a mitigation plan.
The aim is to have an evolving and dynamic OR management model that reflects the essential aspects of this risk’s situation at any given time.
OR management is coordinated with other risks, considering the credit or market consequences that may have an operational origin.
3.8.4.2.2. Operational Risk indicators
Dynamic management of OR requires not only a regular self-assessment of OR, but also the definition of a set of indicators to enable the changes in both the risk factors and the effectiveness of the controls to be measured over time, in order to have available information on unexpected changes and enable preventive management of Operational Risk.
The Group has a set of indicators in the different business and support areas that allow it to carry out an anticipatory management of risk.
3.8.4.2.3. Operational losses database
In line with the best practices and recommendations of the BIS, BBVA has procedures in place for collecting operational losses that occur both in the different Group entities and in other financial groups (ORX losses database, ORX News service, etc).
Internal operational losses database - SIRO
This tool collects the accounting losses associated with OR events, through automatic interfaces with accounting and applications for expenses and manual capture procedures. The losses are captured with no amount limit and constitute an input for calculating the capital use for OR in advanced measurement approaches and a reference for the Risk and Control Self Assessment, and are analysed on a regular basis in terms of trends and monitoring of expected losses.
External operational losses database - ORX
The Bank, together with other leading entities worldwide, subscribed with the ORX consortium, as a founding partner, the creation of an external database for anonymously exchanging information related to operational events.
This consortium provides both quantitative and qualitative information on the operational events experienced by the member entities. The information obtained through this means is used both to identify potential ORs and analyse
3. rIsksBBVA. PILAR III 2017 P. 141
whether appropriate mitigation measures are available, and for the purpose of calculating capital using advanced measurement approaches.
3.8.4.2.4. Operational Risk scenarios
These reflect the exposure to a limited number of situations that may give rise to very significant losses with a reduced estimated frequency of occurrence. The scenarios feed the capital calculation in those Group areas that operate under advanced measurement approaches, and also constitute a reference for OR management.
3.8.4.3. Mitigation plans
Mitigation means reducing the level of exposure to OR. Even though there is always the option of eliminating OR by exiting a given activity, the Group’s policy is to attempt to mitigate the risk first by improving the control environment or applying other measures, conducting a rigorous cost-benefit analysis. The different forms of mitigation always have associated costs. It is therefore essential to assess the cost of the OR properly before making a decision.
As long as the residual risk exceeds the defined target risk level, mitigation measures will need to be established to keep it within the level. The area responsible for OR will drive its implementation through the Operational Risk Management Committee.
3.8.5. Methods used
As set out in Regulation (EU) 575/2013 of the European Parliament and of the Council, for calculating the regulatory capital for operational risk under Basel I, Advanced Measurement Approaches (AMA) are used for a very significant part of the banking perimeter. Specifically, this method is used in Spain and Mexico, which accumulate most of the Group’s assets.
In March 2010, BBVA Group received authorisation from the supervisor to apply advanced approaches for calculating regulatory capital by operational risk in Spain and Mexico.
Except for the cases of Garanti and Bolivia, for which the basic approach is applied, the standardised approach is used to calculate capital in the rest of the geographic areas.
3.8.5.1. Description of the Advanced Measurement Approaches
The advanced internal model quantifies capital at a confidence level of 99.9% following the LDA (Loss Distribution
Approach) methodology. This methodology estimates the distribution of losses by operational event by convoluting the frequency distribution and the loss given default distribution of these events.
The calculations are made using internal data on the Group’s historic losses as its main source of information. To enrich the data from this internal database and to take into account the impact of possible events not yet considered therein, external databases (ORX consortium) are used and the scenarios indicated in point 3.8.5.2.4 are included.
The distribution of losses is constructed for each of the different types of operational risk, which are defined as per Basel Accord cells; i.e. a cross between business line and risk type. In those cases in which there is not sufficient data for a sound analysis, it becomes necessary to undertake cell aggregations, and to do so the business line is chosen as the axis.
In certain cases, a greater disaggregation of the Basel cell has been selected. The objective consists of identifying statistically homogenous groups and a sufficient amount of data for proper modeling. The definition of these groupings is regularly reviewed and updated.
Solvency regulations establish that regulatory capital for operational risk is determined as the sum of individual estimates by type of risk, but allowing the option of incorporating the effect of the correlation among them. This impact has been taken into consideration in BBVA estimates with a conservative approach.
The model of calculating capital in both Spain and Mexico incorporates factors that reflect the business environment and situation of internal control systems. Thus the calculation obtained is higher or lower according to how these factors change in anticipating the result.
The Group has insurance policies that basically cover the risk of cyberattacks, natural and/or provoked disasters and external and internal fraud. For the purpose of calculating capital by the AMA the mitigating effect of the insurance contracted is not included.
The following table below shows the operational risk capital requirements broken down according to the calculation models used and by geographic area, to provide a global vision of capital consumption for this type of risk:

3. rIsksBBVA. PILAR III 2017 P. 142
Table 91. Regulatory capital for Operational Risk (Million Euros)
Regulatory capital for operational riskCapital requirements RWAs
2017 2016 2017 2016Advanced 1,476 1,368 18,449 17,098
Spain 1,181 1,040 14,767 12,998
Mexico 295 328 3,682 4,100
Standardised 808 862 10,102 10,775Basic 496 516 6,204 6,450BBVA Group total 2,780 2,746 34,755 34,323
The main variations in the capital requirements for operational risk are due to:
Advanced approaches: Increase of 181 million in Spain, basically due to the greater impact of the losses registered following the judgment in 2016 of the Court of Justice of the European Union referring to the application of floor clauses in mortgage loans. Reduction of 34 million in Mexico resulting from exchange-rate variations.
Non-advanced approaches: Declines in the standard and basic approaches produced by the exchange-rate variations.
3.8.6. The Group’s Operational Risk profile
BBVA’s operational risk profile is shown below by class of risk after assessing the risks, resulting in the following distribution:
Chart 26: BBVA Group’s Operational Risk profile
14.8%
19.1%
8.9%
0.9%1.0%
54.7%
0.6%
Processes
External Fraud
Inte rna l Fraud
Technology
Human resources
Commercial practices
Disasters
The following charts illustrate the distribution of historical operational losses by risk class and country.

3. rIsksBBVA. PILAR III 2017 P. 143
Chart 27: Operational Risk profile by risk and country
12.1%
11.5%
9.7%
0.7%0.5%
65.3%
0.2% SPAIN
23.0%
51.5%
20.3%
3.0%
0.2%
1.7%
0.2%
MEXICO
13.6%
41,1%
0.8%0.0%
6.1%
35.0%
3.4% COMPASS
15.7%
1.8%1.6%
0.2%-1.0%
81.7%
0.1% GARANTI
38,4%
28.9%
3.6%0.6%
2.2%
24.6%
1.6%OTHERS
Processes
External Fraud
Internal Fraud
Technology
Human resources
Commercial practices
Disasters

4. leveraGe ratIoBBVA. PILAR III 2017 P. 144
4. Leverage Ratio
4.1. Leverage Ratio definition and composition 145
4.2. Trends in the ratio 146
4.3. Governance 146

4. leveraGe ratIoBBVA. PILAR III 2017 P. 145
4.1. Leverage Ratio definition and composition
5: http://www.eba.europa.eu/regulation-and-policy/leverage-ratio/draft-implementing-technical-standards-its-on-disclosure-for-leverage-ratio/-/regulatory-activity/press-release
The leverage ratio (LR) is a regulatory measure (not risk-based) complementing capital designed to guarantee the soundness and financial strength of institutions in terms of indebtedness.
In January 2014, the Basel Committee on Banking Supervision published the final version of the “Basel III leverage ratio framework and disclosure requirements”, which has been included through a delegated act that amends the definition of leverage ratio in the CRR regulation.
Pursuant to article 451, section 2 of the CRR, on June 15, 2015 the EBA published the final draft of the Implementing Technical Standard (ITS, leverage ratio disclosures) for breaking down the leverage ratio, which has been applied in this report.
The leverage ratio is defined as the quotient of eligible Tier 1 capital and exposure.
Described below are the elements making up the leverage ratio, in accordance with the “EBA FINAL draft Implementing Technical Standards on disclosure of the leverage ratio under Article 451(2) of Regulation (EU) No. 575/2013 (Capital Requirements Regulation – CRR) - Second submission following the EC’s Delegated Act specifying the LR5” published by the EBA on June 15, 2015:
Tier 1 capital (letter h in the following table): section 2.2. of this Document presents details of the eligible capital, which has been calculated based on the criteria defined in the CRR.
Exposure: as set out in article 429 of the CRR, the exposure measurement generally follows the carrying amount subject to the following considerations:
• On-balance-sheet exposures other than derivatives are included net of allowances and accounting valuation adjustments.
Measurement of the Group’s total exposure is composed of the total assets as per financial statements adjusted for reconciliation between the accounting perimeter and the prudential perimeter.
Total exposure for the purpose of calculating the Group’s leverage ratio is composed of the sum of the following items:
On-balance asset positions: book balance of assets corresponding to the financial statements, excluding the derivative headings.
Adjustments for reconciliation between the accounting perimeter and the solvency perimeter: the balance resulting from the difference between the accounting balance sheet and the regulatory balance sheet is included.
Exposure in derivatives: the exposure referring to the EAD used in the measurement of capital use for counterparty risk, which includes both the replacement cost (market-to-market) and the future potential credit exposure (add-on). The cost of replacement is reported adjusted by the margin of variation in cash and by effective notional amounts.
Securities financing transactions (SFTs): in addition to the exposure value, an addition for counterparty risk determined as set out in article 429 of the CRR in included.
Off-balance-sheet items: these correspond to risks and contingent liabilities and commitments associated with collateral, which are mainly available. A minimum floor of 10% is applied to the conversion factors (CCF), in line with article 429.10 a) of the CRR.
The exposures of the Group’s financial institutions and insurance companies that are consolidated at accounting but not at regulatory level.
Tier 1 deductions: all those amounts of assets that have been deducted in the determination of the eligible Tier 1 capital are deducted, in order not to duplicate exposures. The main deductions are intangible assets, loss carry forwards and other deductions defined in article 36 of the CRR and indicated in section 2.1 of this report.
The table below shows a breakdown of the items making up the leverage ratio as of December 31, 2017 and December 31, 2016:

4. leveraGe ratIoBBVA. PILAR III 2017 P. 146
Table 92. LRSum - Summary reconciliation of accounting assets and leverage ratio exposures (Million Euros. December 2017)
Summary table of accounting assets and leverage ratio exposure conciliation 12-31-17 12-31-17 12-31-16 12-31-16(a) Total assets as published financial statements 690,059 690,059 731,856 731,856(b) Adjustment for entities which are consolidated for accounting purposes but are outside the scope
of regulatory consolidation(17,079) (17,079) (17,272) (17,272)
(Adjustment for fiduciary assets recognised on the balance sheet pursuant to the operative accounting framework but excluded from the leverage ratio exposure measure in accordance with Article 429 (7) of Regulation (EU) No 575/2013)
- - - -
(c) Adjustments for derivative financial instruments (14,772) (14,772) (18,788) (18,788)(d) Adjustments for securities financing transactions "SFTs" (1,248) (1,248) (4,525) (4,525)(e) Adjustment for off-balance sheet items (1) 62,441 62,441 66,397 66,397(f) (Adjustment for intragroup exposures excluded from the leverage ratio exposure measure in
accordance with Article 429 (7) of Regulation (EU) No 575/2013)- - - -
(g) Other adjustments (9,920) (9,643) (10,451) (10,961)Leverage ratio total exposure measure 709,480 709,758 747,216 746,706h) Capital Tier 1 46,980 46,316 50,083 48,459Leverage ratio total exposure measure 709,480 709,758 747,216 746,706Leverage ratio 6.62% 6.53% 6.70% 6.49%(1) This corresponds to off-balance sheet exposure after application of the conversion factors obtained in accordance with Article 429, paragraph 10 of the CRR.
As can be seen, the Group maintains a phased leverage ratio of 6.62% and a fully-loaded ratio of 6.53%, well above the minimum level required.
4.2. trends in the ratio
Stability can be seen as of December 2016 in the leverage ratio, in keeping with the behavior of the Tier 1 capital adequacy ratio and variation of the balance-sheet masses, which have been affected by the generalised depreciation of currencies.
As of December 2017, the phased-in ratio was 6.62% (6.53% in fully-loaded terms), easily above the minimum required of 3%. The leverage level reflects the nature of the business model that is geared toward the retail sector.
Chart 28: Leverage ratio evolution
50,083 50,028 48,484 47,983 46,980
747,216 734,700 714,546 706,968 709,480
6.7% 6.8% 6.8% 6.8% 6.6%
Dec16 Mar17 Jun17 Sep17 Dec17
Tier 1 Adjust exposure Phased-inCRR LR
4.3. Governance
The activities making up the Group’s regulatory reporting include monthly measurement and control of the leverage ratio by assessing and monitoring this measurement in its more restrictive version (fully-loaded), to guarantee that leverage remains far from the minimum levels (which could be considered risk levels), without undermining the return on investment.
The estimates and the development of the leverage ratio are reported on a regular basis to different governing bodies and committees to guarantee an adequate control of the entity’s
leverage levels and ongoing monitoring of the main capital indicators.
In line with the risk appetite framework and structural risk management, the Group operates by establishing limits and operational measures to achieve a sustainable development and growth of the balance sheet, maintaining at all times tolerable risk levels. This can be seen in the fact that the regulatory leverage level itself is well above the minimum required levels.

5. InformatIon on remuneratIon BBVA. PILAR III 2017 P. 147
5. Information on remuneration
5.1. Information on the decision-making process to establish the remuneration policy for Identified Staff 148
5.2. Description of the different types of employees included in the Identified Staff 151
5.3. Key features of the remuneration system 151
5.4. Information on the link between the remuneration of Identified Staff and the performance of the Group 155
5.5. Description of the criteria used to take into consideration present and future risks in the remuneration processes 157
5.6. Main parameters and reasons for any component of the possible variable remuneration plans and other non-cash benefits 158
5.7. Ratios between the fixed and variable remuneration of Identified Staff 158
5.8. Quantitative information on the remuneration of Identified Staff 159

5. InformatIon on remuneratIon BBVA. PILAR III 2017 P. 148
In accordance with the provisions of article 85 of Act 10/2014, dated June 26, on the regulation, supervision and solvency of credit institutions (hereinafter the “Act 10/2014”) and article 93 of Royal Decree 84/2015, dated February 13, which implements said Act, and pursuant to the provisions of Bank of Spain Circular 2/2016, dated February 2, to credit institutions, on supervision and solvency, completing the adaptation of the Spanish legal system to Directive 2013/36/
EU and Regulation (EU) No. 575/2013 (hereinafter “Bank of Spain Circular 2/2016”), credit institutions shall update, at least once a year, and provide the public with information including its remuneration policy and practices established in part eight of Regulation 575/2013/EU in relation to the categories of personnel whose professional activities have a significant impact on the Group’s risk profile (hereinafter, the “Identified Staff” or “Risk Takers”).
5.1. Information on the decision-making process to establish the remuneration policy for Identified Staff
In the framework set out in BBVA’s Bylaws, the Regulations of the Board of Directors of BBVA empower the Board of Directors (hereinafter, “the Board”) to approve, among others, the remuneration policy for directors, for its submission to the General Meeting, as well as the remuneration policy for senior managers and employees whose professional activities have material impact on the Group’s risk profile, and to determine the remuneration of directors acting in their capacity as such; additionally, in the case of executive directors, the remuneration for their executive functions, together with the remaining conditions to be respected in their contracts.
The Board Regulations likewise include the internal rules for the operation of the Board and its Committees, which provide assistance on matters within their remit. The Remuneration Committee assists the Board with matters related to remuneration, as set out in the Board Regulations, ensuring compliance with the remuneration policy established.
In accordance with Article 36 of the Board Regulations, the duties of the Remuneration Committee are as follows:
1. Propose directors’ remuneration policy to the Board, for its submission to the General Meeting, as regards its items, amounts, and parameters for its determination and its vesting, likewise submitting the corresponding report, in the terms established by applicable law at any time.
2. Determine, so that they can be reflected in their contracts, the extent and amount of individual remuneration, entitlements and other economic rewards, as well as other contractual conditions of executive directors, submitting the appropriate proposals to the Board.
3. Yearly submit a proposal to the Board regarding the annual report on the remuneration of the Bank’s directors, which will in turn be submitted to the Annual General Shareholders’ Meeting, in accordance with the applicable legislation.
4. Propose the remuneration policy for senior managers and other Identified Staff members, for its submission to the Board.
5. Propose the basic conditions of senior managers’ contracts to the Board, and directly supervise the remuneration of senior managers in charge of risk management and compliance functions within the Company.
6. Oversee observance of the remuneration policy established by the Company and periodically review the remuneration policy applied to members of the Identified Staff, including executive directors and senior managers.
7. Verify the information on directors and senior managers’ remuneration contained in the different corporate documents, including the annual report on the remuneration of directors.
8. Any other duties that may have been allocated under the Regulations or attributed by a Board resolution or by applicable legislation.
As at year-end 2017, the Remuneration Committee is composed of five members, all of them non-executive directors; the majority are independent, including its Chair. The names, positions and status of the directors that make up the Remuneration Committee are detailed below:
Table 93. Composition of the Remuneration Committee (12-31-17)
Name and surname(s) Position StatusBelén Garijo López Chair IndependentTomás Alfaro Drake Member IndependentJosé Antonio Fernández Rivero Member ExternalLourdes Máiz Carro Member IndependentCarlos Loring Martínez de Irujo Member External

5. InformatIon on remuneratIon BBVA. PILAR III 2017 P. 149
The Committee performs its duties with full operational autonomy. It meets as often as necessary to comply with its duties, led by its Chair, having met on 5 occasions in 2017.
In order to adequately perform its duties, the Committee uses advisory services provided by the Bank’s in-house staff and can further count on outsourced advice as necessary to establish criteria regarding matters within its competence. For these purposes, during 2017 the Committee has received the information and advice provided by leading global consulting firms in the field of compensation for directors and senior managers, such as McLagan and Garrigues Human Capital Services with regards to the modification of the remuneration policy for BBVA directors, and the firm Willis Towers Watson for the analysis of fixed and variable remuneration of executive directors and members of the Senior Management.
In addition, the Board’s Risk Committee participates in the establishment of the remuneration policy, ensuring it is compatible with adequate and effective risk management and that it offers no incentives to assume risks beyond the level tolerated by the Group. As at year-end 2017, the Risk Committee includes one of the members of the Remuneration Committee.
In 2017, the Remuneration Committee was particularly busy in terms of analysis of the new regulations on remuneration published in 2016, which have had an impact on the remuneration policies and practices of credit institutions; in particular, Bank of Spain Circular 2/2016 and the provisions of the European Banking Authority (EBA) Guidelines dated June 27, 2016, on sound remuneration policies under articles 74(3) and 75(2) of Directive 2013/36/EU and disclosures under article 450 of Regulation (EU) No. 575/2013, adopted by the Bank of Spain on July 27, 2016 (hereinafter the “EBA Guidelines”).
As a result of new regulations on remuneration, developments in market practices, the outcome of dialog between BBVA and its investors and the nature of the Bank’s corporate governance system itself, the Remuneration Committee conducted a review of the remuneration policy in place and the overall remuneration system, with the collaboration of the independent consultants of international prestige in remuneration mentioned above. As a result, it submitted the following proposals to the Board for approval:
A new remuneration policy for BBVA directors (the “Remuneration Policy for BBVA Directors”), for the
years 2017, 2018 and 2019. This policy was submitted to the Bank’s General Meeting held on March 17, 2017, in accordance with article 529 novodecies of Royal Legislative Decree 1/2010, dated July 2, approving the consolidated text of the Corporate Enterprises Act (hereinafter, the “Corporate Enterprises Act”), and approved by 96.54% of votes in favor, 1.75% of the votes against and an abstention of 1.72%, representing 63.71% of the share capital present or represented at said General Meeting.
In accordance with the provisions of the Company Bylaws, the Remuneration Policy for BBVA Directors distinguishes between the remuneration system for non-executive directors and the system applicable to executive directors. The remuneration system for executive directors corresponds in general to that applicable to the remaining Identified Staff members , including certain specificities derived from their condition as directors. The remuneration system for non-executive directors is based on criteria of responsibility, dedication and incompatibilities inherent to the role that they perform, and consists exclusively of fixed remuneration elements, receiving no variable remuneration.
The full text of the Remuneration Policy for BBVA Directors is available on the Bank’s corporate website (www.bbva.com).
A new remuneration policy that applies generally to BBVA employees and employees of subsidiaries part of its consolidated group (the “BBVA Group” or the “Group”), which includes the specificities of the remuneration system applicable to Identified Staff members of the BBVA Group, as well as the procedure for their identification, in accordance with the provisions of applicable regulations, as specified below (the “BBVA Group Remuneration Policy”).
This Policy was approved by the Board, and is coordinated at corporate level by BBVA’s Talent and Culture area. The Bank’s control functions cooperate actively and regularly in its design and supervision, in accordance with the attributions assigned to them by applicable law.
The remuneration system applicable to Identified Staff members, included in this Policy, aims to further align BBVA’s remuneration practices with applicable regulations, good governance recommendations and best market practices. The specific remuneration system for Identified Staff is, in general, applicable to BBVA’s executive directors,

5. InformatIon on remuneratIon BBVA. PILAR III 2017 P. 150
as members of this group, notwithstanding that they are subject to the provisions of the Remuneration Policy for BBVA Directors approved by the General Meeting, and not the Group’s Remuneration Policy.
For the purposes of implementation of the remuneration policies approved by the Bank’s corporate bodies, in the course of the year the Remuneration Committee has conducted an analysis of the remuneration proposals necessary for the implementation and realization of these policies and, in particular, for the application of the special system for settlement and payment of the annual variable remuneration for Identified Staff members; it analyzed, inter alia, the necessary adjustments to the structure and variable compensation model of executive directors and members of the Senior Management, in order to increase the link between their variable remuneration and the Group’s strategy, as well as the financial and non-financial targets established.
The Remuneration Committee likewise analyzed the appropriateness of the annual performance indicators used for the calculation of 2017 annual variable remuneration for executive directors, and their corresponding weightings, along with the targets and scales of achievement associated with these indicators, submitting the corresponding proposals to the Board for its approval.
The Committee also conducted an analysis of the minimum thresholds of Attributable Profit and Capital Ratio established as ex ante adjustments to variable remuneration for Identified Staff, as well as the corresponding scales established to determine the accrual of annual variable remuneration in 2017 for executive directors and remaining Identified Staff members.
Likewise, the Remuneration Committee has determined, and submitted the corresponding proposals to the Board, the multi-year performance indicators established as ex post adjustments, applicable to the deferred annual variable remuneration for 2017 for executive directors and remaining Identified Staff, including senior managers, availing itself of the prior analysis carried out by the Board’s Risk Committee, which ensured alignment with the Bank’s risk profile.
In addition, within the framework of the duties attributed to the Remuneration Committee for the observance and periodic review of the remuneration policy applicable to the Identified Staff, the Committee has reviewed its application in 2016, including the process carried out by the Bank for the identification of Risk Takers for that year, on the basis of the internal, central and independent review carried out by the Bank’s Internal Audit area.
The Committee has also received information from the Bank’s technical areas concerning application of the procedure for
the identification of Risk Takers of the BBVA Group in 2017, in accordance with the criteria established in applicable regulations and the internal criteria established by the Bank.
In addition, the Remuneration Committee submitted the proposed agreement to the Board, for its submission to the General Shareholders’ Meeting in 2017, relating to the approval of a maximum level of variable remuneration of up to 200% of the fixed component of total remuneration for a specific group of employees whose professional activities have a significant impact on the Group’s risk profile. It also proposed the Board’s Recommendations Report that accompanies said proposal and is addressed to the Bank’s shareholders.
Finally, following the proposal submitted by the Remuneration Committee, the Board approved the Annual Report on the Remuneration of BBVA Directors, in accordance with the model established by the National Securities Market Commission (CNMV) in its Circular 4/2013, dated June 12, submitted annually to a consultative vote at the General Shareholders’ Meeting, in compliance with the provisions of article 541 of the Corporate Enterprises Act, and available on the Bank’s corporate website (www.bbva.com) from the date on which the General Meeting was convened.
The Annual Report on the Remuneration of BBVA Directors includes a description of the basic principles of the Bank’s remuneration policy as regards the members of the Board, executive and non-executive, as well as a detailed description of the different elements and amounts that make up their remuneration.
All the matters outlined above, along with further matters within its remit, are specified in the Activity Report of the Remuneration Committee for 2017, published on the Bank’s corporate website on the date on which the General Meeting for 2018 was convened (www.bbva.com).
As already indicated, BBVA has a decision-making process for remuneration issues where the Remuneration Committee is a core element. It is responsible for determining the remuneration policy for Identified Staff, submitting the corresponding proposals to the Board for its approval. All this ensures an appropriate decision-making process for remuneration-related matters.
The members of the Remuneration Committee who held the position in 2017 received an aggregate total of €271 thousand for their membership. In addition, the Annual Report on the Remuneration of BBVA Directors includes a breakdown of the remuneration by item for each director.

5. InformatIon on remuneratIon BBVA. PILAR III 2017 P. 151
5.2. Description of the different types of employees included in the Identified Staff
6. Non-executive directors qualify as Risk Takers under article 3 of Delegated Regulation 604/2014, although, as specified hereunder in section 5.3, they have a specific remuneration system, different from that applicable to executive directors, and they do not receive variable remuneration.
In accordance with the provisions of the BBVA Group Remuneration Policy, the selection of members making up the Identified Staff in the Group is part of an annual process, determined on the basis of the qualitative and quantitative criteria established by Commission Delegated Regulation (EU) 604/2014 of March 4, 2014, supplementing Directive 2013/36/EU of the European Parliament and of the Council with regard to regulatory technical standards with respect to qualitative and appropriate quantitative criteria to identify categories of staff whose professional activities have a material impact on an institution’s risk profile (“Delegated Regulation 604/2014”). This process also includes internal criteria established by BBVA that supplement those indicated in this Regulation, in compliance with Rule 38 of Bank of Spain Circular 2/2016 (hereinafter, the “Identification Process”).
The qualitative criteria established in the Identification Process are defined on the basis of the responsibility of the position (for example, members of BBVA’s management body, members of BBVA’s Senior Management, staff responsible for control functions and other key functions or significant business units within the Group), as well as on the basis of the staff’s capacity or responsibility to assume or manage risks.
The quantitative criteria establish that staff has significant impact on the Group’s risk profile on the basis of the total remuneration granted; unless BBVA determines that the professional activity of this staff de facto has no significant impact on the risk profile, in accordance with the provisions of article 4 of the Delegated Regulation 604/2014.
The Identification Process is updated during the year and takes into consideration all the BBVA Group staff, allowing for the inclusion within the Identified Staff of employees
that comply with, or are likely to comply with, the qualitative criteria established in article 3 of Delegated Regulation 604/2014 for at least three months in a financial year.
All the companies that are part of the BBVA Group will actively participate in the Identification Process carried out by BBVA, providing all the information needed to adequately identify the staff with material impact on the Group’s risk profile.
In accordance with the Identification Process specified, as at year-end 2017 a total of 572 Risk Takers had been identified, including:
Members of BBVA’s Board of Directors. 6
Members of BBVA’s Senior Management.
Risk Takers by function: configured according to the functions that correspond to the qualitative criteria established in article 3 of Delegated Regulation 604/2014, in points 4 to 15 inclusive, as well as those Risk Takers identified according to the Bank’s internal criteria.
Risk Takers by remuneration: made up of employees who met the quantitative criteria of article 4 of Delegated Regulation 604/2014.
The total number of Risk Takers identified in 2017 remained at a similar level as the previous year, in which the total number of identified members was 565. The figure has thus not experimented significant changes.
Notwithstanding the foregoing, BBVA will adapt the definition of Identified Staff, including the categories of professionals necessary at any time, according to the requirements set out by applicable regulations.
5.3. key features of the remuneration system
As specified in section 5.1, in 2017 the Board, at the proposal of the Remuneration Committee, approved the new BBVA Group Remuneration Policy, which includes the remuneration system applicable to Identified Staff, as well as the Identification Process specified in section 5.2 above.
The BBVA Group Remuneration Policy is geared towards the recurring generation of value for the Group, likewise seeking
to align the interests of employees and shareholders with sound risk management.
This Policy is one of the elements devised by the Board as part of BBVA’s corporate governance system to ensure adequate management of the Group. It is based on the following principles:

5. InformatIon on remuneratIon BBVA. PILAR III 2017 P. 152
long-term value creation;
reward achievement of results on the basis of sound and responsible risk assumption;
attract and retain the best professionals;
reward the level of responsibility and professional track record;
ensure internal equity and external competitiveness; and
ensure transparency of the remuneration model.
BBVA has defined the Group Remuneration Policy on the basis of the general principles outlined above, taking into consideration the need to comply with legal requirements for credit institutions and those applicable in the different sectors in which it carries out its business, as well as alignment with best market practices, while including items devised to reduce exposure to excessive risks and adjust remuneration to the targets, values and long-term interests of the Group. To this end, the Policy is guided by the following premises:
it is consistent with and promotes sound and effective risk management, not providing incentives that encourage risk-assumption beyond the levels tolerated by the Group;
it is in line with the business strategy, objectives, values and long-term interests, and will include measures to prevent conflicts of interest;
it provides a clear distinction between the criteria for the establishment of remuneration and variable remuneration;
it promotes equal treatment for all staff, not establishing any differences for reasons of gender or personal characteristics of any other type; and
it pursues that remuneration not be based exclusively or primarily on quantitative criteria, and that it takes into account appropriate qualitative criteria that reflect compliance with applicable regulations.
In accordance with the above, the remuneration scheme generally applicable to employees is implemented through the following:
a) Fixed remuneration, which takes into account the level of responsibility, the functions carried out and the professional career of each employee, the principles of internal equity and the market value of the function, and constitutes a significant portion of total pay.
The award and amount of fixed remuneration are based on predetermined objective and non-discretionary criteria.
b) Variable remuneration, consisting of payments or benefits in addition to fixed remuneration, monetary or non-monetary, based on variable parameters. Under no circumstance shall variable remuneration impose any limits on the Group’s capacity to strengthen its capital base in accordance with regulatory requirements, and it shall take into account current and future risks as well as the necessary cost of capital and liquidity, reflecting a performance that is sustainable and adapted to risk.
Within this generally applicable remuneration model, the BBVA Group Remuneration Policy includes certain particularities applicable, on the one hand, to staff who exercise control functions and, on the other hand, to staff involved in the provision of customer service. Thus:
i. Staff who perform control functions are independent from the business units they supervise, have the necessary authority and are compensated according to the achievement of targets associated with their duties, regardless of the results of the business areas they control. To strengthen the independence and objectivity of these functions, the fixed components of their remuneration have greater weight than the variable components, with the variable components mainly related to objectives specific to the function. In addition, the remuneration of BBVA senior managers in independent control functions, including the compliance and risk management functions, is supervised directly by BBVA’s Remuneration Committee, as in the case of the remaining members of Senior Management.
ii. When designing and establishing the remuneration of staff involved in the provision of customer service, care must be taken to protect their interests and the quality of the services provided, to ensure that:
• it fosters responsible business conduct and fair treatment of customers;
• incentives are not established that may induce staff to put their own interests or those of the BBVA Group first, to the possible detriment of the interests of their customers;
• remuneration is not primarily or exclusively linked to the sale of a product, or a category or specific type of product, such as products that are more lucrative for the entity or employee, where there are others more appropriate with customer needs; and that this objective is not set as that with greatest weight in the remuneration package; and

5. InformatIon on remuneratIon BBVA. PILAR III 2017 P. 153
• an appropriate balance is maintained between the fixed and variable elements of the remuneration.
On the basis of the aforementioned principles and premises, and pursuant to the statutory requirements established by Act 10/2014 and its implementing regulations, BBVA has defined the particularities of the remuneration policy applicable to Identified Staff, designing an incentives system particularly geared towards maintaining alignment of their remuneration with risks, as well as the Group’s long-term objectives and interests.
The result is a remuneration scheme for Identified Staff based on the following basic characteristics:
Balance between the fixed and variable components of total remuneration, in line with applicable regulations, to ensure a policy that is fully flexible with regard to payment of the variable components, allowing for such components to be reduced in their entirety, where appropriate. The proportion between the two components has been established in accordance with the kind of functions carried out by each beneficiary (business, support or control) and, consequently, their impact on the Group’s risk profile, adapted in each case to the reality of the different countries or functions.
Variable remuneration of Identified Staff members shall be based on effective risk management and linked to the level of achievement of previously established financial and non-financial targets, defined at the Group, area and individual levels, which take into account present and future risks assumed and the Group’s long-term interests.
Variable remuneration of Identified Staff members for each financial year shall not accrue, or will accrue in a reduced amount, should certain level of profits and capital ratios not be achieved. It will also be subject to ex ante adjustments, so that it shall be reduced at the time of the performance assessment in the event of negative performance of the Group’s results or other parameters such as the level of achievements of budgeted targets.
The annual variable remuneration for each Identified Staff member shall be calculated on the basis of: (i) annual performance indicators for the Group, area and individual (financial and non-financial); (ii) scales of achievement, as per the weightings allocated to each indicator; and (iii) a “target” annual variable remuneration, representing the amount of annual variable remuneration if 100% of the pre-established targets are met. The resulting amount shall constitute the annual variable remuneration of each beneficiary (hereinafter the “Annual Variable Remuneration”).
In the event of termination of contractual relationship of an Identified Staff member before the closing of the financial year to which the Annual Variable Remuneration corresponds, the member will have the right to receive the proportional amount of said Annual Variable Remuneration, pro-rated for the length of service provided in the financial year and subject, in any case, to the same settlement and payment system applicable had the member remained active, in accordance with the rules set out below. The above shall not be applicable to cases where the termination of contractual relationship is due to a voluntary resignation or lawful dismissal, where the right to receive the Annual Variable Remuneration shall not accrue.
The Annual Variable Remuneration for Identified Staff members shall be subject to specific rules for settlement and payment, specifically:
• 60% of the Annual Variable Remuneration will be paid, if conditions are met, in the year following that to which it corresponds (the “Upfront Payment”). For executive directors, members of the Senior Management and Identified Staff members with particularly high variable remuneration, the Upfront Payment will be 40% of the Annual Variable Remuneration. The remaining portion will be deferred in time (hereinafter, the “Deferred Component”).
• The deferral period will be 5 years for executive directors and members of Senior Management, and 3 years for the remaining Risk Takers.
• 50% of the Annual Variable Remuneration, both of the Upfront Payment and Deferred Component, shall be established in BBVA shares. As regards executive directors and Senior Management, a larger proportion of the Deferred Component shall be established in shares (60%).
• Shares received as Annual Variable Remuneration shall be withheld for a one-year period after delivery, except for the transfer of those shares required to honor the payment of taxes.
As regards executive directors, the Remuneration Policy for BBVA Directors additionally includes a commitment of the executive directors not to transfer a number of shares equivalent to twice their annual fixed remuneration for a period of, at least, three years from the time of their vesting, on top of the general one-year retention period applicable to all the shares. The aforementioned shall not apply to the transfer of those shares required to honor the payment of taxes.
• The Deferred Component of the Annual Variable Remuneration may be reduced in its entirety, but never increased, based on the result of multi-year

5. InformatIon on remuneratIon BBVA. PILAR III 2017 P. 154
performance indicators aligned with the Group’s core risk management and control metrics related to the solvency, capital, liquidity, funding or profitability, or to the share performance and the recurring results of the Group, measured over a period of three years.
These multi-year performance indicators are approved by the Board at the proposal of the Remuneration Committee, following an analysis by the Risk Committee, which ensures they are appropriate to align deferred remuneration with sound risk management.
These multi-year performance indicators to which the Deferred Component of Annual Variable Remuneration for 2017 will be subject, approved by the Board at the proposal of the Remuneration Committee, are as follows:
Table 94. Settlement and payment system for annual variable remuneration (12-31-17)
Indicator WeightingEconomic Adequacy (Economic Equity/Economic Capital at Risk) 20%Common Equity Tier (CET ) 1 Fully Loaded 20%Liquidity Coverage Ratio (LCR) 10%Loan to Stable Customer Deposits (LtSCD) 10%Return on Equity (ROE) 20%(Operating Income - Loan-loss provisions) / Average Total Assets 10%Total Shareholder Return (TSR) 10%
These multi-year performance indicators have certain scales of achievement associated, approved by the Board at the proposal of the Remuneration Committee. Thus, if the targets set for each indicator in the 3-year measurement period from the start of the deferral period are not achieved, the Deferred Component of Annual Variable Remuneration for 2017 may be reduced, even in its entirety, but never increased.
In the case of executive directors and Senior Management, the Deferred Component of Annual Variable Remuneration payable subject to the multi-year performance indicators shall be delivered, if the conditions are met, according to the following schedule: 60% after the third year of deferral, 20% after the fourth year of deferral and 20% after the fifth year of deferral.
• Resulting cash portions of the Deferred Component of Annual Variable Remuneration finally vested, subject to the multi-year performance indicators, shall be updated on the criteria established by the Board.
• The entire Annual Variable Remuneration shall be subject to malus and clawback arrangements during the whole deferral and withholding period, under the terms indicated below.
• No personal hedging strategies or insurance may be used in connection with remuneration or liability that
may undermine the effects of alignment with sound risk management.
• The variable component of the remuneration for a financial year shall be limited to a maximum amount of 100% of the fixed component of total remuneration, unless the General Meeting resolves to increase this percentage up to a maximum of 200%. As explained in detail in section 5.7 of this report, the General Shareholders’ Meeting held on March 17, 2017 authorized a raise of the maximum limit to 200%, for a maximum of 200 Risk Takers.
In addition, as indicated above, up to 100% of the Annual Variable Remuneration of each Identified Staff member corresponding to each financial year shall be subject to malus and clawback arrangements, both linked to a downturn in financial performance of the Bank as a whole, or of a specific unit or area, or of exposures generated by an Identified Staff member, when such downturn in financial performance arises from any of the following circumstances:
c) Misconduct, fraud or serious infringement of the Code of Conduct and other applicable internal rules by an Identified Staff member.
d) Regulatory sanctions or judicial convictions due to events that could be attributed to a specific unit or to the staff responsible for such events.
e) Significant failure of risk management committed by the Bank or by a business or risk control unit, to which the willful misconduct or gross negligence of an Identified Staff member contributed.
f) Restatement of the Bank’s annual accounts, except where such restatement is due to a change in applicable accounting legislation.
For these purposes, the Bank will compare the performance assessment carried out for the Identified Staff member with the ex post behavior of some of the criteria that contributed to achieve the targets. Both malus and clawback will apply to the Annual Variable Remuneration of the financial year in which the event giving rise to application of the arrangement occurred, and they shall be in force during the entire period of deferral and retention applicable to the Annual Variable Remuneration.
Notwithstanding the foregoing, in the event that these scenarios give rise to a dismissal or termination of contract of the Identified Staff member due to serious and guilty breach of duties, malus arrangements may apply to the entire deferred Annual Variable Remuneration pending payment at the date of the dismissal or termination of contract, in light of the extent of the damage caused.

5. InformatIon on remuneratIon BBVA. PILAR III 2017 P. 155
In any case, the variable remuneration is paid or vests only if it is sustainable according to the Group’s situation as a whole, and justified on the basis of the performance of the Bank, the business unit and of the Identified Staff member concerned.
Regarding payments for the early termination of contracts for Identified Staff members, in accordance with the provisions of the BBVA Group Remuneration Policy and in line with the applicable regulations, they shall be based on the results obtained over time. In no case shall bad results or inappropriate conduct be rewarded, and payments shall not be awarded in cases where there have been clear and serious infringements that justify the immediate termination of contract or the dismissal of the Identified Staff member. As regards BBVA directors, the Bank has no commitments to pay severance indemnity.
As regards the pension policy, it shall be compatible with the entity’s long-term business strategy, objectives, values and interests. In accordance with the foregoing, BBVA has a pension system in place, arranged on the basis of geographic areas and coverage offered to different groups of employees. In general, the Bank’s pension schemes are defined-contribution. The contributions to pension schemes of the Group’s employees are made within the framework of applicable labor law and individual or group agreements applicable in each entity, sector or geographic area. BBVA will determine the characteristics of the pension commitments with the different professional categories of employees, including the pensionable salary.
The basis for the calculation of the benefits (commitments for retirement, death and disability) reflect fixed annual amounts; no temporary fluctuations exist derived from variable components or individual results.
As regards executive directors and members of the Senior Management, they are subject to the specificities included in applicable regulations regarding “discretionary pension benefits.” Thus, 15% of the annual contributions agreed to cover the pension commitments will be based on variable components and be considered “discretionary pension
benefits”, subject to the conditions established in the applicable regulations and remuneration policies. Detailed information on the implementation of pension commitments accrued in the year ended may be consulted in Note 54 of the Annual Report corresponding to the Consolidated Financial Statements of the Bank for 2017, available on the Bank’s corporate website (www.bbva.com).
As regards non-executive directors, the Remuneration Policy for BBVA Directors distinguishes between the remuneration system applicable to executive directors and the system applicable to non-executive directors, as set out in the Bank’s Bylaws. A detailed description of the remuneration system for non-executive BBVA directors is included in the mentioned Policy, and the implementation of this system has been explained in the Annual Report on the Remuneration of BBVA Directors corresponding to 2017. Both documents are available on the Bank’s corporate website (www.bbva.com).
As set out in those documents, non-executive directors do not receive variable remuneration; they receive a fixed annual amount in cash for holding the position of director and another for membership of the various committees, with greater weight allocated to the role as chair of each committee, and the amount depending on the nature and duties of the functions attributed to each committee.
In addition, the Bank has a remuneration system in shares with deferred delivery for its non-executive directors, approved by the General Meeting, which also constitutes fixed remuneration. It comprises an annual allocation to non-executive directors, as part of their remuneration, of a number of “theoretical shares” of the Bank that will be delivered, where appropriate, on the date they leave directorship for any reason other than serious breach of their duties. The number of “theoretical shares” annually allotted to each non-executive director will be equivalent to 20% of their total remuneration in cash received the previous year, calculated according to the average closing prices of the BBVA share during the 60 trading sessions prior to the dates of the Annual General Shareholders’ Meetings that approve the financial statements for each year.
5.4. Information on the link between the remuneration of Identified Staff and the performance of the Group
As explained in the above sections, the BBVA Group Remuneration Policy includes the entitlement by Identified Staff members to an Annual Variable Remuneration, payment of which is subject to ex ante adjustments and the amount of which is calculated according to compliance with the objectives established at the start of the year for each of
the annual performance indicators, in accordance with the scales and weightings associated to each indicator. Thus, the amount of variable remuneration received by Identified Staff is linked to the results of the BBVA Group and varies in accordance with them.

5. InformatIon on remuneratIon BBVA. PILAR III 2017 P. 156
Thus, the application of the scales of achievement defined for each indicator, on the basis on the targets established, has determined the amount of the Annual Variable Remuneration for executive directors. For the remaining Identified Staff members, along with the result of the Group’s annual performance indicators, the amount of Annual Variable Remuneration has been determined in accordance with the level of achievement of the financial and non-financial targets set for the area and for each individual, according to the weightings associated with each indicator which, as was already indicated, have been set according to the type of function carried out by each beneficiary (business, support or control).
In 2017, the BBVA Group has generated an Attributable Profit of €3,519 million, an increase in 1.3% with respect to the previous year. This result has been affected by a number of factors, including the accounting impairment of the Group’s stake in the share capital of Telefónica, as well as by certain transactions related to the sale and purchase of shareholdings in other companies, wholesale real-estate portfolio sales and changes in tax policies of some countries where the BBVA Group is present (mainly, United States).
As regards the accounting impairment of the stake in the share capital of Telefónica, it derives from the application of an accounting standard (IAS 39) and the Group’s accounting policies, and has resulted in the Bank having to record the unrealized losses arising from this stake in the income statement for 2017 (€1,123 million), previously recorded under the Group’s total equity. This accounting reclassification has not had an impact in either the Group’s solvency or real value, since it has had no impact on the Bank’s equity, or in its CET 1 fully loaded capital ratio, or in its liquidity, given that it has not involved an outflow of cash.
Likewise, this event has not affected the Bank’s capability for dividend distribution, thus not affecting shareholders’ profitability.
As regards transactions related to the sale and purchase of shareholdings in other companies, wholesale real estate portfolio sales and changes in tax policies of some of the countries where the BBVA Group is present; these transactions have entailed an overall gain amounting €355 million.
Thus, in order to determine the result of the financial annual performance indicators that are part of the remuneration system applicable to Identified Staff, as indicated in section 5.3 of this report, and are used to determine the Annual
Variable Remuneration, the aforementioned impacts have not been taken into account, as they derive from transactions or circumstances that the Bank has deemed unconnected to the day to day management of the Group.
In accordance with the foregoing, the outcome and evolution of the annual performance indicators established to determine 2017 Annual Variable Remuneration for executive directors, and likewise included as Group indicators for the remaining Identified Staff members, has been as follows:
The Group’s net attributable profit without corporate operations, once adjusted to exclude the aforementioned transactions or circumstances, has reached a figure of €4,286 million in 2017, an increase of 23.3% with respect to the previous year, with a positive trend in recurring income, moderation of expenses and effective risk management, allowing the contention of provisions.
The Group’s RORC (Return on Regulatory Capital) stood at 7.96% in 2017, 151 basis points above the figure for 2016 (6.45%), which is due to the increase in the attributable result, as well as the Group prioritizing more efficient activities as regards regulatory capital consumption.
RAROEC (Risk Adjusted Return on Economic Capital) declined slightly in 2017 to 10.4%, compared with 10.9% the previous year, however the Group’s risk profile is maintained and a reduction of economic capital is observed. This slight retrocession means the level of achievement of this indicator is situated slightly below the target established for the year.
On the other hand, the Efficiency Ratio has observed notable improvement, situated at 49.9% in 2017 (vs 51.9% in 2016), driven by the strength in recurring income growth, as well as the disciple maintained in terms of expense contention, with synergies that have materialized (particularly in Spain) and the advances in transformation.
As regards the Net Promoter Score (NPS), part of non-financial indicators, an improvement has been observed in nearly all geographies in relation to competing financial entities, which has resulted in a level of achievement of 107.9.
In accordance with the above, the Annual Variable Remuneration for Identified Staff members is linked to the Group’s financial and non-financial results, all in the framework and in accordance with rules established in the remuneration system, detailed in section 5.3.

5. InformatIon on remuneratIon BBVA. PILAR III 2017 P. 157
5.5. Description of the criteria used to take into consideration present and future risks in the remuneration processes
In line with section 5.3 of this report, the remuneration policy applicable to Risk Takers in 2017 includes the following elements:
Balance between the fixed and variable components of the total remuneration.
Ex ante adjustments, compliance with which has been verified before determining the Annual Variable Remuneration.
Use of indicators for the evaluation of results, which incorporate adjustments for current and future risks. Among the financial indicators defined in 2017 at Group level is RAROEC, an indicator that takes into account the present and future risks and relates the profit obtained to the economic capital needed to obtain it, and which is applicable in general for all employees. This indicator has also been included at the area level in the business areas.
When measuring the performance of financial and non-financial indicators, consideration is given to both individual management aspects and to the targets set at the area and Group levels.
Upon measurement of performance of staff members performing control functions, greater weighting is given to objectives related to their specific functions, to strengthen the independence and objectivity of these functions.
At least 50% of Annual Variable Remuneration is established in shares (60% in the case of the Deferred Component of the executive directors and Senior Management).
Deferral clauses, designed so that a substantial portion of variable remuneration -60% in the case of executive
directors, Senior Management and Risk Takers with particularly high variable remuneration, 40% for the remaining cases – is deferred in time, thus taking into account the economic cycle and the business risks. The deferral period established for 2017 Annual Variable Remuneration is 5 years for executive directors and Senior Management, and 3 years for the remaining Risk Takers.
Inclusion of multi-year performance indicators, measured for the 3-year period from the start of the deferral period, to which weightings have been attributed, and for which scales of achievement have been established, so that in the event that the targets set for each indicator are not obtained, the Deferred Component of the Annual Variable Remuneration may be reduced, even in its entirety, yet never increased.
Obligatory withholding periods of any shares delivered as Annual Variable Remuneration, so that beneficiaries may not freely dispose of them until one year after their delivery date, except for those that should be divested to pay tax obligations.
Prohibition of the use of personal hedging strategies or insurance related to remuneration and liability.
Limitation of the variable component of remuneration for the year to 100% of the fixed component of the total remuneration, except for the maximum of 200 employees for whom BBVA’s General Meeting held on March 17, 2017, authorized the application of a maximum ratio of 200%, as explained in detail in section 5.7 of this report.
Submission of the entire Annual Variable Remuneration to malus and clawback arrangements during the whole deferral and withholding period, under the terms indicated in section 5.3 of this report.

5. InformatIon on remuneratIon BBVA. PILAR III 2017 P. 158
5.6. Main parameters and reasons for any component of the possible variable remuneration plans and other non-cash benefits
The main parameters and reasons for the components of the variable remuneration plans for Identified Staff have been set out in previous sections of this report.
5.7. Ratios between the fixed and variable remuneration of Identified Staff
As specified in section 5.3 above, in the total remuneration for Identified Staff the fixed and variable components must be appropriately balanced, in line with applicable regulations, to ensure a policy that is fully flexible with regard to payment of the variable components, allowing for such components to be reduced even in their entirety, where appropriate.
The proportion between both components is established taking into account the type of functions developed by each beneficiary (business, support or control) and, as a result, their impact on the risk profile, adapted in each case to the existing reality in the different countries where the Identified Staff members carry out their activity or functions.
For these purposes, the Bank has defined “target” ratios between fixed and target variable remuneration, which take into account both the function carried out by each Identified Staff member and the impact on the risk profile.
Notwithstanding the above, pursuant to applicable law, the variable component of Identified Staff members’ remuneration for a financial year shall be limited to a maximum amount of 100% of the fixed component of total remuneration, except for the functions for which the General Meeting agrees to raise this percentage to a maximum of 200%.
For this purpose, the General Meeting held on March 17, 2017 agreed to raise the maximum level of the variable component of remuneration up to a maximum 200% of the fixed component of total remuneration for specific members of the Identified Staff, in accordance with the Recommendations Report issued in this regard by the Board on February 9, 2017. Thus the Bank submitted the following proposed resolution to the General Meeting:
“For the purposes of the provisions of Article 34.1 g) of Act 10/2014 of June 26, on the regulation, supervision and solvency of credit institutions, to approve the group of employees whose professional activities have a significant
impact on the Group’s risk profile to whom the maximum level of variable remuneration of up to 200% of the fixed component of their total remuneration is applicable, enabling subsidiaries of Banco Bilbao Vizcaya Argentaria, S.A., to likewise introduce such maximum level to their professionals, all in light of the Recommendations Report issued in this regard by the Board of Directors of Banco Bilbao Vizcaya Argentaria, S.A., on 9 February 2017, and which has been made available to shareholders as of the date on which this General Meeting was called.”
This resolution was adopted by the General Meeting, for a maximum of 200 Risk Takers, with 98.39% of votes in favor, over a total share capital present or represented in the General Meeting of 63.59%.
The proposal submitted to the General Meeting included the detailed recommendation of the Board, explaining the reasons and scope of the decision proposed to the General Meeting and included the number of persons affected, as well as the expected effect on the maintenance of a sound capital base, taking into account the considerations established by the competent authority as regards dividend distribution policies.
As reflected in the Board’s Recommendations Report, the persons for whom approval of the higher level of remuneration for 2017 was requested performed one of the following functions:
Executive members of BBVA’s Board of Directors.
Members of BBVA’s Senior Management.
Identified Staff members who held first levels of responsibility in different areas of the Group.
Identified Staff members who carried out technological or digital activities, competing in salary markets with companies which have different remuneration structures and remuneration levels than those of financial entities.

5. InformatIon on remuneratIonBBVA. PILAR III 2017 P. 159
Identified Staff Members who performed their activity in regions where the weight of variable remuneration is greater than fixed remuneration.
Identified Staff members who held first levels of responsibility in regions where the local legislation does not establish such limits, and where the amount of the variable remuneration is relevant.
5.8. Quantitative information on the remuneration of Identified Staff
After year-end 2017, and in accordance with the results obtained (described in section 5.4 above), the Annual Variable Remuneration for Identified Staff members corresponding to said year was calculated.
In accordance with the settlement and payment system established for 2017 Annual Variable Remuneration for Identified Staff members:
The Upfront Payment is made in 2018, 40% in the case of executive directors, members of Senior Management and Identified Staff members with variable remuneration of particularly high amounts, and 60% for the remaining Identified Staff members.
The Deferred Component will be subject to the multi-year performance indicators mentioned in section 5.3 of this report, to be paid, if conditions are met, in 2021. For executive directors and members of the Senior Management, the Deferred Component will be paid, where applicable, according to the following schedule: 60% in 2021; 20% in 2022 and the remaining 20% in 2023.
This gives rise, among others, to the amounts that are detailed in the following table, broken down by types of employees:
Table 95. Total remuneration of the Identified Staff in 2017 (12-31-17)
Remuneration for Identified Staff in 2017Executive
Directors(*)Non-executive
directors (1)Senior
Management (*)Rest of
Identified StaffTotal Identified
StaffNumber of beneficiaries of fixed remuneration 3 12 15 542 572Amount of fixed remuneration for 2017 (thousands of euros) (2) 5,491 3,961 16,357 220,016 245,825Number of beneficiaries of variable remuneration 3 - 15 511 529Amount of variable remuneration for 2017 (thousands of euros) 6,545 - 7,491 90,173 104,210
In cash (thousands of euros) 2,880 - 3,296 45,087 51,263
Number of BBVA shares 505,277 - 574,304 5,918,775 6,998,356
Variable remuneration corresponding to 2017 of immediate payment (thousands of euros)
2,618 - 2,997 51,627 57,241
In cash (thousands of euros) 1,309 - 1,498 25,813 28,621
Number of BBVA shares 180,455 - 205,104 3,390,708 3,776,267
Outstanding deferred variable remuneration corresponding to 2017 (thousands of euros) (3) 3,927 - 4,495 38,547 46,969
In cash (thousands of euros) 1,571 - 1,798 19,273 22,642
Number of BBVA shares 324,822 - 369,200 2,528,067 3,222,089(1) Includes remuneration paid to the two non-executive directors who ceased as directors during 2017, amounting 277 thousand euro. Note 54 of the Annual Report of BBVA’s
Consolidated Financial Statements includes the information for each non-executive director, itemized.(2) Fixed remuneration, including remuneration in cash or in kind, received in 2017. Fixed remuneration for Identified Staff is received fully in cash, not subject to deferral. Non-executive
directors have a fixed remuneration system in shares with deferred delivery, at the time they leave directorship. Detailed information regarding said system, including the number of shares allocated in 2017 (corresponding to 20% their fixed remuneration received the previous year) is detailed in Note 54 of the Annual Report of BBVA’s Consolidated Financial Statements
(3) The variable remuneration corresponding to 2017 that is deferred and outstanding is subject to multi-annual performance indicators related to the Risk Appetite Framework and shareholder profitability that can reduce, even in its entirety (but never increase), the outstanding deferred amounts
(*) In accordance with applicable regulations, 15% of the annual contributions agreed to retirement coverage of executive directors and members of the Senior Management will be based on variable components. Detailed information regarding the implementation of benefit-scheme entitlements can be found in Note 54 of the Annual Report of BBVA’s Consolidated Financial Statements

5. InformatIon on remuneratIonBBVA. PILAR III 2017 P. 160
Table 96. Extraordinary remuneration of the Identified Staff in 2017 (12-31-17)
Extraordinary remuneration for Identified Staff in 2017
Executive Directors
Non-executive directors
Senior Management
Rest of Identified Staff
Total Identified Staff
Number of beneficiaries of guaranteed bonuses - - - 1 1
Total amount of guaranteed bonuses granted in 2017 (thousands of euros)
- - - 30 30
Number of beneficiaries of hiring incentives - - - 1 1
Total amount of hiring incentives paid in 2017 (thousands of euros)
- - - 125 125
Number of beneficiaries of severance indemnity - - - 23 23
Total amount of severance indemnity paid in 2017 (thousands of euros) (1) - - - 19,104 19,104
Paid in 2017 - - - 18,845 18,845
Deferred amount - - - 259 259 (1) At the time of disengagement of severance indemnity beneficiaries, non-competition agreements have been signed with some staff members, for a total amount of 3,773 thousand
euro, which will be paid periodically over the course of the non-competition period.In line with applicable regulations, neither legal indemnity amounts nor the aforementioned amount linked to non-competition agreements have been taken into account for the purposes of calculating the fixed/variable ratio, the application of deferral and payment in instruments
Of the total severance indemnity paid, the highest paid to a single member amounts to €4,252 thousand.
In addition, in accordance with the provisions of Rule 40.1 of Bank of Spain Circular 2/2016, indication is given that, from the 23 cases of payments for early termination of contracts, there are 8 cases in which the amount paid has exceeded two annual payments of the fixed remuneration.
In 2017, payment has also been made of the amounts deferred from years prior to 2017. The following table shows the amounts paid in both cash and shares, as well as the amounts that will continue to be deferred from years prior to December 31, 2017:
Table 97. Deferred variable remuneration from previous periods to 2017 (12-31-17)
Variable deferred remuneration for years prior to 2017 for the identified staff
Executive Directors (3)
Non-executive directors
Senior Management
Rest of Identified Staff
Total Identified Staff
Consolidated (1)
In cash (thousands of euros) 853 - 1,016 10,666 12,535
Number of BBVA shares 92,099 - 110,105 1,179,888 1,382,092
Not Consolidated (2)
In cash (thousands of euros) 3,347 - 5,852 50,721 59,921
Number of BBVA shares 502,791 - 885,217 7,813,325 9,201,333
Implicit ex-post adjustments applied during the period - - - - - Explicit ex-post adjustments applied during the period - - - - - (1) Includes the deferred amounts of the variable remuneration corresponding to previous years paid in 2017 and its update (the second third deferred variable remuneration in 2014 and
the last third deferred variable remuneration in 2013)(2) Includes the deferred variable remuneration corresponding to years prior to 2017 pending payment at December 31st 2017 (last third of the deferred variable remuneration for 2014
and the full amount of the deferred variable remuneration for 2015 and 2016)(3) The deferred amounts of the variable remuneration paid in 2017 and corresponding to previous years are accounted individually for each executive director in Note 54 of BBVA's
Consolidated Financial Statements Annual Report . Respect to the non-consolidated deferred variable remuneration at the end of 2017, the amounts corresponding to each executive director are as follows: - Last third of the deferred variable annual remuneration for 2014: 289 thousand euros and 37,390 BBVA shares in the case of the Chairman; 91 thousand euros and 11,766 BBVA shares in the case of the CEO; and 28 thousand euros and 3,678 BBVA shares in the case of the Chief Executive Officer of GERPA - Deferred variable annual remuneration for 2015: 897 thousand euros and 135,299 BBVA shares in the case of the Chairman; 530 thousand euros and 79,956 BBVA shares in the case of the CEO; and 98 thousand euros and 14,815 BBVA shares in the case of the Chief Executive Officer of GERPA - Deferred variable annual remuneration for 2016: 734 thousand euros and 114,204 BBVA shares in the case of the Chairman; 591 thousand euros and 91,915 BBVA shares in the case of the CEO and 89 thousand euros and 13,768 BBVA shares in the case of the Chief Executive Officer of GERPA

5. InformatIon on remuneratIonBBVA. PILAR III 2017 P. 161
The table below gives the total remuneration of the Identified Staff for the year 2017, broken down by area of activity:
Table 98. Remunerations of the identified staff in 2017 by activity areas
Activity area Number of peopleTotal remuneration 2017
(thousands of euros) (1) Average variable/fixed ratioDecember 2017 3 12,036 105%Non-executive directors 12 3,961 0%Commercial Banking (2) 177 123,656 43%Investment banking (3) 97 64,787 67%Assets management (4) 29 14,583 54%Corporate functions (5) 138 88,340 32%Control functions (6) 116 42,671 25%Others (7) - - - Total Identified Staff 572 350,034(1) Fixed remuneration paid in 2017 and variable remuneration generated in 2017(2) Includes Retail, Business, Corporate and Insurance activities(3) Includes Trading activities and other Investment Banking activities(4) Includes Assets Management activities and Private Banking activities(5) Includes support areas for the BBVA Group and support areas for the business (Finance, Legal, Human Resources, etc.)(6) Includes Risk Management activities, Internal Audit and Compliance(7) Other activities not included in the previous categories
As regards the number of employees receiving remuneration equal to or higher than 1 million euro, it is as follows:
Table 99. Number of individuals with total remuneration in excess of €1 million in 2017 (12-31-17)
Total remuneration in 2017 (1)Number of individuals
Between 6 million and 7 million euros 1Between 5 million and 6 million euros 1Between 4.5 million and 5 million euros 1Between 4 million and 4.5 million euros 1Between 3.5 million and 4 million euros 1Between 3 million and 3.5 million euros 0Between 2.5 million and 3 million euros 1Between 2 million and 2.5 million euros 6Between 1.5 million and 2 million euros 13Between 1 million and 1.5 million euros 34Total 59 (1) Sum of the fixed remuneration for 2017 and the variable remuneration generated in
2017. The part of the variable remuneration corresponding to the 2017 financial year that is deferred is subject to multiannual indicators and objectives whose compliance could reduce (never increase) those deferred amounts and therefore the total amount of remuneration in 2017.

6. InformatIon on the Corporate GovernanCe systemBBVA. PILAR III 2017 P. 162
6. Information on the Corporate Governance system
As well as the information that have been dealt with in this Report, and in relation to the other information on the corporate governance system in Part Eight of the CRR, readers are referred to the Annual Corporate Governance Report corresponding to 2017, which forms part of the
Management Report that accompanies BBVA Group’s Consolidated Annual Report and the policy on the selection, appointment, renewal and diversity of the Board of Directors, both documents being accessible on the corporate website (www.bbva.com).

7. subsequent events BBVA. PILAR III 2017 P. 163
7. Subsequent events
From January 1, 2018 to the date this report was drafted, no other events have occurred that significantly affect the Group’s earnings or its equity position, and that are not mentioned in the notes to the consolidated financial statements.
Transition to IFRS 9
Under Commission Regulation (EU) No. 2016/2067 of November 22, 2016, all companies governed by the law of a
Member State of the European Union, and whose securities are traded on a regulated market in one of the countries in the EU, must apply IFRS 9 as from the commencement date of their first financial year starting on or after January 1, 2018. The Group is therefore obliged to adopt IFRS 9 after January 1, 2018 (see Note 2.3 of the Group’s Consolidated Annual Report).