BBVA COMPASS STADIUM - Waveland Ventures€¦ · BBVA COMPASS STADIUM IMPACT REPORT ... Components...
49
BBVA COMPASS STADIUM IMPACT REPORT HOUSTON, TX – MAY 2013 © 2013 Strategic Development Solutions
Transcript of BBVA COMPASS STADIUM - Waveland Ventures€¦ · BBVA COMPASS STADIUM IMPACT REPORT ... Components...
BBVA COMPASS STADIUMIMPACT REPORT
HOUSTON, TX – MAY 2013
© 2013 Strategic Development Solutions
This Impact Report has been prepared by Strategic Development Solutions on behalf of Wells Fargo and AEG for the Houston Dynamo Stadium Project. This report was published May 2013.
[email protected] (310) 914-5333 | 11150 W. Olympic Blvd. Los Angeles, CA 90064 www.sdsgroup.com
Disclaimer: Components about Houston Dynamo history and services are drawn directly from marketing materials, including websites and
brochures. Every reasonable effort has been made to ensure that the data contained in this report reflects the most accurate and complete
information possible. Many of the figures presented are based on estimates from the project and others were derived from these estimates
using IMPLAN financial modeling software and consultations with project representatives. In the case of projections, an effort has been made
to provide the reader with a statement of assumptions that detail the sources of data and/or methods by which statistics were generated. No
responsibility is assumed for inaccuracies in reporting by project representatives or any other data source used in preparing this report. No
warranty or representation is made by SDS that any of the estimates contained in this report will be achieved.
TABLE OF CONTENTS
1.0 INTRODUCTION ................................................................................................................. 11.1 Impact Report Components and Process .......................................................................................................................................................... 1
1.2 Why an Impact Report is Important .................................................................................................................................................................... 2
1.3 Report Collaborators and Funders ....................................................................................................................................................................... 3
2.0 EXECUTIVE SUMMARY ..................................................................................................... 5
3.0 BBVA COMPASS STADIUM ............................................................................................... 83.1 Project Overview ........................................................................................................................................................................................................ 8
3.2 Team and Stadium Owner Background ...........................................................................................................................................................10
3.3 Project Genesis ..........................................................................................................................................................................................................12
3.4 Site and Area Background .....................................................................................................................................................................................15
3.5 Stadium Financing ...................................................................................................................................................................................................17
4.0 PROJECT IMPACTS ......................................................................................................... 194.1 Economic Impacts ....................................................................................................................................................................................................20
4.2 Fiscal Impacts .............................................................................................................................................................................................................25
4.3 Social and Community Impacts ..........................................................................................................................................................................28
4.4 Environmental Impacts ..........................................................................................................................................................................................33
APPENDICES ........................................................................................................................... 37Appendix A: Locations of Tables and Figures ..............................................................................................................................................................37
Appendix B: Credentials of Report Authors .................................................................................................................................................................38
Appendix C: IMPLAN ............................................................................................................................................................................................................39
Appendix D: References and Assumptions ..................................................................................................................................................................40
Appendix E: AEG Overview ................................................................................................................................................................................................43
Appendix F: Dynamo Charities Overview ....................................................................................................................................................................44
Appendix G: AEG 1EARTH Program ................................................................................................................................................................................46
pag e | 1BBVA Co m pA ss stA d i u m
1.0 INTRODUCTION
1.1 IMPACT REPORT COMPONENTS AND PROCESSThis Impact Report seeks to analyze and present the impacts of the Houston Dynamo Stadium Project in Houston, Texas. In doing so, the report provides a detailed project history and overview and describes real and projected quantitative and qualitative project benefits achieved across four core areas:
• Economic • Fiscal • Social and Community • Environmental
The framework of this report is organized into three narrative sections beyond this Introduction (1.0):
2.0 EXECUTIVE SUMMARYThis section is a high-level overview of all impacts included in the report.
3.0 PROJECT OVERVIEW This section includes a summary of the project, the project team’s organizational history and overview, the site history and project financing sources.
4.0 PROJECT IMPACTS This section details the project’s core economic, fiscal and social/community impacts.
PROCESSStrategic Development Solutions’ (SDS) general process involves direct communication with project sponsor staff, devel-opment team consultants, community stakeholders and investor staff to elicit relevant project data and projected impacts through interviews and other data collection processes.
In addition, SDS conducts research to collect information on project area demographics, socio-economics and other rel-evant information to more fully present the complete scope of the project and its qualitative impacts on the surrounding community.
The Los Angeles County Economic Development Corporation (LAEDC) works directly with SDS to assess the full scope of project characteristics and utilize fiscal policy and economic data to run relevant analyses, considering both construction and operational phases.
1.0 INTRODUCTION
pag e | 2BBVA Co m pA ss stA d i u m
1.0 INTRODUCTION
1.2 WHY AN IMPACT REPORT IS IMPORTANT
Many project sponsors, as well as project funders, seek a vehicle to effectively communicate the project’s economic, fiscal and social/community impacts to multiple stakeholder groups. This report uses a combination of quantitative data and qualitative information to comprehensively capture, analyze and communicate the full scope of a project’s benefits and impacts. Stakeholder groups that would benefit from reading a project’s impact report include:
INVESTORS/LENDERSInvestors and lenders, whether providing market-rate or below-market investments or loans, want to understand the im-pacts of the projects they fund. This is often particularly true of bank lenders seeking to have their loans qualify as Com-munity Reinvestment Act (CRA) investments or other investors seeking to make an impact in low-income communities.
DONORSDonors, by their very nature, are involved with a project because they want to see their donations make an impact. An Impact Report communicates the comprehensive impacts of their donation. Donors are increasingly seeking the type of transparency and accountability that an Impact Report achieves.
TAXPAYERSTaxpayers provide the direct subsidies invested in a project via local, state or federal government programs, yet taxpayers do not have a direct vote on the specific project being funded. An impact report serves to ensure continued taxpayer sup-port of such funding efforts by defining a project’s community, environmental and economic impacts as well as its financial returns.
GOVERNMENT As stewards of the taxpayers’ dollars, the local, state or federal government agencies involved in funding a project can uti-lize the Impact Report to better understand and communicate the value and return on the taxpayers’ investment.
COMMUNITIES An Impact Report helps inform the communities surrounding a project of the resulting jobs, revitalization and other com-munity benefits.
CDFI FUNDAn Impact Report notifies the CDFI Fund of how a project has achieved the NMTC program investment criteria as well as fiscal and impact goals.
pag e | 3BBVA Co m pA ss stA d i u m
1.0 INTRODUCTION
1.3 REPORT COLLABORATORS AND FUNDERS
Outlined below are descriptions of the firms that played an important role in creating and providing the information used for this Impact Report (See Appendix B for further background information on report authors):
STRATEGIC DEVELOPMENT SOLUTIONS (SDS) is the lead organization in creating this Im-pact Report in partnership with LAEDC (below). SDS produces pre- and post-development impact reports tailored to the specific needs of individual clients and projects. SDS also de-velops innovative market-driven approaches to promote economic development. SDS has built and capitalized more than $2 billion of Double and Triple Bottom Line private-equity funds with its affiliated partner Economic Innovation International, Inc. Further, these two firms jointly manage the $312 million National New Markets Fund, LLC (NNMF). www.sdsgroup.com
THE LOS ANGELES COUNTY ECONOMIC DEVELOPMENT CORPORATION (LAEDC) assisted SDS by providing the economic and fiscal analysis presented in this Impact Report. The LAEDC is a private, non-profit organization established in 1981 by the Los Angeles County Board of Supervisors. The LAEDC Economic and Policy Analysis Group offers objective eco-nomic and policy research and analysis for public agencies and private firms, focusing on economic impact studies, regional industry analyses, economic forecasts and policy stud-ies, particularly in water, transportation, infrastructure and environmental policy.www.laedc.org
THE HOUSTON DYNAMO is an MLS soccer club based in Houston, Texas since 2005. The Houston Dynamo Soccer club and the new BBVA Compass Stadium are owned by AEG (majority owner), the Brener Group and Golden Boy Productions.www.houstondynamo.com
WELLS FARGO COMMUNITY LENDING AND INVESTMENT was the equity investor in the $25.5 million New Markets Tax Credit transaction. Wells Fargo is active in the New Markets Tax Credit investment arena as a lender, tax credit investor, and NMTC allocatee.www.wellsfargo.com
ANSCHUTZ ENTERTAINMENT GROUP, INC. through its subsidiaries and affiliates (collec-tively, “AEG”) has acquired or merged more than 100 divisions and companies, whose al-liances create a global live entertainment organization capable of developing, producing, promoting, marketing, and managing sports and entertainment events and venues. AEG, the project sponsor, is the majority owner of the Houston Dynamo Team and operator of BBVA Compass Stadium. www.aegworldwide.com
pag e | 4BBVA Co m pA ss stA d i u m
1.0 INTRODUCTION
This report was commissioned by the following NMTC Allocatees and other funders, which invested in the project:
WAVELAND COMMUNITY DEVELOPMENT (WCD), a wholly-owned subsidiary of Waveland Ventures, has received $312 million in New Markets Tax Credit allocation since 2007. WCD’s primary line of business is providing equity and leveraged debt capital for small businesses. WCD provided $10.5 million in NMTC allocation to the project.www.wavelandventures.com
TEXAS COMMUNITY DEVELOPMENT CAPITAL (TXCDC) provides equity, equity-like debt and debt capital for businesses and real estate projects that demonstrate a capacity for catalytic change in economically distressed communities throughout Texas. TXCDC pro-vided $15 million in NMTC allocation to the project. www.txcdc.com
pag e | 5
2.0 EXECUTIVE SUMMARY
BBVa Co m pa ss sta d i u m
3.1 PROJECT OVERVIEWThe Houston Dynamo Stadium Project centers on the de-velopment of an $85.6 million soccer-specific stadium in the East Downtown (EaDo) district in Houston, TX. The 22,000 seat sports stadium primarily serves as the home for the Houston Dynamo Soccer Club, an existing Major League Soccer (MLS) franchise. It also serves as the home football stadium for Texas Southern University (TSU). The project also supported the development of the Houston Amateur Sports Park (HASP)–the Dynamo team training venue and community soccer fields. The stadium project is a model of sustainable development and a catalyst for future development in Houston’s highly-distressed East Downtown and adjacent neighborhoods. The stadium construction began in March 2011 and was completed in May 2012.
3.2 SPONSOR BACKGROUNDThe Houston Dynamo is an American professional soccer club, based in Houston, Texas, that plays in Major League Soccer (MLS). The team was created on December 15, 2005 when the San Jose Earthquakes relocated to Hous-ton. The team is owned by Dynamo Soccer, LLC which is owned by majority member and managing partner, AEG, and minority members Brener International Group and Golden Boy Promotions. In addition, AEG oversees the Houston Dynamo management team which undertakes the day-to-day activities such as coaching and staffing, player hiring and training, team merchandising, advertis-ing, ticket sales, marketing, public relations, broadcast-ing, operations, team administration and youth develop-ment programs. AEG is also the primary owner of the stadium–now called BBVA Compass Stadium. Its affiliate AEG Facilities, LLC oversees the stadium management team which undertakes the core operations and mainte-nance of the stadium.
3.3 PROJECT GENESISThe Houston Dynamo moved to the city of Houston from San Jose, CA in December 2005. The rationale behind AEG moving the team from its prior market was because it was unable to secure a soccer-specific stadium and
TABLE 1: PROJECT OVERVIEW
PROJECT BASICS
Location2200 Texas StreetHouston, TX
Asset Type Soccer Stadium
Operator Dynamo Stadium, LLC
Total Project Cost $85.6M
Construction TimeframeStart Date: February 2011End Date: May 2012
NMTC ALLOCATEES
Waveland Community Development
$10.5M
Texas Community Development Capital
$ 15M
COMMUNITY NEED
Poverty Rate 41.5%
Unemployment Rate 11.5%
Area Median Income 43.6%
ECONOMIC, FISCAL, SOCIAL & ENVIRONMENTAL IMPACTS
Direct Construction Jobs 360
Team Operations Jobs 59
Stadium Management Jobs 25
Game-Day Part-Time Jobs 500
20-Year Compensation (PV) $446.6M
20-Year Tax Revenues (PV) $114.5M
Taxpayer Subsidy Break-Even Year Year 3
20-Year Annualized Taxpayer ROI 7.2%
20-Year Taxpayer MIRR on Subsidy 18.4%
Launched “Building a Better Houston” campaign
Half of NMTC fees will be reinvested into community
Expands the reach of Dynamo Charities
LEED Silver Certified
Greenest new stadium in Houston; one of “greenest” soccer stadi-ums in nation
Implementation of AEG’s 1EARTH program and goals
Transit-oriented design incorporating direct access to bus, rail, trol-ley, bike/walking paths
Houston was able to offer this to the team in a very soc-cer-friendly city. From 2005 to 2011, project planners examined prospective stadium sites within the greater
2.0 EXECUTIVE SUMMARY
pag e | 6
2.0 EXECUTIVE SUMMARY
BBVa Co m pa ss sta d i u m
Houston area, finally settling on the East Downtown dis-trict. This neighborhood, bordering downtown Houston, not only had vacant land, but was also economically de-pressed and in dire need of the redevelopment activity that the stadium would bring. With the site selected, the City of Houston and Harris County jointly purchased the property and then Harris County Houston Sports Author-ity leased the land from them and subsequently leased the land to Dynamo Stadium LLC to be the subtenant for 30 years. AEG was able to leverage financing sources such as New Markets Tax Credits and tax increment fi-nancing in order to develop the project without further burdening the area taxpayers. Once financed, AEG set out to build a cutting-edge stadium with the goal of be-ing one of the greenest stadiums in the country–the sta-dium eventually achieved LEED Silver Certification. The BBVA Compass Stadium groundbreaking was on Febru-ary 5, 2011.
3.4 SITE BACKGROUNDThe project is located in the East Downtown District of Houston. This neighborhood has a long history of com-mercial and industrial usage and its land and assets were largely underutilized or vacant and dilapidated prior to the stadium development. In addition, the area is severe-ly distressed economically; it had 41.5% poverty, 11.5% unemployment and incomes that are 43.6% of AMI as of 2011. In response to the stadium project, increased area redevelopment activity has become a priority in the re-gion surrounding the stadium and adjacent neighbor-hoods. The new metro rail line, scheduled to open in 2014, was rerouted in order to stop directly in front of the stadium and is anticipated to greatly increase the number of visitors to the neighborhood. This, along with the stadium’s activity, will support the overarching goal to transition this former industrial area into a more di-verse neighborhood that offers housing, entertainment, culture, retail, transportation, food and services.
3.5 PROJECT FINANCINGAEG assembled $85.6 million to fund the stadium de-velopment by securing a commercial loan worth $33 million from Amegy Bank as well as a self-funded loan worth $20.4 million from Dynamo Stadium Holdings. In addition, AEG secured $25.5 million in New Markets Tax Credit allocation from Waveland Community Develop-
ment ($10.5 million) and Texas Community Development Capital ($15 million), of which the cumulative net equity to the project was $5.1 million. The stadium project also received $20 million in Tax increment Financing, $5.6 mil-lion in owner equity, and $1.5 million in lease pre-pay-ment funds from Texas Southern University for use of the stadium for its football team for the next 30 years.
4.1 ECONOMIC IMPACTThe stadium project allowed existing team-related jobs to be maintained as well as new team and stadium-relat-ed jobs to be created within Harris County. Construction of the stadium supported 360 full-time jobs and gener-ated a total economic output in the region of $154 mil-lion present value (PV). The project also awarded 32% of all its construction subcontracts to minority, women or small businesses. Dynamo team operations created 15 new full-time jobs, for a total of 59 operations employ-ees, that will produce employment compensation of $259.3 million (PV) and a regional economic output of $457.3 million (PV) over 20 years.
The stadium operations team was created as a result of this project and, consequently, hired 25 new staff which will generate employment compensation of $123.7 mil-lion (PV) and an economic output of $239.7 million over the subsequent 18.75 years. Stadium Operations will also generate new part-time game-day jobs, including con-cession sales, ushers, ticket takers, event security, clean-ing crews, food, medical and police–generating up to 500 part-time jobs for sold-out events. Over the 20 years of the project timeframe measured, the total economic contribution from all sources (excluding game-day part-time jobs) is anticipated to be $851 million (PV).
A core economic impact for the Dynamo team of owning its own stadium will result in broader and enhanced rev-enue streams from more lucrative sponsorships, ticket sales, direct merchandising and concessions revenue. The stadium also has multiple economic revitalization outcomes resulting throughout the neighborhood, city and broader region. The stadium’s development tested a new model of area revitalization, created a new valuable community asset that generates much-needed city rev-enues, spurred the enhancement of area infrastructure, expanded the viable boundaries of “downtown Houston”
pag e | 7
2.0 EXECUTIVE SUMMARY
BBVa Co m pa ss sta d i u m
and supports existing local and regional community and economic development plans.
4.2 FISCAL IMPACTThis project has utilized cumulative taxpayer subsidies (local, state and federal) totaling $29.9 million. The re-sulting fiscal impacts of the project are significant. The local, state and federal tax revenue (the “cumulative tax revenue”) generated during stadium construction (15 months) is $15.1 million (PV). The projected cumulative tax revenue generated from annual team operations av-erages $3.55 million, or $71.1 million (PV) over 20 years. The projected cumulative tax revenue generated from annual stadium operations averages $1.52 million, or $28.4 million (PV) over 18.75 years. Therefore, over the next 20 years, the total cumulative tax revenue generat-ed from the construction and operations of the facility is projected to be $114.6 million (PV). The fiscal repayment to the taxpayers, based on this subsidy level and the to-tal projected cumulative tax revenues (construction and operations) over a 20-year period, is significant. The tax-payer break-even point, when the cumulative taxpayer subsidies are fully recouped, is in Year 3. The annualized return on the taxpayer subsidy investment is 7.2% and the taxpayer Modified Internal Rate of Return (MIRR) on the subsidy provided is 18.4%.
4.3 SOCIAL/COMMUNITY IMPACTThe Dynamo Stadium Project has spurred many positive social and community impacts for the East Downtown neighborhood and broader region. The Dynamo team has been actively involved in grass-roots neighborhood improvement projects since the team solidified its plans to move into the neighborhood. They are sponsors of and active participants in a community improvement campaign called “Building a Better Houston,” led by BBVA and the Dynamo. This campaign supports the commu-nity through its four targeted initiatives: Build a Better Body, Build a Better Mind, Build a Better Planet and Build a Better Community.
The Dynamo achieved further benefits by structuring its NMTC financing so that allocatees will set aside at least 50% of their exit fees to reinvest back into the Houston community through donations and grants to communi-ty-serving nonprofits and small businesses. Additionally,
Houston Dynamo’s philanthropic arm, Dynamo Charities, has pursued its mission since 2008 to utilize soccer and the Dynamo organization’s resources to achieve a higher quality of life for the people in the greater Houston area through its various programs.
The stadium development also spurred an important parallel development project which created the Houston Amateur Sports Park (HASP). HASP is the Dynamo’s train-ing center and also serves as a community soccer park for youth and amateur events. HASP was specifically de-signed to address the lack of quality community recre-ational facilities.
BBVA Compass Stadium will also greatly benefit Texas Southern University, which has a 30-year low-cost lease to use the stadium for home football games. This access increases the team’s and school’s visibility, brings in high-er revenues from games and contributes to the financial stability of the university.
4.4 ENVIRONMENTAL IMPACTBBVA Compass Stadium is the greenest new stadium in Houston and one of greenest soccer stadiums in the nation. The project has implemented AEG’s 1EARTH pro-gram and goals throughout the construction and opera-tion of the venue and it received LEED Silver certification for New Construction in December 2012 based on its design, construction and operations protocols. The con-struction and operations phases adopted sustainability practices that achieve water efficiency of 41%, energy reduction of 20%, diversion of 87% of construction de-bris, use of 98% FSC certified wood, and recycling of 30% of game day waste. Moreover, the project incorporates a transit-oriented design with direct access to bus, rail, trolley and biking as well as walking paths. Preferred parking is also provided for low-emission or fuel-efficient cars. Finally, the BBVA–Dynamo partnership is undertak-ing a “Build a Better Planet” campaign which includes working with Greenstar Recycling for ongoing recycling and environmental education. Overall, the facility serves as a model for sustainable stadium design and opera-tions nationwide.
pag e | 8
3.0 BBVA COMPASS STADIUM
BBVa Co m pa ss sta d i u m
3.1 PROJECT OVERVIEW
BBVA COMPASS STADIUM
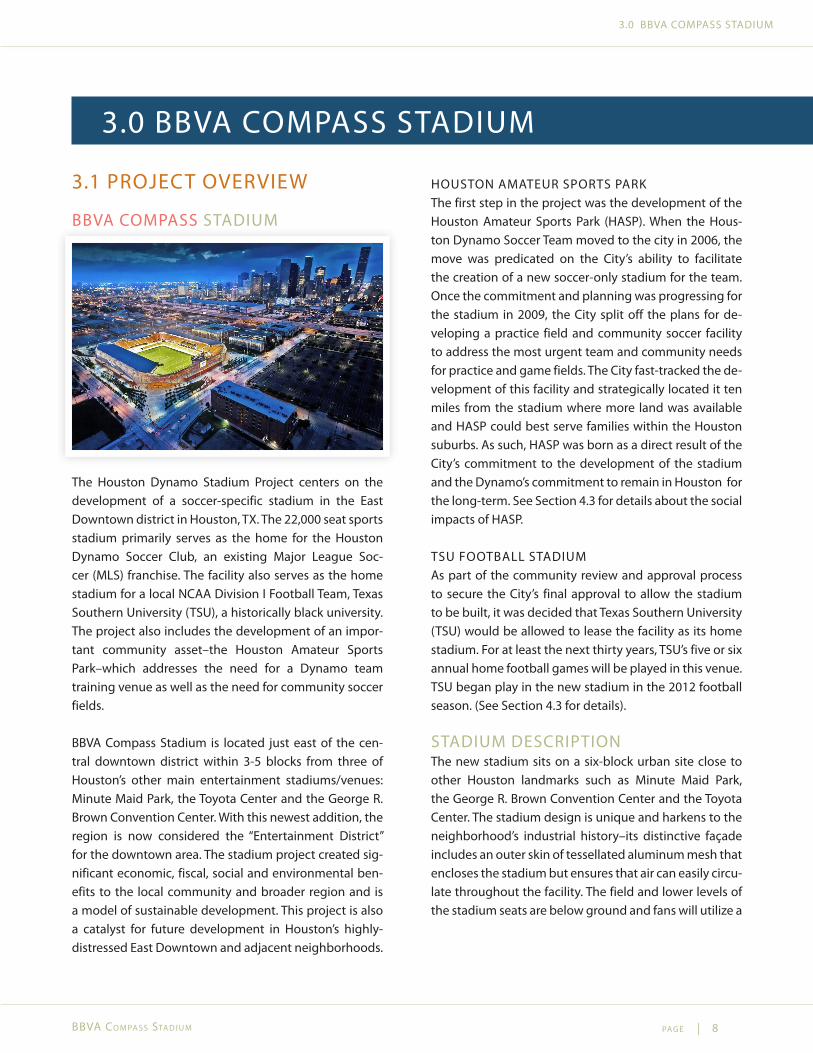
The Houston Dynamo Stadium Project centers on the development of a soccer-specific stadium in the East Downtown district in Houston, TX. The 22,000 seat sports stadium primarily serves as the home for the Houston Dynamo Soccer Club, an existing Major League Soc-cer (MLS) franchise. The facility also serves as the home stadium for a local NCAA Division I Football Team, Texas Southern University (TSU), a historically black university. The project also includes the development of an impor-tant community asset–the Houston Amateur Sports Park–which addresses the need for a Dynamo team training venue as well as the need for community soccer fields.
BBVA Compass Stadium is located just east of the cen-tral downtown district within 3-5 blocks from three of Houston’s other main entertainment stadiums/venues: Minute Maid Park, the Toyota Center and the George R. Brown Convention Center. With this newest addition, the region is now considered the “Entertainment District” for the downtown area. The stadium project created sig-nificant economic, fiscal, social and environmental ben-efits to the local community and broader region and is a model of sustainable development. This project is also a catalyst for future development in Houston’s highly-distressed East Downtown and adjacent neighborhoods.
HOUSTON AMATEUR SPORTS PARK The first step in the project was the development of the Houston Amateur Sports Park (HASP). When the Hous-ton Dynamo Soccer Team moved to the city in 2006, the move was predicated on the City’s ability to facilitate the creation of a new soccer-only stadium for the team. Once the commitment and planning was progressing for the stadium in 2009, the City split off the plans for de-veloping a practice field and community soccer facility to address the most urgent team and community needs for practice and game fields. The City fast-tracked the de-velopment of this facility and strategically located it ten miles from the stadium where more land was available and HASP could best serve families within the Houston suburbs. As such, HASP was born as a direct result of the City’s commitment to the development of the stadium and the Dynamo’s commitment to remain in Houston for the long-term. See Section 4.3 for details about the social impacts of HASP.
TSU FOOTBALL STADIUMAs part of the community review and approval process to secure the City’s final approval to allow the stadium to be built, it was decided that Texas Southern University (TSU) would be allowed to lease the facility as its home stadium. For at least the next thirty years, TSU’s five or six annual home football games will be played in this venue. TSU began play in the new stadium in the 2012 football season. (See Section 4.3 for details).
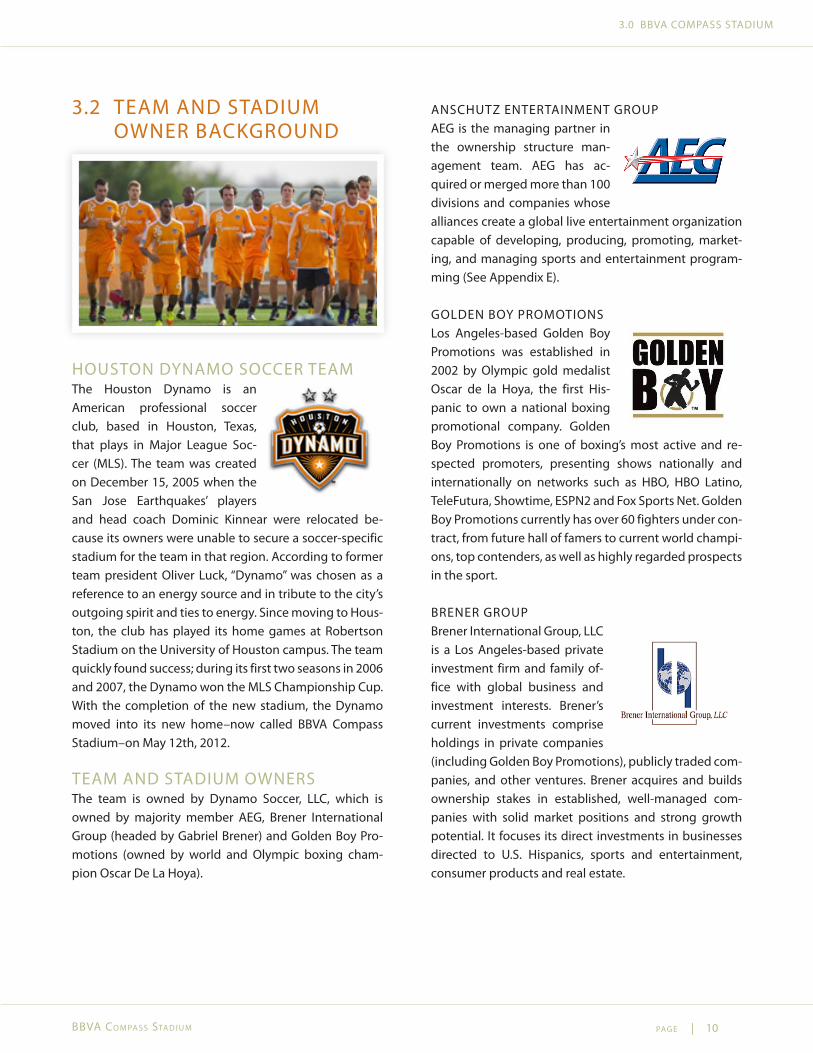
STADIUM DESCRIPTIONThe new stadium sits on a six-block urban site close to other Houston landmarks such as Minute Maid Park, the George R. Brown Convention Center and the Toyota Center. The stadium design is unique and harkens to the neighborhood’s industrial history–its distinctive façade includes an outer skin of tessellated aluminum mesh that encloses the stadium but ensures that air can easily circu-late throughout the facility. The field and lower levels of the stadium seats are below ground and fans will utilize a
3.0 BBVA COMPASS STADIUM
pag e | 9
3.0 BBVA COMPASS STADIUM
BBVa Co m pa ss sta d i u m
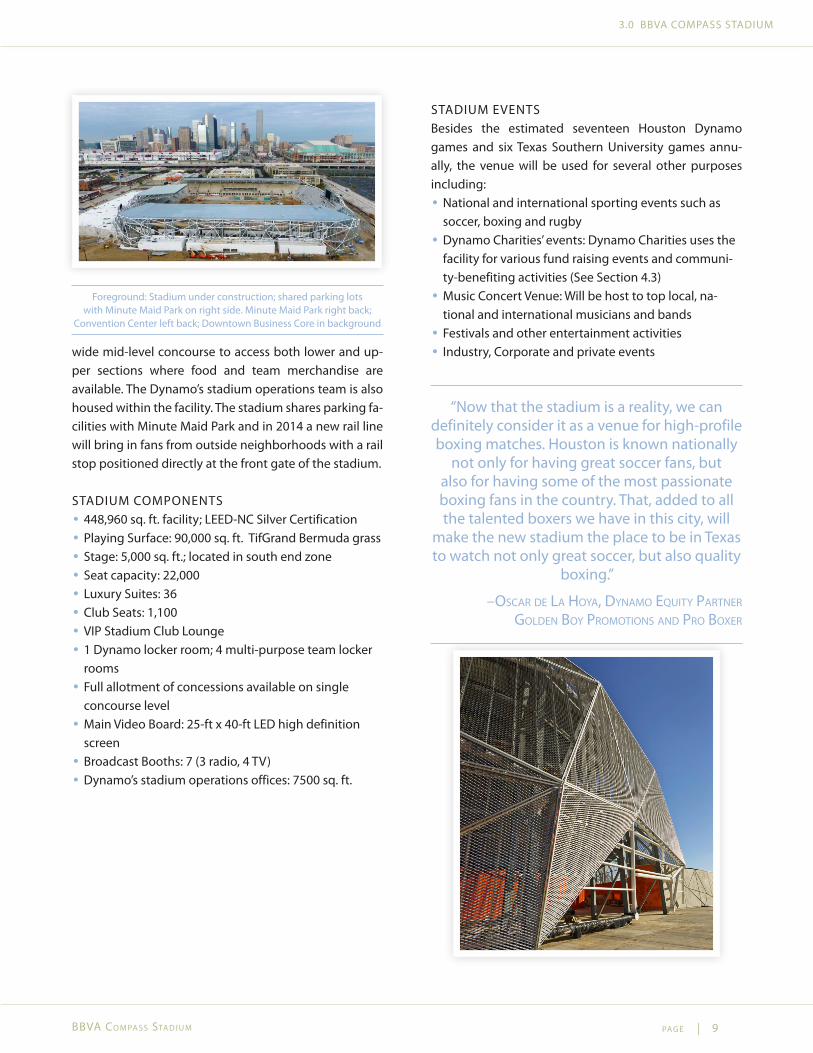
Foreground: Stadium under construction; shared parking lots with Minute Maid Park on right side. Minute Maid Park right back;
Convention Center left back; Downtown Business Core in background
wide mid-level concourse to access both lower and up-per sections where food and team merchandise are available. The Dynamo’s stadium operations team is also housed within the facility. The stadium shares parking fa-cilities with Minute Maid Park and in 2014 a new rail line will bring in fans from outside neighborhoods with a rail stop positioned directly at the front gate of the stadium.
STADIUM COMPONENTS • 448,960 sq. ft. facility; LEED-NC Silver Certification • Playing Surface: 90,000 sq. ft. TifGrand Bermuda grass • Stage: 5,000 sq. ft.; located in south end zone • Seat capacity: 22,000 • Luxury Suites: 36 • Club Seats: 1,100 • VIP Stadium Club Lounge • 1 Dynamo locker room; 4 multi-purpose team locker rooms
• Full allotment of concessions available on single concourse level
• Main Video Board: 25-ft x 40-ft LED high definition screen
• Broadcast Booths: 7 (3 radio, 4 TV) • Dynamo’s stadium operations offices: 7500 sq. ft.
STADIUM EVENTSBesides the estimated seventeen Houston Dynamo games and six Texas Southern University games annu-ally, the venue will be used for several other purposes including:
• National and international sporting events such as soccer, boxing and rugby
• Dynamo Charities’ events: Dynamo Charities uses the facility for various fund raising events and communi-ty-benefiting activities (See Section 4.3)
• Music Concert Venue: Will be host to top local, na-tional and international musicians and bands
• Festivals and other entertainment activities • Industry, Corporate and private events
“Now that the stadium is a reality, we can definitely consider it as a venue for high-profile boxing matches. Houston is known nationally
not only for having great soccer fans, but also for having some of the most passionate boxing fans in the country. That, added to all the talented boxers we have in this city, will
make the new stadium the place to be in Texas to watch not only great soccer, but also quality
boxing.”
–osCar de La Hoya, dynamo equity partner goLden Boy promotions and pro Boxer
pag e | 10
3.0 BBVA COMPASS STADIUM
BBVa Co m pa ss sta d i u m
3.2 TEAM AND STADIUM OWNER BACKGROUND
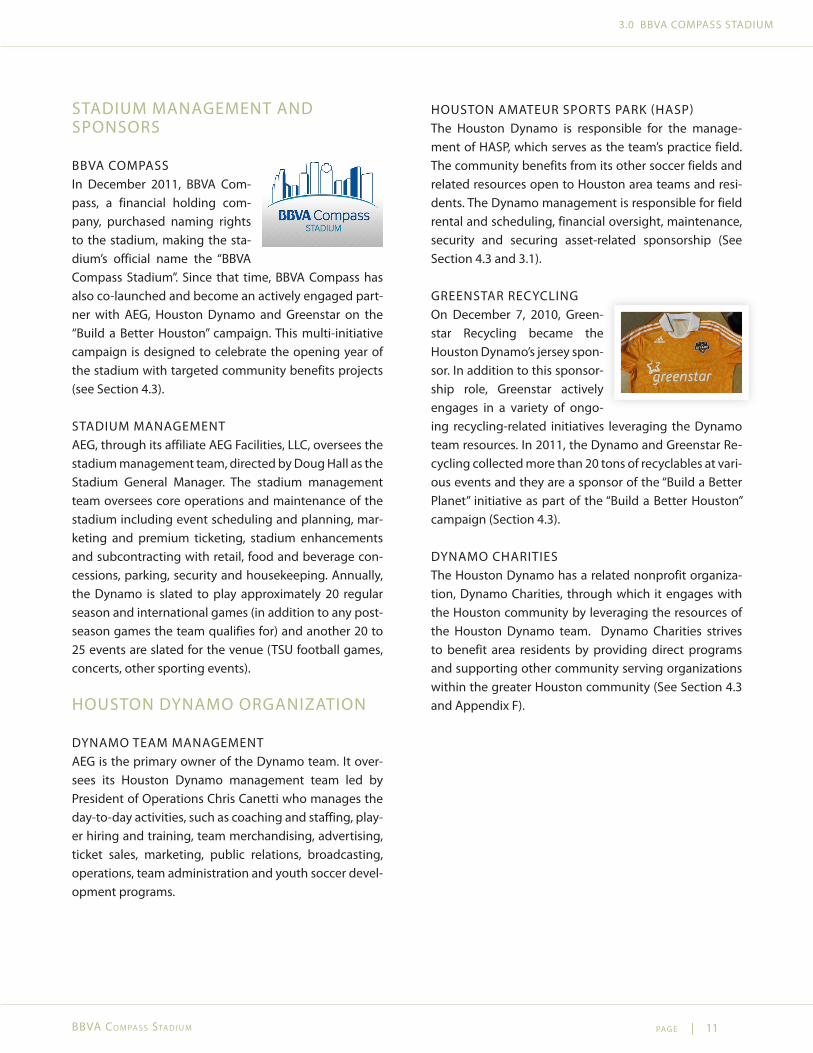
HOUSTON DYNAMO SOCCER TEAMThe Houston Dynamo is an American professional soccer club, based in Houston, Texas, that plays in Major League Soc-cer (MLS). The team was created on December 15, 2005 when the San Jose Earthquakes’ players and head coach Dominic Kinnear were relocated be-cause its owners were unable to secure a soccer-specific stadium for the team in that region. According to former team president Oliver Luck, “Dynamo” was chosen as a reference to an energy source and in tribute to the city’s outgoing spirit and ties to energy. Since moving to Hous-ton, the club has played its home games at Robertson Stadium on the University of Houston campus. The team quickly found success; during its first two seasons in 2006 and 2007, the Dynamo won the MLS Championship Cup. With the completion of the new stadium, the Dynamo moved into its new home–now called BBVA Compass Stadium–on May 12th, 2012.
TEAM AND STADIUM OWNERSThe team is owned by Dynamo Soccer, LLC, which is owned by majority member AEG, Brener International Group (headed by Gabriel Brener) and Golden Boy Pro-motions (owned by world and Olympic boxing cham-pion Oscar De La Hoya).
ANSCHUTZ ENTERTAINMENT GROUPAEG is the managing partner in the ownership structure man-agement team. AEG has ac-quired or merged more than 100 divisions and companies whose alliances create a global live entertainment organization capable of developing, producing, promoting, market-ing, and managing sports and entertainment program-ming (See Appendix E).
GOLDEN BOY PROMOTIONSLos Angeles-based Golden Boy Promotions was established in 2002 by Olympic gold medalist Oscar de la Hoya, the first His-panic to own a national boxing promotional company. Golden Boy Promotions is one of boxing’s most active and re-spected promoters, presenting shows nationally and internationally on networks such as HBO, HBO Latino, TeleFutura, Showtime, ESPN2 and Fox Sports Net. Golden Boy Promotions currently has over 60 fighters under con-tract, from future hall of famers to current world champi-ons, top contenders, as well as highly regarded prospects in the sport.
BRENER GROUPBrener International Group, LLC is a Los Angeles-based private investment firm and family of-fice with global business and investment interests. Brener’s current investments comprise holdings in private companies (including Golden Boy Promotions), publicly traded com-panies, and other ventures. Brener acquires and builds ownership stakes in established, well-managed com-panies with solid market positions and strong growth potential. It focuses its direct investments in businesses directed to U.S. Hispanics, sports and entertainment, consumer products and real estate.
pag e | 11
3.0 BBVA COMPASS STADIUM
BBVa Co m pa ss sta d i u m
STADIUM MANAGEMENT AND SPONSORS
BBVA COMPASSIn December 2011, BBVA Com-pass, a financial holding com-pany, purchased naming rights to the stadium, making the sta-dium’s official name the “BBVA Compass Stadium”. Since that time, BBVA Compass has also co-launched and become an actively engaged part-ner with AEG, Houston Dynamo and Greenstar on the “Build a Better Houston” campaign. This multi-initiative campaign is designed to celebrate the opening year of the stadium with targeted community benefits projects (see Section 4.3).
STADIUM MANAGEMENTAEG, through its affiliate AEG Facilities, LLC, oversees the stadium management team, directed by Doug Hall as the Stadium General Manager. The stadium management team oversees core operations and maintenance of the stadium including event scheduling and planning, mar-keting and premium ticketing, stadium enhancements and subcontracting with retail, food and beverage con-cessions, parking, security and housekeeping. Annually, the Dynamo is slated to play approximately 20 regular season and international games (in addition to any post-season games the team qualifies for) and another 20 to 25 events are slated for the venue (TSU football games, concerts, other sporting events).
HOUSTON DYNAMO ORGANIZATION
DYNAMO TEAM MANAGEMENTAEG is the primary owner of the Dynamo team. It over-sees its Houston Dynamo management team led by President of Operations Chris Canetti who manages the day-to-day activities, such as coaching and staffing, play-er hiring and training, team merchandising, advertising, ticket sales, marketing, public relations, broadcasting, operations, team administration and youth soccer devel-opment programs.
HOUSTON AMATEUR SPORTS PARK (HASP)The Houston Dynamo is responsible for the manage-ment of HASP, which serves as the team’s practice field. The community benefits from its other soccer fields and related resources open to Houston area teams and resi-dents. The Dynamo management is responsible for field rental and scheduling, financial oversight, maintenance, security and securing asset-related sponsorship (See Section 4.3 and 3.1).
GREENSTAR RECYCLINGOn December 7, 2010, Green-star Recycling became the Houston Dynamo’s jersey spon-sor. In addition to this sponsor-ship role, Greenstar actively engages in a variety of ongo-ing recycling-related initiatives leveraging the Dynamo team resources. In 2011, the Dynamo and Greenstar Re-cycling collected more than 20 tons of recyclables at vari-ous events and they are a sponsor of the “Build a Better Planet” initiative as part of the “Build a Better Houston” campaign (Section 4.3).
DYNAMO CHARITIESThe Houston Dynamo has a related nonprofit organiza-tion, Dynamo Charities, through which it engages with the Houston community by leveraging the resources of the Houston Dynamo team. Dynamo Charities strives to benefit area residents by providing direct programs and supporting other community serving organizations within the greater Houston community (See Section 4.3 and Appendix F).
pag e | 12
3.0 BBVA COMPASS STADIUM
BBVa Co m pa ss sta d i u m
3.3 PROJECT GENESIS
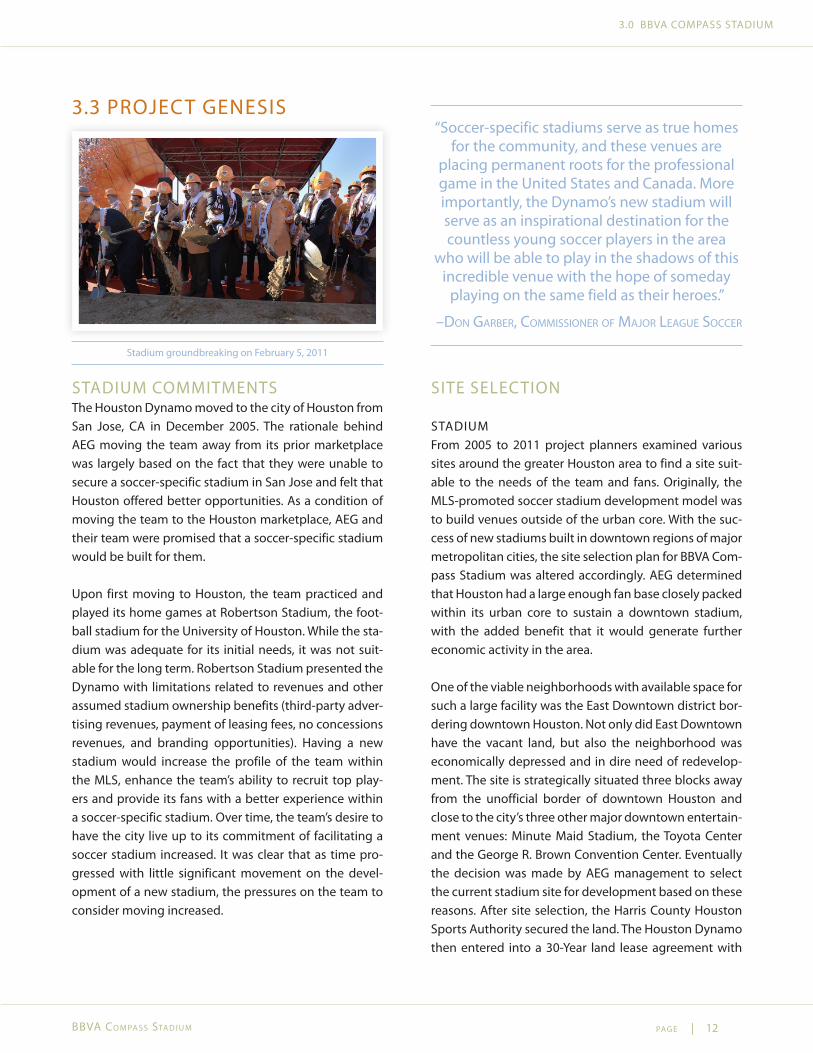
Stadium groundbreaking on February 5, 2011
STADIUM COMMITMENTSThe Houston Dynamo moved to the city of Houston from San Jose, CA in December 2005. The rationale behind AEG moving the team away from its prior marketplace was largely based on the fact that they were unable to secure a soccer-specific stadium in San Jose and felt that Houston offered better opportunities. As a condition of moving the team to the Houston marketplace, AEG and their team were promised that a soccer-specific stadium would be built for them.
Upon first moving to Houston, the team practiced and played its home games at Robertson Stadium, the foot-ball stadium for the University of Houston. While the sta-dium was adequate for its initial needs, it was not suit-able for the long term. Robertson Stadium presented the Dynamo with limitations related to revenues and other assumed stadium ownership benefits (third-party adver-tising revenues, payment of leasing fees, no concessions revenues, and branding opportunities). Having a new stadium would increase the profile of the team within the MLS, enhance the team’s ability to recruit top play-ers and provide its fans with a better experience within a soccer-specific stadium. Over time, the team’s desire to have the city live up to its commitment of facilitating a soccer stadium increased. It was clear that as time pro-gressed with little significant movement on the devel-opment of a new stadium, the pressures on the team to consider moving increased.
“Soccer-specific stadiums serve as true homes for the community, and these venues are
placing permanent roots for the professional game in the United States and Canada. More importantly, the Dynamo’s new stadium will serve as an inspirational destination for the countless young soccer players in the area
who will be able to play in the shadows of this incredible venue with the hope of someday
playing on the same field as their heroes.”
–don garBer, Commissioner of major League soCCer
SITE SELECTION
STADIUMFrom 2005 to 2011 project planners examined various sites around the greater Houston area to find a site suit-able to the needs of the team and fans. Originally, the MLS-promoted soccer stadium development model was to build venues outside of the urban core. With the suc-cess of new stadiums built in downtown regions of major metropolitan cities, the site selection plan for BBVA Com-pass Stadium was altered accordingly. AEG determined that Houston had a large enough fan base closely packed within its urban core to sustain a downtown stadium, with the added benefit that it would generate further economic activity in the area.
One of the viable neighborhoods with available space for such a large facility was the East Downtown district bor-dering downtown Houston. Not only did East Downtown have the vacant land, but also the neighborhood was economically depressed and in dire need of redevelop-ment. The site is strategically situated three blocks away from the unofficial border of downtown Houston and close to the city’s three other major downtown entertain-ment venues: Minute Maid Stadium, the Toyota Center and the George R. Brown Convention Center. Eventually the decision was made by AEG management to select the current stadium site for development based on these reasons. After site selection, the Harris County Houston Sports Authority secured the land. The Houston Dynamo then entered into a 30-Year land lease agreement with
pag e | 13
3.0 BBVA COMPASS STADIUM
BBVa Co m pa ss sta d i u m
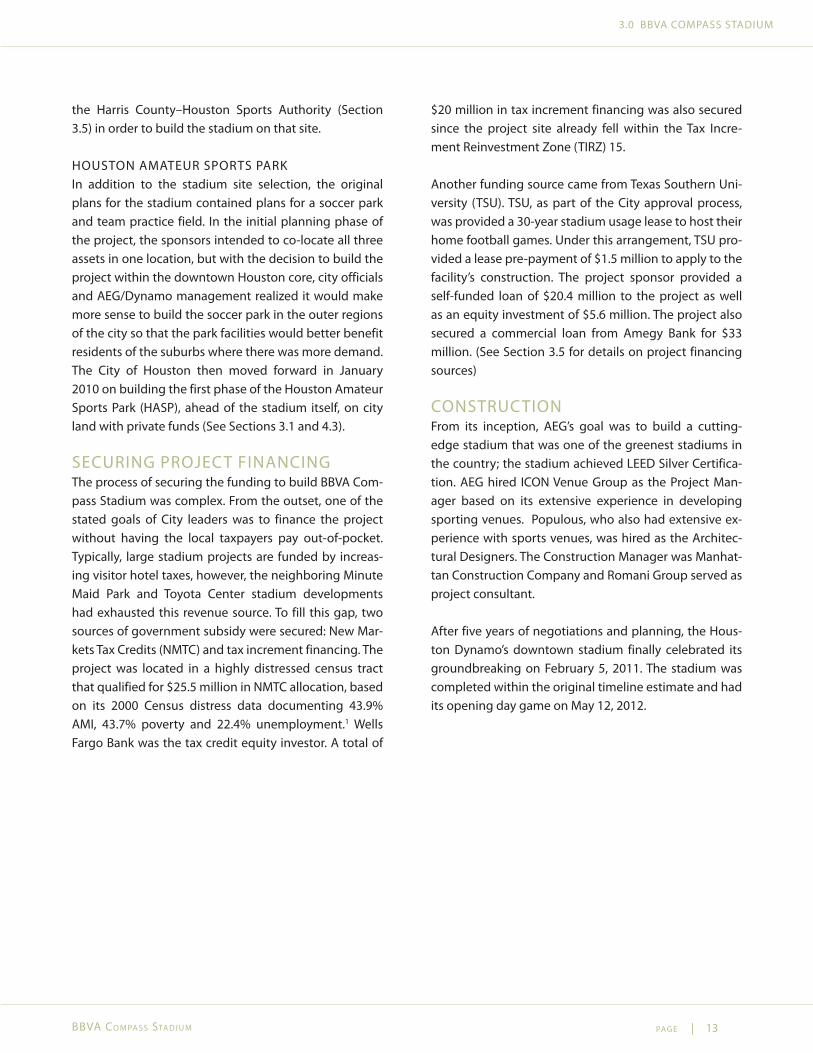
the Harris County–Houston Sports Authority (Section 3.5) in order to build the stadium on that site.
HOUSTON AMATEUR SPORTS PARK In addition to the stadium site selection, the original plans for the stadium contained plans for a soccer park and team practice field. In the initial planning phase of the project, the sponsors intended to co-locate all three assets in one location, but with the decision to build the project within the downtown Houston core, city officials and AEG/Dynamo management realized it would make more sense to build the soccer park in the outer regions of the city so that the park facilities would better benefit residents of the suburbs where there was more demand. The City of Houston then moved forward in January 2010 on building the first phase of the Houston Amateur Sports Park (HASP), ahead of the stadium itself, on city land with private funds (See Sections 3.1 and 4.3).
SECURING PROJECT FINANCINGThe process of securing the funding to build BBVA Com-pass Stadium was complex. From the outset, one of the stated goals of City leaders was to finance the project without having the local taxpayers pay out-of-pocket. Typically, large stadium projects are funded by increas-ing visitor hotel taxes, however, the neighboring Minute Maid Park and Toyota Center stadium developments had exhausted this revenue source. To fill this gap, two sources of government subsidy were secured: New Mar-kets Tax Credits (NMTC) and tax increment financing. The project was located in a highly distressed census tract that qualified for $25.5 million in NMTC allocation, based on its 2000 Census distress data documenting 43.9% AMI, 43.7% poverty and 22.4% unemployment.1 Wells Fargo Bank was the tax credit equity investor. A total of
$20 million in tax increment financing was also secured since the project site already fell within the Tax Incre-ment Reinvestment Zone (TIRZ) 15.
Another funding source came from Texas Southern Uni-versity (TSU). TSU, as part of the City approval process, was provided a 30-year stadium usage lease to host their home football games. Under this arrangement, TSU pro-vided a lease pre-payment of $1.5 million to apply to the facility’s construction. The project sponsor provided a self-funded loan of $20.4 million to the project as well as an equity investment of $5.6 million. The project also secured a commercial loan from Amegy Bank for $33 million. (See Section 3.5 for details on project financing sources)
CONSTRUCTIONFrom its inception, AEG’s goal was to build a cutting-edge stadium that was one of the greenest stadiums in the country; the stadium achieved LEED Silver Certifica-tion. AEG hired ICON Venue Group as the Project Man-ager based on its extensive experience in developing sporting venues. Populous, who also had extensive ex-perience with sports venues, was hired as the Architec-tural Designers. The Construction Manager was Manhat-tan Construction Company and Romani Group served as project consultant.
After five years of negotiations and planning, the Hous-ton Dynamo’s downtown stadium finally celebrated its groundbreaking on February 5, 2011. The stadium was completed within the original timeline estimate and had its opening day game on May 12, 2012.
pag e | 14
3.0 BBVA COMPASS STADIUM
BBVa Co m pa ss sta d i u m
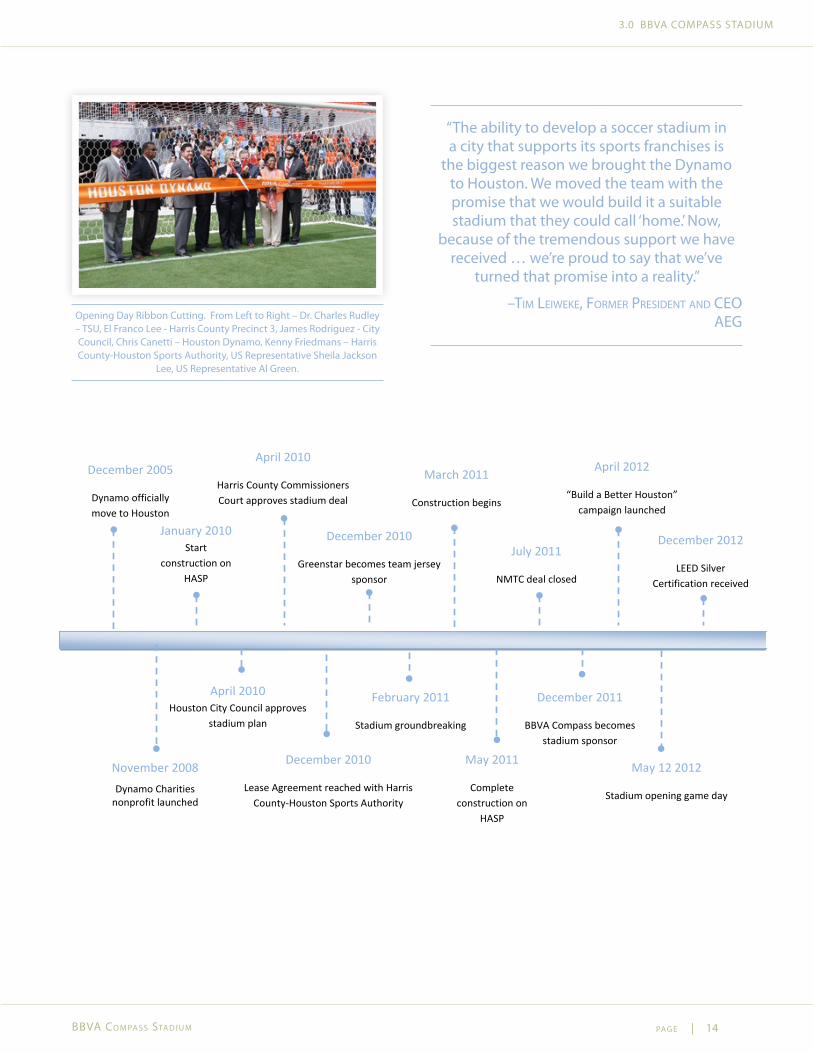
Opening Day Ribbon Cutting. From Left to Right – Dr. Charles Rudley – TSU, El Franco Lee - Harris County Precinct 3, James Rodriguez - City Council, Chris Canetti – Houston Dynamo, Kenny Friedmans – Harris County-Houston Sports Authority, US Representative Sheila Jackson
Lee, US Representative Al Green.
“The ability to develop a soccer stadium in a city that supports its sports franchises is
the biggest reason we brought the Dynamo to Houston. We moved the team with the promise that we would build it a suitable stadium that they could call ‘home.’ Now,
because of the tremendous support we have received … we’re proud to say that we’ve
turned that promise into a reality.”
–tim Leiweke, former president and Ceo aeg
December 2005
Dynamo officially move to Houston
November 2008 Dynamo Charities
nonprofit launched
January 2010 Start
construction on HASP
April 2010 Houston City Council approves
stadium plan
April 2010
Harris County Commissioners Court approves stadium deal
December 2010
Lease Agreement reached with Harris County-Houston Sports Authority
December 2010
Greenstar becomes team jersey sponsor
February 2011
Stadium groundbreaking
March 2011
Construction begins
May 2011
Complete construction on
HASP
July 2011
NMTC deal closed
December 2011
BBVA Compass becomes stadium sponsor
April 2012
“Build a Better Houston” campaign launched
May 12 2012
Stadium opening game day
December 2012
LEED Silver Certification received
pag e | 15
3.0 BBVA COMPASS STADIUM
BBVa Co m pa ss sta d i u m
3.4 SITE AND AREA BACKGROUND
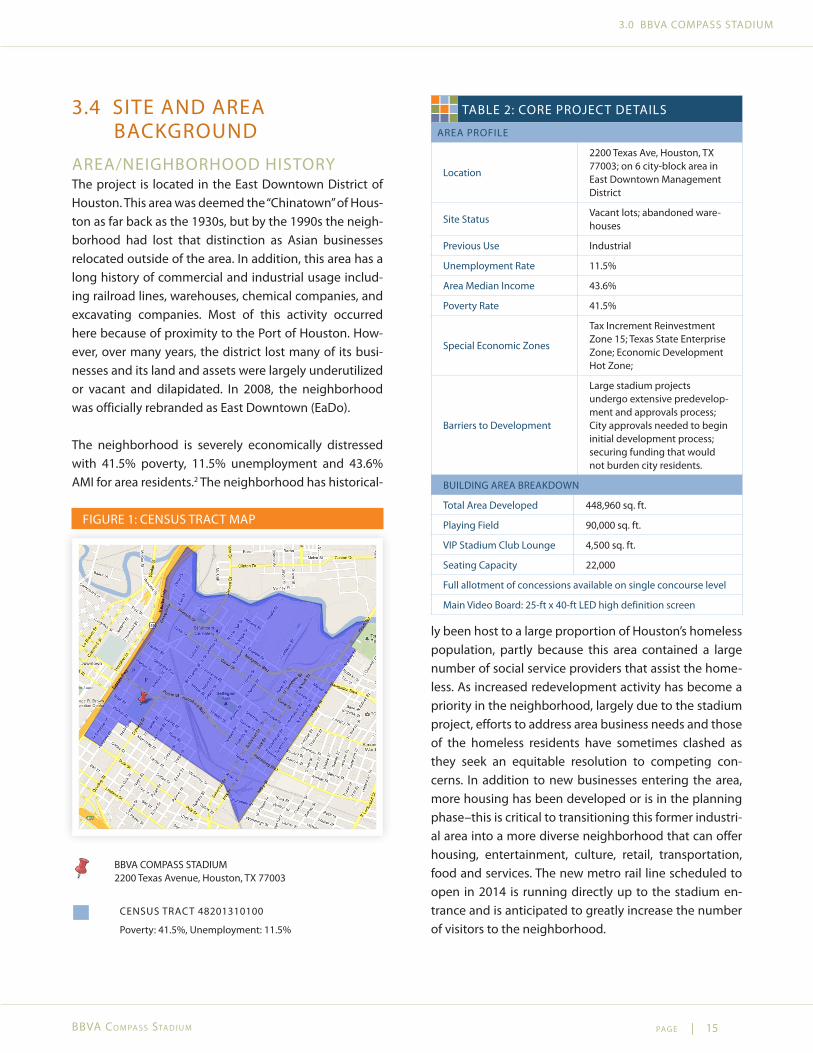
AREA/NEIGHBORHOOD HISTORYThe project is located in the East Downtown District of Houston. This area was deemed the “Chinatown” of Hous-ton as far back as the 1930s, but by the 1990s the neigh-borhood had lost that distinction as Asian businesses relocated outside of the area. In addition, this area has a long history of commercial and industrial usage includ-ing railroad lines, warehouses, chemical companies, and excavating companies. Most of this activity occurred here because of proximity to the Port of Houston. How-ever, over many years, the district lost many of its busi-nesses and its land and assets were largely underutilized or vacant and dilapidated. In 2008, the neighborhood was officially rebranded as East Downtown (EaDo).
The neighborhood is severely economically distressed with 41.5% poverty, 11.5% unemployment and 43.6% AMI for area residents.2 The neighborhood has historical-
FIGURE 1: CENSUS TRACT MAP
BBVA COMPASS STADIUM 2200 Texas Avenue, Houston, TX 77003
CENSUS TRACT 48201310100
Poverty: 41.5%, Unemployment: 11.5%
TABLE 2: CORE PROJECT DETAILS
AREA PROFILE
Location
2200 Texas Ave, Houston, TX 77003; on 6 city-block area in East Downtown Management District
Site StatusVacant lots; abandoned ware-houses
Previous Use Industrial
Unemployment Rate 11.5%
Area Median Income 43.6%
Poverty Rate 41.5%
Special Economic Zones
Tax Increment Reinvestment Zone 15; Texas State Enterprise Zone; Economic Development Hot Zone;
Barriers to Development
Large stadium projects undergo extensive predevelop-ment and approvals process; City approvals needed to begin initial development process; securing funding that would not burden city residents.
BUILDING AREA BREAKDOWN
Total Area Developed 448,960 sq. ft.
Playing Field 90,000 sq. ft.
VIP Stadium Club Lounge 4,500 sq. ft.
Seating Capacity 22,000
Full allotment of concessions available on single concourse level
Main Video Board: 25-ft x 40-ft LED high definition screen
ly been host to a large proportion of Houston’s homeless population, partly because this area contained a large number of social service providers that assist the home-less. As increased redevelopment activity has become a priority in the neighborhood, largely due to the stadium project, efforts to address area business needs and those of the homeless residents have sometimes clashed as they seek an equitable resolution to competing con-cerns. In addition to new businesses entering the area, more housing has been developed or is in the planning phase–this is critical to transitioning this former industri-al area into a more diverse neighborhood that can offer housing, entertainment, culture, retail, transportation, food and services. The new metro rail line scheduled to open in 2014 is running directly up to the stadium en-trance and is anticipated to greatly increase the number of visitors to the neighborhood.
pag e | 16
3.0 BBVA COMPASS STADIUM
BBVa Co m pa ss sta d i u m
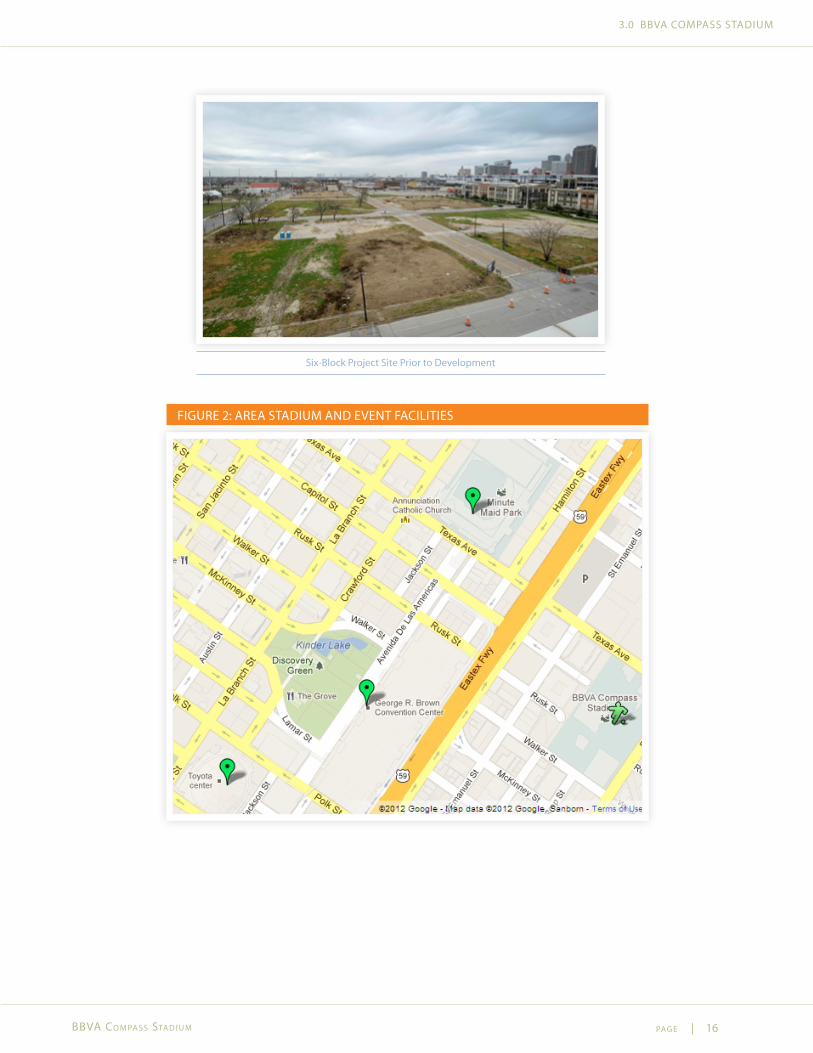
FIGURE 2: AREA STADIUM AND EVENT FACILITIES
Six-Block Project Site Prior to Development
pag e | 17
3.0 BBVA COMPASS STADIUM
BBVa Co m pa ss sta d i u m
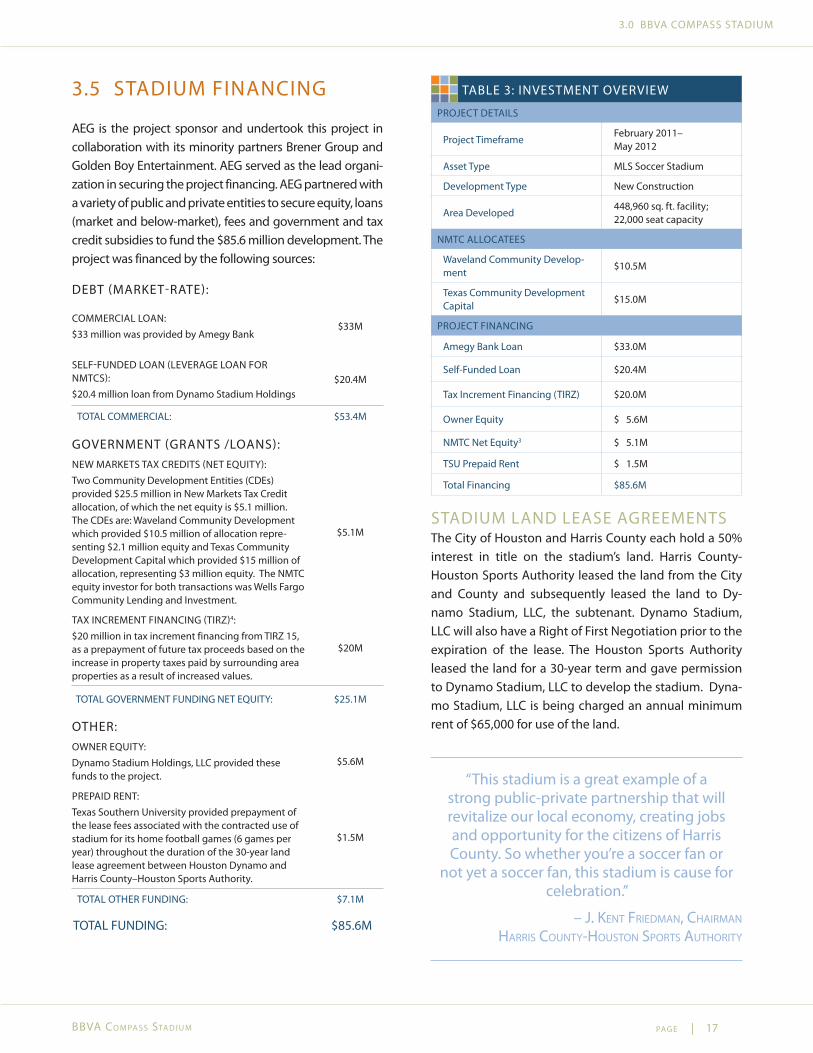
3.5 STADIUM FINANCING
AEG is the project sponsor and undertook this project in collaboration with its minority partners Brener Group and Golden Boy Entertainment. AEG served as the lead organi-zation in securing the project financing. AEG partnered with a variety of public and private entities to secure equity, loans (market and below-market), fees and government and tax credit subsidies to fund the $85.6 million development. The project was financed by the following sources:
DEBT (MARKET-RATE):
COMMERCIAL LOAN: $33 million was provided by Amegy Bank
$33M
SELF-FUNDED LOAN (LEVERAGE LOAN FOR NMTCS): $20.4 million loan from Dynamo Stadium Holdings
$20.4M
TOTAL COMMERCIAL: $53.4M
GOVERNMENT (GRANTS /LOANS):NEW MARKETS TAX CREDITS (NET EQUITY): Two Community Development Entities (CDEs) provided $25.5 million in New Markets Tax Credit allocation, of which the net equity is $5.1 million. The CDEs are: Waveland Community Development which provided $10.5 million of allocation repre-senting $2.1 million equity and Texas Community Development Capital which provided $15 million of allocation, representing $3 million equity. The NMTC equity investor for both transactions was Wells Fargo Community Lending and Investment.
$5.1M
TAX INCREMENT FINANCING (TIRZ)4:$20 million in tax increment financing from TIRZ 15, as a prepayment of future tax proceeds based on the increase in property taxes paid by surrounding area properties as a result of increased values.
$20M
TOTAL GOVERNMENT FUNDING NET EQUITY: $25.1M
OTHER:OWNER EQUITY:Dynamo Stadium Holdings, LLC provided these funds to the project.
$5.6M
PREPAID RENT:Texas Southern University provided prepayment of the lease fees associated with the contracted use of stadium for its home football games (6 games per year) throughout the duration of the 30-year land lease agreement between Houston Dynamo and Harris County–Houston Sports Authority.
$1.5M
TOTAL OTHER FUNDING: $7.1M
TOTAL FUNDING: $85.6M
TABLE 3: INVESTMENT OVERVIEW
PROJECT DETAILS
Project TimeframeFebruary 2011– May 2012
Asset Type MLS Soccer Stadium
Development Type New Construction
Area Developed448,960 sq. ft. facility; 22,000 seat capacity
NMTC ALLOCATEES
Waveland Community Develop-ment
$10.5M
Texas Community Development Capital
$15.0M
PROJECT FINANCING
Amegy Bank Loan $33.0M
Self-Funded Loan $20.4M
Tax Increment Financing (TIRZ) $20.0M
Owner Equity $ 5.6M
NMTC Net Equity3 $ 5.1M
TSU Prepaid Rent $ 1.5M
Total Financing $85.6M
STADIUM LAND LEASE AGREEMENTS The City of Houston and Harris County each hold a 50% interest in title on the stadium’s land. Harris County-Houston Sports Authority leased the land from the City and County and subsequently leased the land to Dy-namo Stadium, LLC, the subtenant. Dynamo Stadium, LLC will also have a Right of First Negotiation prior to the expiration of the lease. The Houston Sports Authority leased the land for a 30-year term and gave permission to Dynamo Stadium, LLC to develop the stadium. Dyna-mo Stadium, LLC is being charged an annual minimum rent of $65,000 for use of the land.
“This stadium is a great example of a strong public-private partnership that will revitalize our local economy, creating jobs and opportunity for the citizens of Harris County. So whether you’re a soccer fan or
not yet a soccer fan, this stadium is cause for celebration.”
– j. kent friedman, CHairman Harris County-Houston sports autHority
pag e | 18
3.0 BBVA COMPASS STADIUM
BBVa Co m pa ss sta d i u m
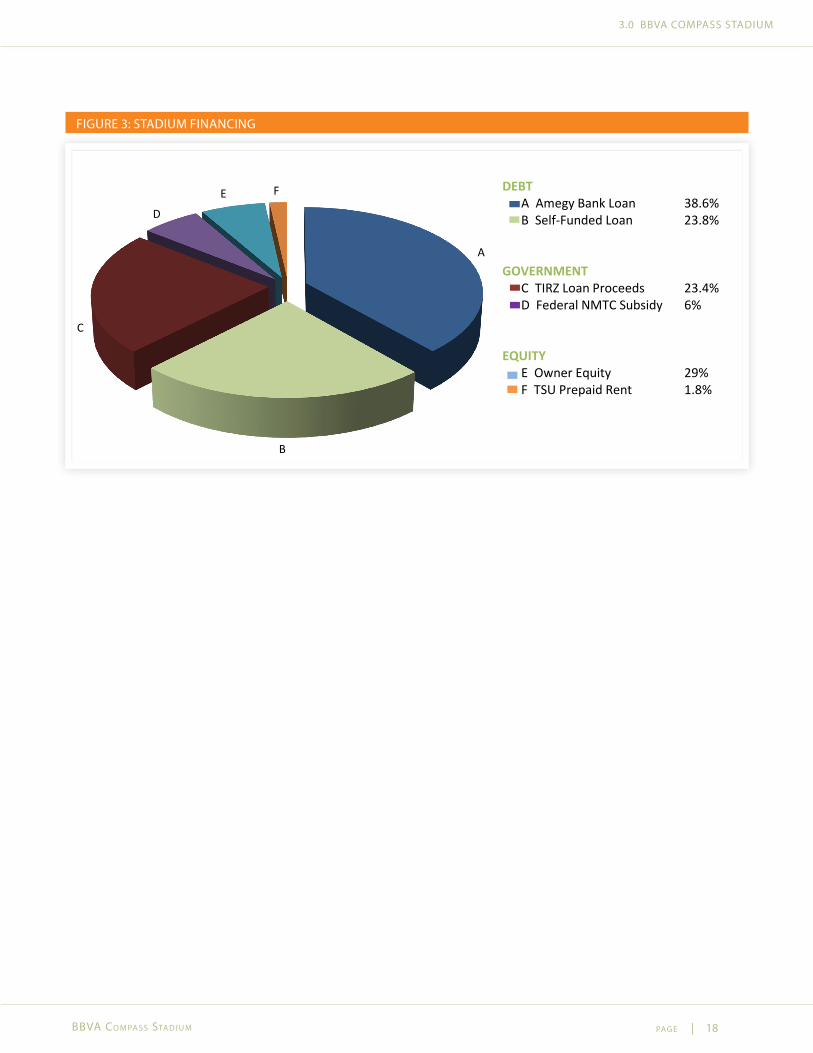
A
B
C
D
E F DEBTA Amegy Bank Loan 38.6%B Self-Funded Loan 23.8%
GOVERNMENTC TIRZ Loan Proceeds 23.4% D Federal NMTC Subsidy 6%
EQUITYE Owner Equity 29%F TSU Prepaid Rent 1.8%
FIGURE 3: STADIUM FINANCING
pag e | 19
4.0 PROJECT IMPACTS
BBVa Co m pa ss sta d i u m
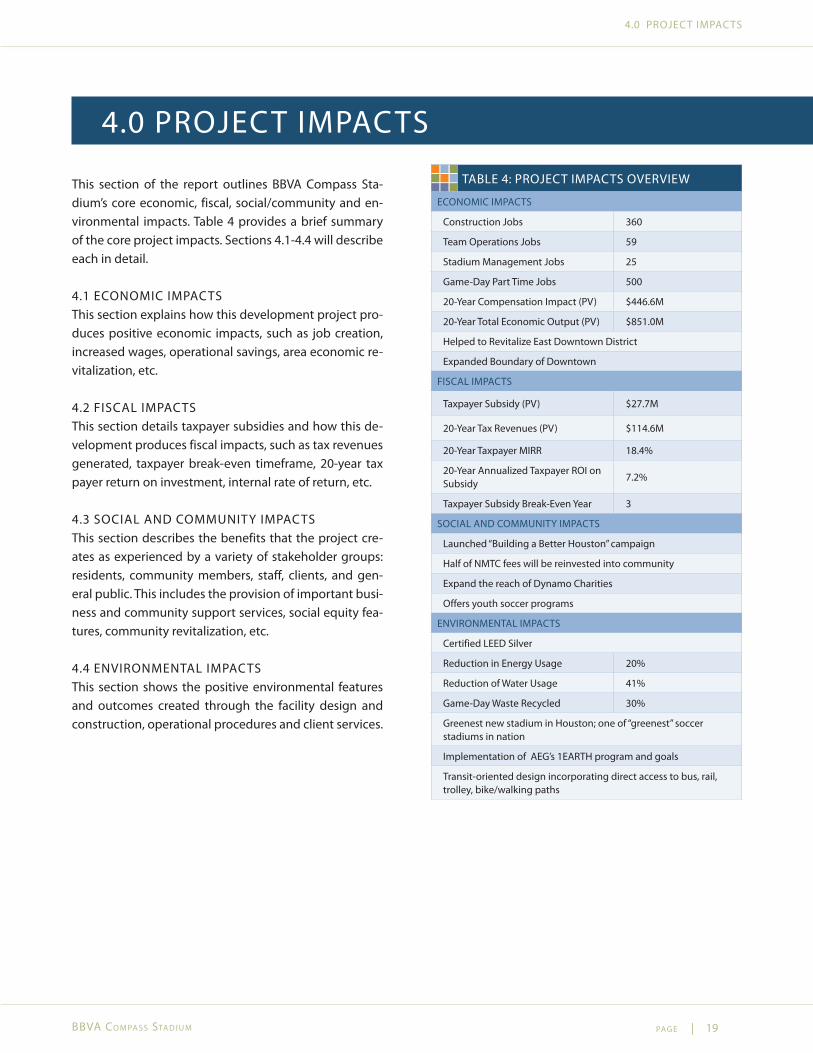
This section of the report outlines BBVA Compass Sta-dium’s core economic, fiscal, social/community and en-vironmental impacts. Table 4 provides a brief summary of the core project impacts. Sections 4.1-4.4 will describe each in detail.
4.1 ECONOMIC IMPACTSThis section explains how this development project pro-duces positive economic impacts, such as job creation, increased wages, operational savings, area economic re-vitalization, etc.
4.2 FISCAL IMPACTSThis section details taxpayer subsidies and how this de-velopment produces fiscal impacts, such as tax revenues generated, taxpayer break-even timeframe, 20-year tax payer return on investment, internal rate of return, etc.
4.3 SOCIAL AND COMMUNITY IMPACTSThis section describes the benefits that the project cre-ates as experienced by a variety of stakeholder groups: residents, community members, staff, clients, and gen-eral public. This includes the provision of important busi-ness and community support services, social equity fea-tures, community revitalization, etc.
4.4 ENVIRONMENTAL IMPACTS This section shows the positive environmental features and outcomes created through the facility design and construction, operational procedures and client services.
TABLE 4: PROJECT IMPACTS OVERVIEW
ECONOMIC IMPACTS
Construction Jobs 360
Team Operations Jobs 59
Stadium Management Jobs 25
Game-Day Part Time Jobs 500
20-Year Compensation Impact (PV) $446.6M
20-Year Total Economic Output (PV) $851.0M
Helped to Revitalize East Downtown District
Expanded Boundary of Downtown
FISCAL IMPACTS
Taxpayer Subsidy (PV) $27.7M
20-Year Tax Revenues (PV) $114.6M
20-Year Taxpayer MIRR 18.4%
20-Year Annualized Taxpayer ROI on Subsidy
7.2%
Taxpayer Subsidy Break-Even Year 3
SOCIAL AND COMMUNITY IMPACTS
Launched “Building a Better Houston” campaign
Half of NMTC fees will be reinvested into community
Expand the reach of Dynamo Charities
Offers youth soccer programs
ENVIRONMENTAL IMPACTS
Certified LEED Silver
Reduction in Energy Usage 20%
Reduction of Water Usage 41%
Game-Day Waste Recycled 30%
Greenest new stadium in Houston; one of “greenest” soccer stadiums in nation
Implementation of AEG’s 1EARTH program and goals
Transit-oriented design incorporating direct access to bus, rail, trolley, bike/walking paths
4.0 PROJECT IMPACTS
pag e | 20
4.0 PROJECT IMPACTS
BBVa Co m pa ss sta d i u m
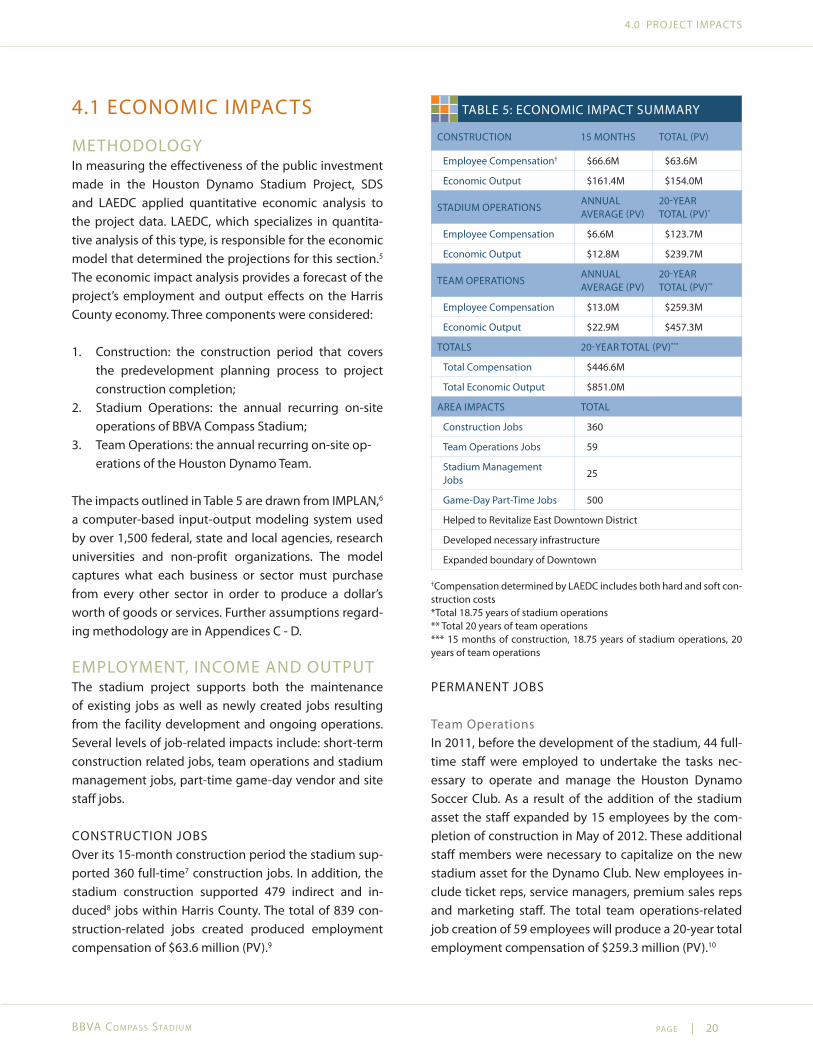
4.1 ECONOMIC IMPACTS
METHODOLOGYIn measuring the effectiveness of the public investment made in the Houston Dynamo Stadium Project, SDS and LAEDC applied quantitative economic analysis to the project data. LAEDC, which specializes in quantita-tive analysis of this type, is responsible for the economic model that determined the projections for this section.5 The economic impact analysis provides a forecast of the project’s employment and output effects on the Harris County economy. Three components were considered:
1. Construction: the construction period that covers the predevelopment planning process to project construction completion;
2. Stadium Operations: the annual recurring on-site operations of BBVA Compass Stadium;
3. Team Operations: the annual recurring on-site op-erations of the Houston Dynamo Team.
The impacts outlined in Table 5 are drawn from IMPLAN,6 a computer-based input-output modeling system used by over 1,500 federal, state and local agencies, research universities and non-profit organizations. The model captures what each business or sector must purchase from every other sector in order to produce a dollar’s worth of goods or services. Further assumptions regard-ing methodology are in Appendices C - D.
EMPLOYMENT, INCOME AND OUTPUTThe stadium project supports both the maintenance of existing jobs as well as newly created jobs resulting from the facility development and ongoing operations. Several levels of job-related impacts include: short-term construction related jobs, team operations and stadium management jobs, part-time game-day vendor and site staff jobs.
CONSTRUCTION JOBSOver its 15-month construction period the stadium sup-ported 360 full-time7 construction jobs. In addition, the stadium construction supported 479 indirect and in-duced8 jobs within Harris County. The total of 839 con-struction-related jobs created produced employment compensation of $63.6 million (PV).9
TABLE 5: ECONOMIC IMPACT SUMMARY
CONSTRUCTION 15 MONTHS TOTAL (PV)
Employee Compensation† $66.6M $63.6M
Economic Output $161.4M $154.0M
STADIUM OPERATIONSANNUAL AVERAGE (PV)
20-YEAR TOTAL (PV)*
Employee Compensation $6.6M $123.7M
Economic Output $12.8M $239.7M
TEAM OPERATIONSANNUAL AVERAGE (PV)
20-YEAR TOTAL (PV)**
Employee Compensation $13.0M $259.3M
Economic Output $22.9M $457.3M
TOTALS 20-YEAR TOTAL (PV)***
Total Compensation $446.6M
Total Economic Output $851.0M
AREA IMPACTS TOTAL
Construction Jobs 360
Team Operations Jobs 59
Stadium Management Jobs
25
Game-Day Part-Time Jobs 500
Helped to Revitalize East Downtown District
Developed necessary infrastructure
Expanded boundary of Downtown
†Compensation determined by LAEDC includes both hard and soft con-struction costs*Total 18.75 years of stadium operations** Total 20 years of team operations*** 15 months of construction, 18.75 years of stadium operations, 20 years of team operations
PERMANENT JOBS
Team OperationsIn 2011, before the development of the stadium, 44 full-time staff were employed to undertake the tasks nec-essary to operate and manage the Houston Dynamo Soccer Club. As a result of the addition of the stadium asset the staff expanded by 15 employees by the com-pletion of construction in May of 2012. These additional staff members were necessary to capitalize on the new stadium asset for the Dynamo Club. New employees in-clude ticket reps, service managers, premium sales reps and marketing staff. The total team operations-related job creation of 59 employees will produce a 20-year total employment compensation of $259.3 million (PV).10
pag e | 21
4.0 PROJECT IMPACTS
BBVa Co m pa ss sta d i u m
Stadium OperationsPrior to the development of the stadium, there was no separate business organization representing stadium management based on the fact that the team leased the Robertson Stadium for their games. The Dynamo Team Operations staff leveraged one individual to manage tasks that now fall under the newly formed Stadium Op-erations team.
BBVA Compass Stadium has contracted with AEG Facili-ties, LLC to manage the new facility. The stadium opera-tions team of 25 full-time managers oversees the opera-tions, marketing and booking of the facility. They also interface with the Dynamo and TSU to maximize the revenue streams associated with the facility. The total stadium operations-related job creation will produce a 20-year total employment compensation of $123.7 mil-lion (PV).11
Houston Dynamo’s stadium operations will also generate new part-time jobs based on the stadium vendors12 that will be operating during game days as concession work-ers, ushers, ticket takers, event security, cleaning crews, food, medical or police. The stadium operational activity supports approximately 500 part-time jobs for sold out stadium events.13
REGIONAL ECONOMIC CONTRIBUTIONBased on the jobs supported, wages paid and other economic related activities that took place during the stadium construction and operations for the team and stadium, it is clear that significant economic output14 will be contributed to Harris County over the long-term. During the 15-month construction period, the econom-ic output generated within Harris County will be $154 million (PV).15 During the operations phase, economic output from team operations will average $22.9 million (PV) annually and from stadium operations will average $12.8 million (PV) annually. Over 20-years this regional economic contribution from operations will equate to $697 million (PV). Over the 20 years of the project time-frame measured, the total economic contribution from all sources is anticipated to be $851 million (PV).
MINORITY, WOMEN AND SMALL BUSINESS CONTRACTINGThe Houston Dynamo is committed to benefiting as many Houston residents and business owners as pos-sible. During the planning phase, Houston Dynamo agreed to a Community Benefits Agreement that de-tailed threshold minority, women and small business contracting goals of 30%. Through the completion of construction, it was confirmed that 32% of all subcon-tracting contracts, based on total project costs,16 went to these types of entities: 6.4% to women-owned enter-prises, 20.2% to minority-owned enterprises and 5.4% to small-business enterprises. Through this effort a total of 58 businesses that received construction contracts quali-fied under one of these three designations. In order for a company to be certified in this process as qualifying to receive one of these designations the business also has to have an office located within the Houston city limits. Because of this requirement, it is assumed that many of these companies’ employees would be residents of the city of Houston or Harris County resulting in jobs and related wage impacts within the city and county region.
Though not contractually bound to achieve or pursue similar local hiring thresholds, the Houston Dynamo or-ganization plans to continue this overall targeted con-tracting strategy for the services needed to operate the stadium and provide its vendor services during games.
ENHANCED REVENUESThe Houston Dynamo will enjoy a much broader and en-hanced revenue stream as a result of owning and operat-ing its own stadium. The core enhancements will be:
• Enhanced Sponsorships: Prior to having its own stadi-um, the Dynamo had approximately 60 small sponsor-ships because without its own stadium asset to lever-age it was not possible to secure the larger and more lucrative sponsorships (e.g. stadium naming sponsor-ships). By packaging stadium and team assets togeth-er, the team expects to sign on with fewer partners but to larger deals.
• Ticket Sales: With a much improved and centrally lo-cated stadium, the team is able to secure more season ticket holders as well as higher overall game atten-dance and the newer venue with upgraded amenities
pag e | 22
4.0 PROJECT IMPACTS
BBVa Co m pa ss sta d i u m
supported an increase in overall ticket prices. • Premium Tickets and Services: Unlike its previous sta-dium, BBVA Compass Stadium provides box seats, pre-mium suites and other premium amenities that will generate new revenues.
• Direct Merchandising: The team will be able to have expanded direct merchandising opportunities of team-related products.
• Concessions Revenue: As owner of this facility, the Houston Dynamo will be direct recipients of a greater proportion of food and beverage sales revenues.
• Parking: As owner of this facility, the Houston Dynamo will be direct recipients of a greater proportion of park-ing revenues.
AREA DEVELOPMENT AND REVITALIZATIONThe impact of the Dynamo Stadium Project is evident from the multiple revitalization outcomes resulting throughout the neighborhood, city and broader region. The stadium’s development serves as a test of a new model of area revitalization that could benefit large cit-ies nationally. Most importantly the project has created a valuable community asset where one did not previously exist and generates much-needed city revenues. The project also spurs the enhancement of area infrastruc-ture, supports new models of economic development, expands the viable boundaries of “downtown Houston” and supports local and regional community and eco-nomic development plans.
“We believe the stadium is going to be good for the citizens of Houston, excellent for that end of downtown and it will spur economic
growth around it. It will make a really dynamic triangle with the Toyota Center, Minute Maid
Park, and now the new Dynamo stadium – with the George R. Brown Convention Center
right in the middle of the action.”
–annise parker, mayor of Houston
SUPPORTING NEW MODELS OF URBAN ECONOMIC DEVELOPMENTMetropolitan cities around the nation are always look-ing for new ways to spur economic activity within their boundaries. Sports venues, mostly football, baseball and basketball stadiums and arenas, have proven to be via-ble economic development tools. Until recently, soccer-specific stadiums have not been seen as a core economic prospect within a downtown region. However, new soc-cer stadium projects,17 including BBVA Compass Stadi-um, show that these venues can serve as an economic tool to revitalize areas and generate fiscal and economic benefits that positively impact the broader community and region.
“The city of Houston will clearly benefit from this project. From the construction workers building the stadium to the thousands of
permanent jobs at the stadium and nearby businesses, the local economy will see a
tremendous boost in all sectors. As we have seen in similar projects in other cities, the
matches, concerts and other events taking place in the stadium will bring in great benefits to the city, both in terms of money and influx of people from other cities and countries. The construction of this new stadium is a win-win
situation for everyone.”
– timotHy j. Leiweke, former president and Ceo aeg
DEVELOPMENT OF NECESSARY INFRASTRUCTUREThe development of BBVA Compass Stadium provided the impetus to add, upgrade or alter existing infrastruc-ture, transportation resources and other community asset improvement projects within the East Downtown region. Several needed infrastructure improvement proj-ects were facilitated–sewer, storm drains, street-scaping, roadway enhancements, broadband connectivity, elec-trical–because they were needed to accommodate the demands that the new stadium would place on the exist-ing or nonexistent systems.
Transportation resources were vastly improved through
pag e | 23
4.0 PROJECT IMPACTS
BBVa Co m pa ss sta d i u m
the alteration of the planned path of the new rail line in order to situate a key stop at the entrance to the stadium. In addition, planned additions of an area trolley line, en-hanced bus routes and planned developments of bike and walking paths in the surrounding neighborhoods have been undertaken or are planned, which will better serve patrons of the facility.
“I am confident that our Dynamo will continue to shine and serve as a driving force behind this area’s continued growth and progress.”
– james rodriguez, Houston City CounCiLmemBer distriCt 1
ALIGNMENT WITH AREA DEVELOPMENT PLANSThe development of BBVA Compass Stadium is consis-tent with various development plans that have existed for the City of Houston and for the East Downtown neighborhood. The city government has desired to build a stadium as a critical entertainment and economic as-set since before the Houston Dynamo came to call the city its home in 2005. This development supports the shared goals in the Greater East End Livable Centers Mas-ter Plan (2011), Five-Year Service and Improvement Plan and Assessment Plan (2007), George R. Brown Conven-tion Center 2025 Master Plan (2012), and Livable Centers Study for Houston Downtown Management District & East Downtown Management District (2011). Addition-ally, HASP, the community soccer park developed as an adjunct project to this development, is directly in line with stated needs for such facilities in the City of Houston Parks and Recreation Master Plan (2008).
The stadium project’s catalytic impact has been felt in the neighborhoods of East Downtown (EaDo) and the East End. Stadium events will bring as many as 22,000 people into the area, and it is a draw for sports fans that want to live central to the area sports arenas. Demand for hous-ing and new hotel developments surrounding the sta-dium area has increased. As the number of residents and area visitors increases, the opportunities for businesses and services to address new residents’ needs should spur increased development in the area. The executive direc-tor of EaDo discussed how the stadium could serve as a
special venue related to large convention center events, which may help to secure conventions in Houston that have the option to go elsewhere. Similarly, the bars and restaurants along St. Emmanuel Street, which form a night-time entertainment corridor adjacent to the sta-dium, will also greatly benefit from pre- and post-event traffic.
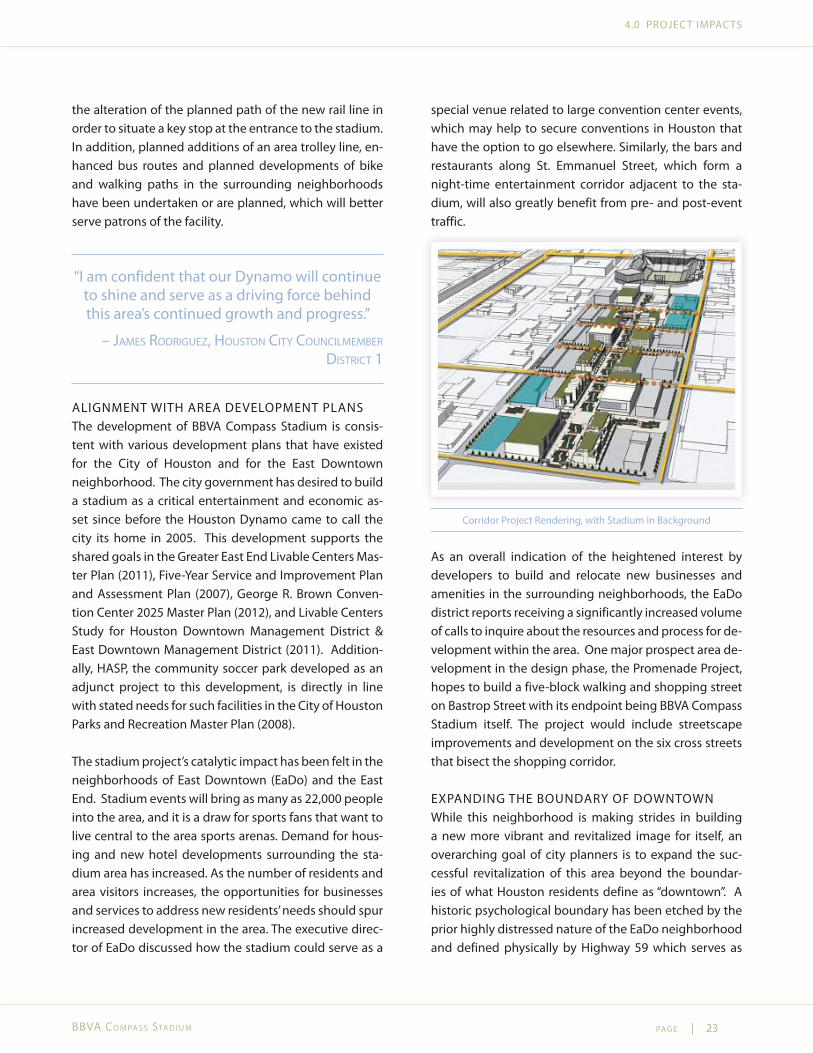
Corridor Project Rendering, with Stadium in Background
As an overall indication of the heightened interest by developers to build and relocate new businesses and amenities in the surrounding neighborhoods, the EaDo district reports receiving a significantly increased volume of calls to inquire about the resources and process for de-velopment within the area. One major prospect area de-velopment in the design phase, the Promenade Project, hopes to build a five-block walking and shopping street on Bastrop Street with its endpoint being BBVA Compass Stadium itself. The project would include streetscape improvements and development on the six cross streets that bisect the shopping corridor.
EXPANDING THE BOUNDARY OF DOWNTOWNWhile this neighborhood is making strides in building a new more vibrant and revitalized image for itself, an overarching goal of city planners is to expand the suc-cessful revitalization of this area beyond the boundar-ies of what Houston residents define as “downtown”. A historic psychological boundary has been etched by the prior highly distressed nature of the EaDo neighborhood and defined physically by Highway 59 which serves as
pag e | 24
4.0 PROJECT IMPACTS
BBVa Co m pa ss sta d i u m
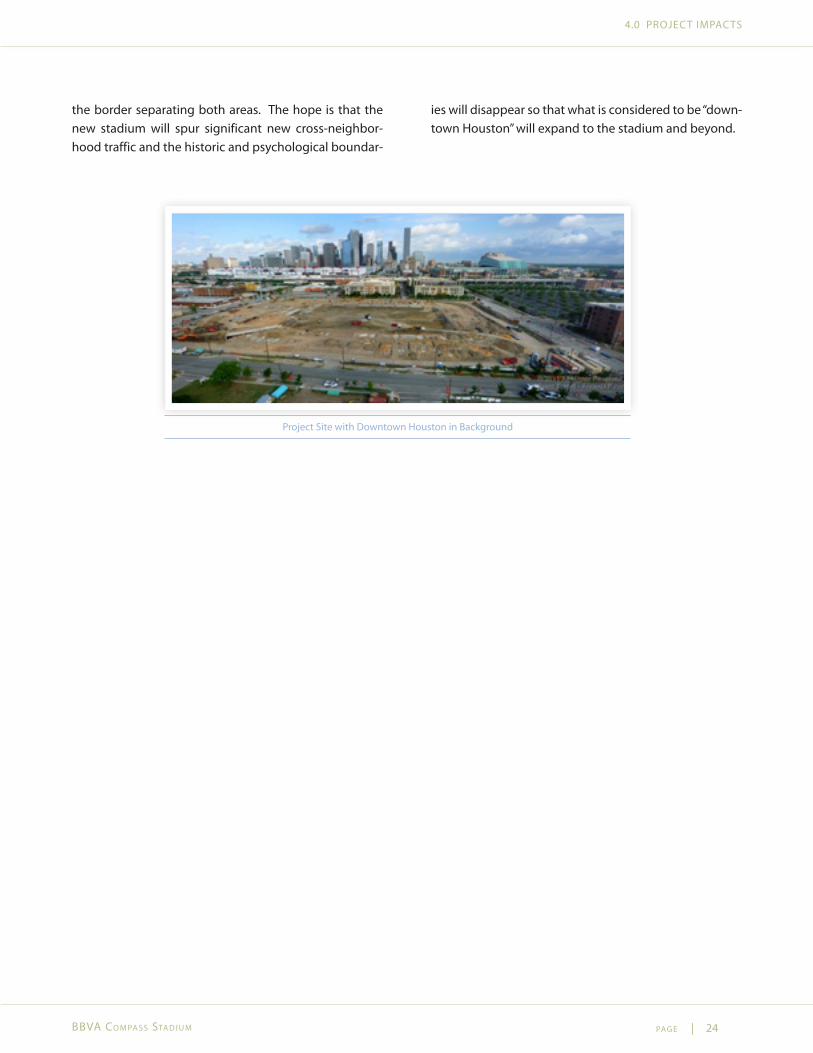
the border separating both areas. The hope is that the new stadium will spur significant new cross-neighbor-hood traffic and the historic and psychological boundar-
ies will disappear so that what is considered to be “down-town Houston” will expand to the stadium and beyond.
Project Site with Downtown Houston in Background
pag e | 25
4.0 PROJECT IMPACTS
BBVa Co m pa ss sta d i u m
4.2 FISCAL IMPACTS
TAXPAYER RETURN ON GOVERNMENT INVESTMENTThe taxpayer return on the government investment sub-sidy is assessed as these dollars are fundamentally tax-payer dollars utilized to make this project possible. It is therefore important for policy makers and taxpayers to understand the projected fiscal returns from the invest-ment. It is important to note that this analysis does not depict the project’s overall profitability or revenues; it is an analysis of the cumulative tax revenues generated over time relative to the taxpayer subsidies utilized for the project.
METHODOLOGYThe fiscal impact analysis establishes the payback period for the public-sector investment (subsidy) in the Hous-ton Dynamo Stadium Project.18 There are three tax-gen-erating components analyzed:1. Construction: the tax revenues generated during the
construction period;2. Stadium Operations: the tax revenues resulting from
the recurring annual on-site operations of BBVA Compass Stadium;
3. Team Operations: the tax revenues resulting from the recurring annual on-site operations of the Hous-ton Dynamo Team operations.
Three levels of government were accounted for in deter-mining the “cumulative tax revenue” projections used for this analysis: federal, state and city. The 20-year present value (PV)19 of the cumulative tax revenues are then com-pared to the taxpayer invested subsidy into the project. Further assumptions regarding methodology are in Ap-pendix C.
DISCLAIMER: The projections are based on the level of activity antici-pated at the time this analysis was undertaken. There is no guarantee this level of revenue generation will be met as tax policies do change and the activity on the site over the 20 years projected may be more or less than anticipated.
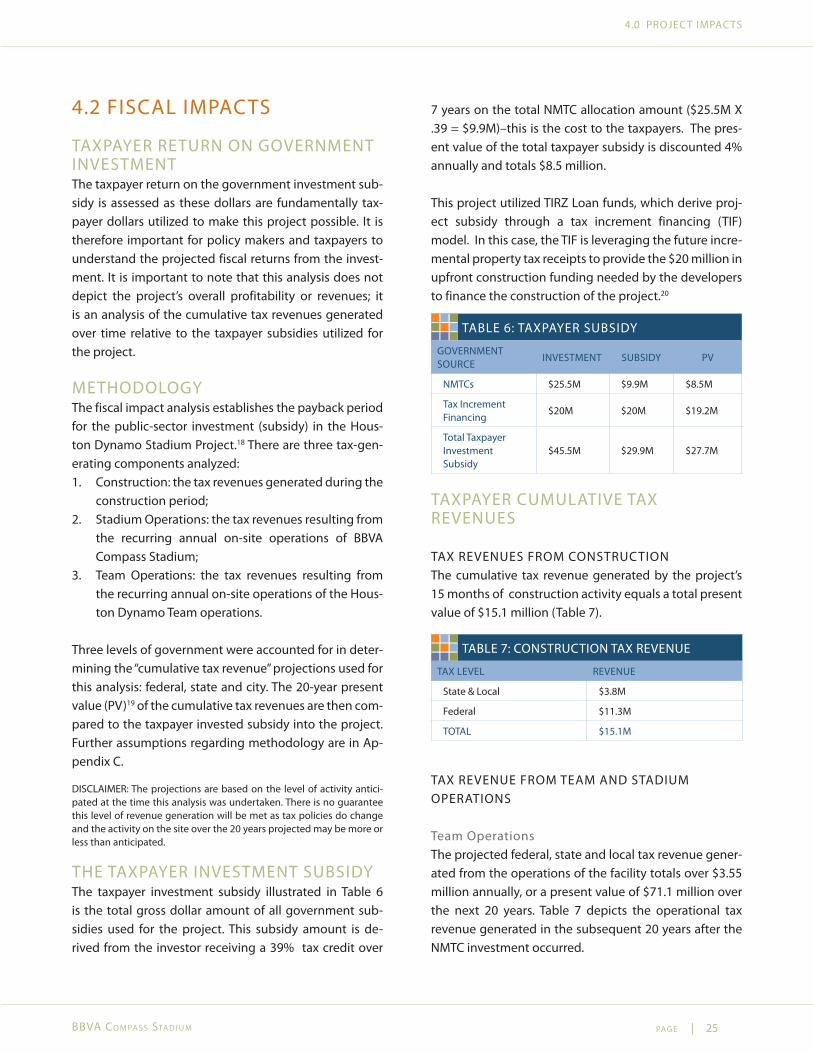
THE TAXPAYER INVESTMENT SUBSIDYThe taxpayer investment subsidy illustrated in Table 6 is the total gross dollar amount of all government sub-sidies used for the project. This subsidy amount is de-rived from the investor receiving a 39% tax credit over
7 years on the total NMTC allocation amount ($25.5M X .39 = $9.9M)–this is the cost to the taxpayers. The pres-ent value of the total taxpayer subsidy is discounted 4% annually and totals $8.5 million.
This project utilized TIRZ Loan funds, which derive proj-ect subsidy through a tax increment financing (TIF) model. In this case, the TIF is leveraging the future incre-mental property tax receipts to provide the $20 million in upfront construction funding needed by the developers to finance the construction of the project.20
TABLE 6: TAXPAYER SUBSIDY
GOVERNMENT SOURCE
INVESTMENT SUBSIDY PV
NMTCs $25.5M $9.9M $8.5M
Tax Increment Financing
$20M $20M $19.2M
Total Taxpayer Investment Subsidy
$45.5M $29.9M $27.7M
TAXPAYER CUMULATIVE TAX REVENUES
TAX REVENUES FROM CONSTRUCTIONThe cumulative tax revenue generated by the project’s 15 months of construction activity equals a total present value of $15.1 million (Table 7).
TABLE 7: CONSTRUCTION TAX REVENUE
TAX LEVEL REVENUE
State & Local $3.8M
Federal $11.3M
TOTAL $15.1M
TAX REVENUE FROM TEAM AND STADIUM OPERATIONS
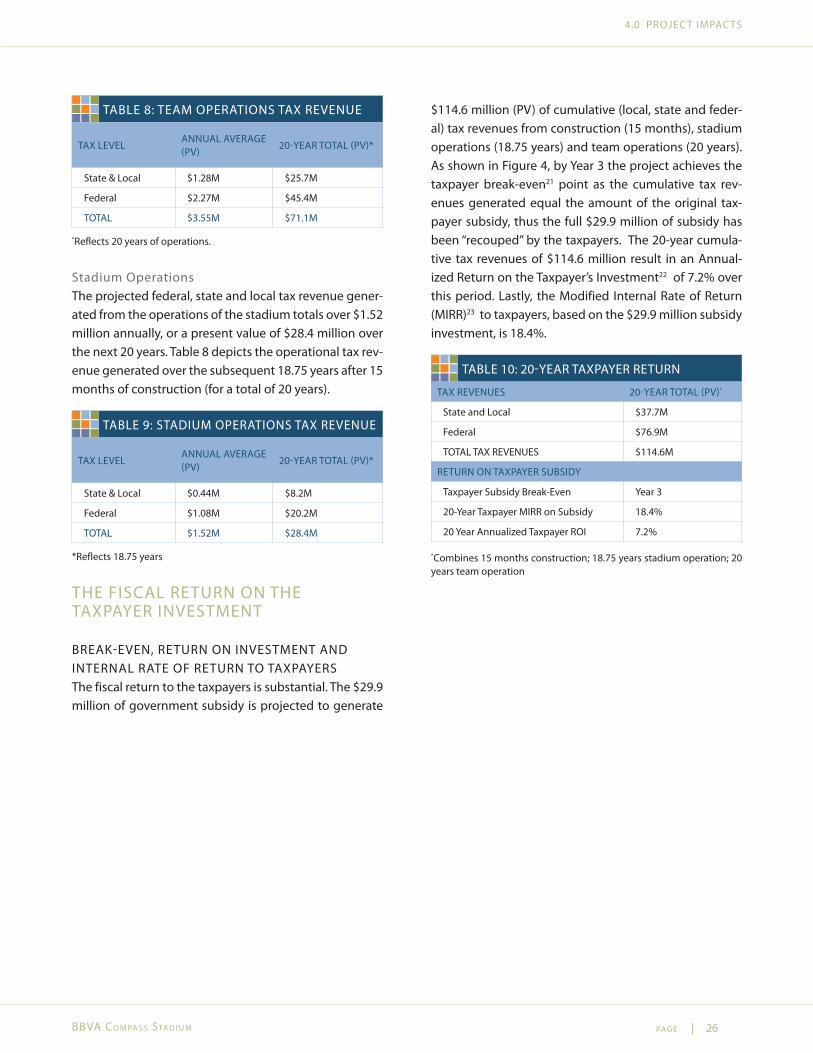
Team OperationsThe projected federal, state and local tax revenue gener-ated from the operations of the facility totals over $3.55 million annually, or a present value of $71.1 million over the next 20 years. Table 7 depicts the operational tax revenue generated in the subsequent 20 years after the NMTC investment occurred.
pag e | 26
4.0 PROJECT IMPACTS
BBVa Co m pa ss sta d i u m
TABLE 8: TEAM OPERATIONS TAX REVENUE
TAX LEVELANNUAL AVERAGE (PV)
20-YEAR TOTAL (PV)*
State & Local $1.28M $25.7M
Federal $2.27M $45.4M
TOTAL $3.55M $71.1M
*Reflects 20 years of operations.
Stadium OperationsThe projected federal, state and local tax revenue gener-ated from the operations of the stadium totals over $1.52 million annually, or a present value of $28.4 million over the next 20 years. Table 8 depicts the operational tax rev-enue generated over the subsequent 18.75 years after 15 months of construction (for a total of 20 years).
TABLE 9: STADIUM OPERATIONS TAX REVENUE
TAX LEVELANNUAL AVERAGE (PV)
20-YEAR TOTAL (PV)*
State & Local $0.44M $8.2M
Federal $1.08M $20.2M
TOTAL $1.52M $28.4M
*Reflects 18.75 years
THE FISCAL RETURN ON THE TAXPAYER INVESTMENT
BREAK-EVEN, RETURN ON INVESTMENT AND INTERNAL RATE OF RETURN TO TAXPAYERSThe fiscal return to the taxpayers is substantial. The $29.9 million of government subsidy is projected to generate
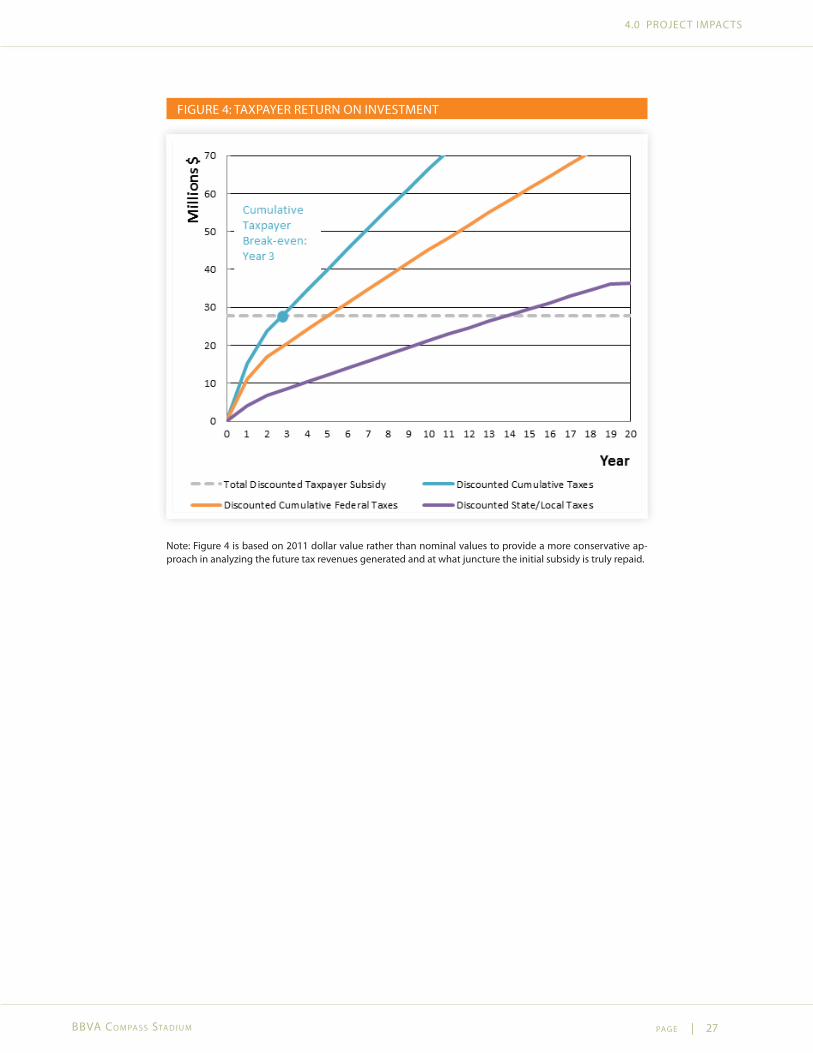
$114.6 million (PV) of cumulative (local, state and feder-al) tax revenues from construction (15 months), stadium operations (18.75 years) and team operations (20 years). As shown in Figure 4, by Year 3 the project achieves the taxpayer break-even21 point as the cumulative tax rev-enues generated equal the amount of the original tax-payer subsidy, thus the full $29.9 million of subsidy has been “recouped” by the taxpayers. The 20-year cumula-tive tax revenues of $114.6 million result in an Annual-ized Return on the Taxpayer’s Investment22 of 7.2% over this period. Lastly, the Modified Internal Rate of Return (MIRR)23 to taxpayers, based on the $29.9 million subsidy investment, is 18.4%.
TABLE 10: 20-YEAR TAXPAYER RETURN
TAX REVENUES 20-YEAR TOTAL (PV)*
State and Local $37.7M
Federal $76.9M
TOTAL TAX REVENUES $114.6M
RETURN ON TAXPAYER SUBSIDY
Taxpayer Subsidy Break-Even Year 3
20-Year Taxpayer MIRR on Subsidy 18.4%
20 Year Annualized Taxpayer ROI 7.2%
*Combines 15 months construction; 18.75 years stadium operation; 20 years team operation
pag e | 27
4.0 PROJECT IMPACTS
BBVa Co m pa ss sta d i u m
FIGURE 4: TAXPAYER RETURN ON INVESTMENT
Note: Figure 4 is based on 2011 dollar value rather than nominal values to provide a more conservative ap-proach in analyzing the future tax revenues generated and at what juncture the initial subsidy is truly repaid.
pag e | 28
4.0 PROJECT IMPACTS
BBVa Co m pa ss sta d i u m
4.3 SOCIAL AND COMMUNITY IMPACTS
EAST END NEIGHBORHOOD IMPROVEMENT Ever since it was certain that the new stadium would be built in the East Downtown neighborhood, the Dynamo team members, staff and management have become actively involved in efforts to improve the East End, the cluster of neighborhoods, including East Downtown, surrounding the proposed stadium. These community improvement projects have included activities such as graffiti cleanup, homebuilding, tree planting and other community beautification initiatives.
“BUILDING A BET TER HOUSTON” CAMPAIGN
Build a Better Mind Initiative: Dynamo players read to students at The Rusk School
On December 14, 2011, BBVA Compass (BBVA) became the stadium’s corporate sponsor, securing naming rights to the new stadium–BBVA Compass Stadium. This began a long-term partnership between BBVA and the Hous-ton Dynamo team, management, owners and fans. As part of this partnership, BBVA and the Dynamo launched a multi-faceted community improvement campaign, called “Building a Better Houston”, targeting the East Downtown neighborhood where the stadium is located. This campaign focuses on four activity areas:
• Build a Better Body: This program began May 6, 2012 with the third annual Go for Goal 5K and 1K Kids Fun Run events. In addition, there were soccer drills, ob-stacle courses, game station and a Children’s Museum activity area, as well as healthy eating tips, sports safe-ty and injury information, including the latest informa-tion regarding concussion awareness.
TABLE 11: SOCIAL IMPACTS
Launched “Building a Better Houston” campaign
Half of NMTC fees will be reinvested into community
Expands and maintains the reach of Dynamo Charities
Offers youth soccer programs
Houston Amateur Sports Park allows more youth to play soccer
Provides revenue source for Texas Southern University, a historically black university
• Build a Better Mind: Provides opportunities for play-ers, BBVA Compass executives, Dynamo management and employees to become active in supporting the Rusk School in the East End by offering two programs: the “Teach Children to Save” Program and the “Read-ing Counts Program” (book donations to disadvan-taged youth).
• Build a Better Planet: The Houston Dynamo, Greenstar Recycling and BBVA Compass are implementing an on-going recycling drive and special team recycling chal-lenges at the stadium and will continue to host such events prior to every home game. See Section 4.4 for overall environmental impacts.
• Build a Better Community: BBVA Compass Foundation will underwrite the revitalization of three homes that belong to underprivileged senior citizens in the East End. The “Rebuilding Together” organization selected the homes and work was completed by crews consist-ing of volunteers made up of team members, employ-ees and supporters of the Dynamo and BBVA Compass.
COMMUNITY REINVESTMENT FROM NMTC FEESAs part of the New Markets Tax Credit transaction struc-ture undertaken to finance the development of the sta-dium, both of the NMTC Allocatees involved with this project–Waveland Community Development and Texas Certified Development Company–have agreed to set aside at least 50% of their exit fees, which cumulatively total as much as $2.6 million, to be used to reinvest back into the Houston community in the form of donations and/or grants to community-serving nonprofit organi-zations and small businesses. The total amount of these fees may be reduced in response to overall investment performance. Regardless, at the end of the 7-year NMTC
pag e | 29
4.0 PROJECT IMPACTS
BBVa Co m pa ss sta d i u m
compliance period there should be a significant pool of new funds available to reinvest into the Houston area.
DYNAMO CHARITIES
Dynamo Charities has been the charitable arm of the Houston Dynamo Organization since 2008, with a mis-sion to utilize the sport of soccer and the resources of the organization for the enhancement of a higher quality of life for the people in the greater Houston area. It strives to enhance residents’ lives through its various programs and initiatives including player causes, numerous com-munity programs and fundraising and awareness build-ing campaigns.
“Dynamo Charities strives to improve the lives of kids in the Houston area and to ensure that they “Get in the Game” – whether on the field or in life. It provides funds and equipment to
allow kids to play the game, tickets for them to attend games and be inspired by their favorite
Men in Orange, and supports community organizations that serve their needs.”
– antHony noLte, CHairman dynamo CHarities
COMMUNITY PROGRAMS • Kicks for Kids/Ticket Donations: Dynamo Charities distributes Dynamo tickets to local charities so under-served children can enjoy a professional soccer game. These tickets are underwritten by Dynamo Corporate Partners and given to local children’s charities allow-ing underprivileged children an opportunity to enjoy a positive morale-building experience. 3,500 tickets were distributed in 2011.
• Direct Granting Activities: Provides direct support to area nonprofits that share common goals and through which Dynamo Charities can achieve its mission; a to-tal of $132,000 was given in 2011 to 19 organizations.
• Build a Better Houston: Campaign launched between AEG, Houston Dynamo, Dynamo Charities and BBVA Compass and other participating organizations to ben-efit the East End community surrounding the stadium.
• Compass Stadium Charity Fundraising Support: Space is being provided to nonprofit groups to support fund-raising activities during stadium events. Dynamo Char-ities will administer this program and receive a small portion of the net sales.
• Prize Pack Donations: Provides tickets and memorabil-ia to organizations benefitting Houston youth. Goods are for direct use or to be used in fundraising activities of these nonprofit organizations.
• Youth Soccer Scholarship Program: Provides tuition re-lief for low-income athletes to participate in Houston Dynamo’s Youth Soccer Programs.
PLAYER CAUSESIn any given year, several of the Dynamo team members support a specific charity campaign and leverage the re-sources of Houston Dynamo Charities and the Dynamo team. The goal of these campaigns is not only to raise awareness and funds for sponsored organizations, but also to raise awareness and offer direct support to tar-geted groups through game day recognition (Veterans and their families, breast cancer survivors, etc). In 2011 there were 6 campaigns and in 2012 there were 7 player cause campaigns. See Appendix F for a list of some of the campaigns supported by specific players. The Houston Dynamo and Dynamo Charities organizations provide pro-bono team resources, planning, logistics and game day support to make these campaigns a success.
Dynamo players volunteer their time to serve meals
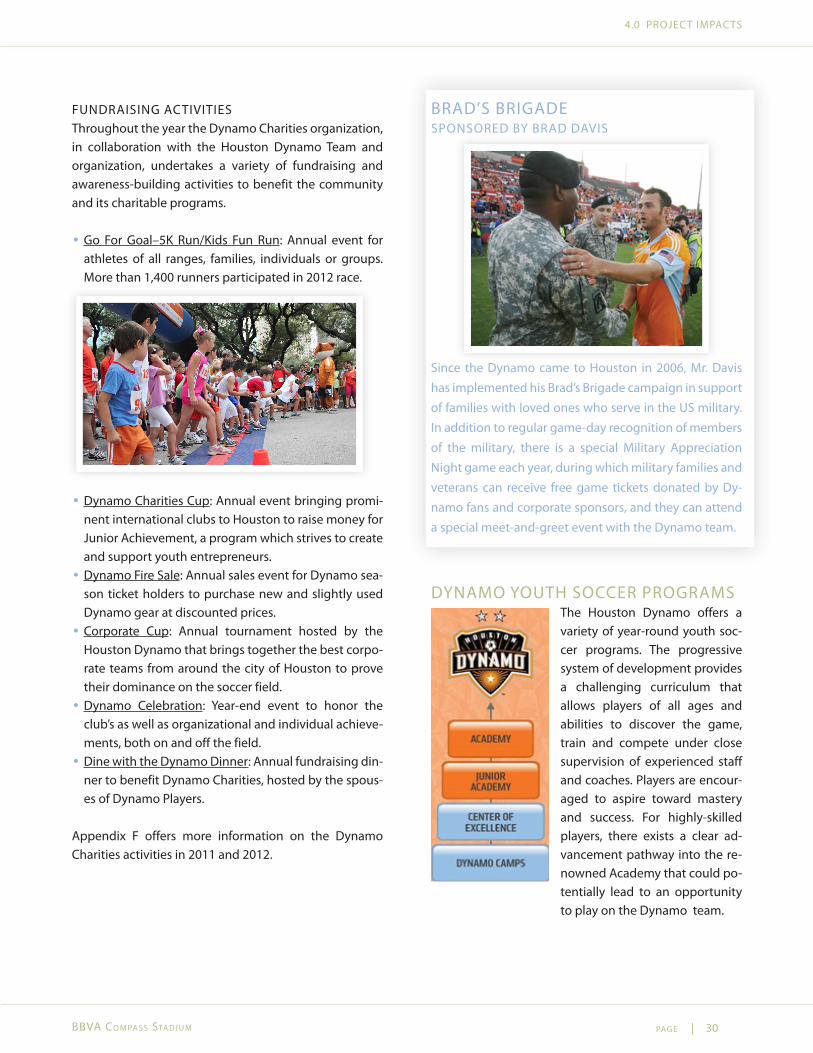
pag e | 30
4.0 PROJECT IMPACTS
BBVa Co m pa ss sta d i u m
FUNDRAISING ACTIVITIESThroughout the year the Dynamo Charities organization, in collaboration with the Houston Dynamo Team and organization, undertakes a variety of fundraising and awareness-building activities to benefit the community and its charitable programs.
• Go For Goal–5K Run/Kids Fun Run: Annual event for athletes of all ranges, families, individuals or groups. More than 1,400 runners participated in 2012 race.
• Dynamo Charities Cup: Annual event bringing promi-nent international clubs to Houston to raise money for Junior Achievement, a program which strives to create and support youth entrepreneurs.
• Dynamo Fire Sale: Annual sales event for Dynamo sea-son ticket holders to purchase new and slightly used Dynamo gear at discounted prices.
• Corporate Cup: Annual tournament hosted by the Houston Dynamo that brings together the best corpo-rate teams from around the city of Houston to prove their dominance on the soccer field.
• Dynamo Celebration: Year-end event to honor the club’s as well as organizational and individual achieve-ments, both on and off the field.
• Dine with the Dynamo Dinner: Annual fundraising din-ner to benefit Dynamo Charities, hosted by the spous-es of Dynamo Players.
Appendix F offers more information on the Dynamo Charities activities in 2011 and 2012.
BRAD’S BRIGADESPONSORED BY BRAD DAVIS
Since the Dynamo came to Houston in 2006, Mr. Davis has implemented his Brad’s Brigade campaign in support of families with loved ones who serve in the US military. In addition to regular game-day recognition of members of the military, there is a special Military Appreciation Night game each year, during which military families and veterans can receive free game tickets donated by Dy-namo fans and corporate sponsors, and they can attend a special meet-and-greet event with the Dynamo team.
DYNAMO YOUTH SOCCER PROGRAMSThe Houston Dynamo offers a variety of year-round youth soc-cer programs. The progressive system of development provides a challenging curriculum that allows players of all ages and abilities to discover the game, train and compete under close supervision of experienced staff and coaches. Players are encour-aged to aspire toward mastery and success. For highly-skilled players, there exists a clear ad-vancement pathway into the re-nowned Academy that could po-tentially lead to an opportunity to play on the Dynamo team.
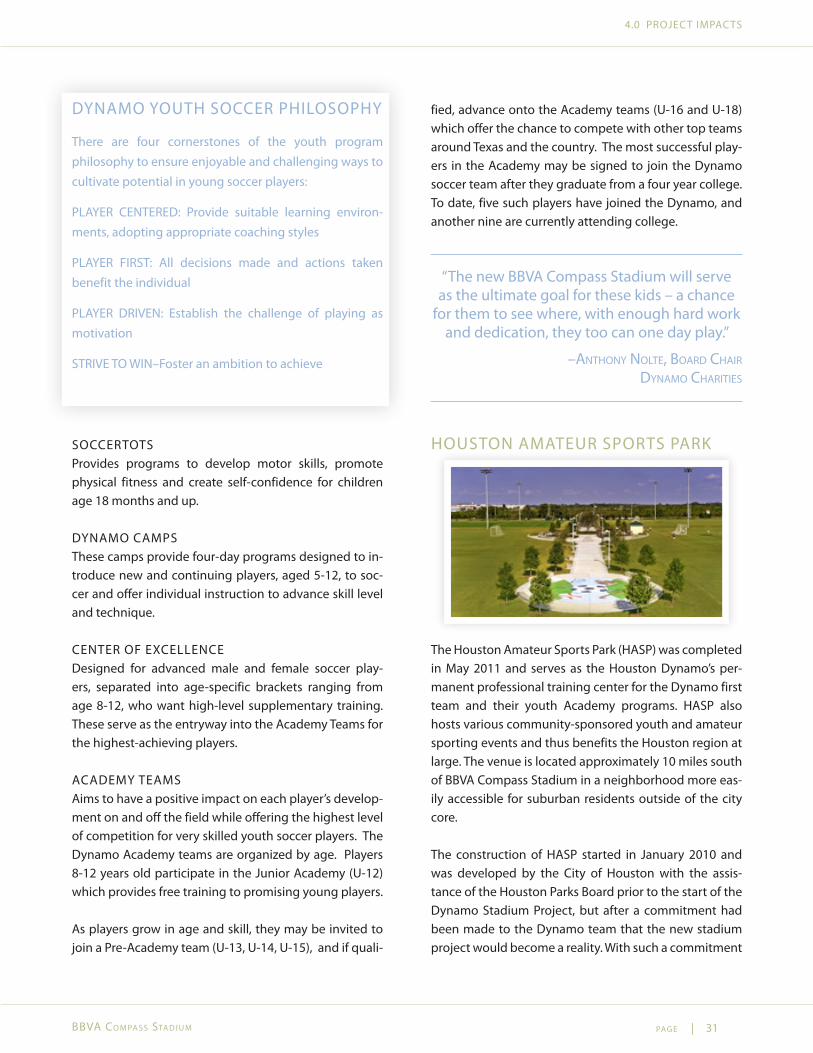
pag e | 31
4.0 PROJECT IMPACTS
BBVa Co m pa ss sta d i u m
DYNAMO YOUTH SOCCER PHILOSOPHY
There are four cornerstones of the youth program philosophy to ensure enjoyable and challenging ways to cultivate potential in young soccer players:
PLAYER CENTERED: Provide suitable learning environ-ments, adopting appropriate coaching styles
PLAYER FIRST: All decisions made and actions taken benefit the individual
PLAYER DRIVEN: Establish the challenge of playing as motivation
STRIVE TO WIN–Foster an ambition to achieve
SOCCERTOTSProvides programs to develop motor skills, promote physical fitness and create self-confidence for children age 18 months and up.
DYNAMO CAMPSThese camps provide four-day programs designed to in-troduce new and continuing players, aged 5-12, to soc-cer and offer individual instruction to advance skill level and technique.
CENTER OF EXCELLENCEDesigned for advanced male and female soccer play-ers, separated into age-specific brackets ranging from age 8-12, who want high-level supplementary training. These serve as the entryway into the Academy Teams for the highest-achieving players.
ACADEMY TEAMSAims to have a positive impact on each player’s develop-ment on and off the field while offering the highest level of competition for very skilled youth soccer players. The Dynamo Academy teams are organized by age. Players 8-12 years old participate in the Junior Academy (U-12) which provides free training to promising young players.
As players grow in age and skill, they may be invited to join a Pre-Academy team (U-13, U-14, U-15), and if quali-
fied, advance onto the Academy teams (U-16 and U-18) which offer the chance to compete with other top teams around Texas and the country. The most successful play-ers in the Academy may be signed to join the Dynamo soccer team after they graduate from a four year college. To date, five such players have joined the Dynamo, and another nine are currently attending college.
“The new BBVA Compass Stadium will serve as the ultimate goal for these kids – a chance
for them to see where, with enough hard work and dedication, they too can one day play.”
–antHony noLte, Board CHair dynamo CHarities
HOUSTON AMATEUR SPORTS PARK
The Houston Amateur Sports Park (HASP) was completed in May 2011 and serves as the Houston Dynamo’s per-manent professional training center for the Dynamo first team and their youth Academy programs. HASP also hosts various community-sponsored youth and amateur sporting events and thus benefits the Houston region at large. The venue is located approximately 10 miles south of BBVA Compass Stadium in a neighborhood more eas-ily accessible for suburban residents outside of the city core.
The construction of HASP started in January 2010 and was developed by the City of Houston with the assis-tance of the Houston Parks Board prior to the start of the Dynamo Stadium Project, but after a commitment had been made to the Dynamo team that the new stadium project would become a reality. With such a commitment
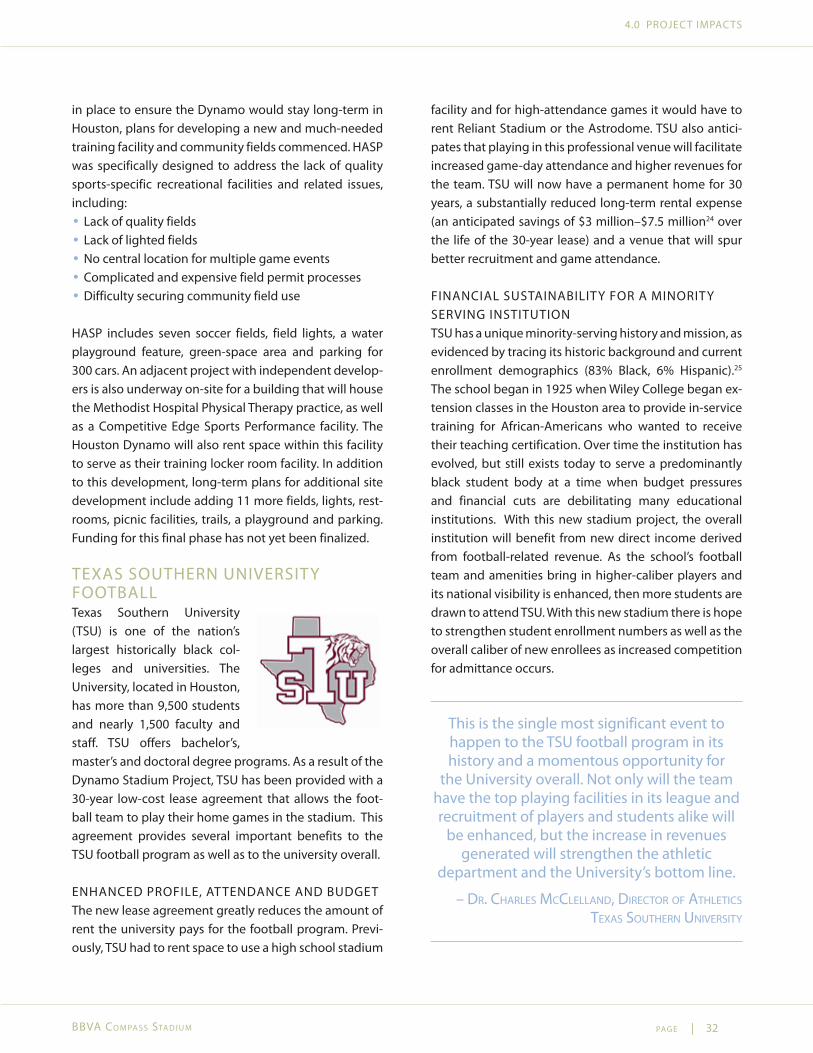
pag e | 32
4.0 PROJECT IMPACTS
BBVa Co m pa ss sta d i u m
in place to ensure the Dynamo would stay long-term in Houston, plans for developing a new and much-needed training facility and community fields commenced. HASP was specifically designed to address the lack of quality sports-specific recreational facilities and related issues, including:
• Lack of quality fields • Lack of lighted fields • No central location for multiple game events • Complicated and expensive field permit processes • Difficulty securing community field use
HASP includes seven soccer fields, field lights, a water playground feature, green-space area and parking for 300 cars. An adjacent project with independent develop-ers is also underway on-site for a building that will house the Methodist Hospital Physical Therapy practice, as well as a Competitive Edge Sports Performance facility. The Houston Dynamo will also rent space within this facility to serve as their training locker room facility. In addition to this development, long-term plans for additional site development include adding 11 more fields, lights, rest-rooms, picnic facilities, trails, a playground and parking. Funding for this final phase has not yet been finalized.
TEXAS SOUTHERN UNIVERSITY FOOTBALLTexas Southern University (TSU) is one of the nation’s largest historically black col-leges and universities. The University, located in Houston, has more than 9,500 students and nearly 1,500 faculty and staff. TSU offers bachelor’s, master’s and doctoral degree programs. As a result of the Dynamo Stadium Project, TSU has been provided with a 30-year low-cost lease agreement that allows the foot-ball team to play their home games in the stadium. This agreement provides several important benefits to the TSU football program as well as to the university overall.
ENHANCED PROFILE, AT TENDANCE AND BUDGETThe new lease agreement greatly reduces the amount of rent the university pays for the football program. Previ-ously, TSU had to rent space to use a high school stadium
facility and for high-attendance games it would have to rent Reliant Stadium or the Astrodome. TSU also antici-pates that playing in this professional venue will facilitate increased game-day attendance and higher revenues for the team. TSU will now have a permanent home for 30 years, a substantially reduced long-term rental expense (an anticipated savings of $3 million–$7.5 million24 over the life of the 30-year lease) and a venue that will spur better recruitment and game attendance.
FINANCIAL SUSTAINABILITY FOR A MINORITY SERVING INSTITUTIONTSU has a unique minority-serving history and mission, as evidenced by tracing its historic background and current enrollment demographics (83% Black, 6% Hispanic).25 The school began in 1925 when Wiley College began ex-tension classes in the Houston area to provide in-service training for African-Americans who wanted to receive their teaching certification. Over time the institution has evolved, but still exists today to serve a predominantly black student body at a time when budget pressures and financial cuts are debilitating many educational institutions. With this new stadium project, the overall institution will benefit from new direct income derived from football-related revenue. As the school’s football team and amenities bring in higher-caliber players and its national visibility is enhanced, then more students are drawn to attend TSU. With this new stadium there is hope to strengthen student enrollment numbers as well as the overall caliber of new enrollees as increased competition for admittance occurs.
This is the single most significant event to happen to the TSU football program in its history and a momentous opportunity for
the University overall. Not only will the team have the top playing facilities in its league and recruitment of players and students alike will
be enhanced, but the increase in revenues generated will strengthen the athletic
department and the University’s bottom line.
– dr. CHarLes mCCLeLLand, direCtor of atHLetiCs texas soutHern uniVersity
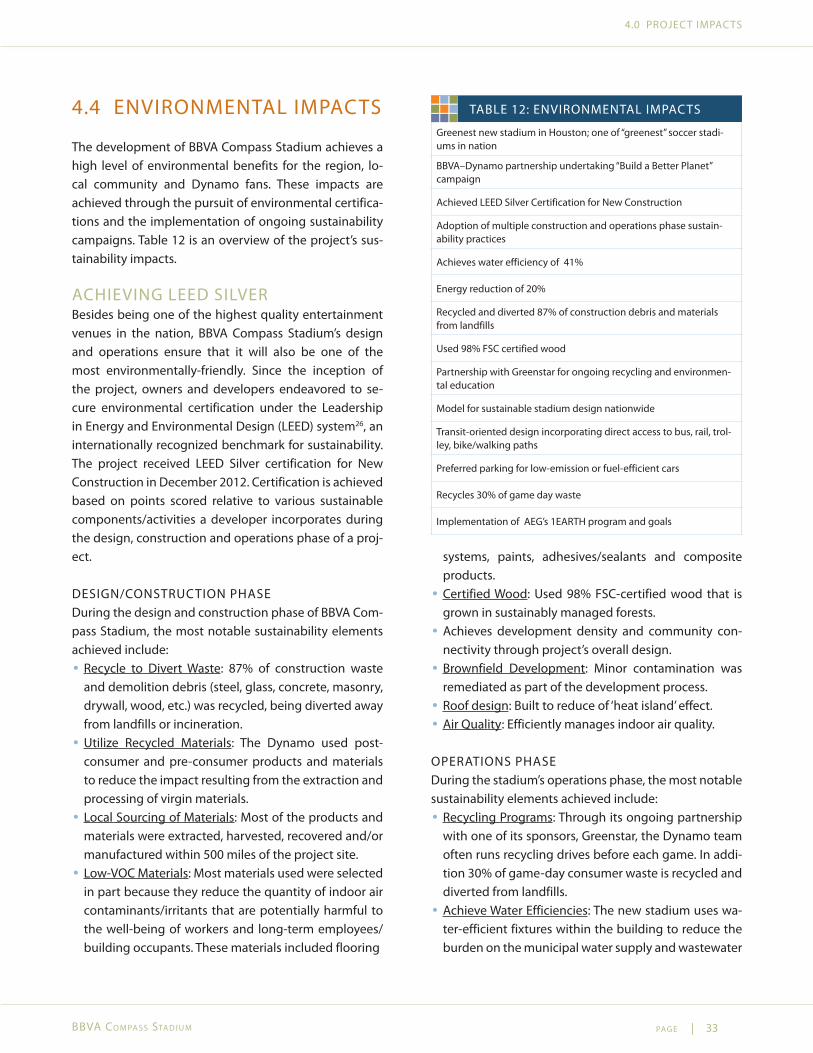
pag e | 33
4.0 PROJECT IMPACTS
BBVa Co m pa ss sta d i u m
4.4 ENVIRONMENTAL IMPACTS
The development of BBVA Compass Stadium achieves a high level of environmental benefits for the region, lo-cal community and Dynamo fans. These impacts are achieved through the pursuit of environmental certifica-tions and the implementation of ongoing sustainability campaigns. Table 12 is an overview of the project’s sus-tainability impacts.
ACHIEVING LEED SILVERBesides being one of the highest quality entertainment venues in the nation, BBVA Compass Stadium’s design and operations ensure that it will also be one of the most environmentally-friendly. Since the inception of the project, owners and developers endeavored to se-cure environmental certification under the Leadership in Energy and Environmental Design (LEED) system26, an internationally recognized benchmark for sustainability. The project received LEED Silver certification for New Construction in December 2012. Certification is achieved based on points scored relative to various sustainable components/activities a developer incorporates during the design, construction and operations phase of a proj-ect.
DESIGN/CONSTRUCTION PHASE During the design and construction phase of BBVA Com-pass Stadium, the most notable sustainability elements achieved include:
• Recycle to Divert Waste: 87% of construction waste and demolition debris (steel, glass, concrete, masonry, drywall, wood, etc.) was recycled, being diverted away from landfills or incineration.
• Utilize Recycled Materials: The Dynamo used post-consumer and pre-consumer products and materials to reduce the impact resulting from the extraction and processing of virgin materials.
• Local Sourcing of Materials: Most of the products and materials were extracted, harvested, recovered and/or manufactured within 500 miles of the project site.
• Low-VOC Materials: Most materials used were selected in part because they reduce the quantity of indoor air contaminants/irritants that are potentially harmful to the well-being of workers and long-term employees/building occupants. These materials included flooring
TABLE 12: ENVIRONMENTAL IMPACTS
Greenest new stadium in Houston; one of “greenest” soccer stadi-ums in nation
BBVA–Dynamo partnership undertaking “Build a Better Planet” campaign
Achieved LEED Silver Certification for New Construction
Adoption of multiple construction and operations phase sustain-ability practices
Achieves water efficiency of 41%
Energy reduction of 20%
Recycled and diverted 87% of construction debris and materials from landfills
Used 98% FSC certified wood
Partnership with Greenstar for ongoing recycling and environmen-tal education
Model for sustainable stadium design nationwide
Transit-oriented design incorporating direct access to bus, rail, trol-ley, bike/walking paths
Preferred parking for low-emission or fuel-efficient cars
Recycles 30% of game day waste
Implementation of AEG’s 1EARTH program and goals
systems, paints, adhesives/sealants and composite products.
• Certified Wood: Used 98% FSC-certified wood that is grown in sustainably managed forests.
• Achieves development density and community con-nectivity through project’s overall design.
• Brownfield Development: Minor contamination was remediated as part of the development process.
• Roof design: Built to reduce of ‘heat island’ effect. • Air Quality: Efficiently manages indoor air quality.
OPERATIONS PHASEDuring the stadium’s operations phase, the most notable sustainability elements achieved include:
• Recycling Programs: Through its ongoing partnership with one of its sponsors, Greenstar, the Dynamo team often runs recycling drives before each game. In addi-tion 30% of game-day consumer waste is recycled and diverted from landfills.
• Achieve Water Efficiencies: The new stadium uses wa-ter-efficient fixtures within the building to reduce the burden on the municipal water supply and wastewater
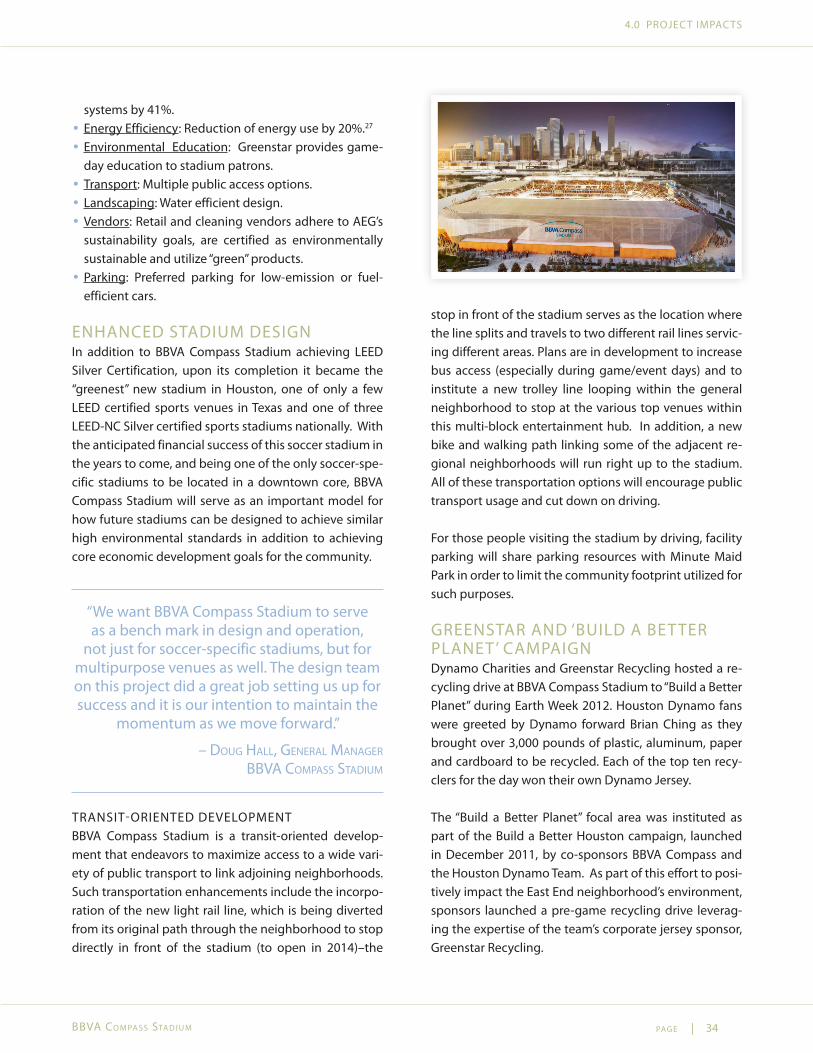
pag e | 34
4.0 PROJECT IMPACTS
BBVa Co m pa ss sta d i u m
systems by 41%. • Energy Efficiency: Reduction of energy use by 20%.27
• Environmental Education: Greenstar provides game-day education to stadium patrons.
• Transport: Multiple public access options. • Landscaping: Water efficient design. • Vendors: Retail and cleaning vendors adhere to AEG’s sustainability goals, are certified as environmentally sustainable and utilize “green” products.
• Parking: Preferred parking for low-emission or fuel-efficient cars.
ENHANCED STADIUM DESIGNIn addition to BBVA Compass Stadium achieving LEED Silver Certification, upon its completion it became the “greenest” new stadium in Houston, one of only a few LEED certified sports venues in Texas and one of three LEED-NC Silver certified sports stadiums nationally. With the anticipated financial success of this soccer stadium in the years to come, and being one of the only soccer-spe-cific stadiums to be located in a downtown core, BBVA Compass Stadium will serve as an important model for how future stadiums can be designed to achieve similar high environmental standards in addition to achieving core economic development goals for the community.
“We want BBVA Compass Stadium to serve as a bench mark in design and operation,
not just for soccer-specific stadiums, but for multipurpose venues as well. The design team on this project did a great job setting us up for success and it is our intention to maintain the
momentum as we move forward.”
– doug HaLL, generaL manager BBVa Compass stadium
TRANSIT-ORIENTED DEVELOPMENTBBVA Compass Stadium is a transit-oriented develop-ment that endeavors to maximize access to a wide vari-ety of public transport to link adjoining neighborhoods. Such transportation enhancements include the incorpo-ration of the new light rail line, which is being diverted from its original path through the neighborhood to stop directly in front of the stadium (to open in 2014)–the
stop in front of the stadium serves as the location where the line splits and travels to two different rail lines servic-ing different areas. Plans are in development to increase bus access (especially during game/event days) and to institute a new trolley line looping within the general neighborhood to stop at the various top venues within this multi-block entertainment hub. In addition, a new bike and walking path linking some of the adjacent re-gional neighborhoods will run right up to the stadium. All of these transportation options will encourage public transport usage and cut down on driving.
For those people visiting the stadium by driving, facility parking will share parking resources with Minute Maid Park in order to limit the community footprint utilized for such purposes.
GREENSTAR AND ‘BUILD A BET TER PLANET’ CAMPAIGNDynamo Charities and Greenstar Recycling hosted a re-cycling drive at BBVA Compass Stadium to “Build a Better Planet” during Earth Week 2012. Houston Dynamo fans were greeted by Dynamo forward Brian Ching as they brought over 3,000 pounds of plastic, aluminum, paper and cardboard to be recycled. Each of the top ten recy-clers for the day won their own Dynamo Jersey.
The “Build a Better Planet” focal area was instituted as part of the Build a Better Houston campaign, launched in December 2011, by co-sponsors BBVA Compass and the Houston Dynamo Team. As part of this effort to posi-tively impact the East End neighborhood’s environment, sponsors launched a pre-game recycling drive leverag-ing the expertise of the team’s corporate jersey sponsor, Greenstar Recycling.
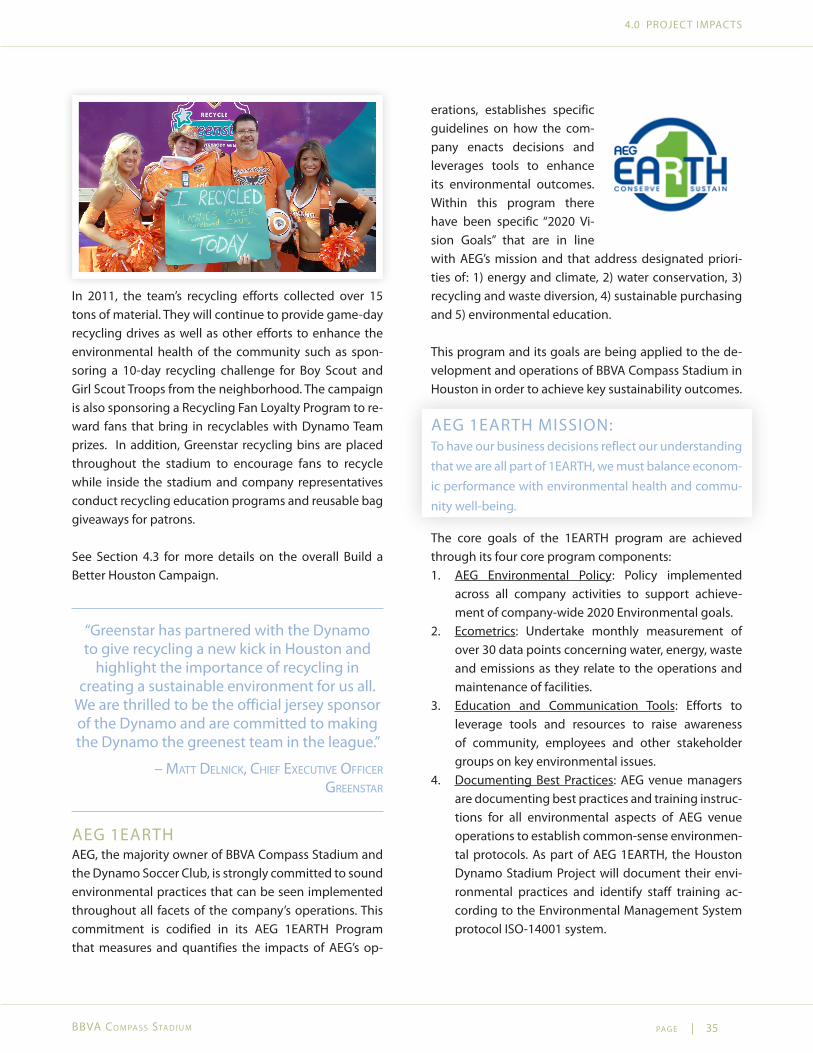
pag e | 35
4.0 PROJECT IMPACTS
BBVa Co m pa ss sta d i u m
In 2011, the team’s recycling efforts collected over 15 tons of material. They will continue to provide game-day recycling drives as well as other efforts to enhance the environmental health of the community such as spon-soring a 10-day recycling challenge for Boy Scout and Girl Scout Troops from the neighborhood. The campaign is also sponsoring a Recycling Fan Loyalty Program to re-ward fans that bring in recyclables with Dynamo Team prizes. In addition, Greenstar recycling bins are placed throughout the stadium to encourage fans to recycle while inside the stadium and company representatives conduct recycling education programs and reusable bag giveaways for patrons.
See Section 4.3 for more details on the overall Build a Better Houston Campaign.
“Greenstar has partnered with the Dynamo to give recycling a new kick in Houston and
highlight the importance of recycling in creating a sustainable environment for us all.
We are thrilled to be the official jersey sponsor of the Dynamo and are committed to making the Dynamo the greenest team in the league.”
– matt deLniCk, CHief exeCutiVe offiCer greenstar
AEG 1EARTHAEG, the majority owner of BBVA Compass Stadium and the Dynamo Soccer Club, is strongly committed to sound environmental practices that can be seen implemented throughout all facets of the company’s operations. This commitment is codified in its AEG 1EARTH Program that measures and quantifies the impacts of AEG’s op-
erations, establishes specific guidelines on how the com-pany enacts decisions and leverages tools to enhance its environmental outcomes. Within this program there have been specific “2020 Vi-sion Goals” that are in line with AEG’s mission and that address designated priori-ties of: 1) energy and climate, 2) water conservation, 3) recycling and waste diversion, 4) sustainable purchasing and 5) environmental education.
This program and its goals are being applied to the de-velopment and operations of BBVA Compass Stadium in Houston in order to achieve key sustainability outcomes.
AEG 1EARTH MISSION:To have our business decisions reflect our understanding that we are all part of 1EARTH, we must balance econom-ic performance with environmental health and commu-nity well-being.
The core goals of the 1EARTH program are achieved through its four core program components:1. AEG Environmental Policy: Policy implemented
across all company activities to support achieve-ment of company-wide 2020 Environmental goals.
2. Ecometrics: Undertake monthly measurement of over 30 data points concerning water, energy, waste and emissions as they relate to the operations and maintenance of facilities.
3. Education and Communication Tools: Efforts to leverage tools and resources to raise awareness of community, employees and other stakeholder groups on key environmental issues.
4. Documenting Best Practices: AEG venue managers are documenting best practices and training instruc-tions for all environmental aspects of AEG venue operations to establish common-sense environmen-tal protocols. As part of AEG 1EARTH, the Houston Dynamo Stadium Project will document their envi-ronmental practices and identify staff training ac-cording to the Environmental Management System protocol ISO-14001 system.
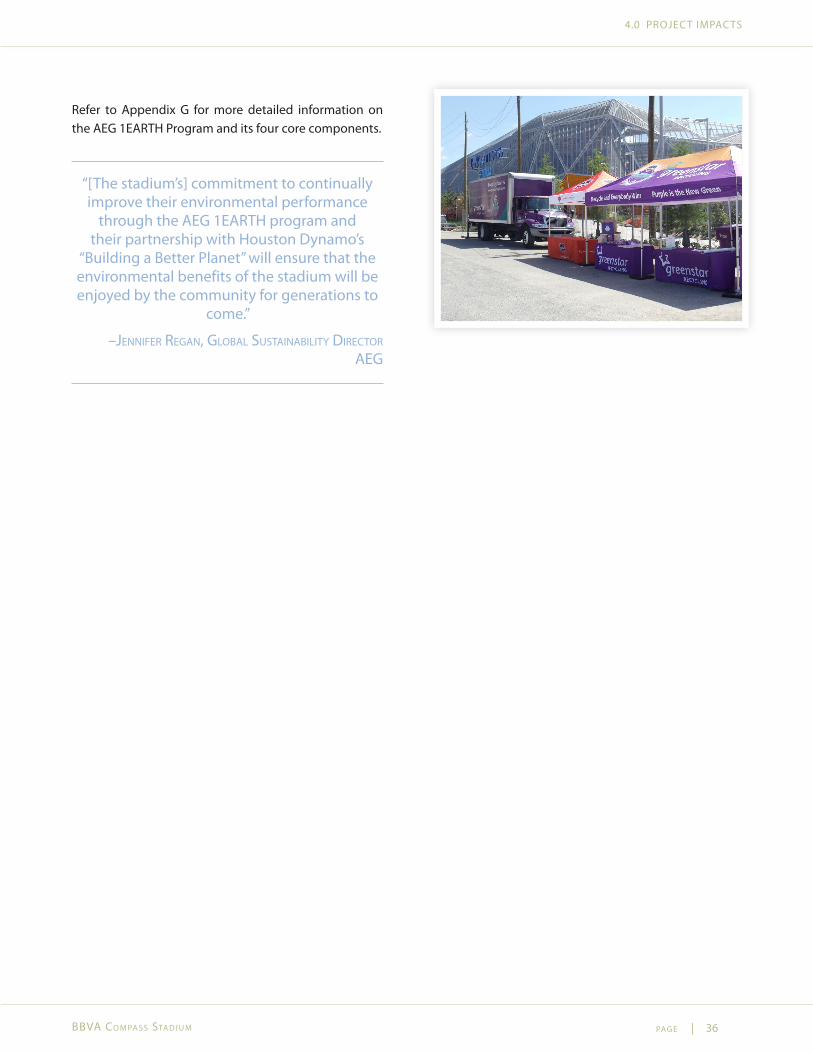
pag e | 36
4.0 PROJECT IMPACTS
BBVa Co m pa ss sta d i u m
Refer to Appendix G for more detailed information on the AEG 1EARTH Program and its four core components.
“[The stadium’s] commitment to continually improve their environmental performance
through the AEG 1EARTH program and their partnership with Houston Dynamo’s
“Building a Better Planet” will ensure that the environmental benefits of the stadium will be enjoyed by the community for generations to
come.”
–jennifer regan, gLoBaL sustainaBiLity direCtor aeg
pag e | 37
5.0 APPENDICES
BBVa Co m pa ss sta d i u m
APPENDIX A: LOCATIONS OF TABLES AND FIGURES
Table 1: Project Overview .................................................................................................................................................................................................................5
Figure 1: Census Tract Map ..............................................................................................................................................................................................................15
Table 2: Core Project Details ..........................................................................................................................................................................................................15
Figure 2: Area Stadium and Event Facilities ...............................................................................................................................................................................16
Table 3: Investment Overview ......................................................................................................................................................................................................17
Figure 3: Stadium Financing ...........................................................................................................................................................................................................18
Table 4: Project Impacts Overview ..............................................................................................................................................................................................19
Table 5: Economic Impact Summary ..........................................................................................................................................................................................20
Table 6: Taxpayer Subsidy ..............................................................................................................................................................................................................25
Table 7: Construction Tax Revenue .............................................................................................................................................................................................25
Table 8: Team Operations Tax Revenue .....................................................................................................................................................................................26
Table 9: Stadium Operations Tax Revenue ...............................................................................................................................................................................26
Table 10: 20-Year Taxpayer Return .................................................................................................................................................................................................26
Figure 4: Taxpayer Return on Investment ..................................................................................................................................................................................27
Table 11: Social Impacts ....................................................................................................................................................................................................................28
Table 12: Environmental Impacts ..................................................................................................................................................................................................33
5.0 APPENDICES
pag e | 38
5.0 APPENDICES
BBVa Co m pa ss sta d i u m
APPENDIX B: CREDENTIALS OF REPORT AUTHORS
STRATEGIC DEVELOPMENT SOLUTIONS, LLCStrategic Development Solutions (SDS) creates innovative business and investment strategies that foster economic oppor-tunity in low-income communities and promote positive environmental impacts. SDS develops innovative market-driven approaches to promote economic development. SDS has built and capitalized more than $2 billion of Double and Triple Bottom Line private-equity funds with its affiliated partner Economic Innovation International, Inc. The three bottom lines of these funds are: (1) market rates of return, (2) positive community/social impacts, and (3) environmental sustainability. Further, the two firms jointly manage the $312 million National New Markets Fund, LLC, an allocation of federal tax credits for real estate projects in low-income communities.
11150 W. Olympic Blvd., Suite 910,
Los Angeles, CA 90064
(310) 914.5333 (phone)
(310) 914.5337 (fax)
www.sdsgroup.com
LOS ANGELES COUNTY ECONOMIC DEVELOPMENT CORPORATIONThe Los Angeles County Economic Development Corporation (LAEDC) is a private, non-profit organization established in 1981 under section 501(C)(3) by the Los Angeles County Board of Supervisors. During its history, the LAEDC has evolved from being a facilitator of the County’s industrial bond development program to being Southern California’s premier eco-nomic development organization.
The LAEDC Economic and Policy Analysis Group offers objective economic and policy research and analysis for public agencies and private firms focusing on economic impact studies, regional industry analyses, economic forecasts and policy studies, particularly in water, transportation, infrastructure and environmental policy.
444 South Flower Street , 34th Floor
Los Angeles, CA 90071
(231) 622 4300 (phone)
www.laedc.org
pag e | 39
5.0 APPENDICES
BBVa Co m pa ss sta d i u m
APPENDIX C: IMPLAN
IMPLAN OVERVIEW SDS and LAEDC undertook an Economic and Fiscal impact analysis based on the anticipated gross impacts of the project using IMPLAN along with a fiscal analysis based on existing tax rates in the project region (city, county, state) and at the federal level. Below is a list of terms used in this report.
IMPLAN IMPLAN is a computer-based input-output modeling system used by over 1,500 federal, state and local agencies, research universities and non-profit organizations. An input-output model is a representation of the flows of economic activity be-tween sectors within a region. The model captures what each business or sector must purchase from every other sector in order to produce a dollar’s worth of goods or services. Using such a model, flows of economic activity associated with any change in spending may be traced either forward (e.g., spending generates employee wages which induce further spend-ing) or backward (e.g., visitor purchases of meals lead restaurants to purchase additional inputs – groceries, utilities, etc.). Multipliers for a region may be derived from an input-output model of the region’s economy.
With IMPLAN, one can estimate I-O models of up to 528 sectors for any geographic region. IMPLAN includes procedures for generating multipliers and estimating impacts by applying final demand changes to the model.
DIRECT ECONOMIC IMPACTDirect economic impact represents expenditures made by a project, including the wages and salaries of project em-ployees. For each investment project, IMPLAN calculates the direct impact of the project during construction and operations.
Note: Once analysts have the actual numbers from the project, these estimates are replaced with real numbers.
INDIRECT ECONOMIC IMPACTThe injection of new money into the local economy by a project results in a ripple effect, or multiplier, which gener-ates income and jobs for individuals not directly associated with the project. Indirect impact represents the value of a project’s impact on other businesses, industries and households in the region’s economy. For example, a project may purchase supplies from several companies in the region. Businesses receiving this income spend or invest it in the region which leads to an increase in income and spending by other businesses and individuals. Indirect impacts are estimated with models developed using IMPLAN data and software.
INDUCED ECONOMIC IMPACTInduced economic impact is a ripple effect that is represented by changes in spending from households that are direct-ly or indirectly related to the project. For example, a project employee spending a part of her salary on an electronic purchase will induce employees of the electronic store to spend part of their salaries on clothing, and so on. Induced impacts are estimated with models developed using IMPLAN data and software.
OUTPUTRepresents the total value of production, commonly measured using revenues. Direct, indirect, and induced output projections can be made.
pag e | 40
5.0 APPENDICES
BBVa Co m pa ss sta d i u m
APPENDIX D: REFERENCES AND ASSUMPTIONS
3.3 PROJECT GENESIS1. Per NMTC program, investment tract data from Census 2000 is used to qualify a project. Census Tract: 48201310100.
3.4 SITE AND AREA BACKGROUND2. 2007-2011 American Community Survey for Census Tract 48201310100. AMI computed using Census Tract Median
Family Income and Houston-Baytown-Huntsville, TX CSA Median Family Income.
3.5 STADIUM FINANCING3. NMTC net equity: This use of the term equity refers to the subsidy that is provided through the New Markets Tax
Credits directly to the project at the time of the project closing. These dollars may remain in the project or could be subject to repayment at a below-market interest rate.
4. Tax Increment Reinvestment Zones (TIRZs) are special zones created by the City Council to attract new investment to an area. TIRZs help finance the cost of redevelopment and encourage development in an area that would otherwise not attract sufficient market development in a timely manner. Taxes attributable to new improvements (tax incre-ments) are set aside in a fund to finance public improvements within the boundaries of the zone.
4.1 ECONOMIC IMPACTS5. We used the total construction budget supplied by the client as our direct spending in the construction component
(March 2011- May 2012, 15 months). Direct construction employment and labor income is presented as predicted by the model. For the two operations components, we used the gross revenues from the operational pro formas for both the team and the stadium provided by the client. The first year of the team’s operations is coincident with the stadium construction under the assumption that the team would have left the county had construction of the stadium not begun. First year of team operations (March 2011- February 2012) uses a financial model under which the team played at Robertson Stadium and incurred lease payments and related costs. The second year of the team’s operations coincides with the first year of the stadium operations (starting in June 2012) (and the third year of the teams operations with the second year of the stadium, etc.). For the second and all future years of team operations, the team’s revenues were reduced by the amount allocated to stadium operations since we believe this would be ac-counted for in the revenues of the stadium. We assumed that the values for construction costs were provided to us in 2011 dollars and the values for revenues of stadium and team operations were quoted in nominal dollars. For years beyond the pro formas, we inflated the final year of given revenues by the inflation rate used by the client. This rate was 2.86 percent for team operations and 2.81 percent for stadium operations. Any employment or economic output due to HASP is not included in the analysis.
6. Our analysis was performed using IMPLAN software (version 3.0) from MIG, Inc. IMPLAN’s 440-sector economic input-output model is developed using 2010 data for the economic region of Harris County and traces inter-industry transactions resulting from an increase in demand in the economic region.
7. 693,413 man hours went into construction and 125,000 man hours went into design & management positions. Work-ing 35 hours a week for 15 months, this equals 360 FTEs. Hour data provided by Doug Hall, Stadium General Manager.
8. Indirect and induced employment estimates are measured on a job-count basis regardless of the number of hours worked and are measured on an annual basis, i.e., the number of full and part time jobs created in one year.
9. The estimates for labor income and output for each year are expressed in nominal dollars. Labor income includes payments made to wage and salary workers and to the self-employed. Payments include wages and benefits such as health insurance and retirement benefits.
10. This includes compensation from direct, indirect and induced jobs associated with team operations.
pag e | 41
5.0 APPENDICES
BBVa Co m pa ss sta d i u m
11. This includes compensation from direct, indirect and induced jobs associated with stadium operations.12. This estimate was provided by AEG based on projected game-day employment.13. The number of jobs supported for non-sold out stadium events will be lower and the number of jobs will be linked to
the number of event attendees.14. The total economic impact includes direct, indirect and induced effects. Direct activity includes the materials pur-
chased and the employees hired by the stadium and team in their operations and by contractors during the con-struction period. Indirect effects are those which stem from the employment and business revenues of the suppliers and vendors of the stadium, its contractors and the team. Induced effects are those generated by the spending of employees whose wages are sustained by both direct and indirect spending.
15. Includes output generated from direct, indirect and induced sources.16. ICON: Dynamo Stadium Overall Summary Report. Total project costs, for which the subcontract work was based
upon, is calculated at $74.1 million. 17. Examples include Livestrong Stadium (new construction) in Kansas City, Jeld-Wen Field in Portland, and Empire Field
Stadium in Vancouver.
4.2 FISCAL IMPACTS18. Fiscal impacts result from the economic activity generated by direct, indirect and induced spending, and include all
payments made to governments. Both federal fiscal impacts and state and local impacts are estimated. The separa-tion between state and local taxes is often difficult to estimate with certainty and thus are aggregated.
19. The present value (PV) is the value of the stream of cash inflows over the 20 year period discounted to reflect the time value of money. The discount rate used in net present value calculations is 4.0 percent. This is based on an esti-mate using historical 10-year and 30-year U.S. Treasury yields, which are currently extraordinarily low but which are expected to rise during the analysis period.
20. The TIRZ loan funds were received by the project in three installments between November 2011 and January 2012. The total amount of fund received was based on the incremental increases in property taxes received by the City, Harris County and the Houston Independent School District. For purposes of developing a flow of funds to base the economic and fiscal analysis on, the analyst has used the underlying assumption that the $20M of TIRZ funds are received by the project in a lump sum at the end of the first year of construction.
21. The break-even period is the year in which the cumulative taxpayer subsidies are offset by the estimated cumulative fiscal receipts. It is assumed that payments from the subsidy are received at the beginning of each of year 1 through 7, while the fiscal revenues are realized at the end of each year.
22. ROI presents a 20-year cash flow analysis of the taxpayer subsidy and of the tax revenues yielded by the construction and ongoing operations of the facility, as estimated in the fiscal impact analysis sections of each component. The re-turn on investment (ROI) compares the net present value of the taxpayer subsidies over 20 years with the net present value of the expected fiscal impacts associated with the project over the same period.
23. The modified internal rate of return (MIRR) is the interest rate that produces a NPV of 0 for the 20-year cash flow stream. The MIRR incorporates a 5% borrowing cost and 5% reinvestment.
4.3 SOCIAL IMPACTS24. Provided by Texas Southern University based on annual rent savings compared to the previous stadium.25. Texas Tribune. http://www.texastribune.org/texas-education/higher-education/tsu-works-bring-grad-rates-bottom/
4.4 ENVIRONMENTAL IMPACTS26. U.S. Green Building Council; www.usgbc.org27. Using the ASHRAE 90.1-2007 baseline calculation methodology.
pag e | 42
5.0 APPENDICES
BBVa Co m pa ss sta d i u m
APPENDIX E: AEG OVERVIEW
AEG is one of the leading sports and entertainment companies in the world with a network of over 120 owned, operated and programmed venues on five continents. AEG is a wholly owned subsidiary of the Anschutz Company. AEG owns or op-erates many of the world’s preeminent entertainment venues such as STAPLES Center (Los Angeles, CA), The O2 (London, UK), Mercedes-Benz Arena (Shanghai, China), Allphones Arena (Sydney, Australia), O2 World (Berlin, Germany), the Ericsson Globe Arena (Stockholm, Sweden), MasterCard Center (Beijing, China), Ulker Sports Arena (Istanbul, Turkey), BBVA Compass Stadium (Houston, TX), Brisbane Entertainment Center (Brisbane, Australia), The Home Depot Center (Carson, CA), Best Buy Theater (Times Square, New York), Sprint Center, (Kansas City), Rose Garden Arena (Portland, OR), Target Center (Minneapo-lis, MN) and the O2 World Hamburg (Hamburg, Germany).
Developed by AEG, L.A. LIVE is a 4 million square foot downtown Los Angeles sports, residential and entertainment district featuring Nokia Theatre L.A. LIVE and Club Nokia, a 54-story, 1001-room convention “headquarters” destination anchored by The Ritz-Carlton & JW Marriott Hotel at L.A., the Ritz-Carlton Residences at L.A. LIVE and Wolfgang Puck’s flagship restau-rant WP 24, along with entertainment, restaurant and office space.
In addition to overseeing a privately held interest in the Los Angeles Lakers (NBA), assets of AEG Sports include franchises and properties such as the Stanley Cup Champion Los Angeles Kings (NHL), MLS Cup Champion L.A. Galaxy, the Berlin Eisbaren, Germany’s championship hockey team, the Amgen Tour of California cycling race and Zazzle Bay to Breakers foot race.
AEG Live, the company’s live-entertainment subsidiary, is the world’s second largest concert promotion and touring com-pany and is comprised of touring, festival, exhibition, broadcast, merchandise and special event divisions with fifteen re-gional offices.
AEG Global Partnerships is an AEG subsidiary responsible for worldwide sales and servicing of sponsorships, naming rights and other strategic partnerships.
AEG Merchandising, a multi-faceted merchandising company, is also a core business unit of AEG.
AXS.com is AEG’s ticketing and e-commerce subsidiary, the first phase of AEG’s new entertainment platform that will be the company’s primary consumer brand and will also feature mobile services as well as video content services.
For additional information, visit www.AEGworldwide.com.
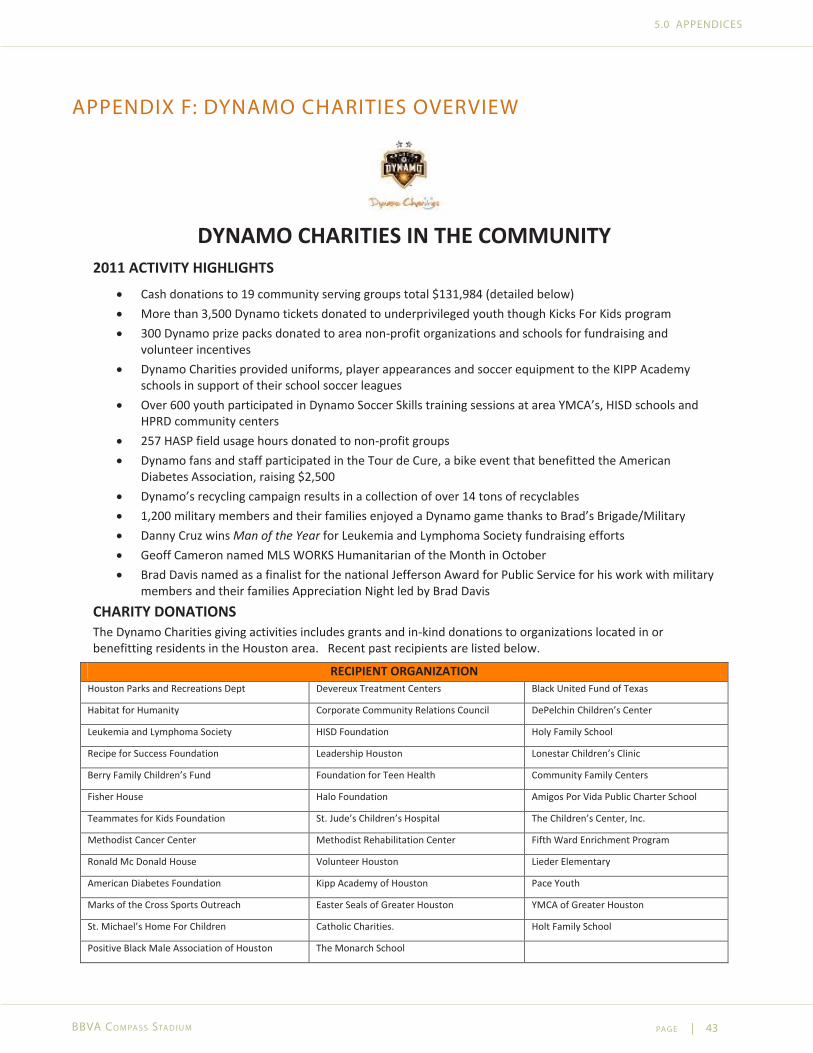
pag e | 43
5.0 APPENDICES
BBVa Co m pa ss sta d i u m
APPENDIX F: DYNAMO CHARITIES OVERVIEW
DYNAMO CHARITIES IN THE COMMUNITY
2011 ACTIVITY HIGHLIGHTS
Cash donations to 19 community serving groups total $131,984 (detailed below) More than 3,500 Dynamo tickets donated to underprivileged youth though Kicks For Kids program 300 Dynamo prize packs donated to area non-profit organizations and schools for fundraising and
volunteer incentives Dynamo Charities provided uniforms, player appearances and soccer equipment to the KIPP Academy
schools in support of their school soccer leagues Over 600 youth participated in Dynamo Soccer Skills training sessions at area YMCA’s, HISD schools and
HPRD community centers 257 HASP field usage hours donated to non-profit groups Dynamo fans and staff participated in the Tour de Cure, a bike event that benefitted the American
Diabetes Association, raising $2,500 Dynamo’s recycling campaign results in a collection of over 14 tons of recyclables 1,200 military members and their families enjoyed a Dynamo game thanks to Brad’s Brigade/Military Danny Cruz wins Man of the Year for Leukemia and Lymphoma Society fundraising efforts Geoff Cameron named MLS WORKS Humanitarian of the Month in October Brad Davis named as a finalist for the national Jefferson Award for Public Service for his work with military
members and their families Appreciation Night led by Brad Davis
CHARITY DONATIONS The Dynamo Charities giving activities includes grants and in-kind donations to organizations located in or benefitting residents in the Houston area. Recent past recipients are listed below.
RECIPIENT ORGANIZATION Houston Parks and Recreations Dept Devereux Treatment Centers Black United Fund of Texas
Habitat for Humanity Corporate Community Relations Council DePelchin Children’s Center
Leukemia and Lymphoma Society HISD Foundation Holy Family School
Recipe for Success Foundation Leadership Houston Lonestar Children’s Clinic
Berry Family Children’s Fund Foundation for Teen Health Community Family Centers
Fisher House Halo Foundation Amigos Por Vida Public Charter School
Teammates for Kids Foundation St. Jude’s Children’s Hospital The Children’s Center, Inc.
Methodist Cancer Center Methodist Rehabilitation Center Fifth Ward Enrichment Program
Ronald Mc Donald House Volunteer Houston Lieder Elementary
American Diabetes Foundation Kipp Academy of Houston Pace Youth
Marks of the Cross Sports Outreach Easter Seals of Greater Houston YMCA of Greater Houston
St. Michael’s Home For Children Catholic Charities. Holt Family School
Positive Black Male Association of Houston The Monarch School
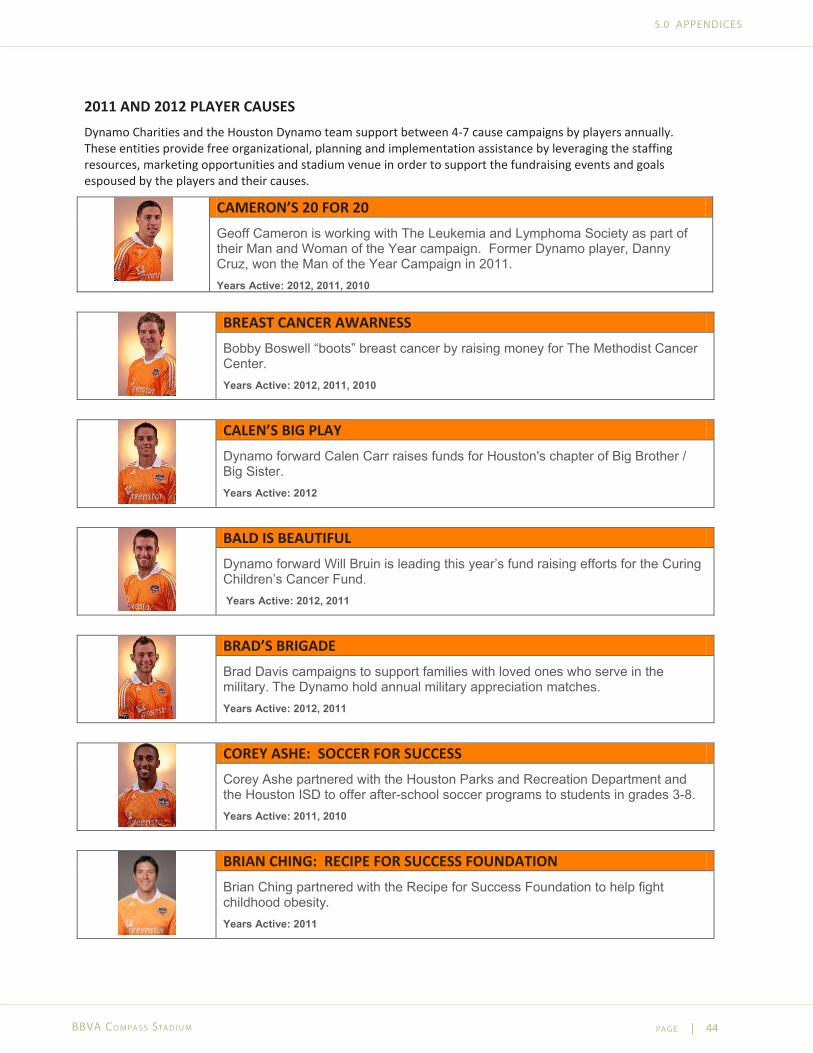
pag e | 44
5.0 APPENDICES
BBVa Co m pa ss sta d i u m
2011 AND 2012 PLAYER CAUSES
Dynamo Charities and the Houston Dynamo team support between 4-7 cause campaigns by players annually. These entities provide free organizational, planning and implementation assistance by leveraging the staffing resources, marketing opportunities and stadium venue in order to support the fundraising events and goals espoused by the players and their causes.
CAMERON’S 20 FOR 20 Geoff Cameron is working with The Leukemia and Lymphoma Society as part of their Man and Woman of the Year campaign. Former Dynamo player, Danny Cruz, won the Man of the Year Campaign in 2011. Years Active: 2012, 2011, 2010
BREAST CANCER AWARNESS Bobby Boswell “boots” breast cancer by raising money for The Methodist Cancer Center. Years Active: 2012, 2011, 2010
CALEN’S BIG PLAY Dynamo forward Calen Carr raises funds for Houston's chapter of Big Brother / Big Sister. Years Active: 2012
BALD IS BEAUTIFUL Dynamo forward Will Bruin is leading this year’s fund raising efforts for the Curing Children’s Cancer Fund.
Years Active: 2012, 2011
BRAD’S BRIGADE Brad Davis campaigns to support families with loved ones who serve in the military. The Dynamo hold annual military appreciation matches. Years Active: 2012, 2011
COREY ASHE: SOCCER FOR SUCCESS Corey Ashe partnered with the Houston Parks and Recreation Department and the Houston ISD to offer after-school soccer programs to students in grades 3-8. Years Active: 2011, 2010
BRIAN CHING: RECIPE FOR SUCCESS FOUNDATION Brian Ching partnered with the Recipe for Success Foundation to help fight childhood obesity.
Years Active: 2011
pag e | 45
5.0 APPENDICES
BBVa Co m pa ss sta d i u m
APPENDIX H: 1EARTH PROGRAM
AEG 1EARTH is AEG’s environmental program that measures and quantifies the impact of AEG’s operations, identifies goals to guide company decision making and provides tools to improve environmental performance. AEG 1EARTH 2020 Vision Goals focus on the following key categories:
• Energy and Climate • Water Conservation • Recycling and waste diversion • Sustainable Purchasing • Education
THE AEG 1EARTH MISSIONTo have our business decisions reflect our understanding that we are all part of 1EARTH, we must balance economic per-formance with environmental health and community well-being. We reduce and recycle waste, conserve energy and water, and educate our guests and employees on environmental stewardship. There are four components to the AEG 1EARTH Program which support our 2020 Goals:
1. AEG’s Environmental Policy: AEG’s corporate environmental policy, as signed by our President and CEO, Tim Leiweke, commits AEG to the following principles:
• Continual improvement and review of environmental performance in business operations • Compliance with all environmental regulations and policies • Integration of best management practices into our operations using pollution prevention and environmental sus-tainability strategies as core objectives
• Responsiveness to the environmental concerns and priorities of the company’s stakeholders, clients, guests and employees
2. Ecometrics: AEG Ecometrics is our environmental performance tracking system that collects over 30 data points on re-sources consumed and wastes generated from all AEG owned and managed facilities. Information is collected month-ly and normalized by total attendance to account for growth and benchmark our performance overtime and across the variety of building types within the AEG portfolio.
3. Education and Communication Tools: Every week AEG welcomes thousands of employees and guests to our venues and events, working with countless athletes, entertainers and other major corporations to create memorable experi-ences. AEG has an unprecedented opportunity to raise environmental awareness among these employees, partners and guests by seizing everyday opportunities to tell our environmental success stories and using our venues and events as platforms for messaging on key environmental issues. By sharing the story of our sustainability journey we hope to inspire others to see that environmentally responsibility is not just good business sense but it can also be fun. In 2012, AEG released its second industry-leading Sustainability Report. In addition, AEG has identified many environ-mental partners to help with our environmental education and communications including the Green Sports Alliance, Natural Resources Defense Council and the World Wildlife Fund.
4. Documenting Best Practices: AEG 1EARTH is working with AEG’s venue managers to document best practices and training instructions for all environmental aspects of AEG venue operations, turning common-sense business practices into an Environmental Management System or “EMS.” Venues with an EMS have the option to have a third party audit and certification to the ISO-14001 standard.
FOR INFORMATION ON IMPACT REPORTING SERVICES:
(310) 914-5333
11150 W. Olympic Blvd., Suite 910, Los Angeles, CA 90064
www.sdsgroup.com