BBUUSSIINNEESSSS VVAALLUUAATTIIOONN …rosscomp/files/Sample Certified... · Business Valuation...
94
B B U U S S I I N N E E S S S S V V A A L L U U A A T T I I O O N N R R E E P P O O R R T T Tentex Corp. (A fictitious company) As of September 30, 2012
Transcript of BBUUSSIINNEESSSS VVAALLUUAATTIIOONN …rosscomp/files/Sample Certified... · Business Valuation...

BBUUSSIINNEESSSS VVAALLUUAATTIIOONN RREEPPOORRTT
Tentex Corp. (A fictitious company)
As of September 30, 2012

Business Valuation Report For Tentex Corp
October 1, 2013 Ross & Company CPA, PLLC Page 2 of 94
TABLE OF CONTENTS
Important Notices
Section 1: Valuation Summary
Section 2: The Valuation Assignment
Section 3: The U.S. Economic Outlook
Section 4: The Industry Outlook
Section 5: Other Key Valuation Factors:
Cost of Capital, Liquidity Discount, & Minority Discount
Section 6: Valuation Findings
Appendices
Appendix A: About Ross & Company
Appendix B: Professional Qualifications
Appendix C: Firm Financial Data
Appendix D: Detailed Valuation Calculations
Appendix E: Certification and Conditions
Appendix F: Internal Revenue Service Revenue Ruling 59-60
Business Valuation Report For Tentex Corp.
October 1, 2013 Ross & Company CPA, PLLC Page 3 of 94
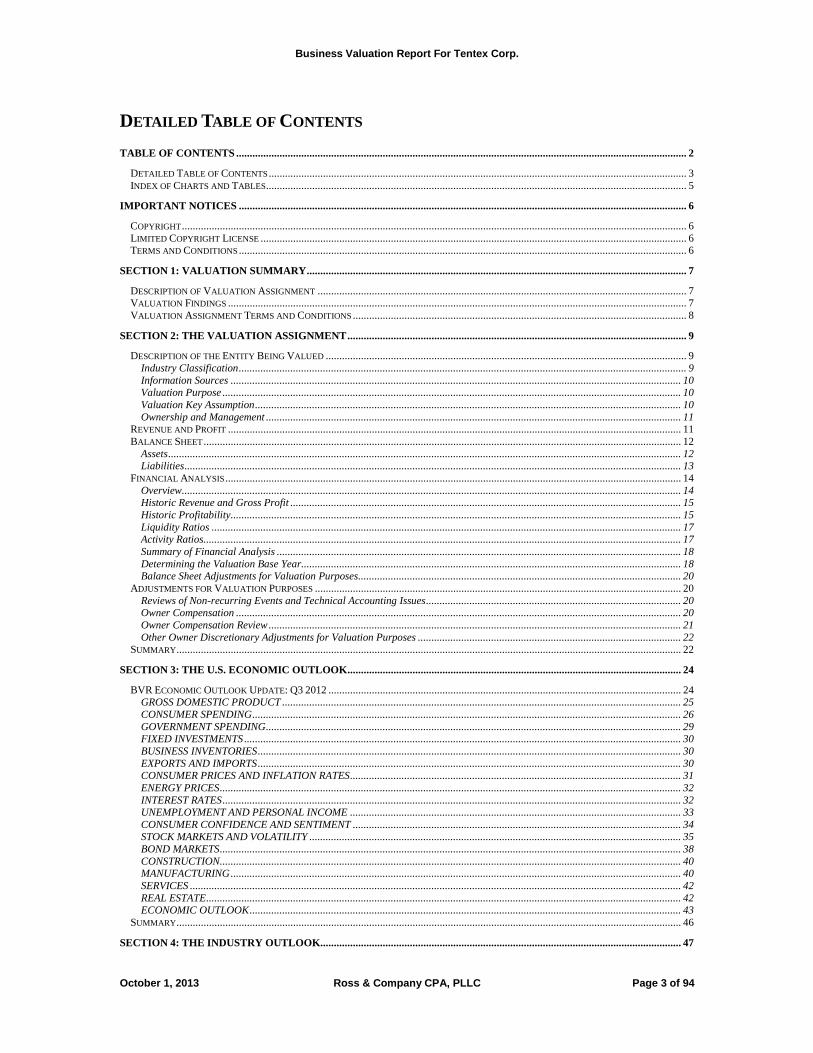
DETAILED TABLE OF CONTENTS
TABLE OF CONTENTS ...................................................................................................................................................................... 2
DETAILED TABLE OF CONTENTS .......................................................................................................................................................... 3 INDEX OF CHARTS AND TABLES ........................................................................................................................................................... 5
IMPORTANT NOTICES ..................................................................................................................................................................... 6
COPYRIGHT .......................................................................................................................................................................................... 6 LIMITED COPYRIGHT LICENSE ............................................................................................................................................................. 6 TERMS AND CONDITIONS ..................................................................................................................................................................... 6
SECTION 1: VALUATION SUMMARY ............................................................................................................................................ 7
DESCRIPTION OF VALUATION ASSIGNMENT ........................................................................................................................................ 7 VALUATION FINDINGS ......................................................................................................................................................................... 7 VALUATION ASSIGNMENT TERMS AND CONDITIONS ........................................................................................................................... 8
SECTION 2: THE VALUATION ASSIGNMENT ............................................................................................................................. 9
DESCRIPTION OF THE ENTITY BEING VALUED ..................................................................................................................................... 9 Industry Classification ..................................................................................................................................................................... 9 Information Sources ...................................................................................................................................................................... 10 Valuation Purpose ......................................................................................................................................................................... 10 Valuation Key Assumption ............................................................................................................................................................. 10 Ownership and Management ......................................................................................................................................................... 11
REVENUE AND PROFIT ....................................................................................................................................................................... 11 BALANCE SHEET ................................................................................................................................................................................ 12
Assets ............................................................................................................................................................................................. 12 Liabilities ....................................................................................................................................................................................... 13
FINANCIAL ANALYSIS ........................................................................................................................................................................ 14 Overview ........................................................................................................................................................................................ 14 Historic Revenue and Gross Profit ................................................................................................................................................ 15 Historic Profitability ...................................................................................................................................................................... 15 Liquidity Ratios ............................................................................................................................................................................. 17 Activity Ratios ................................................................................................................................................................................ 17 Summary of Financial Analysis ..................................................................................................................................................... 18 Determining the Valuation Base Year............................................................................................................................................ 18 Balance Sheet Adjustments for Valuation Purposes....................................................................................................................... 20
ADJUSTMENTS FOR VALUATION PURPOSES ....................................................................................................................................... 20 Reviews of Non-recurring Events and Technical Accounting Issues .............................................................................................. 20 Owner Compensation .................................................................................................................................................................... 20 Owner Compensation Review ........................................................................................................................................................ 21 Other Owner Discretionary Adjustments for Valuation Purposes ................................................................................................. 22
SUMMARY .......................................................................................................................................................................................... 22
SECTION 3: THE U.S. ECONOMIC OUTLOOK ........................................................................................................................... 24
BVR ECONOMIC OUTLOOK UPDATE: Q3 2012 .................................................................................................................................. 24 GROSS DOMESTIC PRODUCT ................................................................................................................................................... 25 CONSUMER SPENDING .............................................................................................................................................................. 26 GOVERNMENT SPENDING ......................................................................................................................................................... 29 FIXED INVESTMENTS ................................................................................................................................................................. 30 BUSINESS INVENTORIES ............................................................................................................................................................ 30 EXPORTS AND IMPORTS ............................................................................................................................................................ 30 CONSUMER PRICES AND INFLATION RATES .......................................................................................................................... 31 ENERGY PRICES .......................................................................................................................................................................... 32 INTEREST RATES ......................................................................................................................................................................... 32 UNEMPLOYMENT AND PERSONAL INCOME .......................................................................................................................... 33 CONSUMER CONFIDENCE AND SENTIMENT ......................................................................................................................... 34 STOCK MARKETS AND VOLATILITY ......................................................................................................................................... 35 BOND MARKETS .......................................................................................................................................................................... 38 CONSTRUCTION .......................................................................................................................................................................... 40 MANUFACTURING ...................................................................................................................................................................... 40 SERVICES ..................................................................................................................................................................................... 42 REAL ESTATE ............................................................................................................................................................................... 42 ECONOMIC OUTLOOK ............................................................................................................................................................... 43
SUMMARY .......................................................................................................................................................................................... 46
SECTION 4: THE INDUSTRY OUTLOOK..................................................................................................................................... 47

Business Valuation Report For Tentex Corp.
October 1, 2013 Ross & Company CPA, PLLC Page 4 of 94
INDUSTRY OVERVIEW ........................................................................................................................................................................ 47 Executive Summary........................................................................................................................................................................ 47 Key External Drivers ..................................................................................................................................................................... 48 Current Performance ..................................................................................................................................................................... 49 Industry Outlook ............................................................................................................................................................................ 51
DETERMINING THE FUTURE GROWTH ASSUMPTIONS FOR TENTEX .................................................................................................... 53 DETERMINING FREE CASH FLOWS ..................................................................................................................................................... 55
Net Fixed Asset Review .................................................................................................................................................................. 55 Working Capital Review ................................................................................................................................................................ 55 Summary of Free Cash Flows ........................................................................................................................................................ 56
SECTION 5: OTHER KEY VALUATION FACTORS ................................................................................................................... 58
COST OF CAPITAL: THE EXPECTED RATE OF RETURN FOR THIS FIRM ................................................................................................ 58 Risk versus Return ......................................................................................................................................................................... 58 Calculating the Firm-Specific Cost of Capital ............................................................................................................................... 58
TWO KEY VALUATION ADJUSTMENTS FOR THIS FIRM ....................................................................................................................... 60 The Liquidity Discount .................................................................................................................................................................. 60 The Control Premium or Minority Discount .................................................................................................................................. 61
THE CONTROL PREMIUM OR MINORITY ADJUSTMENT FOR THIS FIRM ............................................................................................... 62 The Minority Discount for this Firm .............................................................................................................................................. 63
SECTION 6: VALUATION FINDINGS ........................................................................................................................................... 64
APPROACH TO VALUATION OF THIS FIRM .......................................................................................................................................... 64 Defining Fair Market Value .......................................................................................................................................................... 64
VALUATION FUNDAMENTALS ............................................................................................................................................................ 65 Value as an On-going Concern ...................................................................................................................................................... 65 Valuation Methods: Market and Income ....................................................................................................................................... 65
ROSS & COMPANY’S APPROACH TO VALUATION OF THIS FIRM ........................................................................................................ 68 The Discounted Free Cash Flow Forecasting Valuation Method .................................................................................................. 68 Valuation of Tentex ........................................................................................................................................................................ 68 Valuation of Tax Pass-through ...................................................................................................................................................... 70 Valuation of a Minority Interest in Tentex ..................................................................................................................................... 71 The Factors Impacting the Valuation of this Firm ......................................................................................................................... 72
VALUATION REVIEW: PRIVATE AND PUBLIC COMPANY MARKET MULTIPLES .................................................................................. 73 WEIGHTING THE VALUATION METHODS ............................................................................................................................................ 73
APPENDIX A: ABOUT ROSS & COMPANY CPA, PLLC ........................................................................................................... 75
APPENDIX B: PROFESSIONAL QUALIFICATIONS .................................................................................................................. 76
GLEN A. ROSS, CPA CVA ................................................................................................................................................................. 76
APPENDIX C: FIRM FINANCIAL DATA ...................................................................................................................................... 78
APPENDIX D: DETAILED VALUATION CALCULATIONS ...................................................................................................... 83
APPENDIX E: CERTIFICATION AND CONDITIONS ................................................................................................................ 87
APPRAISAL CERTIFICATION ............................................................................................................................................................... 87 STATEMENT OF CONTINGENT AND LIMITING CONDITIONS ................................................................................................................ 88
APPENDIX F: IRS REVENUE RULING 59-60 ............................................................................................................................... 89
Business Valuation Report For Tentex Corp.
October 1, 2013 Ross & Company CPA, PLLC Page 5 of 94
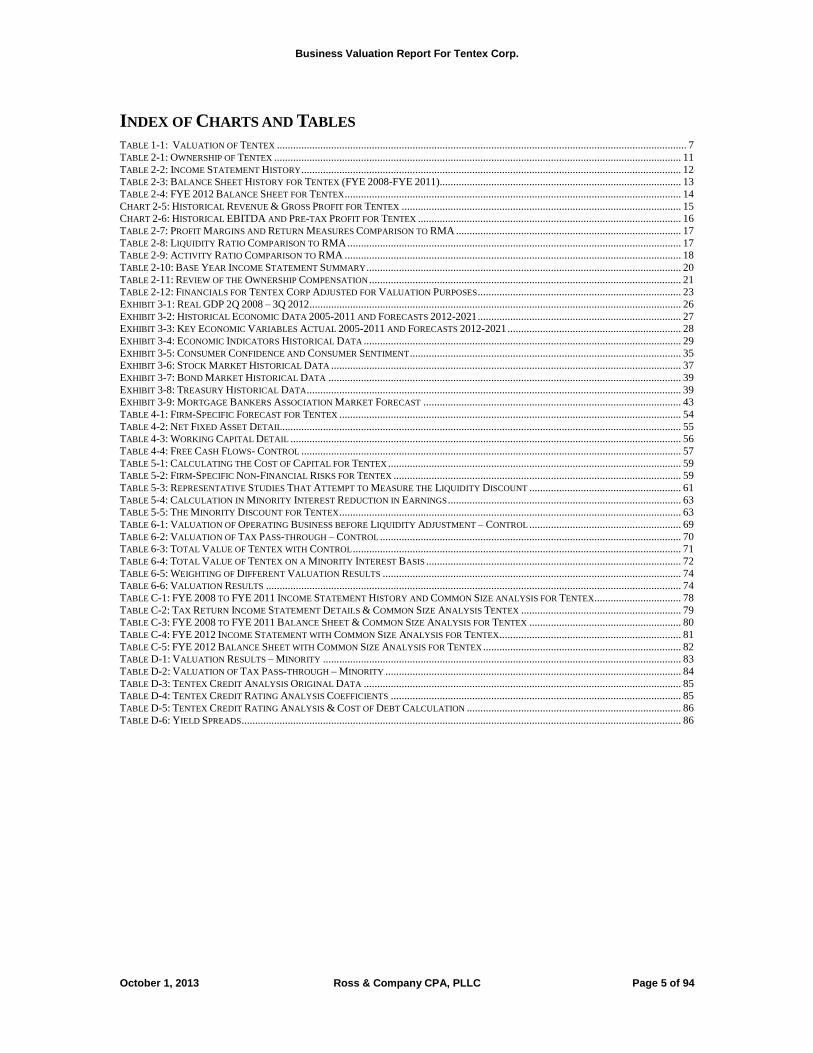
INDEX OF CHARTS AND TABLES
TABLE 1-1: VALUATION OF TENTEX ....................................................................................................................................................... 7 TABLE 2-1: OWNERSHIP OF TENTEX ...................................................................................................................................................... 11 TABLE 2-2: INCOME STATEMENT HISTORY ............................................................................................................................................ 12 TABLE 2-3: BALANCE SHEET HISTORY FOR TENTEX (FYE 2008-FYE 2011)......................................................................................... 13 TABLE 2-4: FYE 2012 BALANCE SHEET FOR TENTEX ............................................................................................................................ 14 CHART 2-5: HISTORICAL REVENUE & GROSS PROFIT FOR TENTEX ....................................................................................................... 15 CHART 2-6: HISTORICAL EBITDA AND PRE-TAX PROFIT FOR TENTEX ................................................................................................. 16 TABLE 2-7: PROFIT MARGINS AND RETURN MEASURES COMPARISON TO RMA ................................................................................... 17 TABLE 2-8: LIQUIDITY RATIO COMPARISON TO RMA ........................................................................................................................... 17 TABLE 2-9: ACTIVITY RATIO COMPARISON TO RMA ............................................................................................................................ 18 TABLE 2-10: BASE YEAR INCOME STATEMENT SUMMARY .................................................................................................................... 20 TABLE 2-11: REVIEW OF THE OWNERSHIP COMPENSATION ................................................................................................................... 21 TABLE 2-12: FINANCIALS FOR TENTEX CORP ADJUSTED FOR VALUATION PURPOSES ........................................................................... 23 EXHIBIT 3-1: REAL GDP 2Q 2008 – 3Q 2012 ......................................................................................................................................... 26 EXHIBIT 3-2: HISTORICAL ECONOMIC DATA 2005-2011 AND FORECASTS 2012-2021 ........................................................................... 27 EXHIBIT 3-3: KEY ECONOMIC VARIABLES ACTUAL 2005-2011 AND FORECASTS 2012-2021 ................................................................ 28 EXHIBIT 3-4: ECONOMIC INDICATORS HISTORICAL DATA ..................................................................................................................... 29 EXHIBIT 3-5: CONSUMER CONFIDENCE AND CONSUMER SENTIMENT .................................................................................................... 35 EXHIBIT 3-6: STOCK MARKET HISTORICAL DATA ................................................................................................................................. 37 EXHIBIT 3-7: BOND MARKET HISTORICAL DATA .................................................................................................................................. 39 EXHIBIT 3-8: TREASURY HISTORICAL DATA .......................................................................................................................................... 39 EXHIBIT 3-9: MORTGAGE BANKERS ASSOCIATION MARKET FORECAST ............................................................................................... 43 TABLE 4-1: FIRM-SPECIFIC FORECAST FOR TENTEX .............................................................................................................................. 54 TABLE 4-2: NET FIXED ASSET DETAIL ................................................................................................................................................... 55 TABLE 4-3: WORKING CAPITAL DETAIL ................................................................................................................................................ 56 TABLE 4-4: FREE CASH FLOWS- CONTROL ............................................................................................................................................ 57 TABLE 5-1: CALCULATING THE COST OF CAPITAL FOR TENTEX ............................................................................................................ 59 TABLE 5-2: FIRM-SPECIFIC NON-FINANCIAL RISKS FOR TENTEX .......................................................................................................... 59 TABLE 5-3: REPRESENTATIVE STUDIES THAT ATTEMPT TO MEASURE THE LIQUIDITY DISCOUNT ........................................................ 61 TABLE 5-4: CALCULATION IN MINORITY INTEREST REDUCTION IN EARNINGS ...................................................................................... 63 TABLE 5-5: THE MINORITY DISCOUNT FOR TENTEX .............................................................................................................................. 63 TABLE 6-1: VALUATION OF OPERATING BUSINESS BEFORE LIQUIDITY ADJUSTMENT – CONTROL ........................................................ 69 TABLE 6-2: VALUATION OF TAX PASS-THROUGH – CONTROL ............................................................................................................... 70 TABLE 6-3: TOTAL VALUE OF TENTEX WITH CONTROL ......................................................................................................................... 71 TABLE 6-4: TOTAL VALUE OF TENTEX ON A MINORITY INTEREST BASIS .............................................................................................. 72 TABLE 6-5: WEIGHTING OF DIFFERENT VALUATION RESULTS .............................................................................................................. 74 TABLE 6-6: VALUATION RESULTS ......................................................................................................................................................... 74 TABLE C-1: FYE 2008 TO FYE 2011 INCOME STATEMENT HISTORY AND COMMON SIZE ANALYSIS FOR TENTEX................................ 78 TABLE C-2: TAX RETURN INCOME STATEMENT DETAILS & COMMON SIZE ANALYSIS TENTEX ........................................................... 79 TABLE C-3: FYE 2008 TO FYE 2011 BALANCE SHEET & COMMON SIZE ANALYSIS FOR TENTEX ........................................................ 80 TABLE C-4: FYE 2012 INCOME STATEMENT WITH COMMON SIZE ANALYSIS FOR TENTEX ................................................................... 81 TABLE C-5: FYE 2012 BALANCE SHEET WITH COMMON SIZE ANALYSIS FOR TENTEX ......................................................................... 82 TABLE D-1: VALUATION RESULTS – MINORITY .................................................................................................................................... 83 TABLE D-2: VALUATION OF TAX PASS-THROUGH – MINORITY ............................................................................................................. 84 TABLE D-3: TENTEX CREDIT ANALYSIS ORIGINAL DATA ..................................................................................................................... 85 TABLE D-4: TENTEX CREDIT RATING ANALYSIS COEFFICIENTS ........................................................................................................... 85 TABLE D-5: TENTEX CREDIT RATING ANALYSIS & COST OF DEBT CALCULATION ............................................................................... 86 TABLE D-6: YIELD SPREADS .................................................................................................................................................................. 86

Business Valuation Report For Tentex Corp.
October 1, 2013 Ross & Company CPA, PLLC Page 6 of 94
IMPORTANT NOTICES
COPYRIGHT
All information and materials in this report are copyright 2013 Ross & Company CPA,
PLLC. All rights are reserved, except as noted below. Copyright in the text and
numerical information, in the layout of the information in this report, and in the graphical
displays of the information is owned by Ross & Company CPA, PLLC unless otherwise
indicated. The text, numerical, and graphical information in this report may not be
redistributed, copied, sold, transferred, or modified, without the express written
permission of Ross & Company CPA, PLLC.
LIMITED COPYRIGHT LICENSE
Ross & Company grants to the purchaser of this valuation service for Tentex Corp. a
limited copyright license to use this Business Valuation Report in support of the
purchaser’s activities for that company as long as the information in these reports is
attributed as “provided by Ross & Company CPA, PLLC.”
TERMS AND CONDITIONS
The business valuation result contained in this report is subject to the Appraisal
Certification, and Statement of Contingent and Limiting Conditions. Appendix E of this
report contains these documents.

Business Valuation Report For Tentex Corp
October 1, 2013 Ross & Company CPA, PLLC Page 7 of 94
SECTION 1: VALUATION SUMMARY
DESCRIPTION OF VALUATION ASSIGNMENT
Ross & Company CPA, PLLC, herein referred to as Ross & Company, has been
retained to determine the fair market value of Tentex Corp., hereinafter referred to as
Tentex. The purpose of the valuation is to establish an independent, arm’s length value
for use in gifting shares to related parties, consistent with IRS guidelines.
VALUATION FINDINGS
Using the discounted free cash flow method, Ross & Company estimates that the fair
market value of Tentex is equal to $12,659,662 as of September 30, 2012. We have
considered market multiple valuation results, but did not find any appropriate
comparables for use with this company. We also considered the net asset value of the
company based on the cost approach, but concluded that this approach was not
appropriate for this firm being valued as a going concern. These results are shown in
the table below.
Table 1-1: Valuation of Tentex
Source: Ross & Company
The value of the ownership equity, that is, the value remaining after all debts and other
long-term liabilities are paid, is $11,324,946. The fair market value of equity based on a
minority interest is $9,376,297. Robert Rogers’s 50% ownership interest, on a minority
equity basis, is $4,690,000.
Tentex Corp 9/30/2012
Total Fair Market Value of Firm $12,659,662
Less: Value of Debt and Other Liabilities $1,334,716
Value of Equity with Control $11,324,946
Minority Discount 17.21%
Loss of Value Due to Minority Discount $1,948,649
Minority Equity Value $9,376,297
Ownership % of Charles Rogers 50%
Value of Charles Rogers Minority Equity Interest $4,688,149
Value of Charles Rogers Minority Equity Interest (Rounded) $4,690,000

Business Valuation Report For Tentex Corp.
October 1, 2013 Ross & Company CPA, PLLC Page 8 of 94
VALUATION ASSIGNMENT TERMS AND CONDITIONS
Ross & Company is independent of Tentex and related organizations, and neither Ross
& Company nor I have any financial interest in the securities subject to appraisal. Our
fee for this valuation is in no way influenced by the result of our valuation conclusion.
This valuation report is prepared solely for the purpose stated herein.
The remaining sections and appendices further describe the analyses performed and the
conclusions reached during this valuation. The attached certification, limitation of
liability, statement of contingent and limited conditions, and my qualifications are integral
parts of this valuation opinion.
4/8/2013
_________________________________________________ ______________
Glen A. Ross, CPA & CVA Date

Business Valuation Report For Tentex Corp
October 1, 2013 Ross & Company CPA, PLLC Page 9 of 94
SECTION 2: THE VALUATION ASSIGNMENT
DESCRIPTION OF THE ENTITY BEING VALUED1
Tentex is a manufacturer and supplier of LED lighting in the commercial vehicle industry,
consumer and industrial markets. The company has its own staff of engineers, who
design the LED lights in the United States. The company then outsources the
manufacturing to facilities in Asia. Tentex sells its products through the Everest brand
name. The company’s products range from Stop, Tail & Turn (STT), Emergency, Interior
Cargo, Clearance, and Side Market LED Lamps, add on accessories, to off road lighting,
to a complete wire harness system for trucks, buses, trailers, medium and heavy duty
trucks. The company also has begun to offer a variety of in-home LED products under
its Everest Style brand name. These products include LED light bulbs, night lights, desk
lamps, and flashlights. Sales for the home market segment account for about 3% to 5%
of total sales at this time.
Tentex was incorporated on July 29, 1980 and elected S corporation status on July 1,
2007. The company is headquartered in Wantagh, NY and sells its products on a
national scale.
Industry Classification
The industry classification of the company for valuation purposes presents some
challenges, since the company outsources the manufacturing of most of its products.
Hence, it does not have the capital invested in manufacturing equipment that we would
generally see in a manufacturing company. It operates, to a large extent, as a value-
added distributor, and indeed, that is the business activity code that the company uses
on its federal tax return.
From the manufacturing perspective, the company could also be classified in
Semiconductor and Related Device Manufacturing, NAICS code 334413, since it
designs the products, and sells the end product to its customer base. The company
primarily sells auto and truck related parts, so it can also be classified as an auto parts
manufacturer or distributor.
For valuation purposes, we have primarily classified Tentex as a privately held company
operating primarily in the industry of Other Miscellaneous Nondurable Goods Merchant
Wholesalers, designated as industry number 424990 in the North American Industrial
Classification System (NAICS). This industry comprises establishments primarily
engaged in the merchant wholesale distribution of nondurable goods (except printing
1 www.Everest.com

Business Valuation Report For Tentex Corp.
October 1, 2013 Ross & Company CPA, PLLC Page 10 of 94
and writing paper; stationery and office supplies; industrial and personal service paper;
drugs and druggists' sundries; apparel, piece goods, and notions; grocery and related
products; farm product raw materials; chemical and allied products; petroleum and
petroleum products; beer, wine, and distilled alcoholic beverages; farm supplies; books,
periodicals and newspapers; flower, nursery stock and florists' supplies; tobacco and
tobacco products; and paint, varnishes, wallpaper, and supplies). The primary SIC code
for Tentex is 5199, described as Nondurable Goods, N.E.C.
We have also reviewed information on the industry of Semiconductor and Related
Device Manufacturing, designated as NAICS code 334413. This U.S. industry
comprises establishments primarily engaged in manufacturing semiconductors and
related solid state devices. Examples of products made by these establishments are
LED lights, integrated circuits, memory chips, microprocessors, diodes, transistors, solar
cells and other optoelectronic devices. The primary SIC code for this industry is 3674,
described as Semiconductors and Related Devices.
Information Sources
The financial information used in the valuation is based on the company’s U.S. Income
Tax Returns from Fiscal Year End (FYE) 2008 to FYE 2011; and the company’s financial
statements for FYE 2009 through FYE 2012, as reviewed by Fuller Lowenberg & Co.,
CPAs P.C. The company was incorporated in 1980 and has been an S type corporation
since July 1, 2007. Information about the current and projected operating conditions of
the company and possible areas of firm-specific risk has been provided by the
company’s management. Detailed financial information used for the discounted free
cash flow analysis is shown in Appendix C.
The company is located at 125 Marcum Court, Wantagh, NY. Geographical factors
based on the metropolitan statistical area data are used in this valuation analysis. For
Tentex, the factors for the Nassau-Suffolk, NY metropolitan statistical area have been
used.
Valuation Purpose
The purpose of the valuation is to establish an independent, arm’s length value for use in
gifting shares to related parties, consistent with IRS guidelines.
Valuation Key Assumption
A key assumption of this valuation is that the assets of Tentex, such as production
equipment, technology, patents, intangible assets, or real estate holdings, have no
greater value as standalone assets than they have as profit-generating assets for this
business. Based on the opinion of the company’s management and a review of their
financials, Ross & Company believes that this assumption is valid for this valuation.
Business Valuation Report For Tentex Corp.
October 1, 2013 Ross & Company CPA, PLLC Page 11 of 94
The valuation is for the income generated by the total entity from the main business
operations. We have reviewed the company’s financials for income generated by other
non-operating activities, for non-operating assets, and for the value of assets on the
balance sheet to determine if the net working capital is either below or in excess of the
amount needed for on-going operations. We have concluded that the level of net
working capital is consistent with the company’s operational needs and expected growth.
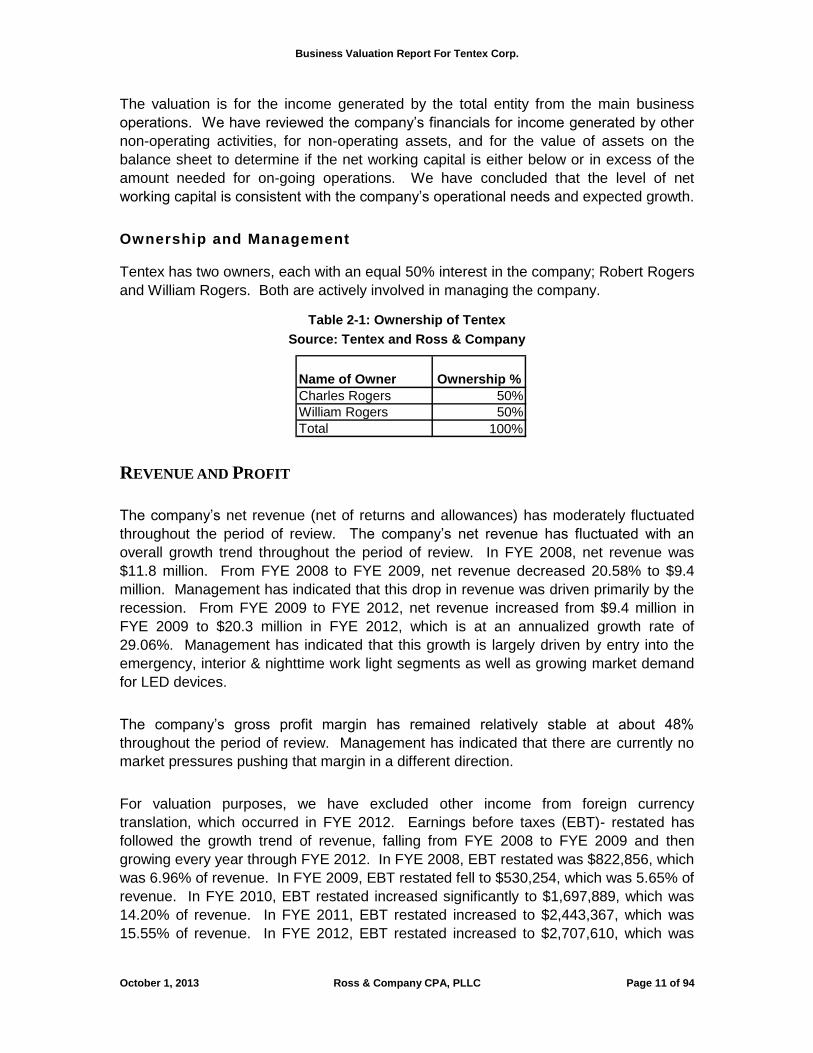
Ownership and Management
Tentex has two owners, each with an equal 50% interest in the company; Robert Rogers
and William Rogers. Both are actively involved in managing the company.
Table 2-1: Ownership of Tentex
Source: Tentex and Ross & Company
REVENUE AND PROFIT
The company’s net revenue (net of returns and allowances) has moderately fluctuated
throughout the period of review. The company’s net revenue has fluctuated with an
overall growth trend throughout the period of review. In FYE 2008, net revenue was
$11.8 million. From FYE 2008 to FYE 2009, net revenue decreased 20.58% to $9.4
million. Management has indicated that this drop in revenue was driven primarily by the
recession. From FYE 2009 to FYE 2012, net revenue increased from $9.4 million in
FYE 2009 to $20.3 million in FYE 2012, which is at an annualized growth rate of
29.06%. Management has indicated that this growth is largely driven by entry into the
emergency, interior & nighttime work light segments as well as growing market demand
for LED devices.
The company’s gross profit margin has remained relatively stable at about 48%
throughout the period of review. Management has indicated that there are currently no
market pressures pushing that margin in a different direction.
For valuation purposes, we have excluded other income from foreign currency
translation, which occurred in FYE 2012. Earnings before taxes (EBT)- restated has
followed the growth trend of revenue, falling from FYE 2008 to FYE 2009 and then
growing every year through FYE 2012. In FYE 2008, EBT restated was $822,856, which
was 6.96% of revenue. In FYE 2009, EBT restated fell to $530,254, which was 5.65% of
revenue. In FYE 2010, EBT restated increased significantly to $1,697,889, which was
14.20% of revenue. In FYE 2011, EBT restated increased to $2,443,367, which was
15.55% of revenue. In FYE 2012, EBT restated increased to $2,707,610, which was
Name of Owner Ownership %
Charles Rogers 50%
William Rogers 50%
Total 100%

Business Valuation Report For Tentex Corp.
October 1, 2013 Ross & Company CPA, PLLC Page 12 of 94
13.35% of revenue. The summary income statements for Tentex appear in the table
below. The detailed income statements appear in Appendix C.
Table 2-2: Income Statement History
Source: Tentex Tax Returns & Financial Statements
BALANCE SHEET
We have analyzed the company’s balance sheet from the company’s tax returns from
FYE 2008 to FYE 2011, shown in Table 2-3 and from the company’s financial
statements from FYE 2012, shown in Table 2-4. Detailed balance sheets are shown in
Appendix C.
Assets
The company’s total assets have fluctuated throughout the period of review, following
the general growth path of revenue. In FYE 2008, total assets were at their highest level
of $5.9 million. In FYE 2009, total assets fell to $4.3 million, largely driven by a decrease
in cash. Total assets have since increased to $5.2 million in FYE 2012. This growth has
largely been driven by an increase in accounts receivable and inventory. As of FYE
2012, the company has current assets of $4.8 million, consisting of $215,941 of cash,
$2,038,648 of accounts receivable and $2,542,305 of inventory.
The company’s fixed assets primarily consist of tooling, which is used to produce
finished products at manufacturing facilities in Asia. As of FYE 2012, net fixed assets
are $145,538.
The company has net intangible assets of $20,830, which consists of the capitalized
costs of purchasing and registering various trademarks and patents. The company also
has a federal tax deposit asset of $242,772.
Panor Corp
From
Financial
Statements
FYE 2012 FYE 2011 FYE 2010 FYE 2009 FYE 2008
Revenue 20,283,197$ 15,716,502$ 11,954,022$ 9,388,836$ 11,821,792$
% Change 29.06% 31.47% 27.32% -20.58% n/a
Cost of Goods Sold 10,537,293$ 8,061,143$ 6,218,071$ 4,983,517$ 6,107,653$
Gross Profit 9,745,904$ 7,655,359$ 5,735,951$ 4,405,319$ 5,714,139$
Gross Profit Margin 48.0% 48.7% 48.0% 46.9% 48.3%
Total Deductions 7,038,294$ 5,213,187$ 4,040,333$ 3,877,859$ 5,036,427$
Other Income (Expense) Included in
Valuation Analysis -$ 1,195$ 2,271$ 2,794$ 145,144$
Earnings Before Taxes (EBT) - Restated 2,707,610$ 2,443,367$ 1,697,889$ 530,254$ 822,856$
EBT- Restated Margin 13.35% 15.55% 14.20% 5.65% 6.96%
Other Income (Expense) Excluded from
Valuation Analysis (653)$ -$ -$ -$ -$
Earnings Before Taxes (EBT) 2,706,957$ 2,443,367$ 1,697,889$ 530,254$ 822,856$
EBT Margin 13.3% 15.5% 14.2% 5.6% 7.0%
From Tax Returns

Business Valuation Report For Tentex Corp.
October 1, 2013 Ross & Company CPA, PLLC Page 13 of 94
Table 2-3: Balance Sheet History for Tentex (FYE 2008-FYE 2011)
Source: Tentex Tax Returns
Liabilities
The company’s current liabilities have decreased significantly throughout the period of
review from $5.9 million in FYE 2008 to $3.4 million FYE 2011, according to the
company’s tax returns. This decline is largely driven by a decrease in accounts payable
and due to affiliate. On the financial statements, in FYE 2012, the due to affiliate was
classified as a long term debt. As of FYE 2012, current liabilities were $2,356,194,
which consisted of $2,288,326 off accounts payable, $18,703 of current portion of long-
term liabilities, $45,000 of retirement plan payable, and $4,165 of sales tax payable.
As of FYE 2012, the company has $1,316,013 in long term debt, of which $1,308,221 is
a loan payable to related party.
Concepts
Line Assets FYE 2011 FYE 2010 FYE 2009 FYE 2008
1 Cash $688,969 $1,259,803 $1,476,178 $2,168,488
2a
Trade notes and accounts
receivable $1,773,619 $1,256,986 $863,470 $1,039,230
2c
Net Trade notes and accounts
receivable $1,773,619 $1,256,986 $863,470 $1,039,230
3 Inventories $2,091,805 $1,999,373 $1,514,816 $2,104,465
6 Other current assets $147,669 $42,575 $80,346 $19,255
7 Loans to shareholders $0 $8,925 $7,416 $94,049
10a
Buildings and other depreciable
assets $2,142,244 $2,067,646 $2,061,302 $2,056,110
10b Less accumulated depreciation $1,969,270 $1,839,248 $1,754,342 $1,657,388
10c
Net Buildings and other
depreciable assets $172,974 $228,398 $306,960 $398,722
13a-c
Intangible assets (amortizable
only) $248,470 $248,470 $248,470 $248,470
13b-c Less accumulated amortization $217,532 $202,980 $188,340 $173,055
13b-d Net Intangible Assets $30,938 $45,490 $60,130 $75,415
14 Other assets $0 $0 $0 $0
15 Total Assets $4,905,974 $4,841,550 $4,309,316 $5,899,624
Liabilities and Shareholder's Equity
16 Accounts payable $1,192,608 $2,098,353 $1,558,766 $2,185,404
17
Mortgages, notes, bonds
payable in less than 1 year $18,703 $24,488 $23,939 $20,106
18 Other current liabilities $2,228,025 $2,494,605 $2,743,419 $3,691,883
20
Mortgages, notes, bonds
payable in 1 year or more $26,495 $0 $24,489 $46,675
22 Capital stock $70 $70 $70 $70
23 Additional paid-in capital $2,200,000 $1,100,000 $1,100,000 $1,100,000
24 Retained earnings ($759,927) ($875,966) ($1,141,367) ($1,144,514)
27
Total liabilities and
shareholders' equity $4,905,974 $4,841,550 $4,309,316 $5,899,624
End of Tax Year
Business Valuation Report For Tentex Corp.
October 1, 2013 Ross & Company CPA, PLLC Page 14 of 94
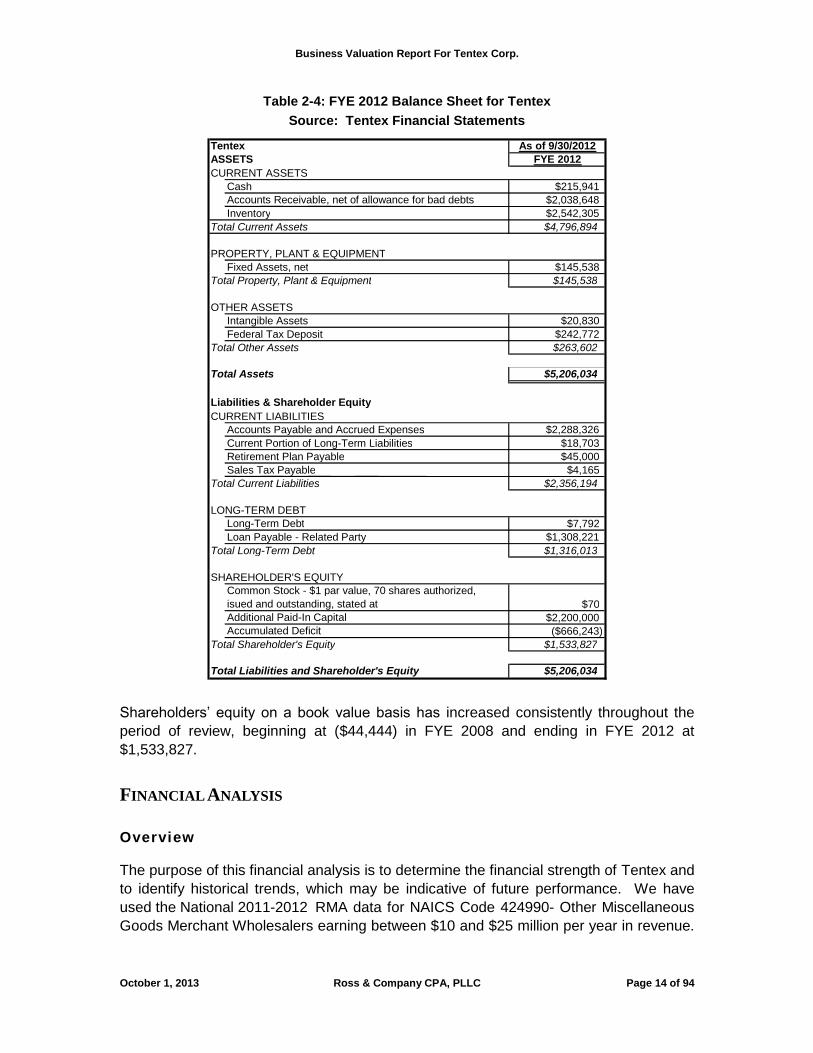
Table 2-4: FYE 2012 Balance Sheet for Tentex
Source: Tentex Financial Statements
Shareholders’ equity on a book value basis has increased consistently throughout the
period of review, beginning at ($44,444) in FYE 2008 and ending in FYE 2012 at
$1,533,827.
FINANCIAL ANALYSIS
Overview
The purpose of this financial analysis is to determine the financial strength of Tentex and
to identify historical trends, which may be indicative of future performance. We have
used the National 2011-2012 RMA data for NAICS Code 424990- Other Miscellaneous
Goods Merchant Wholesalers earning between $10 and $25 million per year in revenue.
Tentex As of 9/30/2012
ASSETS FYE 2012
CURRENT ASSETS
Cash $215,941
Accounts Receivable, net of allowance for bad debts $2,038,648
Inventory $2,542,305
Total Current Assets $4,796,894
PROPERTY, PLANT & EQUIPMENT
Fixed Assets, net $145,538
Total Property, Plant & Equipment $145,538
OTHER ASSETS
Intangible Assets $20,830
Federal Tax Deposit $242,772
Total Other Assets $263,602
Total Assets $5,206,034
Liabilities & Shareholder Equity
CURRENT LIABILITIES
Accounts Payable and Accrued Expenses $2,288,326
Current Portion of Long-Term Liabilities $18,703
Retirement Plan Payable $45,000
Sales Tax Payable $4,165
Total Current Liabilities $2,356,194
LONG-TERM DEBT
Long-Term Debt $7,792
Loan Payable - Related Party $1,308,221
Total Long-Term Debt $1,316,013
SHAREHOLDER'S EQUITY
Common Stock - $1 par value, 70 shares authorized,
isued and outstanding, stated at $70
Additional Paid-In Capital $2,200,000
Accumulated Deficit ($666,243)
Total Shareholder's Equity $1,533,827
Total Liabilities and Shareholder's Equity $5,206,034

Business Valuation Report For Tentex Corp.
October 1, 2013 Ross & Company CPA, PLLC Page 15 of 94
The RMA data was collected in 2011, so we refer to these values in the tables as RMA
2011.
Historic Revenue and Gross Profit
In the chart below, we have examined the company’s financial performance based on
the net revenue and gross profit as reported in the tax returns from FYE 2008 to FYE
2011 and the company’s FYE 2012 financial statements.
Chart 2-5: Historical Revenue & Gross Profit for Tentex
Source: Tentex Financial Information
Since FYE 2009, Tentex has exhibited a growth trend in revenue and gross profit.
Historic Profitability
The company’s historical EBITDA and pre-tax profit before adjustments for valuation
purposes are shown in graph form below.

Business Valuation Report For Tentex Corp.
October 1, 2013 Ross & Company CPA, PLLC Page 16 of 94
Chart 2-6: Historical EBITDA and Pre-tax Profit for Tentex
Source: Tentex Financial Information
Before adjustments for one-time events, technical accounting issues, and owner
discretionary items, both the company’s EBITDA and pre-tax profit exhibited an
increasing trend throughout the period of review.
Over the five years of review, Tentex averaged a gross margin of 48.00%, which
surpassed the RMA benchmark of 27.6%. The company’s operating margin has
increased from 6.83% in FYE 2008 to 13.35% in FYE 2012. Their average operating
margin, of 11.11%, over the period of review is well above the industry benchmark of
4.40%.
Since Tentex has aspects of a manufacturing operation and a wholesale distribution
business, it makes sense that the business has a higher gross profit margin than the
broad industry benchmarks.

Business Valuation Report For Tentex Corp.
October 1, 2013 Ross & Company CPA, PLLC Page 17 of 94
Table 2-7: Profit Margins and Return Measures Comparison to RMA
Source: Tentex Financial Information and RMA Data
Liquidity Ratios
Liquidity Ratios indicate a company’s ability to pay off its short term debts, and thus can
be used to help determine the overall level of riskiness of the company. Generally higher
ratios indicate an overall safer company; however these ratios are relatively industry
dependent. A summary of Tentex’s liquidity ratios over time and the benchmark RMA
ratios for 2011 appear in the table below.
Table 2-8: Liquidity Ratio Comparison to RMA
Source: Tentex Financial Information and RMA Data
From the table above we can see that over the last five years, the company’s current
ratio has improved significantly. Its average of 1.24 is slightly better than the RMA low
benchmark. The company has a moderate quick ratio, which indicates that the company
likely maintains sufficient means of paying off short term obligations.
Activity Ratios
Tentex has an average days in stock metric of 64.31, which is slightly above the median
RMA benchmark, indicating that the company is efficiently turning over its inventory.
The company’s average days sales outstanding is 36.38, which is slightly lower than the
median RMA benchmark, indicating that the company is collecting its receivables in a
timely manner. The company’s average days payables outstanding of 59.82, is higher
than the RMA low benchmark of 52.90, indicating that other firms in the industry pay off
2011 RMA Benchmarks
for Other Miscellaneous Nondurable Goods
Merchant Wholesalers
RMA - 2011 Med FYE 2008 FYE 2009 FYE 2010 FYE 2011 FYE 2012 Average
Return on Sales Ratios
Gross Margin 27.6% 48.34% 46.92% 47.98% 48.71% 48.05% 48.00% Operating Margin 4.4% 6.83% 5.64% 14.20% 15.54% 13.35% 11.11%
Tentex Corp
RMA -
2011
High
RMA -
2011
Med
RMA -
2011
Low
FYE
2007
FYE
2008
FYE
2009
FYE
2010
FYE
2011 Average
Liquidity Ratios
Current Ratio 2.4 1.6 1.2 0.91 0.91 0.99 1.37 2.04 1.24
Quick Ratio 1.4 0.90 0.5 0.91 0.91 0.99 0.72 0.96 0.90
Tentex Corp
2011 RMA Benchmarks for
Other Miscellaneous
Nondurable Goods
Merchant Wholesalers

Business Valuation Report For Tentex Corp.
October 1, 2013 Ross & Company CPA, PLLC Page 18 of 94
their suppliers in a more timely manner. The company’s average cash conversion cycle
of 40.87, is between the RMA median and high benchmarks.
Table 2-9: Activity Ratio Comparison to RMA
Source: Tentex Financial Information and RMA Data
Summary of Financial Analysis
Overall, Tentex appears to have stable financial performance. The company is
significantly more profitable than its benchmark peers, has a solid liquidity track record,
and has activity ratios which indicate that the business is operating efficiently. Overall,
we believe that the results from this analysis are indicative of low levels of financial risk
for this company.
Determining the Valuation Base Year
Academic research shows that the most recent year is generally the best starting point
for forecasting future earnings compared to establishing a normalized value as the
starting point. Academics have researched whether starting with the last year of
earnings or normalizing earnings in some way makes any difference to the accuracy of
forecasting future firm earnings. Normalizing a data series can take several forms but
however it is done, a normalized value as a starting point is the result of an averaging
process of some type. Research by Elton and Gruber2, Ball and Watts3 and Lieber and
Ronen4, seem to support the conclusion that how the earnings starting point is defined
does not make all that much difference. These results suggest that using the firm’s last
year of earnings as a starting point for any analysis is consistent with properly
forecasting future cash flows.
Based on our review of company financials and the company’s growth trajectory since
FYE 2009, we have determined that the FYE 2012 financials are the most reasonable
2Elton, Edwin J., and Gruber, Martin. “Earnings Estimation and the Accuracy of Expectational Data,”
Management Science, 18, No. 2 (April, 1972), pp. 409-424 3 Ball, Ray, and Watts, Ross. “Some Time Series Properties of Accounting Numbers, Journal of Finance,
27 (June, 1972), pp.663-681 4 Lieber, Zvi, and Ronen, Joshua, “Earnings Estimates and Historical Data”, Unpublished Manuscript, Ross
Center, New York University
RMA - 2011 High
RMA - 2011 Med
RMA - 2011 Low
FYE 2008
FYE 2009
FYE 2010
FYE 2011
FYE 2012 Average
Short-Term Operating Activity Ratios
Cost of Sales/Inventory 14.70 6.20 3.30 5.62 6.20 5.98 7.51 4.14 5.89 Average Days in Stock 24.83 58.87 110.61 64.98 58.89 61.05 48.58 88.06 64.31 Average Days Sales Outstanding 26.84 38.02 52.90 32.09 33.57 38.38 41.19 36.69 36.38 Payables Turnover 18.90 10.60 6.90 5.41 6.02 5.70 13.18 4.60 6.98 Average Days Payables Outstanding 19.31 34.43 52.90 67.47 60.60 64.07 27.70 79.27 59.82 Cash Conversion Cycle 32.36 62.46 110.61 29.59 31.86 35.36 62.07 45.48 40.87
2011 RMA Benchmarks for Other Miscellaneous Nondurable Goods
Merchant Wholesalers
Tentex Corp

Business Valuation Report For Tentex Corp.
October 1, 2013 Ross & Company CPA, PLLC Page 19 of 94
base year for a valuation as of September 30, 2012. The base year financials appear in
the table below.
Business Valuation Report For Tentex Corp.
October 1, 2013 Ross & Company CPA, PLLC Page 20 of 94
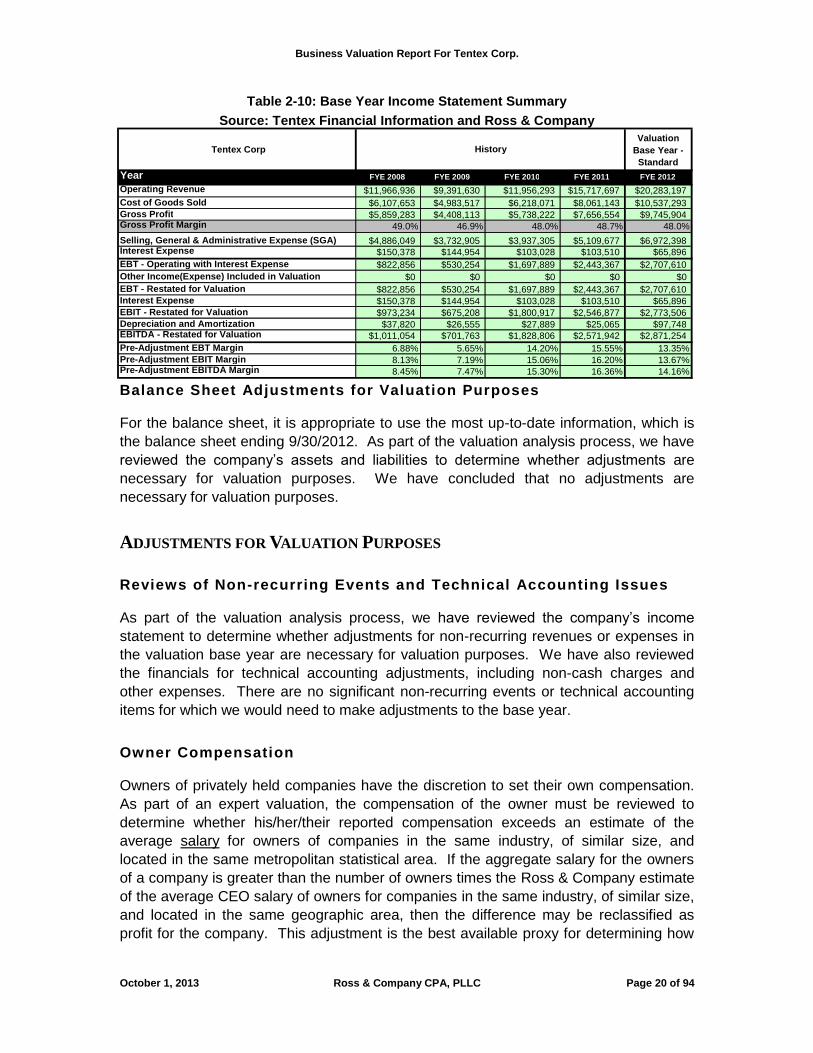
Table 2-10: Base Year Income Statement Summary
Source: Tentex Financial Information and Ross & Company
Balance Sheet Adjustments for Valuation Purposes
For the balance sheet, it is appropriate to use the most up-to-date information, which is
the balance sheet ending 9/30/2012. As part of the valuation analysis process, we have
reviewed the company’s assets and liabilities to determine whether adjustments are
necessary for valuation purposes. We have concluded that no adjustments are
necessary for valuation purposes.
ADJUSTMENTS FOR VALUATION PURPOSES
Reviews of Non-recurring Events and Technical Accounting Issues
As part of the valuation analysis process, we have reviewed the company’s income
statement to determine whether adjustments for non-recurring revenues or expenses in
the valuation base year are necessary for valuation purposes. We have also reviewed
the financials for technical accounting adjustments, including non-cash charges and
other expenses. There are no significant non-recurring events or technical accounting
items for which we would need to make adjustments to the base year.
Owner Compensation
Owners of privately held companies have the discretion to set their own compensation.
As part of an expert valuation, the compensation of the owner must be reviewed to
determine whether his/her/their reported compensation exceeds an estimate of the
average salary for owners of companies in the same industry, of similar size, and
located in the same metropolitan statistical area. If the aggregate salary for the owners
of a company is greater than the number of owners times the Ross & Company estimate
of the average CEO salary of owners for companies in the same industry, of similar size,
and located in the same geographic area, then the difference may be reclassified as
profit for the company. This adjustment is the best available proxy for determining how
Tentex Corp Valuation
Base Year - Standard
Year FYE 2008 FYE 2009 FYE 2010 FYE 2011 FYE 2012
Operating Revenue $11,966,936 $9,391,630 $11,956,293 $15,717,697 $20,283,197 Cost of Goods Sold $6,107,653 $4,983,517 $6,218,071 $8,061,143 $10,537,293 Gross Profit $5,859,283 $4,408,113 $5,738,222 $7,656,554 $9,745,904 Gross Profit Margin 49.0% 46.9% 48.0% 48.7% 48.0%
Selling, General & Administrative Expense (SGA) $4,886,049 $3,732,905 $3,937,305 $5,109,677 $6,972,398 Interest Expense $150,378 $144,954 $103,028 $103,510 $65,896 EBT - Operating with Interest Expense $822,856 $530,254 $1,697,889 $2,443,367 $2,707,610 Other Income(Expense) Included in Valuation $0 $0 $0 $0 $0 EBT - Restated for Valuation $822,856 $530,254 $1,697,889 $2,443,367 $2,707,610 Interest Expense $150,378 $144,954 $103,028 $103,510 $65,896 EBIT - Restated for Valuation $973,234 $675,208 $1,800,917 $2,546,877 $2,773,506 Depreciation and Amortization $37,820 $26,555 $27,889 $25,065 $97,748 EBITDA - Restated for Valuation $1,011,054 $701,763 $1,828,806 $2,571,942 $2,871,254 Pre-Adjustment EBT Margin 6.88% 5.65% 14.20% 15.55% 13.35% Pre-Adjustment EBIT Margin 8.13% 7.19% 15.06% 16.20% 13.67% Pre-Adjustment EBITDA Margin 8.45% 7.47% 15.30% 16.36% 14.16%
History
Business Valuation Report For Tentex Corp.
October 1, 2013 Ross & Company CPA, PLLC Page 21 of 94
much of owner compensation is market-determined salary, and how much, if any, is a
dividend for the owner(s).
Ross & Company has developed a database on CEO salaries (not including bonuses or
dividends) by industry and firm asset size class, starting with the latest available data
from the United States Bureau of Labor Statistics Occupational Employment Survey
(BLS-OES). Using a rigorous and consistent methodology, we have extrapolated, where
necessary, the BLS-OES data to cover our 980 plus NAICS-based sectors. The
information is further mapped using relevant target indicators by asset class by sector.
Finally, we apply the latest BLS-OES geographic differentials for CEO compensation to
adjust the compensation values for differences in pay levels across states and
metropolitan statistical areas. The resulting dataset has been checked for
reasonableness by asset class, industry, and location. The values generally reflect the
fact that owner salaries tend to be less for smaller than larger firms.
Owners of most privately-held firms pay themselves a sum that reflects both the cost of
their labor, what it would cost the firm to hire someone of equal skill to do what the
owner does, and a variable amount that reflects the return on the owner’s business
investment.
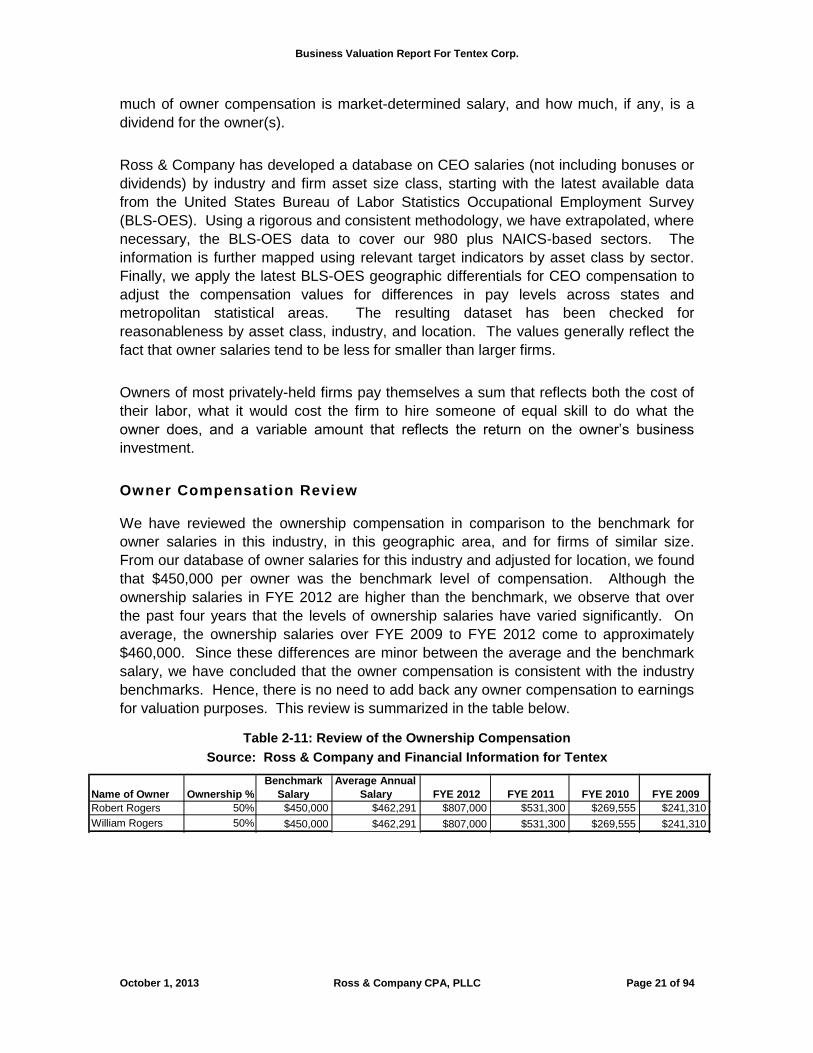
Owner Compensation Review
We have reviewed the ownership compensation in comparison to the benchmark for
owner salaries in this industry, in this geographic area, and for firms of similar size.
From our database of owner salaries for this industry and adjusted for location, we found
that $450,000 per owner was the benchmark level of compensation. Although the
ownership salaries in FYE 2012 are higher than the benchmark, we observe that over
the past four years that the levels of ownership salaries have varied significantly. On
average, the ownership salaries over FYE 2009 to FYE 2012 come to approximately
$460,000. Since these differences are minor between the average and the benchmark
salary, we have concluded that the owner compensation is consistent with the industry
benchmarks. Hence, there is no need to add back any owner compensation to earnings
for valuation purposes. This review is summarized in the table below.
Table 2-11: Review of the Ownership Compensation
Source: Ross & Company and Financial Information for Tentex
Name of Owner Ownership %
Benchmark
Salary
Average Annual
Salary FYE 2012 FYE 2011 FYE 2010 FYE 2009
Robert Rogers 50% $450,000 $462,291 $807,000 $531,300 $269,555 $241,310
William Rogers 50% $450,000 $462,291 $807,000 $531,300 $269,555 $241,310

Business Valuation Report For Tentex Corp.
October 1, 2013 Ross & Company CPA, PLLC Page 22 of 94
Other Owner Discretionary Adjustments for Valuation Purposes
As part of the valuation interview process, we have reviewed the company’s expenses
for possible areas of owner discretionary (i.e. not absolutely necessary for the
functioning of the business) spending in the following categories: family members on the
payroll paid above or below fair market wages; rent above or below market paid to
closely-controlled companies; company cars for the owners; and non-mandatory profit
sharing contributions to retirement plans. The “business necessary” test is whether a
new manager of this firm, independent of the owner, would reasonably make different
decisions about spending in these areas to maximize earnings. The company had
$20,353 in owners discretionary spending consisting of $20,253 of business gifts and
$100 of charitable contributions.
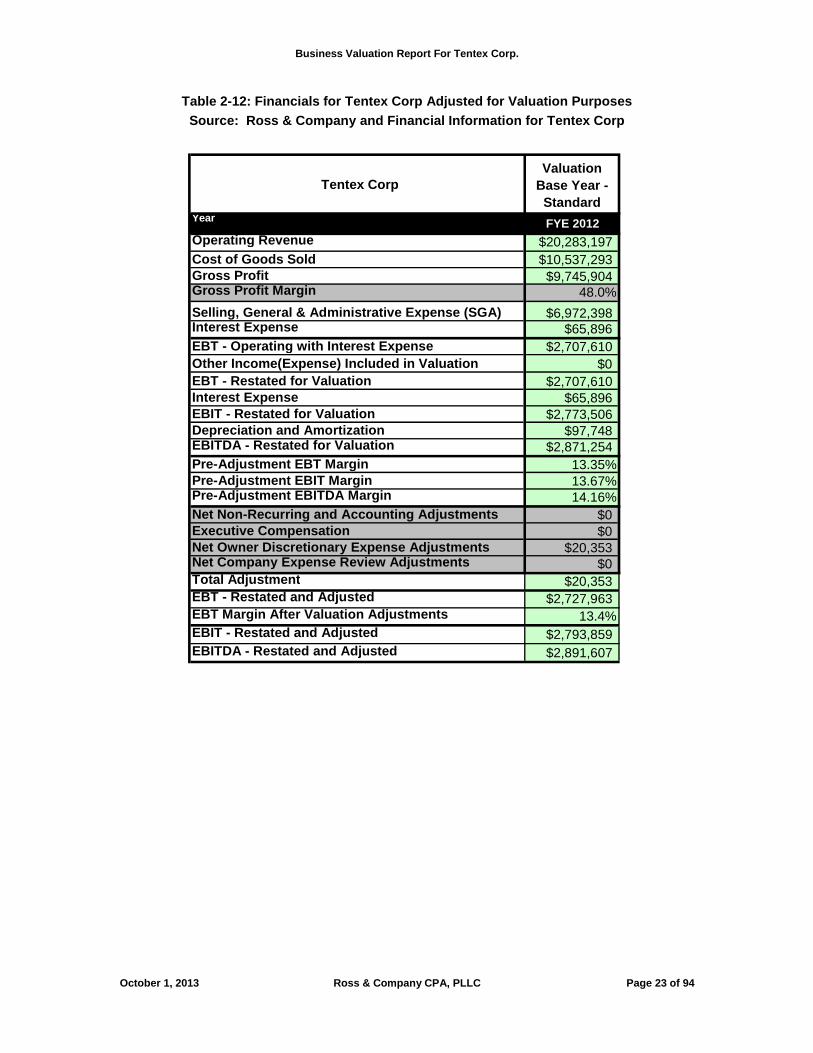
SUMMARY
From this review, we have determined that the appropriate source of data for the base
year is the last year of financials, which is FYE 2012. From these starting values, we
have made other adjustments to the financials for valuation purposes. These are
explained in the previous paragraphs. In the following table, we show the starting point
financial values of this firm and any adjustments to the financial results for valuation
purposes.
Business Valuation Report For Tentex Corp.
October 1, 2013 Ross & Company CPA, PLLC Page 23 of 94
Table 2-12: Financials for Tentex Corp Adjusted for Valuation Purposes
Source: Ross & Company and Financial Information for Tentex Corp
Tentex Corp
Valuation
Base Year -
Standard
Year FYE 2012
Operating Revenue $20,283,197
Cost of Goods Sold $10,537,293
Gross Profit $9,745,904
Gross Profit Margin 48.0%
Selling, General & Administrative Expense (SGA) $6,972,398
Interest Expense $65,896
EBT - Operating with Interest Expense $2,707,610
Other Income(Expense) Included in Valuation $0
EBT - Restated for Valuation $2,707,610
Interest Expense $65,896
EBIT - Restated for Valuation $2,773,506
Depreciation and Amortization $97,748
EBITDA - Restated for Valuation $2,871,254
Pre-Adjustment EBT Margin 13.35%
Pre-Adjustment EBIT Margin 13.67%
Pre-Adjustment EBITDA Margin 14.16%
Net Non-Recurring and Accounting Adjustments $0
Executive Compensation $0
Net Owner Discretionary Expense Adjustments $20,353
Net Company Expense Review Adjustments $0
Total Adjustment $20,353
EBT - Restated and Adjusted $2,727,963
EBT Margin After Valuation Adjustments 13.4%
EBIT - Restated and Adjusted $2,793,859
EBITDA - Restated and Adjusted $2,891,607
Business Valuation Report For Tentex Corp.
October 1, 2013 Ross & Company CPA, PLLC Page 24 of 94
SECTION 3: THE U.S. ECONOMIC OUTLOOK
In the following analysis, we have relied upon the BVR Economic Outlook Update
service and its 2012 Q3 report. These summaries provide an overview of selected
economic factors for the third quarter of 2012 and are then followed by a consensus
economic forecast.
BVR ECONOMIC OUTLOOK UPDATE: Q3 20125
The U.S. economy saw its growth rate accelerate slightly from last quarter. Many
questioned whether consumer spending, a crucial factor in GDP growth, could continue
to grow at its current rate as spending outpaces income growth. Business spending on
equipment and software, which had been a source of strength for 12 consecutive
quarters, finally ceased to grow. The consensus seems to be that there is little to
indicate economic growth is gaining momentum.
Job growth was fairly weak in the third quarter, though the unemployment rate did drop
below 8.0%. Unfortunately, the drop in the unemployment rate puts the rate back on par
with its level from January 2009. The White House took the decline in the unemployment
rate as evidence that the economy is continuing to heal, though they did admit that more
work still needs to be done to create more jobs. At this point, some experts believe that
the job market is showing signs of firming up—though they admit it is far from strong.
Consumer confidence reports were mixed this quarter. The Conference Board’s
Consumer Confidence Index was down from last quarter, while the Thomson
Reuters/University of Michigan Index of Consumer Sentiment surged to end the third
quarter up 15.6 points. Regardless, both indexes had a strong September, as a booming
stock market and rising home prices, coupled with declining personal debt levels,
overshadowed the high unemployment rate and consumers’ expectations that their
incomes will not keep pace with inflation.
Despite slow economic growth, domestically and abroad, stocks rallied this quarter, as
the Federal Reserve’s announcement of stimulus bolstered investor sentiment. All the
major indexes are up between 20.0% and 30.0% from a year ago. With market volatility
low, and assurance from the Federal Reserve, many investors moved out of bonds and
back into equities. Those that remained gravitated toward inflation-protected Treasuries, 5 All of the contents of the economic outlook section of this valuation report are quoted from the Economic
Outlook Update™ 3Q 2012 published by Business Valuation Resources, LLC, © 2012, reprinted with
permission. The editors and Business Valuation Resources, LLC, while considering the contents to be
accurate as of the date of publication of the Update, take no responsibility for the information contained
therein. Relation of this information to this valuation engagement is the sole responsibility of the author of
this valuation report.
Business Valuation Report For Tentex Corp.
October 1, 2013 Ross & Company CPA, PLLC Page 25 of 94
as the Fed’s announcement appeared to have caused some inflation concerns, leaving
nominal Treasuries flat for the quarter.
The Institute for Supply Management reported that, after three months, its manufacturing
sector index finally pulled above a level signifying contraction. The Federal Reserve also
reported that industrial production was down for the quarter. The Institute for Supply
Management’s services index increased this quarter, and indicates that the services
sector is increasing modestly.
The housing market continued to solidify. While existing-home sales dropped in
September, it was due to a lack of inventory. Seemingly in response to shrinking
inventory levels, privately-owned housing starts climbed nearly 35% from a year ago,
and housing permits authorized have soared about 45% from 12 months ago. The
National Association of Realtors reported that home prices are up more than 11% from a
year ago, and they believe that this upward trend will continue during the coming years.
GROSS DOMESTIC PRODUCT
The U.S. Department of Commerce reported that the nation's economy—as indicated by
GDP—increased at an annual rate of 2.0% in the third quarter. The third-quarter 2012
rate is a slight acceleration from the previous quarter’s rate of 1.3%. GDP is the total
market value of goods and services produced in the U.S. economy and is generally
considered the most comprehensive measure of economic growth.
Most economists expected sluggish economic growth in the third quarter, so few were
surprised by the GDP report. The Economic Policy Institute notes that the 2.0% rate of
growth in the third quarter is at a level that has historically never put any sustained
downward pressure on the unemployment rate. Unfortunately, the annual growth rate
has been 1.74% for the first nine months of this year, behind last year’s rate of 1.80%—
some economists believe that the economy would need to growth around 3.0% for a full
year to bring down the unemployment rate by one percentage point.
Many analysts noted that there was little in the GDP report to signal economic growth is
gaining momentum. Analysts pointed out that much of the GDP growth this quarter came
from large defense expenditures, and questioned whether steep defense spending
increases could be relied on in the future. Business spending on equipment and
software was flat in the third quarter. Analysts find this particularly worrisome because
this category of investment had been a source of strength in the U.S. economy for most
of the recovery, but has begun decelerating in the last year. Many point out that a near-
term reversal seems unlikely—unless there is a substantial increase in overall business
sales, it is doubtful that firms will need to expand capacity.
On a positive note, residential fixed investment contributed meaningfully to this quarter’s
growth rate, and shows no sign of reversing its strong contributions that have been seen
over the last year. While state and local government spending continued to drag down
Business Valuation Report For Tentex Corp.
October 1, 2013 Ross & Company CPA, PLLC Page 26 of 94
growth in the third quarter, this drag on GDP was far less than it had been in recent
quarters.
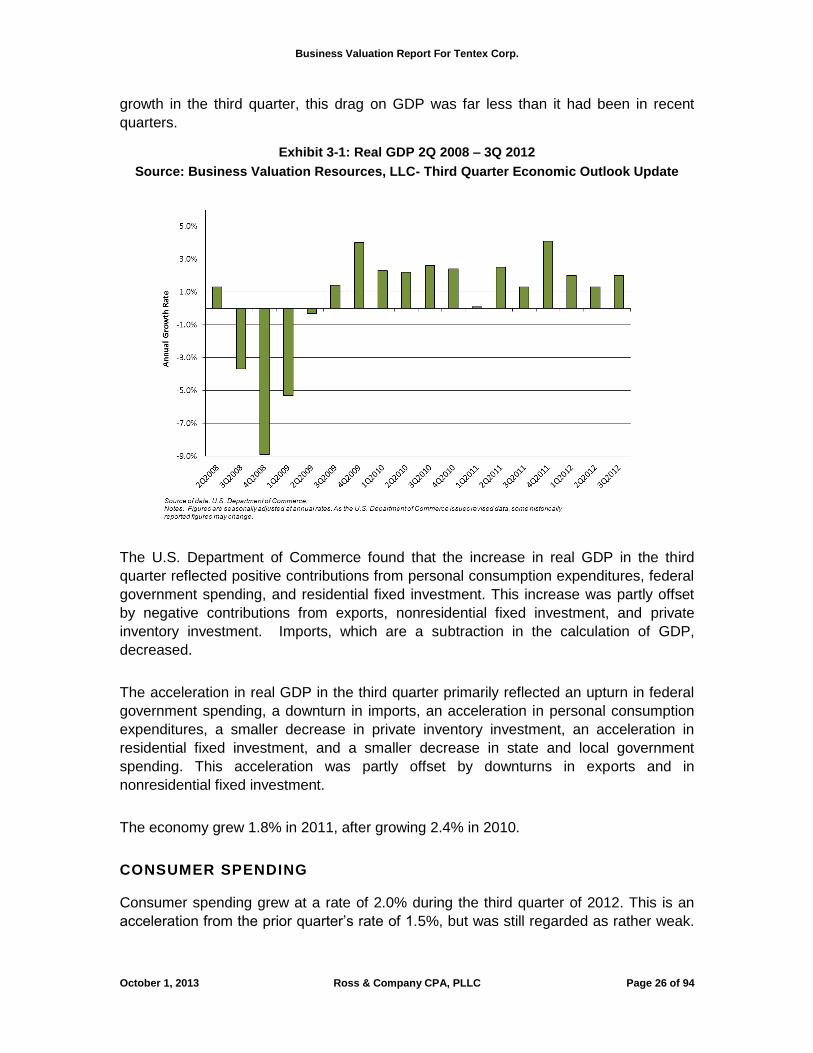
Exhibit 3-1: Real GDP 2Q 2008 – 3Q 2012
Source: Business Valuation Resources, LLC- Third Quarter Economic Outlook Update
The U.S. Department of Commerce found that the increase in real GDP in the third
quarter reflected positive contributions from personal consumption expenditures, federal
government spending, and residential fixed investment. This increase was partly offset
by negative contributions from exports, nonresidential fixed investment, and private
inventory investment. Imports, which are a subtraction in the calculation of GDP,
decreased.
The acceleration in real GDP in the third quarter primarily reflected an upturn in federal
government spending, a downturn in imports, an acceleration in personal consumption
expenditures, a smaller decrease in private inventory investment, an acceleration in
residential fixed investment, and a smaller decrease in state and local government
spending. This acceleration was partly offset by downturns in exports and in
nonresidential fixed investment.
The economy grew 1.8% in 2011, after growing 2.4% in 2010.
CONSUMER SPENDING
Consumer spending grew at a rate of 2.0% during the third quarter of 2012. This is an
acceleration from the prior quarter’s rate of 1.5%, but was still regarded as rather weak.

Business Valuation Report For Tentex Corp.
October 1, 2013 Ross & Company CPA, PLLC Page 27 of 94
Consumer spending—also referred to as personal consumption—accounts for
approximately 70% of the U.S. GDP.
Many economists question whether the consumer-spending rate of 2.0% in the third
quarter can even be sustained going forward. They note that inflation-adjusted
disposable income rose at only a 0.8% rate, while the personal savings rate fell from
4.0% to 3.7%. In a nutshell, personal consumption growth over the quarter was not
solely funded through rising household incomes, but with a decline in savings as well.
This quarter’s growth in consumer spending contributed 1.42 percentage points to the
third-quarter GDP.
Exhibit 3-2: Historical Economic Data 2005-2011 and Forecasts 2012-2021
Source: Business Valuation Resources, LLC- Third Quarter Economic Outlook Update HISTORICAL DATA CONSENSUS FORECASTS**
2005 2006 2007 2008 2009 2010 2011 2012 2013 2014 2015 2016 2017 2018-2021
Real GDP* 3.1 2.7 1.9 -0.3 -3.1 2.4 1.8 2.2 2.1 3.1 3.1 3.0 2.6 2.4
Industrial Production* 3.3 2.2 2.5 -3.5 -11.4 5.4 4.1 4.1 2.7 3.5 3.1 2.9 2.6 2.4
Personal Consumption* 3.4 2.9 2.3 -0.6 -1.9 1.8 2.5 1.9 2.0 2.7 2.7 2.7 2.5 2.3
Real Disposable Personal Income* 1.3 4.0 2.4 2.4 -2.3 1.8 1.2 1.6 1.5 2.9 2.8 2.9 2.7 2.4
Nonresidential Fixed Investment* 6.7 8.0 6.5 -0.8 -18.1 0.7 8.6 8.5 5.3 6.6 5.9 5.1 4.5 4.0
Nominal Pre-Tax Corp. Profits* 16.8 10.5 -6.1 -17.4 7.5 26.8 7.3 5.3 3.1 6.8 5.6 4.0 3.3 5.0
Total Government Spending* 0.3 1.4 1.3 2.6 3.7 0.6 -3.1 -1.9 -0.9 NA NA NA NA NA
Consumer Prices* 3.4 3.2 2.8 3.8 -0.4 1.6 3.2 2.0 2.0 2.2 2.3 2.3 2.3 2.3
3 Month Treasury Bill Rate 3.2 4.9 4.5 1.4 0.2 0.1 0.1 0.1 0.2 1.2 2.5 3.5 3.9 4.0
10 Year Treasury Bond Yield 4.3 4.8 4.6 3.7 3.3 3.2 2.8 1.8 2.5 3.6 4.2 4.8 5.2 5.2
Unemployment Rate 5.1 4.6 4.6 5.8 9.3 9.6 9.0 8.2 8.0 NA NA NA NA NA
Housing Starts (millions ) 2.068 1.801 1.355 0.906 0.554 0.587 0.609 0.750 0.900 NA NA NA NA NA
*Numbers are based on percent change from preceding period. Consumer Prices are the percent change between annual averages.
Historic Unemployment Rate, 3 Month Treasury Rate and 10 Year Treasury Yield are the annual averages.
Personal Consumption includes spending on services, durable, and nondurable goods.
Nonresidential Fixed Investment is also known as business spending.
Total Government Spending includes federal, state, and local government spending.
Every month, Consensus Economics surveys a panel of 30 prominent United States economic and financial forecasters for their predictions on a range of variables including future growth, inflation, current account
and budget balances, and interest rates.
Source of historical data: U.S. Department of Commerce, U.S. Department of Labor, U.S. Census Bureau and The Federal Reserve Board.
Notes:
Source of forecasts: Consensus Forecasts - USA, September 2011.
**Forecast numbers are based on percent change from preceding period (excludes Unemployment Rate, Housing Starts, 3 Month Treasury Rate and 10 Year Treasury Yield). Consumer Price Index information is the
percent change between annual averages. The 2012 through 2017 forecasts for the 3 Month Treasury Rate and 10 Year Treasury Yield are for the end of each period. Forecasts for 2018-2021 signify the average for
that period.
Overall consumer spending increased 2.5% in 2011, after growing 1.8% in 2010.
Consumer spending on durable goods—items meant to last three years or more, such
as computers, cars, and machinery—increased at a rate of 8.5% in the third quarter,
compared with a decreasing rate of 0.2% in the previous quarter. Consumer spending
on durable goods increased 7.2% in 2011 and 6.2% in 2010.
Consumer spending on nondurable goods—items such as food and gasoline—increased
at a rate of 2.4% this quarter, up from a rate of 0.6% last quarter. Consumer spending on
nondurable goods increased 2.3% in 2011 and 2010.
Service expenditures grew at a rate of 0.8% this quarter, a deceleration from 2.1% in the
previous quarter. Consumer spending on services increased 1.9% in 2011, after growing
1.0% in 2010.

Business Valuation Report For Tentex Corp.
October 1, 2013 Ross & Company CPA, PLLC Page 28 of 94
According to the U.S. Department of Commerce, total retail and food service sales in the
third quarter are up 1.4% from the previous quarter, and are up 5.4% from one year ago.
Automobile and parts sales increased 1.7% during the third quarter and 8.1% over the
last 12 months. Electronic and appliance store sales increased 1.7% this quarter and are
up 3.6% from a year ago. Gasoline station sales decreased 2.2% in the third quarter,
and are up 5.8% over the last 12 months. Food services and drinking places sales
increased 0.4% this quarter and 5.6% over the last 12 months. Grocery store sales
increased 0.9% this quarter and are up 3.8% from a year ago.
Exhibit 3-3: Key Economic Variables Actual 2005-2011 and Forecasts 2012-2021
Source: Business Valuation Resources, LLC- Third Quarter Economic Outlook Update

Business Valuation Report For Tentex Corp.
October 1, 2013 Ross & Company CPA, PLLC Page 29 of 94
Exhibit 3-4: Economic Indicators Historical Data
Source: Business Valuation Resources, LLC- Third Quarter Economic Outlook Update MONTHLY DATA
Oct-11 Nov-11 Dec-11 Jan-12 Feb-12 Mar-12 Apr-12 May-12 Jun-12 Jul-12 Aug-12 Sep-12
Real GDP 4.1 2.0 1.3 2.0
Personal Consumption 2.0 2.4 1.5 2.0
Nonresidential Fixed Investment 9.5 7.5 3.6 -1.3
Total Government Spending -2.2 -3.0 -0.7 3.7
Exports 1.4 4.4 5.3 -1.6
Imports 4.9 3.1 2.8 -0.2
CPI (1-month % Change) 0.0 0.1 0.0 0.2 0.4 0.3 0.0 -0.3 0.0 0.0 0.6 0.6
Unemployment Rate 9.0 8.6 8.5 8.3 8.3 8.2 8.1 8.2 8.2 8.3 8.1 7.8
PMI 51.8 52.2 53.1 54.1 52.4 53.4 54.8 53.5 49.7 49.8 49.6 51.5
NMI 52.6 52.6 53.0 56.8 57.3 56.0 53.5 53.7 52.1 52.6 53.7 55.1
Housing Starts (millions) 0.630 0.708 0.697 0.720 0.718 0.706 0.747 0.706 0.754 0.728 0.758 0.872
Building Permits (millions) 0.667 0.709 0.701 0.684 0.707 0.769 0.723 0.784 0.760 0.811 0.801 0.894
QUARTERLY DATA
4Q 08 1Q 09 2Q 09 3Q 09 4Q 09 1Q 10 2Q 10 3Q 10 4Q10 1Q11 2Q11 3Q11
Real GDP -8.9 -5.3 -0.3 1.4 4.0 2.3 2.2 2.6 2.4 0.1 2.5 1.3
Personal Consumption -5.1 -1.6 -1.8 2.1 0.0 2.5 2.6 2.5 4.1 3.1 1.0 1.7
Nonresidential Fixed Investment -22.9 -28.9 -17.5 -7.8 -6.4 2.1 12.3 7.7 9.2 -1.3 14.5 19.0
Total Government Spending 1.6 1.8 9.6 3.7 1.1 -3.1 2.8 -0.3 -4.4 -7.0 -0.8 -2.9
Exports -21.4 -28.7 0.6 13.8 24.0 5.9 9.6 9.7 10.0 5.7 4.1 6.1
Imports -14.9 -33.9 -15.9 17.2 19.3 10.4 20.2 13.9 0.0 4.3 0.1 4.7
CPI (3-month % Change) -3.4 0.5 1.0 0.5 0.7 0.1 -0.1 0.5 0.9 1.3 0.7 0.9
Unemployment Rate 7.2 8.5 9.5 9.8 10.0 9.7 9.5 9.6 9.4 8.8 9.2 9.1
Housing Starts (millions) 0.560 0.505 0.585 0.585 0.581 0.636 0.536 0.594 0.539 0.600 0.615 0.647
Building Permits (millions) 0.554 0.513 0.601 0.609 0.664 0.687 0.587 0.563 0.632 0.590 0.633 0.616
2002 2003 2004 2005 2006 2007 2008 2009 2010 2011
Real GDP 1.8 2.5 3.5 3.1 2.7 1.9 -0.3 -3.1 2.4 1.8
Personal Consumption 2.7 2.8 3.3 3.4 2.9 2.3 -0.6 -1.9 1.8 2.5
Nonresidential Fixed Investment -7.9 1.4 6.2 6.7 8.0 6.5 -0.8 -18.1 0.7 8.6
Total Government Spending 4.7 2.2 1.4 0.3 1.4 1.3 2.6 3.7 0.6 -3.1
Exports -2.0 1.6 9.5 6.7 9.0 9.3 6.1 -9.1 11.1 6.7
Imports 3.4 4.4 11.1 6.1 6.1 2.4 -2.7 -13.5 12.5 4.8
Consumer Price Index 1.6 2.3 2.7 3.4 3.2 2.8 3.8 -0.4 1.6 3.2
Unemployment Rate 5.8 6.0 5.6 5.1 4.6 4.6 5.8 9.3 9.6 9.0
Housing Starts (millions) 1.705 1.848 1.956 2.068 1.801 1.355 0.906 0.554 0.587 0.609
Building Permits (millions) 1.748 1.889 2.070 2.155 1.838 1.398 0.905 0.583 0.605 0.624
Notes: Yearly Consumer Price Index information is the percent change between annual averages. Yearly unemployment is the annual average rate.
Source of data: U.S. Department of Commerce, U.S. Department of Labor, U.S. Census Bureau The Federal Reserve Board, and the Institute of Supply Management.
As the Government issues revised data, some historical reported figures may have changed.
Personal Consumption includes spending on services, durable, and nondurable goods.
Government Spending includes federal, state, and local government spending.
Notes: Unemployment Rate is the rate for the last month of the quarter. Housing Starts and Building Permits are seasonally adjusted annual rates for the last month of the quarter.
The numbers in this table are seasonally adjusted at annual rates.
Notes: Real GDP and subcomponents data only availab le on a quarterly basis and therefore are quarterly figures. The numbers in this table are seasonally adjusted at annual rates.
PMI is the Institute of Supply Management's Manufacturing Index —any reading above 50.0% suggests growth in the manufacturing economy, whereas a reading below 50.0% indicates
contraction. NMI is the Institute of Supply Management's Non-Manufacturing Index which measures the strength of the services sector—any reading above 50.0% suggests growth,
whereas a reading below 50.0% indicates contraction.
YEARLY DATA
GOVERNMENT SPENDING
Total government spending grew at a rate of 3.7% in the third quarter, following eight
consecutive quarterly declines in government spending. This quarter’s increase in
government spending provided a 0.71 percentage point contribution to the third-quarter
GDP. Total government spending decreased by 3.1% in 2011, after growing 0.6% in
2010.
Business Valuation Report For Tentex Corp.
October 1, 2013 Ross & Company CPA, PLLC Page 30 of 94
Federal government spending increased at a rate of 9.6% in the third quarter, after
declining at a rate of 0.2% in the previous quarter. Federal government spending
declined by 2.8% in 2011, after growing 4.5% in 2010.
National defense spending decreased at rate of 13.0% this quarter, after decreasing at a
rate of 0.2% in the previous quarter. National defense spending declined 2.6% in 2011,
after increasing 3.0% in 2010.
State and local government spending declined at a rate of 0.1% in the third quarter, after
decreasing at a rate of 1.0% in the previous quarter. State and local government
spending declined 3.4% in 2011 and 1.8% in 2010.
FIXED INVESTMENTS
Business spending, also known as nonresidential fixed investment, decreased at a rate
of 1.3% in the third quarter. This quarter’s decrease comes after five straight quarterly
increases. Business spending contributed -0.13 percentage points to the third-quarter
GDP. Business spending increased 8.6% in 2011 and 0.7% in 2010.
Business spending on structures (nonresidential structures) decreased at an annual rate
of 4.4% in the third quarter. Business expenditures on equipment and software were
unchanged this quarter, after 12 consecutive quarterly increases.
Residential fixed investment, often considered a proxy for the housing market, increased
at an annual rate of 14.4% during the third quarter. This comes after a rate of 8.5% in
the previous quarter. This quarter’s growth in residential fixed investment made a 0.33
percentage point contribution to the second-quarter GDP. Residential fixed investment
declined 1.4% in 2011 and 3.7% in 2010.
BUSINESS INVENTORIES
Business investments in inventories decreased at a slower pace in the third quarter than
in the previous quarter. The change in private inventories subtracted 0.12 percentage
points from the third-quarter change in real GDP after subtracting 0.46 percentage points
from the second-quarter change. Farm inventories subtracted 0.42 percentage points
from the third-quarter change in GDP after subtracting 0.17 percentage points from the
second-quarter change. Nonfarm inventories added 0.30 percentage points to the third-
quarter change in GDP after subtracting 0.29 percentage points from the second-quarter
change.
EXPORTS AND IMPORTS
Net exports were a drag on growth this quarter, subtracting 0.18 percentage points from
the third-quarter GDP.

Business Valuation Report For Tentex Corp.
October 1, 2013 Ross & Company CPA, PLLC Page 31 of 94
Exports decreased at an annual rate of 1.6% in the third quarter, following last quarter’s
growing rate of 5.3%. Exports increased 6.7% in 2011 and 11.1% in 2010.
Foreign imports, which are a subtraction in the calculation of GDP, decreased at an
annual rate of 0.2% during the third quarter. This follows last quarter’s growth rate of
2.8%. Imports increased 4.8% in 2011 and 12.5% in 2010.
CONSUMER PRICES AND INFLATION RATES
According to the U.S. Department of Commerce, the price index for gross domestic
purchases, which measures prices paid by U.S. residents, increased 1.5% in the third
quarter, compared with an increase of 0.7% last quarter. Excluding food and energy
prices, the price index for gross domestic purchases increased 1.3% in the third quarter,
compared with an increase of 1.4% in the previous quarter.
The U.S. Department of Labor reported that the Consumer Price Index (CPI) increased
0.6% in September on a seasonally adjusted basis—tying August’s rise as the largest
increase since June 2009. CPI is a measure of a basket of products and services,
including housing, electricity, food, and transportation and is used as a measure of
inflation. Increasing gas prices fueled the CPI increase, with the gasoline index rising
7.0% in September after climbing 9.0% in August. The food index increased slightly,
mostly because of higher prices for dairy products and nonalcoholic beverages. Over the
last 12 months, CPI has climbed 2.0%.
Core consumer prices (Core CPI), a measure of inflation that excludes volatile food and
energy costs, increased 0.1% in September on a seasonally adjusted basis, after
increasing 0.1% in both August and July. Increases in the indexes for shelter, medical
care, apparel, and airline fares all contributed significantly to the September increase,
while the indexes for used cars and trucks, new vehicles, personal care, and household
furnishings all fell for the month. Core CPI has risen 2.0% over the last 12 months.
The U.S. Department of Labor reported that the Producer Price Index (PPI) increased
1.1% in September on a seasonally adjusted basis. PPI increased by 1.7% in August
and 0.3% in July. The increase in August was the largest increase since June 2009. The
index for energy, which increased 4.7% in September and 6.4% in August, was the main
driver of the PPI increases this quarter. The gasoline index accounted for over 80% of
September’s increase in the index for energy, though the indexes for diesel fuel and
residential natural gas also increased. The index for food moved up this quarter, mostly
because of rising dairy prices. PPI has increased 2.1% over the last 12 months.
Core producer prices (Core PPI)—which do not include volatile food and energy prices—
were unchanged in September. This increase came after increases of 0.2% in August
and 0.4% in July. September was the first time in nearly a year where Core PPI did not
increase. Declining prices for communication and related equipment offset higher prices
Business Valuation Report For Tentex Corp.
October 1, 2013 Ross & Company CPA, PLLC Page 32 of 94
for light motor trucks in September. In August, much of the PPI rise was attributed to
higher pharmaceutical prices.
ENERGY PRICES
The Energy Information Administration (EIA) reported that the spot price for a barrel of
West Texas Intermediate (WTI) crude oil was $92.18 at the end of the third quarter. This
is up from $85.04 per barrel at the end of last quarter. A year ago, the spot price for a
barrel of WTI crude oil was $78.93.
The regular retail gas price (conventional areas) was $3.78 per gallon at the end of the
third quarter. This is up from $3.38 per gallon at the end of last quarter. A year ago, the
regular retail gas price was $3.46 per gallon.
The Henry Hub natural gas spot price was $3.08 per million Btu (MMBtu) at the end of
the third quarter, up from $2.74 per MMBtu at the end of last quarter. A year ago, the
Henry Hub natural gas sport price was $3.68 per MMBtu.
INTEREST RATES
The Federal Open Market Committee (FOMC) met twice during the third quarter of 2012,
issuing two statements on its target for the federal funds rate. As expected, the FOMC
continued its pledge to keep its target for the federal funds rate near zero, at least
through mid-2015. The federal funds rate is the interest rate at which a commercial bank
lends immediately available funds in balances at the Federal Reserve to another
commercial bank. The FOMC establishes a target rate and expands or contracts the
money supply with the aim that the federal funds rate, a market rate, will approximate
the target rate.
The FOMC stated that the information it has received indicated that the economy has
been expanding moderately. The Committee expressed concern that growth in
employment has been slow, and that the unemployment rate remains high. Further,
while household spending has continued to grow, business spending has slowed. The
FOMC believes that the housing sector, while showing signs of improvement, is far from
booming. It notes that inflation has been subdued, although the prices of some key
commodities have increased recently, and that longer-term inflation expectations have
remained stable. It anticipates that inflation over the medium term likely will run at or
below its goal of 2%. The Committee expressed concern that future economic growth
might not be strong enough to create sustained improvement in labor market conditions,
and that strains in the global financial markets may impede U.S. economic growth.
During the third quarter of 2012, the Board of Governors of the Federal Reserve left the
discount rate unchanged at 0.75%. The discount rate is the interest rate a commercial
bank is charged to borrow funds, typically for a short period, directly from a Federal

Business Valuation Report For Tentex Corp.
October 1, 2013 Ross & Company CPA, PLLC Page 33 of 94
Reserve Bank. The board of directors of each Reserve Bank establishes the discount
rate every 14 days, subject to the approval of the Board of Governors.
UNEMPLOYMENT AND PERSONAL INCOME
The U.S. Department of Labor reported that the unemployment rate was 7.8% at the end
of the third quarter (or approximately 12.1 million unemployed), down from 8.2% at the
end of the second quarter. The unemployment rate had been higher than 8.0% since
February 2009, the longest stretch since monthly jobless figures were first compiled in
1948. The 7.8% matches the January 2009 rate, the month President Obama took
office. While the consensus is that the labor market is not robust, some economists
believe it is starting to firm up.
The economy added a relatively small 114,000 jobs in September, after adding 142,000
jobs in August and 181,100 jobs in July. In September, employment increased in
healthcare, with the sector seeing its strongest month since February. September
employment also increased in the transportation and warehousing sector, but changed
little in most other major industries. There were 4.8 million long-term unemployed (those
jobless for 27 weeks or more), which made up 40.1% of unemployed persons at the end
of September.
The White House Council of Economic Advisers, an agency within the Executive Office
of the President, stated that the September employment report provided further evidence
that the U.S. economy is continuing to heal. Regardless, they acknowledge that there is
more work that remains to be done. It emphasized the need to focus on the middle
class, and stated that the most pressing issue was for Congress to pass an extension of
the middle class tax cuts.
Average hourly earnings for all private-sector employees rose seven cents in
September, to $23.58. Average hourly earnings for all private-sector employees have
increased 1.8% over the past 12 months. Average hourly earnings for private-sector
production and nonsupervisory employees increased five cents in September, to $19.81.
Average hourly earnings for private-sector production and nonsupervisory employees
have increased 1.4% over the past 12 months.
The U.S. Department of Commerce reported that current-dollar personal income
increased $89.3 billion (2.7%) in the third quarter, compared with an increase of $130.3
billion (4.0%) in the previous quarter.
Personal current taxes increased $13.2 billion in the third quarter, compared with an
increase of $20.2 billion last quarter.
Disposable personal income increased $76.1 billion (2.6%) in the third quarter,
compared with an increase of $110.0 billion (3.8%) in the previous quarter. Real
Business Valuation Report For Tentex Corp.
October 1, 2013 Ross & Company CPA, PLLC Page 34 of 94
disposable personal income increased 0.8% in the third quarter, compared with an
increase of 3.1% in the previous quarter.
Personal outlays increased $111.4 billion (4.0%) in the third quarter, compared with an
increase of $57.4 billion (2.0%) last quarter. Personal saving—disposable personal
income less personal outlays—was $445.0 billion in the third quarter, compared with
$480.3 billion in the previous quarter.
The personal saving rate—saving as a percentage of disposable personal income—was
3.7% in the third quarter, down from 4.0% last quarter.
CONSUMER CONFIDENCE AND SENTIMENT
The Conference Board's Consumer Confidence Index stood at 68.4 at the end of the
third quarter, down from 73.2 at the end of prior quarter. Though the reading at the end
of this quarter was below that of last quarter, the index ended well up from a rough
August, where the index fell to 61.3. In September, the index benefited from consumers’
more positive assessment of current conditions, specifically the job market, as well as a
favorable short-term outlook for business conditions, employment, and personal financial
situations. Some economists attributed the higher-than-expected September increase to
several factors, including a rally in the stock markets in recent months and a turnaround
in the weak housing market. While consumers are more optimistic than they have been
in several months, it is not clear whether this confidence level will continue, given the
lingering high jobless rate.
The Consumer Confidence Index is an indicator designed to measure consumer
confidence, which is the degree of optimism on the state of the economy that consumers
are expressing through their activities of savings and spending. A month-on-month
decreasing trend in the Consumer Confidence Index suggests consumers have a
negative outlook on their ability to secure and retain good jobs, whereas a rising trend in
consumer confidence indicates improvements in consumer buying patterns. Opinions on
current conditions make up 40% of the index (the Present Situation Index), with
expectations of future conditions comprising the remaining 60% (the Expectations
Index).
The Thomson Reuters/University of Michigan’s Index of Consumer Sentiment increased
to 78.3 at the end of third quarter, from 73.2 at the end of last quarter. The index is well
up from one year ago when the reading was 59.5. At the end of the third quarter,
consumers said they expect the economy to create more jobs over the next year.
Consumers also reported small gains in their current financial situations, mostly because
of a reduction in their debt levels and an increase in the value of their assets, mainly in
the form of higher stock prices and home values. Unfortunately, the majority of
consumers anticipate very small wage gains. Consumers also expect to see a large
price increase in the year ahead, largely due to rising food and energy costs. Overall,
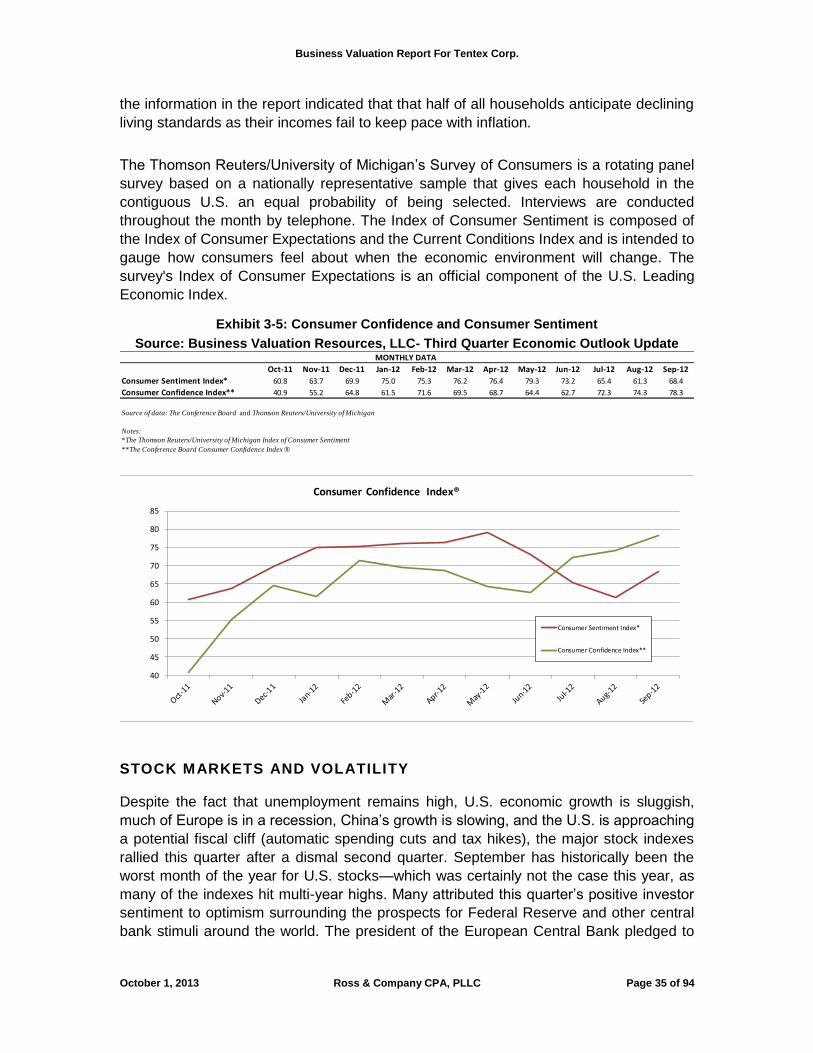
Business Valuation Report For Tentex Corp.
October 1, 2013 Ross & Company CPA, PLLC Page 35 of 94
the information in the report indicated that that half of all households anticipate declining
living standards as their incomes fail to keep pace with inflation.
The Thomson Reuters/University of Michigan’s Survey of Consumers is a rotating panel
survey based on a nationally representative sample that gives each household in the
contiguous U.S. an equal probability of being selected. Interviews are conducted
throughout the month by telephone. The Index of Consumer Sentiment is composed of
the Index of Consumer Expectations and the Current Conditions Index and is intended to
gauge how consumers feel about when the economic environment will change. The
survey's Index of Consumer Expectations is an official component of the U.S. Leading
Economic Index.
Exhibit 3-5: Consumer Confidence and Consumer Sentiment
Source: Business Valuation Resources, LLC- Third Quarter Economic Outlook Update MONTHLY DATA
Oct-11 Nov-11 Dec-11 Jan-12 Feb-12 Mar-12 Apr-12 May-12 Jun-12 Jul-12 Aug-12 Sep-12
Consumer Sentiment Index* 60.8 63.7 69.9 75.0 75.3 76.2 76.4 79.3 73.2 65.4 61.3 68.4
Consumer Confidence Index** 40.9 55.2 64.8 61.5 71.6 69.5 68.7 64.4 62.7 72.3 74.3 78.3
Source of data: The Conference Board and Thomson Reuters/University of Michigan
*The Thomson Reuters/University of Michigan Index of Consumer Sentiment
**The Conference Board Consumer Confidence Index ®
Notes:
40
45
50
55
60
65
70
75
80
85
Consumer Confidence Index®
Consumer Sentiment Index*
Consumer Confidence Index**
STOCK MARKETS AND VOLATILITY
Despite the fact that unemployment remains high, U.S. economic growth is sluggish,
much of Europe is in a recession, China’s growth is slowing, and the U.S. is approaching
a potential fiscal cliff (automatic spending cuts and tax hikes), the major stock indexes
rallied this quarter after a dismal second quarter. September has historically been the
worst month of the year for U.S. stocks—which was certainly not the case this year, as
many of the indexes hit multi-year highs. Many attributed this quarter’s positive investor
sentiment to optimism surrounding the prospects for Federal Reserve and other central
bank stimuli around the world. The president of the European Central Bank pledged to

Business Valuation Report For Tentex Corp.
October 1, 2013 Ross & Company CPA, PLLC Page 36 of 94
do “whatever it takes” to preserve the euro and stabilize the Eurozone, while the Federal
Reserve initiated another round of bond buying intended to keep interest rates low,
encourage economic growth, and reduce unemployment. Further, many believe the
relatively low market volatility this quarter encouraged investors to shift funds into the
stock market, helping to support the rally.
The Dow Jones Industrial Average (Dow) climbed 4.3% in the third quarter, and is up
10.0% year-to-date. The Dow has risen 23.1% over the last 12 months. The Dow is an
index of 30 of the largest and most widely held public companies in the U.S. and is
considered the single most watched index in the world.
The NASDAQ Composite Index (NASDAQ), consisting mainly of high-tech stocks,
ended the third quarter with a gain of 6.2%. The NASDAQ is up 19.6% for the year, and
has gained 29.0% over the last 12 months.
The S&P 500 grew 5.8% in the third quarter, and has seen year-to-date gains of 14.6%.
The index has risen 27.3% over the last 12 months. The S&P 500 consists of a
representative sample of 500 leading companies of the U.S. economy and is one of the
most commonly used benchmarks for the overall U.S. stock market.
The Dow Jones U.S. Total Market Index gained 5.7% in the third quarter, and is up
14.6% year-to-date. The index has risen 27.6% over the last 12 months. The Dow Jones
U.S. Total Market Index, considered a total market index, represents the top 95% of the
U.S. stock market based on market capitalization.
The Russell 2000 Index grew 4.9% this quarter, and is up 13.0% for the year. The
Russell 2000 has climbed 30.0% over the last 12 months. The Russell 2000 Index
serves as a benchmark for small cap stocks in the U.S. stock market.

Business Valuation Report For Tentex Corp.
October 1, 2013 Ross & Company CPA, PLLC Page 37 of 94
Exhibit 3-6: Stock Market Historical Data
Source: Business Valuation Resources, LLC- Third Quarter Economic Outlook Update QUARTERLY RETURNS
(%) 4Q 09 1Q 10 2Q 10 3Q 10 4Q 10 1Q 11 2Q 11 3Q 11 4Q 11 1Q 12 2Q 12 3Q 12
DJIA 7.4 4.1 -10.0 10.4 7.3 6.4 0.8 -12.1 12.0 8.1 -2.5 4.3
Nasdaq Composite 6.9 5.7 -12.0 12.3 12.0 4.8 -0.3 -12.9 7.9 18.7 -5.1 6.2
S&P 500 5.5 4.9 -11.9 10.7 10.2 5.4 -0.4 -14.3 11.2 12.0 -3.3 5.8
Dow Jones US Total Market 5.4 5.8 -11.6 11.1 11.2 5.6 -0.5 -15.7 11.4 12.7 -3.8 5.7
Russell 2000 3.5 8.5 -10.2 10.9 15.9 7.6 -1.9 -22.1 15.0 12.1 -3.8 4.9
YEARLY RETURNS
(%) 2005 2006 2007 2008 2009 2010 2011 2012 2013
DJIA -0.6 16.3 6.4 -33.8 18.8 11.0 5.5
Nasdaq Composite 1.4 9.5 9.8 -40.5 43.9 16.9 -1.8
S&P 500 4.7 11.8 3.5 -38.5 23.5 12.8 0.0 10.77 6.98
Dow Jones US Total Market 6.2 12.2 3.9 -38.7 26.5 15.6 -1.4
Russell 2000 5.4 14.7 -2.7 -34.8 25.2 25.3 -5.5
MONTHLY DATA
Oct-11 Nov-11 Dec-11 Jan-12 Feb-12 Mar-12 Apr-12 May-12 Jun-12 Jul-12 Aug-12 Sep-12
DJIA 11,118.40 11,006.02 11,577.51 12,632.91 12,952.07 13,212.04 13,213.63 12,393.45 12,880.09 13,008.68 13,090.84 13,437.13
Nasdaq Composite 2,507.41 2,498.23 2,652.87 2,813.84 2,966.89 3,091.57 3,046.36 2,827.34 2,935.05 2,939.52 3,066.96 3,116.23
S&P 500 1,183.26 1,180.55 1,257.64 1,312.41 1,365.68 1,408.47 1,397.91 1,310.33 1,362.16 1,379.32 1,406.58 1,440.67
Dow Jones US Total Market 12,412.30 12,464.30 13,290.00 13,769.30 14,332.30 14,769.20 14,618.90 13,665.50 14,208.60 14,346.70 14,630.90 15,025.20
Russell 2000 703.35 727.01 783.65 792.82 810.94 830.30 816.88 761.82 798.49 786.94 812.09 837.45
VIX** 45.45 36.16 30.59 22.97 21.14 20.84 20.39 25.10 26.66 20.47 18.96 17.98
QUARTERLY DATA
4Q 08 1Q 09 2Q 09 3Q 09 4Q 09 1Q 10 2Q 10 3Q 10 4Q 10 1Q 11 2Q 11 3Q 11
DJIA 8,776.39 7,608.92 8,447.00 9,712.28 10,428.05 10,856.63 9,774.02 10,788.05 11,577.51 12,319.73 12,414.34 10,913.38
Nasdaq Composite 1,577.03 1,528.59 1,835.04 2,122.42 2,269.15 2,397.96 2,109.24 2,368.62 2,652.87 2,781.07 2,773.52 2,415.40
S&P 500 903.25 797.87 919.32 1,057.08 1,115.10 1,169.43 1,030.71 1,141.20 1,257.64 1,325.83 1,320.64 1,131.42
Dow Jones US Total Market 9,087.20 8,113.10 9,424.90 10,911.70 11,497.40 12,161.00 10,750.00 11,947.10 13,290.00 14,036.40 13,968.10 11,771.90
Russell 2000 499.45 422.75 508.28 604.28 625.39 678.64 609.49 676.14 783.65 843.55 827.43 644.16
VIX** 80.86 56.65 32.68 29.15 23.69 19.26 36.57 23.89 21.36 29.40 22.73 48.00
YEARLY DATA
2004 2005 2006 2007 2008 2009 2010 2011 2012 2013
DJIA 10,783.01 10,717.50 12,463.15 13,264.82 8,776.39 10,428.05 11,577.51 12,217.56
Nasdaq Composite 2,175.44 2,205.32 2,415.29 2,652.28 1,577.03 2,269.15 2,652.87 2,605.15
S&P 500 1,211.92 1,248.29 1,418.30 1,468.36 903.25 1,115.10 1,257.64 1,257.60 1,393.00 1,490.30
Dow Jones US Total Market 11,971.10 12,517.70 14,257.50 14,819.60 9,087.20 11,497.40 13,290.00 13,109.50
Russell 2000 651.57 673.22 787.66 766.03 499.45 625.39 783.65 740.92
VIX** 21.58 17.74 23.81 31.09 80.86 56.65 45.79 48.00
*Source: The Livingston Survey, June 7, 2012
**VIX values reported are the highest value of the respective time period. VIX is a popular volatility measure-higher values correspond to greater volatility.
Quotes are closing prices on the last day of trade for the month
Source of data: Yahoo! Finance
Index Tickers: ^DJI, ^IXIC, ^GSPC, ^DWC, ^RUT, ^VIX
Notes:
FORECAST*
FORECAST*
The Chicago Board Options Exchange Volatility Index (VIX)—a popular volatility
measure—began the third quarter at 17.80 and ended at 15.73. The highest closing VIX
reading this quarter was 20.47, compared with last quarter’s high of 26.66. The average
VIX reading this quarter was 16.21, compared to 20.03 last quarter.
The VIX represents the implied volatility of 30-day options on the Standard & Poor’s 500
stocks and has been termed by some as the “fear gauge.” Accordingly, the VIX
represents the expected volatility of the market, as represented by the S&P 500. Stock
market professionals use the VIX to gauge investor sentiment.
Investopedia says the following: “VIX values greater than 30 are generally associated
with a large amount of volatility as a result of investor fear or uncertainty, while values
below 20 generally correspond to less stressful, even complacent, times in the markets.”

Business Valuation Report For Tentex Corp.
October 1, 2013 Ross & Company CPA, PLLC Page 38 of 94
BOND MARKETS
Low yields and less demand for safe-haven assets proved to be headwinds for the bond
market this quarter. Broad bond market returns, as measured by Barclays Aggregate
Bond Index, generally lagged stocks. Investment grade corporate bonds were a bright
spot in the bond market this quarter, while high yield bonds saw even greater benefits for
investors. Overall, nominal Treasuries were flat, lagging the investment-grade U.S. bond
market. Treasury inflation-protected securities outperformed the broad bond market due
to the longer-term inflationary implications of the Federal Reserve's quantitative easing
program.
The 30-day T-bill rate was 0.06% at the end of the third quarter, little changed from
0.04% at the end of last quarter. The 5-year Treasury ended the third quarter with a yield
of 0.62%, compared with 0.72% at the end of the previous quarter.
The 10-year Treasury bond yield was 1.65% at the end of the third quarter, nearly
unchanged from a yield of 1.67% at the end of the previous quarter. The 20-year
Treasury bond yield was 2.42% at the end of the third quarter, compared with 2.38% at
the end of the previous quarter.
Moody’s seasoned Aaa and Baa corporate bonds ended the third quarter with a yield of
3.42% and 4.72%, respectively, compared with yields of 3.66% and 5.06% at the end of
last quarter.
The prime lending rate was 3.25% at the beginning of the third quarter and remained
there through the end of September. The discount window (primary credit) remained at
0.75% during the third quarter.

Business Valuation Report For Tentex Corp.
October 1, 2013 Ross & Company CPA, PLLC Page 39 of 94
Exhibit 3-7: Bond Market Historical Data
Source: Business Valuation Resources, LLC- Third Quarter Economic Outlook Update PERIODIC DATA
(%) BM MM EM BM MM EM BM MM EM
30-day Treasury Bill1
0.06 0.04 0.07 0.07 0.11 0.09 0.10 0.08 0.06
5-year Treasury Note1
0.67 0.60 0.60 0.63 0.80 0.59 0.62 0.72 0.62
10-year Treasury Bond1
1.61 1.50 1.51 1.56 1.80 1.57 1.59 1.88 1.65
20-year Treasury Bond1
2.30 2.18 2.21 2.25 2.53 2.29 2.30 2.68 2.42
Prime Lending Rate 3.25 3.25 3.25 3.25 3.25 3.25 3.25 3.25 3.25
Federal Funds Rate 0.18 0.18 0.13 0.14 0.13 0.13 0.14 0.16 0.09
Discount Window Primary Credit Rate 0.75 0.75 0.75 0.75 0.75 0.75 0.75 0.75 0.75
Corporate Bonds Moody's Seasoned Aaa43.58 3.39 3.29 3.32 3.64 3.36 3.39 3.67 3.42
Corporate Bonds Moody's Seasoned Baa4
5.01 4.85 4.78 4.82 5.07 4.78 4.77 4.97 4.72
Notes:
BM=beginning of month, MM = mid-month, EM = end of month
MONTHLY DATA
(%) Jul-11 Aug-11 Sep-11 Oct-11 Nov-11 Dec-11 Jan-12 Feb-12 Mar-12 Apr-12 May-12 Jun-12
30-day Treasury Bill1
0.04 0.02 0.01 0.01 0.01 0.00 0.02 0.06 0.06 0.07 0.07 0.05
5-year Treasury Note1
1.54 1.02 0.90 1.06 0.91 0.89 0.84 0.83 1.02 0.89 0.76 0.71
10-year Treasury Bond13.00 2.30 1.98 2.15 2.01 1.98 1.97 1.97 2.17 2.05 1.8 1.62
20-year Treasury Bond13.95 3.24 2.83 2.87 2.72 2.67 2.7 2.75 2.94 2.82 2.53 2.31
Prime Lending Rate2
3.25 3.25 3.25 3.25 3.25 3.25 3.25 3.25 3.25 3.25 3.25 3.25
Federal Funds Rate20.07 0.1 0.08 0.70 0.08 0.07 0.08 0.1 0.13 0.14 0.16 0.16
Discount Window Primary Credit Rate20.75 0.75 0.75 0.75 0.75 0.75 0.75 0.75 0.75 0.75 0.75 0.75
Corporate Bonds Moody's Seasoned Aaa44.93 4.37 4.09 3.98 3.87 3.93 3.85 3.85 3.99 3.96 3.8 3.64
Corporate Bonds Moody's Seasoned Baa4
5.76 5.36 5.27 5.37 5.14 5.25 5.23 5.14 5.23 5.19 5.07 5.02
(%) 2003 2004 2005 2006 2007 2008 2009 2010 2011
30-day Treasury Bill11.02 1.27 3.00 4.75 4.41 1.29 0.10 0.11 0.04
5-year Treasury Note12.97 3.43 4.05 4.75 4.43 2.80 2.20 1.93 1.52
10-year Treasury Bond14.01 4.27 4.29 4.80 4.63 3.66 3.26 3.22 2.78
20-year Treasury Bond14.96 5.04 4.64 5.00 4.91 4.36 4.11 4.03 3.62
Prime Lending Rate34.12 4.34 6.19 7.96 8.05 5.09 3.25 3.25 3.25
Federal Funds Rate31.13 1.35 3.22 4.97 5.02 1.92 0.16 0.18 0.1
Discount Window Primary Credit Rate3
N/A 2.34 4.19 5.96 5.86 2.39 0.50 0.72 0.75
Corporate Bonds Moody's Seasoned Aaa45.66 5.63 5.23 5.59 5.56 5.63 5.31 4.94 4.64
Corporate Bonds Moody's Seasoned Baa46.76 6.39 6.06 6.48 6.48 7.44 7.29 6.04 5.66
Notes:
(4) Average yield to maturity on selected long term bonds
(3) Annualized figures use a 360-day year or bank interest
Source of data: The Federal Reserve Board.
(1) Yields on actively traded non-inflation-indexed issues adjusted to constant maturities
(2) Monthly figures are averages of each calendar day in the month
Jul-12 Aug-12 Sep-12
YEARLY DATA
Exhibit 3-8: Treasury Historical Data
Source: Business Valuation Resources, LLC- Third Quarter Economic Outlook Update
Business Valuation Report For Tentex Corp.
October 1, 2013 Ross & Company CPA, PLLC Page 40 of 94
CONSTRUCTION
According to the U.S. Census Bureau, privately owned housing starts in September
were at a seasonally adjusted annual rate of 872,000, up 15.0% from the previous
month and 34.8% from one year ago. The construction of single-family homes increased
11.0% in September and is up 42.9% from one year ago. Construction in the multifamily
home sector grew 25.0% in September and is up 18.7% from one year ago. The
multifamily home sector, which consists of buildings with five units or more, tends to be
more volatile than the single-family home sector.
Building permit authorizations for privately owned housing units, considered a good
leading indicator of demand for new homes, were at a seasonally adjusted rate of
894,000 in September. This was 11.6% above the August rate and 45.1% above the rate
from one year ago. Building permits for single-family housing units were up 6.7% in
September and 27.3% from one year ago. Building permits for multifamily housing units
climbed 11.4% in September and are up 93.4% from one year ago.
The U.S. Census Bureau reported that overall spending on new construction during
September 2012 was at a seasonally adjusted annual rate of $851.6 billion. This figure is
0.6% above the August rate of $846.2 billion and 7.8% above the $790.3 billion rate from
one year ago. During the first nine months of 2012, construction spending amounted to
$624.8 billion, 8.9% above the $573.1 billion for the same period in 2011.
Spending on all private construction was at a seasonally adjusted annual rate of $580.5
billion in September, 1.3% above the August rate of $572.8 billion and 14.4% above the
rate from one year ago. Private residential construction spending was at a seasonally
adjusted annual rate of $285.9 billion in September, 2.8% above the August rate of
$278.0 billion and 20.9% above the rate from one year ago. Private nonresidential
construction was at a seasonally adjusted annual rate of $294.6 billion in September,
0.1% below the August rate of $294.7 billion, but up 8.8% from a year ago.
The seasonally adjusted annual rate of total public construction spending was $271.1
billion in September, down 0.8% from the August rate of $273.4 billion, and down 4.2%
from a year ago. Educational construction was at a seasonally adjusted annual rate of
$66.7 billion in September, 0.8% below the August rate of $67.2 billion, and down 6.9%
from a year ago. Highway and street construction was at a seasonally adjusted annual
rate of $78.4 billion in September, 1.6% below the August rate of $79.6 billion, and 2.4%
below the rate from one year ago.
MANUFACTURING
The Federal Reserve published that, after remaining unchanged in July, industrial
production declined 1.4% in August, before increasing 0.4% in September. For the third
quarter as a whole, industrial production dropped at an annual rate of 0.4%. At 97.0% of
its 2007 average, total industrial production in September was up 2.8% from its level a
Business Valuation Report For Tentex Corp.
October 1, 2013 Ross & Company CPA, PLLC Page 41 of 94
year earlier. Industrial production is an output measure of the industrial sector of the
economy. The industrial sector includes manufacturing, mining, and utilities.
Manufacturing dropped at an annual rate of 0.9% in the third quarter, compared with
growth at a rate of 1.0% last quarter. This was manufacturing’s first quarterly decline
since the second quarter of 2009. Manufacturing has risen 3.2% over the past 12
months.
The output of mines grew at a rate of 1.4% in the third quarter, compared with a
decreasing rate of 0.4% in the previous quarter. Mining output has increased 3.8% over
the past 12 months.
The output of utilities grew at a rate of 1.0% in the third quarter. This is down significantly
from a rate of 21.2% in the previous quarter. The output of utilities has declined 1.4%
over the past 12 months.
Capacity utilization averaged 78.5% during the third quarter. The second-quarter figure
is down slightly from an average of 78.9% in the previous quarter. Capacity utilization is
the percentage of production capacity manufacturers actually use. Capacity utilization
averaged 76.8% in 2011 and 73.7% in 2010.
The U.S. Census Bureau announced that new orders for manufactured durable goods in
September increased $19.6 billion (9.9%), to $218.2 billion. This increase followed a
13.1% August increase. Excluding defense, new orders increased 9.1%. Excluding the
volatile transportation orders, new orders increased 2.0%. Orders for transportation
equipment, up five of the last six months, had the largest September increase, at 31.7%.
New orders for nondefense capital goods excluding volatile aircraft orders—an indicator
of business spending strength—were unchanged in September after rising only 0.2% in
August. Many analysts took this as a signal of a slowdown in investment that may curb
U.S. economic growth.
The Institute for Supply Management (ISM) reported that its monthly Manufacturing
Index (known as PMI) was at 51.5% at the end of the third quarter, up slightly from
49.7% at the end of the previous quarter. PMI is an indicator of the economic health of
the manufacturing sector and is based on data compiled from purchasing and supply
executives nationwide. While the September reading is up somewhat from the reading at
the end of the second quarter, it is important to note that the June reading marked a 35-
month low for PMI. After three consecutive months of indicating the manufacturing
sector was contracting, the September PMI reading indicated a slight expansion. An
increase in the indexes for new orders and manufacturing employment fueled the
September PMI rise. Feedback from those surveyed was mixed. Some felt the recent
slowdown was a “summer thing” and everything was picking up for the fall, while others
reported that the third quarter was strong, but the fourth quarter is showing signs of

Business Valuation Report For Tentex Corp.
October 1, 2013 Ross & Company CPA, PLLC Page 42 of 94
slowing. Despite whom you listen to, PMI is indicating a slight expansion for the
manufacturing sector.
A reading above 50% indicates that the manufacturing economy is generally expanding;
a reading below 50% indicates that it is generally contracting. A PMI in excess of 42.5%,
over a period of time, generally indicates an expansion of the overall economy.
Therefore, the September PMI indicates an expansion in the manufacturing sector after
three consecutive months of contraction and growth in the overall economy for the 40th
consecutive month.
SERVICES
ISM reported that its Non-Manufacturing Index (known as NMI) increased to 55.1% at
the end of the third quarter from 52.1% at the end of the prior quarter. NMI measures the
strength of the services sector and is based on data compiled from purchasing and
supply executives nationwide. While the reading at the end of the third quarter is up from
last quarter, the June reading marked a 29-month low for NMI. An increase in the new
orders index, up four points in September, more than offset a decrease in the
employment index, which declined almost three points.
The September NMI reading of 55.1% is above the 12-month average of 54.1%, but
below the 12-month high of 57.3%.
A reading above 50% indicates the nonmanufacturing sector economy is generally
expanding, whereas a reading below 50% indicates the nonmanufacturing sector is
generally contracting. The reading in September indicates continued growth for the 33rd
consecutive month in the nonmanufacturing sector.
REAL ESTATE
Homeownership Rates, Homeowner Vacancy Rates, and Rental Vacancy Rates
The U.S. Census Bureau found that the homeownership rate for the third quarter was
65.5%, unchanged from last quarter’s rate, but below the rate one year ago of 66.3%.
The U.S. Census Bureau reported that the national vacancy rate for rental housing in the
third quarter was 8.6%, unchanged from last quarter. Rental vacancy is down from this
time one year ago, when the rate was 9.8%. The national vacancy rate for homeowners
was 1.9% in the third quarter, down from 2.1% last quarter. Homeowner vacancy is
down from this time one year ago, when the rate was 2.4%.
Mortgage Bankers Association
The Mortgage Bankers Association (MBA) believes the housing market will continue to
recover and gain traction over the next few years. MBA believes the recent surge in
multifamily housing starts will continue through 2014, along with a continued recovery in
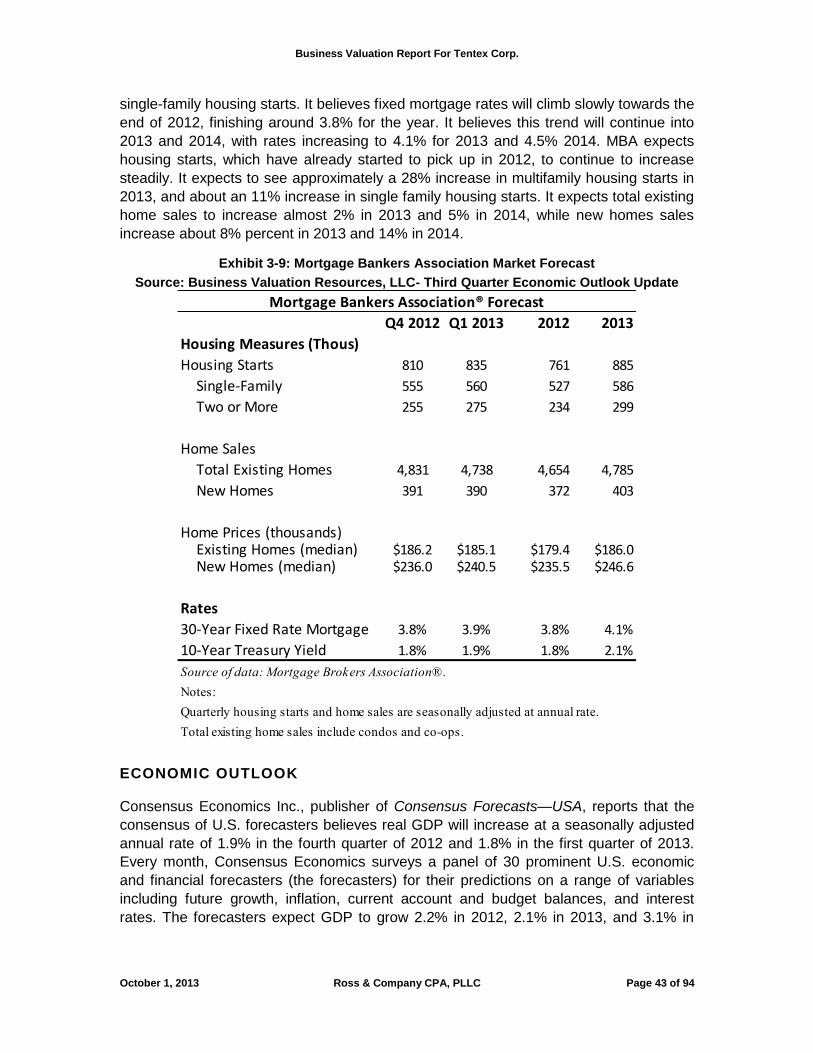
Business Valuation Report For Tentex Corp.
October 1, 2013 Ross & Company CPA, PLLC Page 43 of 94
single-family housing starts. It believes fixed mortgage rates will climb slowly towards the
end of 2012, finishing around 3.8% for the year. It believes this trend will continue into
2013 and 2014, with rates increasing to 4.1% for 2013 and 4.5% 2014. MBA expects
housing starts, which have already started to pick up in 2012, to continue to increase
steadily. It expects to see approximately a 28% increase in multifamily housing starts in
2013, and about an 11% increase in single family housing starts. It expects total existing
home sales to increase almost 2% in 2013 and 5% in 2014, while new homes sales
increase about 8% percent in 2013 and 14% in 2014.
Exhibit 3-9: Mortgage Bankers Association Market Forecast
Source: Business Valuation Resources, LLC- Third Quarter Economic Outlook Update
Q4 2012 Q1 2013 2012 2013
Housing Measures (Thous)
Housing Starts 810 835 761 885
Single-Family 555 560 527 586
Two or More 255 275 234 299
Home Sales
Total Existing Homes 4,831 4,738 4,654 4,785
New Homes 391 390 372 403
Home Prices (thousands)$186.2 $185.1 $179.4 $186.0$236.0 $240.5 $235.5 $246.6
Rates
30-Year Fixed Rate Mortgage 3.8% 3.9% 3.8% 4.1%
10-Year Treasury Yield 1.8% 1.9% 1.8% 2.1%
Source of data: Mortgage Brokers Association®.
Notes:
Quarterly housing starts and home sales are seasonally adjusted at annual rate.
Total existing home sales include condos and co-ops.
Mortgage Bankers Association® Forecast
New Homes (median) Existing Homes (median)
ECONOMIC OUTLOOK
Consensus Economics Inc., publisher of Consensus Forecasts—USA, reports that the
consensus of U.S. forecasters believes real GDP will increase at a seasonally adjusted
annual rate of 1.9% in the fourth quarter of 2012 and 1.8% in the first quarter of 2013.
Every month, Consensus Economics surveys a panel of 30 prominent U.S. economic
and financial forecasters (the forecasters) for their predictions on a range of variables
including future growth, inflation, current account and budget balances, and interest
rates. The forecasters expect GDP to grow 2.2% in 2012, 2.1% in 2013, and 3.1% in

Business Valuation Report For Tentex Corp.
October 1, 2013 Ross & Company CPA, PLLC Page 44 of 94
2014. In the long term, they report that real GDP will grow by an average annual rate of
2.4% between 2018 and 2021.
They forecast personal consumption will increase at a rate of 2.0% in the fourth quarter
of 2012 and 1.7% in the first quarter of 2013. They expect personal consumption to
increase 1.9% in 2012 and 2.0% in 2013.
The forecasters believe unemployment will average 8.1% in both the fourth quarter of
2012 and the first quarter of 2013. They believe unemployment will average 8.2% in
2012 and 8.0% in 2013.
The forecasters believe the three-month Treasury bill rate will be 0.1% at the end of the
fourth quarter of 2012 and will remain at 0.1% through the end of the first quarter of
2013. They believe the three-month Treasury bill rate will climb to 0.2% at the end of
2013. They forecast the 10-year Treasury bond yield will be 1.8% at the end of the fourth
quarter of 2012 and 1.9% at the end of the first quarter of 2013. They believe the 10-
year Treasury bond yield will rise to 2.5% at the end of 2013.
They also believe consumer prices will rise at a rate of 2.2% in the fourth quarter of 2012
and 2.0% in the first quarter of 2013. They expect consumer prices to increase 2.0% in
both 2012 and 2013. They expect producer prices to increase at a rate of 1.1% in the
fourth quarter of 2012 and 1.6% in the first quarter of 2013. The forecasters anticipate
producer prices will rise 1.5% in 2012 and 1.4% in 2013.
The forecasters in the survey believe real disposable personal income will increase at a
rate of 1.9% in the fourth quarter of 2012 before falling 0.4% in the first quarter of 2013.
They believe real disposable personal income will increase 1.6% in 2012 and 1.5% in
2013.
The forecasters expect industrial production to increase at a rate of 2.3% in both the
fourth quarter of 2012 and the first quarter of 2013. They forecast industrial production
will increase 4.1% in 2012 and 2.7% in 2013.
Nominal pretax corporate profits will increase at a rate of 5.3% and 3.1% in 2012 and
2013, respectively, according to the forecasters. The forecasters project housing starts
will be 750,000 in 2012 and 900,000 in 2013.
The 32 participants in The Livingston Survey (the Survey) released their latest
predictions in June. The participants, who are surveyed by the Federal Reserve Bank of
Philadelphia twice a year, project real GDP to grow at an annual rate of 2.6% between
2Q 2012 and 4Q 2012 (up from their previous estimate of 2.5%). They then expect GDP
will increase at an annual rate of 2.3% between 4Q 2012 and 2Q 2013. They believe
GDP will grow 2.7% annually over the next 10 years.
Business Valuation Report For Tentex Corp.
October 1, 2013 Ross & Company CPA, PLLC Page 45 of 94
The Survey also noted that forecasts for the unemployment rate have been revised
downward from the previous Survey. They expect the unemployment rate to be about
8.0% by December 2012, down from their previous estimate of 8.7%. They expect
unemployment to decrease to 7.8% by June 2013.
The forecasters in the Survey have modified their near-term predictions for consumer
price inflation (CPI). They expect CPI to be 2.3% in 2012, up slightly from 2.2% in their
previous survey. They predict CPI will be 2.0% in 2013. The Survey expects CPI to
average 2.5% over the next 10 years, unchanged from their forecast in the prior Survey.
The Survey expects producer price inflation (PPI) to be 2.1% in 2012—down from the
previous estimate of 2.3%—before increasing 2.6% in 2013.
The Survey predicts the interest rate on 3-Month Treasury bills will be 0.10% at the end
of December 2012—nearly unchanged from the forecasters’ previous estimate of 0.09%.
The Livingston forecasters predict that the rate will then rise to 0.12% in June 2013,
before rising to 0.20% in December 2013. The interest rate on 10-Year Treasury bonds
is predicted to reach 2.20% at the end of December 2012, down from the previous
estimate of 2.75%. According to the Survey, the rate will then rise to 2.50% in June 2013
and to 2.75% in December 2013.
The forecasters from the Survey have somewhat increased their previous projections for
future S&P 500 values. They expect the S&P 500 will be at 1,393.0 at the end of
December 2012, before climbing to 1,449.2 by the end of June 2013. They believe the
S&P 500 will end 2013 at 1,490.3.
The National Association of Realtors believes existing home sales will increase to 4.6
million in 2012, before increasing to 5.0 million by 2013. NAR believes the median
existing home sales price will increase to $174,100 in 2012, before increasing to
$182,800 in 2013. It believes new home sales will increase to 379,000 in 2012, before
increasing to 594,000 in 2013. NAR expects housing starts to increase to 769,000 in
2012, then to 1,120,000 in 2013.
Realtors have moderate expectations about the direction of the single-family housing
market for the next six months, but their expectations remain weak for the townhome
and condo market. NAR’s RCI for the six-month outlook of single-family homes stood at
56, while the figure was 39 for townhomes and 33 for condos (strong = 100; moderate =
50; weak = 0). The RCI is a key indicator of housing market strength based on a monthly
survey of over 50,000 real estate practitioners. Practitioners are asked about their
expectations for home sales, prices, and market conditions.
The Energy Information Administration predicts that the West Texas Intermediate crude
oil spot price will average approximately $95.66 per barrel in 2012 and $92.63 per barrel
in 2013, compared with $94.86 in 2011. The EIA expects retail prices for regular-grade
Business Valuation Report For Tentex Corp.
October 1, 2013 Ross & Company CPA, PLLC Page 46 of 94
gas to average $3.64 per gallon in 2012 and $3.33 per gallon in 2013, compared with
$3.53 in 2011.
The EIA believes the Henry Hub natural gas spot price will average $2.65 per million Btu
(MMBtu) in 2012 and $3.34 per MMBtu in 2013, compared with $4.00 per MMBtu in
2011. The cost of coal delivered to electric generating plants, which averaged $2.40 per
MMBtu in 2011, is expected to average $2.39 per MMBtu in both 2012 and 2013.
Residential electric prices, which averaged 11.79 cents per kilowatt-hour (kWh) in 2011,
are expected to average 11.91 cents per kWh in 2012 and 12.02 cents per kWh in 2013.
SUMMARY
To sum it up, the U.S. economy is growing steadily, but nowhere near fast enough to
lower the unemployment rate substantially. “Steady growth” might not sound so bad, but
the Economic Policy Institute points out that the failure to address chronically high rates
of joblessness deprives the U.S. economy of hundreds of billions of dollars each quarter.
Moreover, even this slow-but-steady growth could be threatened by the approaching
federal spending cuts and expiring tax breaks mandated under current law—referred to
by many as the “fiscal cliff.” The consensus seems that, should they happen, these cuts
would slow growth even further, and could quite possibly pull the U.S. economy into
recession.
The consensus forecasts for GDP, personal consumption, business investments,
unemployment, along with other key indicators, remain mostly positive and indicate slow
growth ahead.
Tentex has experienced strong growth for the past few years, despite the weak
recovery. We expect that the continued slow growth of the U.S. economy will have a
mildly positive effect on Tentex.

Business Valuation Report For Tentex Corp.
October 1, 2013 Ross & Company CPA, PLLC Page 47 of 94
SECTION 4: THE INDUSTRY OUTLOOK
INDUSTRY OVERVIEW
Tentex operates within the Other Miscellaneous Nondurable Goods Wholesalers.
However, this is a broad industry that encompasses wholesalers of many different kinds
of products. Tentex is a distributor of heavy-duty LED lighting products. The NAICS
code for LED manufacturing is 334413, Semiconductor and Related Device
Manufacturing. To get a better understanding of the market forces affecting LED
products, we have reviewed the 2011 IBISWorld research report on LED Manufacturing
in the U.S. Below, we show excerpts, from the IBISWorld report, which provides input
into our analysis. However, based on the recent past and anticipated future
performance of Tentex, and the local and the economic conditions, we have developed a
firm-specific forecast to use in the discounted free cash flow analysis, rather than use an
industry projection.
Executive Summary 6
The LED Manufacturing industry has expanded over the past five years. Revenue is
expected to grow at an average of 1.7% annually to $825.2 million in the five years to
2011. Growing interest in energy-efficient products has driven revenue higher. An
increasing number of LEDs were integrated into downstream lighting products that were
sold to businesses or included in other consumer items. Despite the recession,
businesses ramped up their LED purchases in order to save on rising energy expenses
and invest in products that typically last longer than traditional lighting goods. Tax credits
passed by the US government also helped industry players weather the recession, since
these credits allow companies to open up facilities for less cost. Continuing interest in
energy-efficient goods will prolong industry growth, with revenue expected to increase
1.9% in 2011.
The industry has invested a substantial amount in research and development (R&D) to
create LEDs that are brighter and more energy efficient than their predecessors. Over
the five years to 2011, LEDs have been included as lights in automobiles and backlights
in televisions and mobile phones, highlighting their ability to be used in many different
products. LED technology will continue to develop quickly, and firms that concentrate on
creating LEDs that can be used as substitutes for traditional lighting while keeping final
prices down will fare best. Additionally, industry players are scrambling to meet the
demands of businesses looking to cut back on energy costs and the US government as
it seeks to decrease its energy footprint, prompting players to develop products that are
more energy efficient.
6 IBIS World Report: LED Manufacturers in the U.S. OD4456, November 2011
Business Valuation Report For Tentex Corp.
October 1, 2013 Ross & Company CPA, PLLC Page 48 of 94
The next five years are set to be brighter for the industry. Continued R&D will result in
new types of LEDs that will be used in a variety of consumer items, facilitating revenue
growth and expanding the industry’s reach. Consumers and businesses will continue to
demand products that are perceived to be better for the environment, raising potential
demand for industry products. However, growing competition from LEDs that are
produced abroad will hamper revenue growth prospects and place pressure on profit
margins. Foreign-based firms will enjoy low-cost labor and lax environmental
regulations, enabling them to engage in price competition with domestic firms. As a
result of these trends, industry revenue is anticipated to increase at an average annual
rate of 3.4% to $975.8 million in the five years to 2016.
Key External Drivers
Technological Change
Demand for energy-efficient technologies drives technological change in this industry as
players strive to manufacture products that have more energy-efficient qualities. Higher
demand for these technologies results in heightened industry revenue. This driver is
expected to increase in 2012, representing a potential opportunity for the industry.
Tax credits for energy efficiency
The industry is supported by tax credits for energy efficiency (LEDs are considered more
energy efficient than traditional light bulbs), since higher tax credits allow operators to
write off the costs of establishing new manufacturing plants in the United States. As a
result, industry revenue increases, as more players open up shop on US soil. The tax
credit for creating a new manufacturing facility expired in 2010. Businesses are also
increasingly interested in energy-efficient technology that enables them to save on
energy costs. Some states have incentives that promote the purchase of energy-efficient
products. This driver is expected to stay stable in 2012.
GDP growth of mainland China
Chinese GDP growth is a strong indicator of mainland China’s economic expansion. Higher economic growth results in heightened incentives to move manufacturing-intensive operations abroad, resulting in lower industry revenue as operators produce LEDs abroad. Chinese GDP growth also discourages new entrants to start operations in the United States, opting for lower labor costs outside of US borders. This driver is expected to increase during 2012.
Price of semiconductor and electronic components
Industry players source semiconductor components to create LEDs. An increase in semiconductor material costs results in higher production costs and eats into profit margins. This driver is expected to decrease slowly during 2012.
Consumer spending
LEDs are present in many goods that are available for consumers. For instance, LEDs
are used to manufacture TVs and mobile phones. A dip in consumer spending results in
lower industry revenue, as fewer products with LEDs are purchased and in turn,
downstream manufacturers demand fewer LED products from industry players. This
Business Valuation Report For Tentex Corp.
October 1, 2013 Ross & Company CPA, PLLC Page 49 of 94
driver is expected to increase slowly during 2012, representing a potential threat for the
industry.
Import penetration into the manufacturing sector
Higher import penetration causes heightened competition between industry players,
ultimately resulting in lower revenue. Imports typically cost less than US manufactured
products, prompting many consumers to purchase cheaper LEDs over products offered
by industry players. This driver is expected to increase slowly during 2012.
World price of natural gas
Energy prices are increasingly becoming an important indicator of industry demand. As
energy prices increase, businesses and individuals increasingly install energy-efficient
HVAC units in an attempt to reduce operational and living expenses. As energy prices
fall, though, the financial benefits associated with energy-efficient HVAC units
diminishes, hurting the demand for HVAC upgrade and replacement services. This driver
is expected to increase during 2012.
Current Performance
The LED Manufacturing industry expanded over the five years to 2011, with revenue
expected to grow 1.7% annually to $825.2 million. Growing technological change,
underpinned by high interest in energy efficiency, has driven interest in the energy-
saving aspects of LEDs and the inclusion of LEDs in traditional lighting applications.
Despite the recession, industry players increasingly started LED manufacturing
operations amid generous advanced energy manufacturing tax credits. Also, the US
government’s strong support for LED technology has resulted in government contracts
that include LEDs in public works projects, ultimately boosting industry demand.
However, the industry has continually battled outsourcing, as many players began to
produce LEDs abroad in emerging economies, limiting the industry’s growth potential
during the past five years.
The industry is driven by demand for energy-efficient technology and concern for the
health of the environment. LEDs are considered to be more energy efficient than
traditional lighting technology and typically last longer. Higher demand for energy-
efficient technology and heightened awareness of the perceived environmental impact of
energy-inefficient products drives industry revenue higher. Business spending also
influences this industry since LEDs are used in the downstream manufacturing of lighting
products. LED manufacturers compete against imports from abroad; therefore the
relative strength of the economy in those countries bolsters competition and creates
higher import competition, limiting revenue generated from manufacturing in the United
States. The price of semiconductor materials, the main input into the creation of LEDs,
affects industry performance, since higher prices limits industry profit.
Business Valuation Report For Tentex Corp.
October 1, 2013 Ross & Company CPA, PLLC Page 50 of 94
Growing interest in LEDs
Rising interest in energy-efficient technology has driven the industry over the past five
years. Growing concerns about the state of the environment and the perception that
current energy usage rates are not sustainable has underpinned this trend. Businesses
have shifted demand toward products that save on energy costs and are perceived to be
better for the environment. As a result, downstream manufacturers (that use LEDs to
produce lighting products) are demanding LEDs at an accelerating pace. For example,
Cree, the industry’s largest major player, received a contract from International House of
Pancakes to provide all its lighting requirements in 2008.
In turn, industry players shipped out LEDs to meet this demand and expanded R&D to
create LEDs that can be used in a variety of businesses. Business products that use
LEDs include: indoor lights, projection screens and fluorescent lamps. Sales of these
products have driven industry revenue. as businesses have consistently preferred
products that have energy-efficient qualities and last longer than traditional bulbs and
lighting technology. However, sales of products with LEDs dipped during the recession,
as businesses pulled back on expenses, forcing many downstream manufacturers to
order fewer LEDs. A dip in sales did not deter industry firms completely as businesses
continued to buy products with LEDs because of the energy-saving qualities of LEDs.
Industry revenue will benefit from interest in the energy-efficient advantages of the LED
products; therefore, it is expected to grow 1.9% from 2010 to 2011.
Industry players are continuing R&D efforts to increase demand. Research is ongoing to
develop LEDs for residential home products, make current LEDs more energy efficient
and create LEDs with new consumer applications. The completion of LED application to
residential home products will particularly benefit the industry, resulting in a jump in
revenue when the technology is fully developed.
Government Support
To promote the use of energy-efficient technology and to reinvigorate the economy, the
US government passed the American Recovery and Reinvestment Act (ARRA). The
legislation contained a new advanced manufacturing tax credit of 30.0% (LED
technology is considered an advanced energy product by the US government), enabling
industry firms to start up manufacturing facilities with less cost (by saving 30.0% on
federal taxes). While this incentive expired in 2010, firms used it to open up new facilities
and save money on expansion activities amid demand declines during the recession.
Tax relief on expansion activities helped mitigate Industry revenue declines during 2009
(when it fell 8.8%).
Government contracts for inclusion of LEDs into street and highway lighting have further
supported the industry. As with businesses, the US government became increasingly
interested on saving energy costs amid recessionary conditions. Large federal deficits
and a decline in tax revenue resulted in the government searching for cost-saving
solutions, such as LEDs for public highways and streets. Government contracts have

Business Valuation Report For Tentex Corp.
October 1, 2013 Ross & Company CPA, PLLC Page 51 of 94
provided industry players with stable revenue sources amid a volatile market for
consumer products. Firms that have been awarded contracts experienced less revenue
volatility than their peers.
Across the seas
Despite growing industry revenue and strong government support, LEDs are cheaper to
procure abroad in emerging economies, especially China. Industry players with
manufacturing facilities in China have lower labor costs, manufacturing incentives and
less environmental production regulation, resulting in fewer manufacturing costs. Firms
that have facilities abroad have higher profit margins and are able to scale more quickly
because there are fewer production restrictions on manufacturing processes that are
potentially dangerous for the environment. However, innovation in LED technology
typically takes place in the United States, allowing domestic firms to develop new
products that may have high market acceptance. This trend has kept many players
within US borders; however, some players have located abroad to take advantage of
lower production costs.
Additionally, products that are produced in China are typically cheaper than domestically
manufactured products, creating price competition and making it hard for domestic
players to keep profit high. Imports are expected to grow at an average annual rate of
2.0% to $340.8 million in the five years to 2011. Despite growing import penetration and
strong presence of foreign-based manufacturers, profit margins actually grew during the
past five years. In response to increasing price competition, industry players exported
high volumes of LEDs; in fact, exports are expected to increase at a faster rate than
imports, at an average annual rate of 2.9% to $649.6 million in the five years to 2011.
Industry players also experienced favorable economies of scale (lower semiconductor
input cost per product sold) amid high order volume; as demand for LEDs grew, industry
players generated more profit per product sold. Firms that concentrated on high margin
products, such as streetlights for the US government, experienced the highest profit
margins and outperformed their peers.
Industry Outlook
The LED Manufacturing industry will outpace its growth of the previous five years.
Revenue is expected to expand at an average of 3.4% annually to $975.8 million in the
five years to 2016. Continued technological development will carry this industry to the
next phase, as LEDs will increasingly be used in consumer and industrial products for
lighting, often at the expense of traditional lighting technology. Concerns about
environmental awareness will persist, resulting in further interest in LEDs as an energy-
efficient technology. However, nimble overseas manufacturing firms will ramp up their
production of LEDs to compete with domestic producers, threatening the industry.
Technology continues to gain
Industry players will continue to invest in LED technology that can be integrated into
traditional lighting applications. While LEDS were previously just a small lighting

Business Valuation Report For Tentex Corp.
October 1, 2013 Ross & Company CPA, PLLC Page 52 of 94
application for mobile phones, computers and TVs, they will increasingly be used in
residential and industrial lighting. These LEDs will be brighter and able to take in more
energy than those used in small quantities in various consumer products. Gains in LED
technology will be met by downstream manufacturers that develop ways to integrate
LEDs into their products with relative ease. During the previous five years, many
downstream lighting product producers had difficulty integrating industry products with
theirs, because of the perceived steep LED integration learning curve. This trend will
reverse over the next five years as downstream customers make more products with
LEDs. This trend will also lead to revenue growth as downstream manufacturers try and
capture growing demand for LED products. As a result, revenue is anticipated to grow
2.1% from 2011 to 2012.
As LED technology grows, economies of scale will also improve. Industry players were
previously hampered by relatively inefficient economies of scale for LEDs that could be
used to brighten up a room. Instead, manufacturers focused on high-volume products
that were used for applications that needed consistent light over a long period, such as
streetlamps and lights that the US government purchased. The next five years will be
markedly different; the economies of scale for consumer products that require bright
LED technology and can be used sparingly will become increasingly attractive, lowering
the production cost of each LED. This trend will allow producers to widen profit margins,
amid high demand for these products and favorable economies of scale. Industry
players that produce this technology abroad will experience the highest profit margins,
since these labor costs continue to be lower than domestic labor.
Energy efficiency takes center stage
As with the past five years, businesses will increasingly be interested in technology that
is perceived to be energy efficient and good for the environment. In turn, they will
demand products with LED lights and LEDs for use in their businesses to save energy
costs. Economic growth expected over the next five years will result in higher energy
costs as global demand for energy rises. This factor will prompt many business owners
to incorporate LEDs to save money. Furthermore, many businesses are concerned with
marketing messages that explain how they incorporate environmental awareness in their
business models, because consumers have shifted demand to products and businesses
that are considered sustainable. The inclusion of LEDs will allow businesses to market
sustainability to their customers and potential customers, resulting in greater interest in
their respective firms.
Consumers will also increasingly adopt LED bulbs and other residential lights to save on
energy costs. Coupled with increasing concerns about the economy’s health and the
anticipated increase in energy costs, consumers will use LEDs at accelerating rates.
Along with a rise in consumer LED production economies of scale, the price of LED
technology will become more affordable for consumers, resulting in sales growth over
the next five years. Nevertheless, the price drops will not hinder profit margins, as the
decrease in price will be met by declining production costs.
Business Valuation Report For Tentex Corp.
October 1, 2013 Ross & Company CPA, PLLC Page 53 of 94
Still threatened by overseas producers
Despite expected revenue increases, technological gains and growing markets for
downstream products with LEDs, firms that are located abroad will continue to limit
industry revenue growth. As LED technology continues to gain ground, firms will focus
production in emerging economies to access lower labor costs and experience fewer
environmental manufacturing regulations.
In turn, as manufacturing operations concentrate abroad, especially in China, the
industry will be threatened by low-cost LEDs. Firms that produce abroad will be able to
charge less for LEDs and experience greater economies of scale than their domestic
counterparts. These products will be imported into the United States at an accelerating
pace, as these players will be able to undercut US producers on price, creating
formidable price competition. Imports are expected to surge 6.7% annually to $472.2
million in the five years to 2016, threatening industry margins. Industry players that focus
on high value-added products (e.g. bulbs that are the most energy efficient) will fare
better as imported LEDs will likely be of lesser quality.7
DETERMINING THE FUTURE GROWTH ASSUMPTIONS FOR TENTEX
The choices of the growth segment going forward and the terminal earnings growth
assumption for Tentex involve several considerations. The company has been able to
grow its revenue at an annualized rate of 29.27% from FYE 2009 to FYE 2012. This
growth is largely attributed to growing demand from its current products as well as
entering into the emergency LED and interior/night time work light segments. Based off
of discussions with management and a review of the company’s market opportunities,
we have developed a moderately strong growth projection for the company.
Based on this projection, we expect the company’s revenue to grow 15% in FYE 2013,
10% in FYE 2014, 10% in FYE 2015, 5% in FYE 2016, and 5% in FYE 2017. Following
this path, revenue will grow from $20.3 million in FYE 2012 to $31.1 million in FYE 2017.
Over the FYE 2008 to FYE 2012 review period, Tentex was able to maintain a gross
profit margin that did not fluctuate far from its average of 48%. Management has
indicated that this trend will continue. Therefore, we expect this gross profit margin to
stay flat at 48% throughout the projection period. We expect the company to gain some
efficiency on selling, general, and administrative (SGA) expenses as revenue increases
throughout the projection period. Thus, we have projected SGA to increase at a rate
slightly lower than that of revenue and gross profit growth. The effect of this is a mild
increase in profit margins throughout the projection period. We expect EBT-restated &
adjusted to grow from $2,727,963 in FYE 2012 to $5,283,583 in FYE 2017. At this rate,
7 End of IBISWorld Excerpts
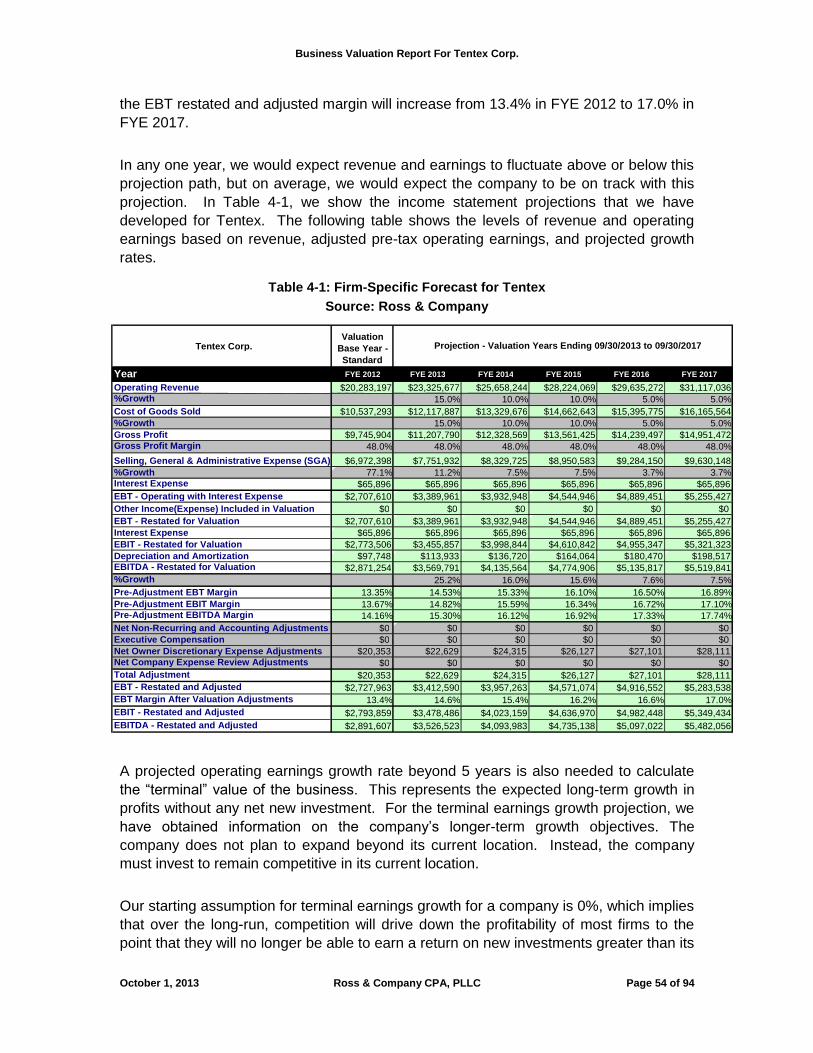
Business Valuation Report For Tentex Corp.
October 1, 2013 Ross & Company CPA, PLLC Page 54 of 94
the EBT restated and adjusted margin will increase from 13.4% in FYE 2012 to 17.0% in
FYE 2017.
In any one year, we would expect revenue and earnings to fluctuate above or below this
projection path, but on average, we would expect the company to be on track with this
projection. In Table 4-1, we show the income statement projections that we have
developed for Tentex. The following table shows the levels of revenue and operating
earnings based on revenue, adjusted pre-tax operating earnings, and projected growth
rates.
Table 4-1: Firm-Specific Forecast for Tentex
Source: Ross & Company
A projected operating earnings growth rate beyond 5 years is also needed to calculate
the “terminal” value of the business. This represents the expected long-term growth in
profits without any net new investment. For the terminal earnings growth projection, we
have obtained information on the company’s longer-term growth objectives. The
company does not plan to expand beyond its current location. Instead, the company
must invest to remain competitive in its current location.
Our starting assumption for terminal earnings growth for a company is 0%, which implies
that over the long-run, competition will drive down the profitability of most firms to the
point that they will no longer be able to earn a return on new investments greater than its
Tentex Corp. Valuation
Base Year - Standard
Year FYE 2012 FYE 2013 FYE 2014 FYE 2015 FYE 2016 FYE 2017
Operating Revenue $20,283,197 $23,325,677 $25,658,244 $28,224,069 $29,635,272 $31,117,036 %Growth 15.0% 10.0% 10.0% 5.0% 5.0% Cost of Goods Sold $10,537,293 $12,117,887 $13,329,676 $14,662,643 $15,395,775 $16,165,564 %Growth 15.0% 10.0% 10.0% 5.0% 5.0% Gross Profit $9,745,904 $11,207,790 $12,328,569 $13,561,425 $14,239,497 $14,951,472 Gross Profit Margin 48.0% 48.0% 48.0% 48.0% 48.0% 48.0%
Selling, General & Administrative Expense (SGA) $6,972,398 $7,751,932 $8,329,725 $8,950,583 $9,284,150 $9,630,148 %Growth 77.1% 11.2% 7.5% 7.5% 3.7% 3.7% Interest Expense $65,896 $65,896 $65,896 $65,896 $65,896 $65,896 EBT - Operating with Interest Expense $2,707,610 $3,389,961 $3,932,948 $4,544,946 $4,889,451 $5,255,427 Other Income(Expense) Included in Valuation $0 $0 $0 $0 $0 $0 EBT - Restated for Valuation $2,707,610 $3,389,961 $3,932,948 $4,544,946 $4,889,451 $5,255,427 Interest Expense $65,896 $65,896 $65,896 $65,896 $65,896 $65,896 EBIT - Restated for Valuation $2,773,506 $3,455,857 $3,998,844 $4,610,842 $4,955,347 $5,321,323 Depreciation and Amortization $97,748 $113,933 $136,720 $164,064 $180,470 $198,517 EBITDA - Restated for Valuation $2,871,254 $3,569,791 $4,135,564 $4,774,906 $5,135,817 $5,519,841 %Growth 25.2% 16.0% 15.6% 7.6% 7.5% Pre-Adjustment EBT Margin 13.35% 14.53% 15.33% 16.10% 16.50% 16.89% Pre-Adjustment EBIT Margin 13.67% 14.82% 15.59% 16.34% 16.72% 17.10% Pre-Adjustment EBITDA Margin 14.16% 15.30% 16.12% 16.92% 17.33% 17.74% Net Non-Recurring and Accounting Adjustments $0 $0 $0 $0 $0 $0 Executive Compensation $0 $0 $0 $0 $0 $0 Net Owner Discretionary Expense Adjustments $20,353 $22,629 $24,315 $26,127 $27,101 $28,111 Net Company Expense Review Adjustments $0 $0 $0 $0 $0 $0 Total Adjustment $20,353 $22,629 $24,315 $26,127 $27,101 $28,111 EBT - Restated and Adjusted $2,727,963 $3,412,590 $3,957,263 $4,571,074 $4,916,552 $5,283,538 EBT Margin After Valuation Adjustments 13.4% 14.6% 15.4% 16.2% 16.6% 17.0% EBIT - Restated and Adjusted $2,793,859 $3,478,486 $4,023,159 $4,636,970 $4,982,448 $5,349,434 EBITDA - Restated and Adjusted $2,891,607 $3,526,523 $4,093,983 $4,735,138 $5,097,022 $5,482,056
Projection - Valuation Years Ending 09/30/2013 to 09/30/2017
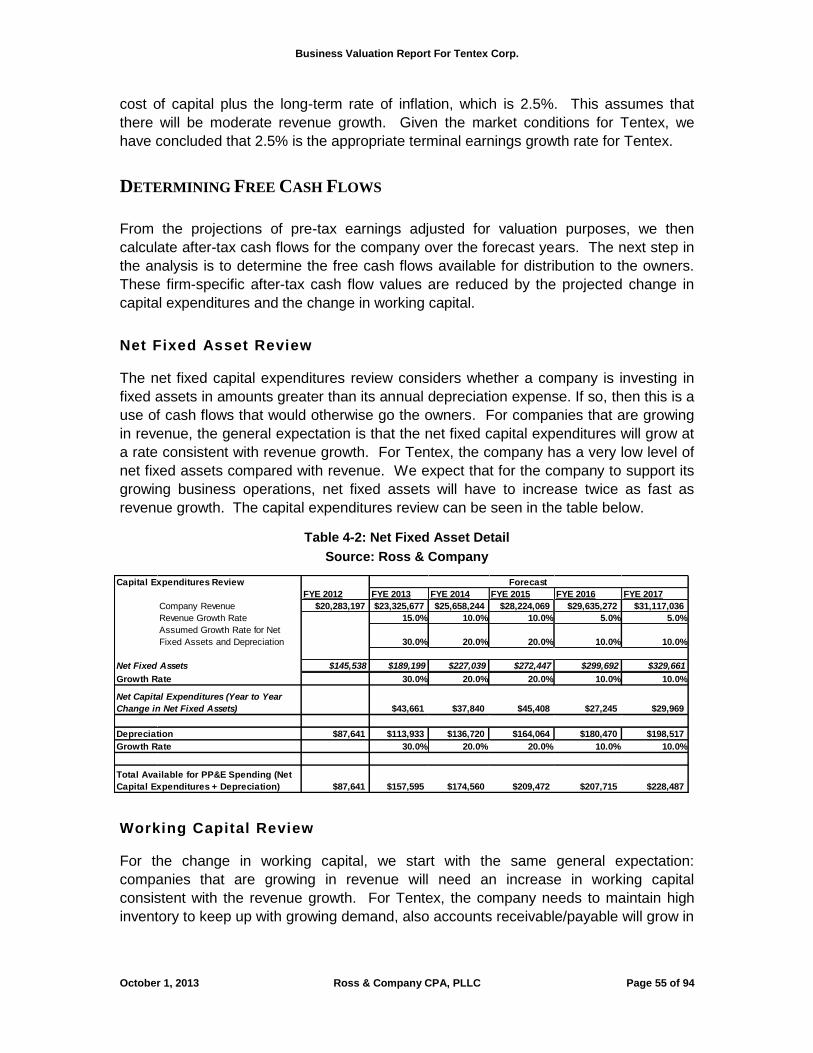
Business Valuation Report For Tentex Corp.
October 1, 2013 Ross & Company CPA, PLLC Page 55 of 94
cost of capital plus the long-term rate of inflation, which is 2.5%. This assumes that
there will be moderate revenue growth. Given the market conditions for Tentex, we
have concluded that 2.5% is the appropriate terminal earnings growth rate for Tentex.
DETERMINING FREE CASH FLOWS
From the projections of pre-tax earnings adjusted for valuation purposes, we then
calculate after-tax cash flows for the company over the forecast years. The next step in
the analysis is to determine the free cash flows available for distribution to the owners.
These firm-specific after-tax cash flow values are reduced by the projected change in
capital expenditures and the change in working capital.
Net Fixed Asset Review
The net fixed capital expenditures review considers whether a company is investing in
fixed assets in amounts greater than its annual depreciation expense. If so, then this is a
use of cash flows that would otherwise go the owners. For companies that are growing
in revenue, the general expectation is that the net fixed capital expenditures will grow at
a rate consistent with revenue growth. For Tentex, the company has a very low level of
net fixed assets compared with revenue. We expect that for the company to support its
growing business operations, net fixed assets will have to increase twice as fast as
revenue growth. The capital expenditures review can be seen in the table below.
Table 4-2: Net Fixed Asset Detail
Source: Ross & Company
Working Capital Review
For the change in working capital, we start with the same general expectation:
companies that are growing in revenue will need an increase in working capital
consistent with the revenue growth. For Tentex, the company needs to maintain high
inventory to keep up with growing demand, also accounts receivable/payable will grow in
Capital Expenditures Review
FYE 2012 FYE 2013 FYE 2014 FYE 2015 FYE 2016 FYE 2017
Company Revenue $20,283,197 $23,325,677 $25,658,244 $28,224,069 $29,635,272 $31,117,036
Revenue Growth Rate 15.0% 10.0% 10.0% 5.0% 5.0%
Assumed Growth Rate for Net
Fixed Assets and Depreciation 30.0% 20.0% 20.0% 10.0% 10.0%
Net Fixed Assets $145,538 $189,199 $227,039 $272,447 $299,692 $329,661
Growth Rate 30.0% 20.0% 20.0% 10.0% 10.0%
$43,661 $37,840 $45,408 $27,245 $29,969
Depreciation $87,641 $113,933 $136,720 $164,064 $180,470 $198,517
Growth Rate 30.0% 20.0% 20.0% 10.0% 10.0%
$87,641 $157,595 $174,560 $209,472 $207,715 $228,487
Forecast
Net Capital Expenditures (Year to Year
Change in Net Fixed Assets)
Total Available for PP&E Spending (Net
Capital Expenditures + Depreciation)
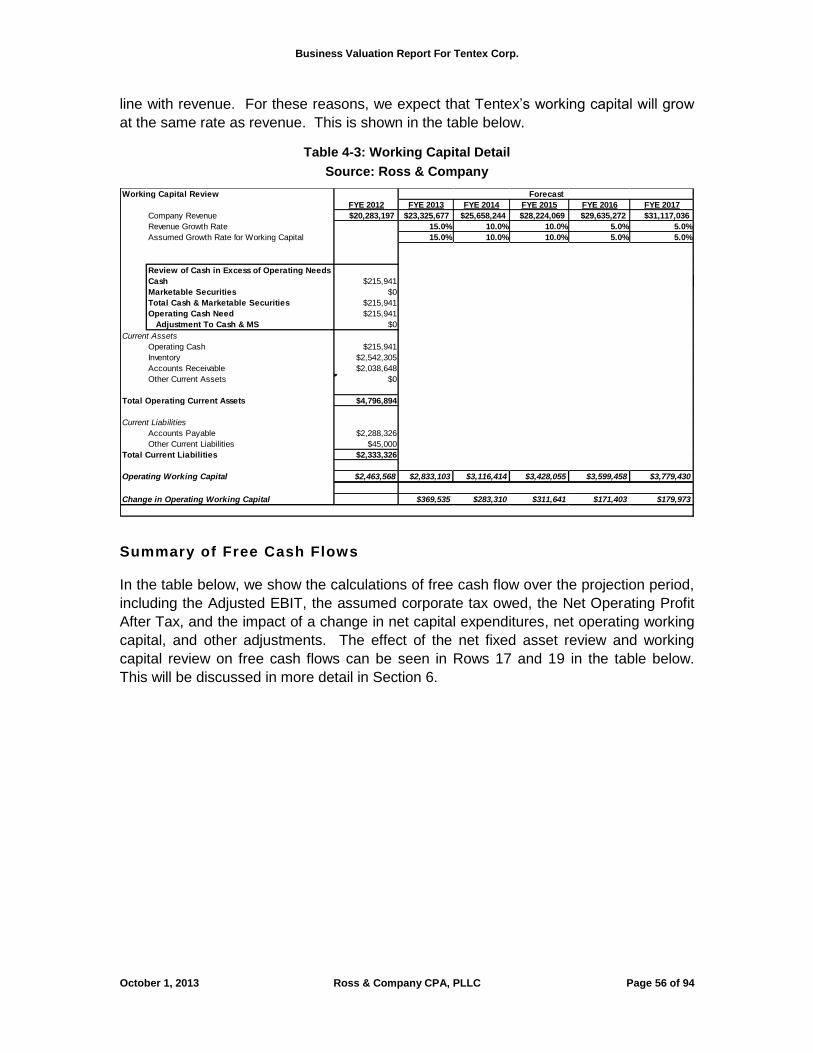
Business Valuation Report For Tentex Corp.
October 1, 2013 Ross & Company CPA, PLLC Page 56 of 94
line with revenue. For these reasons, we expect that Tentex’s working capital will grow
at the same rate as revenue. This is shown in the table below.
Table 4-3: Working Capital Detail
Source: Ross & Company
Summary of Free Cash Flows
In the table below, we show the calculations of free cash flow over the projection period,
including the Adjusted EBIT, the assumed corporate tax owed, the Net Operating Profit
After Tax, and the impact of a change in net capital expenditures, net operating working
capital, and other adjustments. The effect of the net fixed asset review and working
capital review on free cash flows can be seen in Rows 17 and 19 in the table below.
This will be discussed in more detail in Section 6.
Working Capital Review
FYE 2012 FYE 2013 FYE 2014 FYE 2015 FYE 2016 FYE 2017
Company Revenue $20,283,197 $23,325,677 $25,658,244 $28,224,069 $29,635,272 $31,117,036
Revenue Growth Rate 15.0% 10.0% 10.0% 5.0% 5.0%
Assumed Growth Rate for Working Capital 15.0% 10.0% 10.0% 5.0% 5.0%
Review of Cash in Excess of Operating Needs
Cash $215,941
Marketable Securities $0
Total Cash & Marketable Securities $215,941
Operating Cash Need $215,941
Adjustment To Cash & MS $0
Current Assets
Operating Cash $215,941
Inventory $2,542,305
Accounts Receivable $2,038,648
Other Current Assets $0
Total Operating Current Assets $4,796,894
Current Liabilities
Accounts Payable $2,288,326
Other Current Liabilities $45,000
Total Current Liabilities $2,333,326
Operating Working Capital $2,463,568 $2,833,103 $3,116,414 $3,428,055 $3,599,458 $3,779,430
Change in Operating Working Capital $369,535 $283,310 $311,641 $171,403 $179,973
Forecast
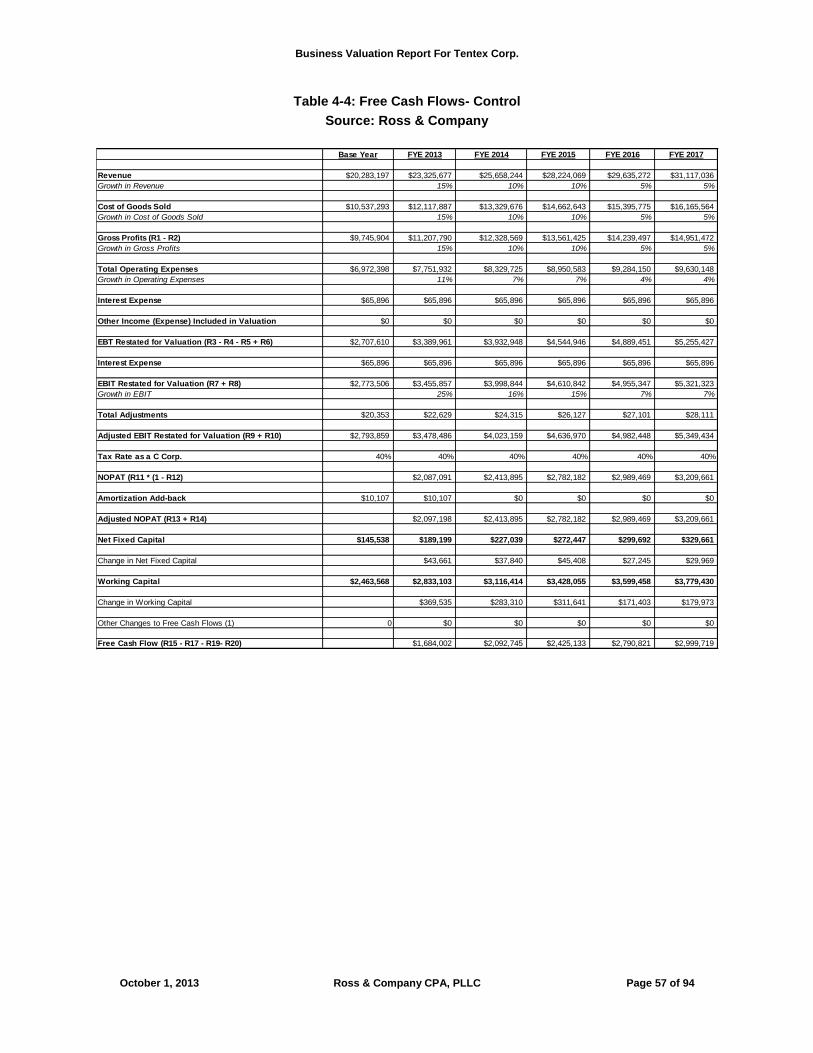
Business Valuation Report For Tentex Corp.
October 1, 2013 Ross & Company CPA, PLLC Page 57 of 94
Table 4-4: Free Cash Flows- Control
Source: Ross & Company
Base Year FYE 2013 FYE 2014 FYE 2015 FYE 2016 FYE 2017
Revenue $20,283,197 $23,325,677 $25,658,244 $28,224,069 $29,635,272 $31,117,036
Growth in Revenue 15% 10% 10% 5% 5%
Cost of Goods Sold $10,537,293 $12,117,887 $13,329,676 $14,662,643 $15,395,775 $16,165,564
Growth in Cost of Goods Sold 15% 10% 10% 5% 5%
Gross Profits (R1 - R2) $9,745,904 $11,207,790 $12,328,569 $13,561,425 $14,239,497 $14,951,472
Growth in Gross Profits 15% 10% 10% 5% 5%
Total Operating Expenses $6,972,398 $7,751,932 $8,329,725 $8,950,583 $9,284,150 $9,630,148
Growth in Operating Expenses 11% 7% 7% 4% 4%
Interest Expense $65,896 $65,896 $65,896 $65,896 $65,896 $65,896
Other Income (Expense) Included in Valuation $0 $0 $0 $0 $0 $0
EBT Restated for Valuation (R3 - R4 - R5 + R6) $2,707,610 $3,389,961 $3,932,948 $4,544,946 $4,889,451 $5,255,427
Interest Expense $65,896 $65,896 $65,896 $65,896 $65,896 $65,896
EBIT Restated for Valuation (R7 + R8) $2,773,506 $3,455,857 $3,998,844 $4,610,842 $4,955,347 $5,321,323
Growth in EBIT 25% 16% 15% 7% 7%
Total Adjustments $20,353 $22,629 $24,315 $26,127 $27,101 $28,111
Adjusted EBIT Restated for Valuation (R9 + R10) $2,793,859 $3,478,486 $4,023,159 $4,636,970 $4,982,448 $5,349,434
Tax Rate as a C Corp. 40% 40% 40% 40% 40% 40%
NOPAT (R11 * (1 - R12) $2,087,091 $2,413,895 $2,782,182 $2,989,469 $3,209,661
Amortization Add-back $10,107 $10,107 $0 $0 $0 $0
Adjusted NOPAT (R13 + R14) $2,097,198 $2,413,895 $2,782,182 $2,989,469 $3,209,661
Net Fixed Capital $145,538 $189,199 $227,039 $272,447 $299,692 $329,661
Change in Net Fixed Capital $43,661 $37,840 $45,408 $27,245 $29,969
Working Capital $2,463,568 $2,833,103 $3,116,414 $3,428,055 $3,599,458 $3,779,430
Change in Working Capital $369,535 $283,310 $311,641 $171,403 $179,973
Other Changes to Free Cash Flows (1) 0 $0 $0 $0 $0 $0
Free Cash Flow (R15 - R17 - R19- R20) $1,684,002 $2,092,745 $2,425,133 $2,790,821 $2,999,719

Business Valuation Report For Tentex Corp
October 1, 2013 Ross & Company CPA, PLLC Page 58 of 94
SECTION 5: OTHER KEY VALUATION FACTORS
COST OF CAPITAL: THE EXPECTED RATE OF RETURN FOR THIS FIRM
Risk versus Return
Important factors in determining the value of a company are the growth in operating
profits and rate of return that investors require. The rate of return investors require
depends on a number of factors that relate to how risky they believe the company to be.
The greater the risk about the expected operating profits growth, the greater the return
investors require to compensate them for taking this risk. Financial research shows that
a portfolio of risky stocks has returned on average 6.62% more per year than a one year
Treasury bond. This incremental return is the reward that investors receive for taking
the risk of investing in risky assets like a portfolio of stocks, rather than in riskless
Treasury bonds. To value Tentex, we must calculate its cost of capital. This is the
return investors would require, if the firm were a public company. An adjustment for the
fact that this firm is a private company is made later in the form of a liquidity discount.
Calculating the Firm-Specific Cost of Capital
The cost of capital for Tentex is constructed from factors related to economy-wide
indicators, and to industry- and size-specific measures. Since the company primarily
distributes products that are used for automobiles, we have used the median unlevered
beta from Morningstar’s Cost of Capital Yearbook for SIC 3714, Motor Vehicles Parts
and Accessories. This SIC code is appropriate for market risk, however, it will not
provide us with an accurate capital structure for Tentex, which is an LED
manufacturer/distributor. Therefore, for a debt-to-equity ratio, we have used the SIC
code for LED manufacturing, which is 3674, Semiconductors and related devices. With
this approach, we will construct a cost of capital that reflects the market risk of the
company’s end-user, trucks and auto, while still reflecting the capital structure of similar
companies, LED manufacturers. We have generated the firm’s cost of debt based on a
firm-specific credit rating model, which is shown in appendix D. Ross & Company has
generated a firm-specific cost of capital measure, as shown in the following table.

Business Valuation Report For Tentex Corp.
October 1, 2013 Ross & Company CPA, PLLC Page 59 of 94
Table 5-1: Calculating the Cost of Capital for Tentex
Source: Ross & Company
For this valuation, we also considered firm-specific non-financial risks in determining the
cost of equity for this firm. The results of this review are shown in the following table.
Table 5-2: Firm-Specific Non-Financial Risks for Tentex
Source: Ross & Company and Valuation Questionnaire
Firm-Specific Non-Financial Risks for Tentex
Risk Concept Measurement Assessment
Business Stability
How long has the company been in business?
1-3 Years - High Risk 4-6 Years - Moderate Risk
More than 6 Years - Low Risk
Low Risk
Business Transparency
Does the firm produce an audited financial statement at least once a year?
Yes - Low Risk No - High Risk High Risk
Customer Concentration
Does the firm receive more than 30% of its revenue from less than 5 customers? Yes - High Risk No - Low Risk
Low Risk
Supplier Reliance
Can the firm change suppliers without sacrificing product/service quality or increasing costs? Yes - Low Risk No - High Risk
Low Risk
Reliance on Key People
Are there any personnel critical to the success of the business that cannot be replaced in a timely way at the current market wage?
Yes - High Risk No - Low Risk
High Risk
Intensity of Competition
What is the intensity of firm competition?
Very Intense - High Risk Moderately Intense - Moderate Risk
Not Very Intense - Low Risk
Moderate Risk
Firm-Specific Risk Premium Addition to the Cost of Common Equity 3.0%
In our estimation, Tentex has average firm-specific risk premium due to three primary
reasons. First, the company does not produce audited financial statements. While, this
is not in itself a risk, it does pose a business transparency risk to potential investors.
Second, the company has key people reliance risk associated with its two owners,
Source Valuation Date 9/30/2012 Cost of Common Equity Risk Free Rate(1) 2.42% 20 Year Constant Maturity Treasury Bond Federal Reserve
Beta 1.2400 Median Unlevered Beta for Public Comps: Morningstar 2012 Cost of Capital
Yearbook: SIC 3714 D/E Ratio 0.0809 Debt to Equity Ratio: Morningstar 2012 Cost of Capital Yearbook: SIC 3674 Levered Beta 1.3002 Ross & Company Calculation Market Risk Premium 6.62% Morningstar: 2012 Valuation Edition Table 5-6 Size Premium 9.81% Morningstar: 2012 Valuation Edition Table 7-7 Firm Specific Risk Premium 3.00% Ross & Company Estimate Weight of Equity 92.52% Debt to Equity Ratio: Morningstar 2012 Cost of Capital Yearbook: SIC 3674 Cost of Common Equity(2) 23.84% Ross & Company Calculation
Cost of Debt 5.90% Ross & Company Estimate Tax Rate 40.00% Ross & Company Assumption Weight of Debt 7.48% Debt to Equity Ratio: Morningstar 2012 Cost of Capital Yearbook: SIC 3674 After Tax Cost of Debt(3) 3.54% Ross & Company Calculation
Weighted Average Cost of Capital(4) 22.32% Ross & Company Calculation
(4) Weighted Average Cost of Capital= (Weight of Debt*After Tax Cost of Debt)+(Weight of Equity*Cost of Equity)
(2) Cost of Equity=Risk Free Rate + (Beta * Market Risk Premium) + Size Premium + Firm Specific Risk Premium
Cost of Capital - Tentex Corp
(3) After Tax Cost of Debt= Cost of Debt*(1-Tax Rate)
(1) 20 Year Treasury Bond rate at valuation date

Business Valuation Report For Tentex Corp.
October 1, 2013 Ross & Company CPA, PLLC Page 60 of 94
Robert Rogers and William Rogers. Lastly, the company faces moderately intense
competition from other firms operating in the LED lighting industry and from producers of
more traditional substitutes. As shown above, our overall estimate of firm-specific risk is
3%.
TWO KEY VALUATION ADJUSTMENTS FOR THIS FIRM
There are two important adjustments that should be made in the valuation of a privately
held firm, when the valuation is centered on the total business entity. These are the
liquidity discount and the control premium and/or minority discount. In any valuation
where these adjustments are made, it is important to understand the rationale for making
these adjustments and the basis on which a valuation expert selected the values to use
in making these adjustments. These adjustment factors can be large, often ranging from
20% to 45% of the total business value before adjustment; and yet the general
explanations in the valuation literature of how to choose a value for either the liquidity
discount or control premium appear to be based on weak analysis or questionable data.
Our calculation of the liquidity discount for Tentex is described in the following section.
The Liquidity Discount
The liquidity discount reduces the ownership value to reflect the fact that the ownership
interest cannot be easily sold. Any potential buyer of the ownership value faces the risk
that he/she cannot sell the ownership interest in a timely way because there are a limited
number of potential buyers. This is to be contrasted to shares of stock that trade on the
New York Stock Exchange for example. These shares can be readily purchased and
sold and, except for rare cases, the price received will reflect the fair market value of
these shares. Thus, the liquidity discount reflects the additional risk that the buyer faces
because he/she may not be able to receive a price that would be obtained if ownership
interest in Tentex were sold in a highly liquid market.
Although much has been written on the liquidity discount and several organizations have
routinely attempted to measure it, the values traditionally reported are far too high. The
reason is that what is reported as marketability or liquidity discount is really a private
company discount. This private company discount reflects a number of factors that are
not related to lack of liquidity. The differences between private firm valuations and those
of public peers can occur because of differing cash flow growth prospects, timing of cash
flows and differing ratios of debt to equity. The result is that reported discounts for
marketability are too high and private company valuations that use them are too low.
The following table offers evidence of the variation in private company discounts.
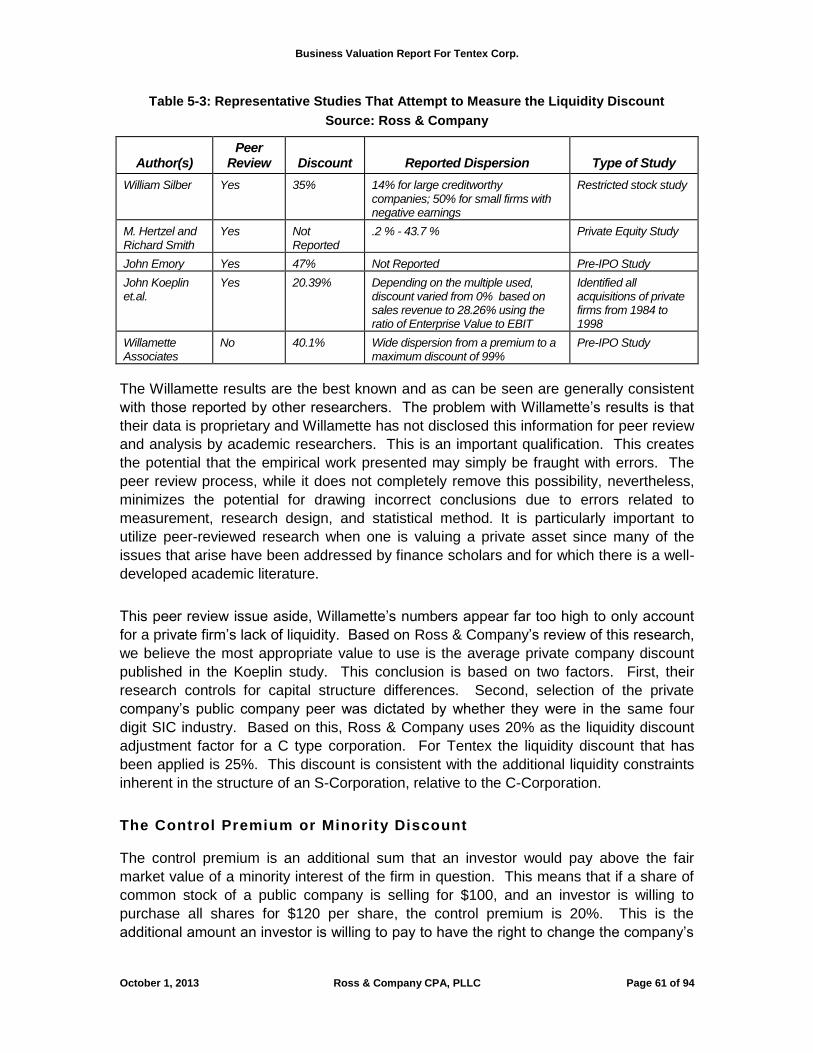
Business Valuation Report For Tentex Corp.
October 1, 2013 Ross & Company CPA, PLLC Page 61 of 94
Table 5-3: Representative Studies That Attempt to Measure the Liquidity Discount
Source: Ross & Company
Author(s) Peer
Review Discount Reported Dispersion Type of Study
William Silber Yes 35% 14% for large creditworthy companies; 50% for small firms with negative earnings
Restricted stock study
M. Hertzel and Richard Smith
Yes Not Reported
.2 % - 43.7 % Private Equity Study
John Emory Yes 47% Not Reported Pre-IPO Study
John Koeplin et.al.
Yes 20.39% Depending on the multiple used, discount varied from 0% based on sales revenue to 28.26% using the ratio of Enterprise Value to EBIT
Identified all acquisitions of private firms from 1984 to 1998
Willamette Associates
No 40.1% Wide dispersion from a premium to a maximum discount of 99%
Pre-IPO Study
The Willamette results are the best known and as can be seen are generally consistent
with those reported by other researchers. The problem with Willamette’s results is that
their data is proprietary and Willamette has not disclosed this information for peer review
and analysis by academic researchers. This is an important qualification. This creates
the potential that the empirical work presented may simply be fraught with errors. The
peer review process, while it does not completely remove this possibility, nevertheless,
minimizes the potential for drawing incorrect conclusions due to errors related to
measurement, research design, and statistical method. It is particularly important to
utilize peer-reviewed research when one is valuing a private asset since many of the
issues that arise have been addressed by finance scholars and for which there is a well-
developed academic literature.
This peer review issue aside, Willamette’s numbers appear far too high to only account
for a private firm’s lack of liquidity. Based on Ross & Company’s review of this research,
we believe the most appropriate value to use is the average private company discount
published in the Koeplin study. This conclusion is based on two factors. First, their
research controls for capital structure differences. Second, selection of the private
company’s public company peer was dictated by whether they were in the same four
digit SIC industry. Based on this, Ross & Company uses 20% as the liquidity discount
adjustment factor for a C type corporation. For Tentex the liquidity discount that has
been applied is 25%. This discount is consistent with the additional liquidity constraints
inherent in the structure of an S-Corporation, relative to the C-Corporation.
The Control Premium or Minority Discount
The control premium is an additional sum that an investor would pay above the fair
market value of a minority interest of the firm in question. This means that if a share of
common stock of a public company is selling for $100, and an investor is willing to
purchase all shares for $120 per share, the control premium is 20%. This is the
additional amount an investor is willing to pay to have the right to change the company’s

Business Valuation Report For Tentex Corp.
October 1, 2013 Ross & Company CPA, PLLC Page 62 of 94
ssets and managements in pursuit of even higher cash flows. An outside investor
cannot easily buy a minority interest in a private firm, as they can in a public firm. In
addition, in many cases, the owner of a privately held firm is the person who founded the
firm and has used his/her control of the firm to build the company into to its current level
of performance. In this type of situation, the valuation expert often concludes that the
current and projected cash flows embody the control value of the firm. To calculate the
minority value, we have to apply a minority discount to the control value of the equity of
the firm.
Ross & Company reviews a number of factors to determine whether to apply a control
premium or a minority discount to the initial discounted free cash flow results. These
include:
The ability of the owner to manage the cash flow of the firm in a way that is
consistent with life style and family responsibilities
The nature and magnitude of business non-operating assets
The quality of management
Synergies between the buying and target firm; these might include removal of
overlapping functions and therefore reducing expenses per dollar of revenue
(which is generally considered part of the strategic value of a firm, rather than the
fair market value)
Taking advantage of growth opportunities that would either not be possible or
highly expensive to take advantage of without purchasing the assets of the target
firm.
Depending upon our conclusions about the target firm, we either apply a control
premium or a minority discount to the equity value.
THE CONTROL PREMIUM OR MINORITY ADJUSTMENT FOR THIS FIRM
The determination of whether a control premium or minority discount is necessary, and
the amount calculated varies by firm based on the specific facts of the situation. In the
case of Tentex, the current active owners/managers appear to be exercising their control
to maximize the future growth of the company, even in the face of a shrinking market.
Hence, we would not expect a new owner (unless it would be a strategic acquirer) to be
able to leverage the company's assets in any greater manner than the current
owners/managers.
Consequently, we assume that the initial cash flow value includes a control premium.
We have included in that cash flow value adjustments that we have made to the
company’s financials to reflect valuation standards for financial transparency to be the
control value of the firm.

Business Valuation Report For Tentex Corp.
October 1, 2013 Ross & Company CPA, PLLC Page 63 of 94
The Minority Discount for this Firm
Based on our analysis of the firm and a review of the RMA benchmarks for different size
categories within the wholesale distribution industry and semiconductor manufacturing
industries, we have determined that owners of firms like this generally pay themselves a
total of 7.85% of revenue, or $1,592,231 for the base year. We have compared this
compensation benchmark to the average benchmark compensation for Robert Rogers
and William Rogers of $900,000 in total. We would expect a potential minority investor
in Tentex, who would not be intending to work in management, would reasonably
assume that under different management, profits would be less by the difference
between the adjusted compensation and the RMA estimated benchmark officers’
compensation value. That difference is $692,231. The calculations are shown below.
Table 5-4: Calculation in Minority Interest Reduction in Earnings
Source: Ross & Company
Thus, to determine the minority value of the firm, we have generated a second valuation
analysis, in which the officers’ compensation expense has been increased and earnings
reduced by this difference. The calculations are shown in Appendix D. The revised
values for minority owners compared to the control values for the operating business are
shown in the table below.
Table 5-5: The Minority Discount for Tentex
Source: Ross & Company
7.85%
1,592,231$
900,000$
(692,231)$
Compensation for an owner with control
Adjusted combined salary of officers
Adjustment to Officers' Compensation for Minority Discount Valuation
Compensation (as a percentage of revenue) for an owner with control
$11,329,216
$9,372,437
$1,956,779
17.27%
Control Equity
Loss in Value due to Minority Interest
Minority Discount
Minority Equity

Business Valuation Report For Tentex Corp.
October 1, 2013 Ross & Company CPA, PLLC Page 64 of 94
SECTION 6: VALUATION FINDINGS
APPROACH TO VALUATION OF THIS FIRM
The Internal Revenue Service has established guidelines for conducting a proper
business valuation. These guidelines are set down in Revenue Ruling 59-60, and the
valuation presented herein is generally consistent with these guidelines. According to
Revenue Ruling 59-60, the factors that should be considered when doing a business
valuation include:
The nature of the business and the history of the enterprise from its inception.
The economic outlook in general and the condition and outlook of the specific
industry the firm is in.
The financial condition of the business.
The earnings and dividend capacity of the company.
Whether or not the company has good will or other intangible value, like patents
for example.
Whether the whole company or only a minority interest in the company is being
valued.
The market prices of stock of companies engaged in the same or a similar line of
business having their stocks actively traded in a free and open market, either on
an exchange, like the New York Stock Exchange, or over-the-counter, like the
NASDAQ.
Defining Fair Market Value
In the United States, the most widely accepted standard for valuing a closely held
business is fair market value. This is the standard used in all matters related to state
and federal tax matters including estate taxes, gift taxes, income taxes etc. Ross &
Company applies a valuation method that it believes is consistent with the standard of
fair market value established by the IRS. The American Society of Appraisers has
defined fair market value as “the amount at which property would change hands
between a willing seller and a willing buyer when neither is acting under compulsion and
when both have reasonable knowledge of the relevant facts”.
The Internal Revenue Service in Revenue Ruling 59-60 defines fair market value as:
The price at which the property would change hands between a
willing buyer and a willing seller when the former is not under any
compulsion to buy and the latter is not under any compulsion to sell,
both parties having reasonable knowledge of relevant facts. Court
Business Valuation Report For Tentex Corp.
October 1, 2013 Ross & Company CPA, PLLC Page 65 of 94
decisions frequently state in addition that the hypothetical buyer and
seller are assumed to be able, as well as willing, to trade and to be
well informed about the property and concerning the market for
such property.8
VALUATION FUNDAMENTALS
A business valuation is an analytical process for estimating the price a willing buyer
would pay for a business and a willing seller would accept – without having to actually
sell the business.
Value as an On-going Concern
The first issue to be addressed is whether the valuation is for a business as an on-going
concern, or a business in liquidation. For an on-going business, the objective of the
valuation is to analyze the company from a prospective buyer’s perspective, i.e., what is
the likely future flow of earnings from this company. For a business in liquidation, the
value of the business is the market price of its assets minus its liabilities. For Tentex,
this is a valuation as an on-going concern.
Valuation Methods: Market and Income
Valuation analysts have developed several methods that can be used to value an on-
going concern. These methods can be grouped into two categories: market-based and
income-based methods. Market-based methods use measures of revenue and EBITDA
valuation multiples from comparable companies. For public company comparables, the
information is readily available on the value of these companies from the stock
exchanges. For private companies, the source of comparables is recent private
company sales. Income-based methods use estimates of future earnings discounted
back to the present using a cost of capital for the company being valued.
Every valuation methodology has its own set of assumptions necessary to develop this
proxy for fair market value. For example, the valuation method of using market prices
from private sales of comparable companies has two key assumptions that must be met
for the resulting valuation to be accurate. First, the firm sold and the firm being valued
must be similar in their business size and performance. Second, the sale should be very
recent to the date of the valuation, so the external conditions that influence valuations
are approximately the same.
In practice, these two assumptions are difficult to validate. Many private transactions are
not reported, while some that are reported have some seller or third party financing
8 Revenue Ruling 59-60
Business Valuation Report For Tentex Corp.
October 1, 2013 Ross & Company CPA, PLLC Page 66 of 94
involved which complicates measuring the actual price paid. Assessing comparability of
the businesses can also be challenging for many types of businesses.
IRS Revenue Ruling 59-60 suggests the use of market prices for publicly held
companies as a valuation method. In this approach, value to revenue and value to
earnings (usually earnings before interest, tax, depreciation, and amortization (EBITDA))
for “proxy” public companies are used as guidelines for valuing a private firm. These
guideline firms are typically in the same aggregate industry sector (usually 2 or perhaps
3 digit SIC). Even if more detailed industry classifications are available, the guideline
firms are placed in these classifications by their primary SIC code. This would not be a
problem except for the fact that most public companies are in multiple SIC codes and the
primary one, which is determined by the firm’s SIC that makes up the lion’s share of its
revenue, may not be the SIC that accounts for the lion’s share of the firm’s cash flow.
Income-based methods of valuation include capitalized earnings, excess earnings,
discounted cash flow, and discounted free cash flow. Each of these valuation
methodologies has its own set of assumptions and necessary data inputs. The accuracy
of these methods is dependent upon how well the assumptions are met and the
accuracy of the inputs.
Since each valuation assignment is unique, it is important to keep an open mind about
which method or set of methods will be best suited for the assignment. However, it is
also important to track how well different methods perform in predicting what the actual
price will be when a business is sold. For help on this, we turn to a classic academic
research paper by Steven N. Kaplan, University of Chicago and Richard S. Ruback,
Harvard Business School the authors state the following:
Investment bankers and dealmakers typically price acquisitions,
leveraged buyouts, IPOs, and other transactions using multiples of
current earnings or cash flow for comparable companies or
transactions. For example, if a company for sale has $100 million
of current earnings before interest tax and depreciation, and the
standard multiple for similar companies is five times EBITDA, then
the price of the company would be estimated at $500 million. --------
As we report in this article, our study provides evidence of a
strong relationship between market values of transactions in
our sample and the discounted value of their cash flow
forecasts.------ Although some of the “comparable” or
“multiple” methods performed as well on an average basis, the
discounted cash flow methods were more reliable in the sense

Business Valuation Report For Tentex Corp.
October 1, 2013 Ross & Company CPA, PLLC Page 67 of 94
that the discounted cash flow estimates were clustered more
tightly around the actual values. 9 (emphasis added)
These findings suggest that valuation results generated by market multiple methods
should be given less weight in the final valuation analysis than discounted cash flow
estimates unless the degree of comparability between the peers and the company under
review is quite high and the timing of the valuation comparables are quite close.
One must also keep in mind that Kaplan and Ruback’s study used data on public
company transactions. Valuation of private firms using private company comparable
multiples is likely to be even more error prone than the company sample used by Kaplan
and Ruback. The reasons are:
Private companies that are directly comparable to the private company to be
valued are virtually impossible to find. Hence, one is often forced to use what we
call “proxy” comparables. Using these “proxy” multiples assumes that the private
firm in question has the same cash flow growth potential and the ratio of debt to
equity as the proxy firm or what is even more unlikely the firm to be valued has
the cash flow and/or the capital structure of the median of a set of proxy firms.
Any real similarity between the firm to be valued and the proxy firm would only
occur coincidentally. Thus, for example, multiplying the median “proxy” revenue
or EBITDA (earnings before interest, tax, depreciation and amortization) multiple
by a firm’s last year revenue and/or EBITDA values respectively, will result in a
value that may be too low or too high and in any case would not be correct.
Suitable comparable transactions may not be available at the time the private
firm in question is being valued. Applying the median multiple for transactions
that happened as recently as three months ago may not be appropriate. For
example, if interest rates at the valuation date are different from those that
existed when the comparable transactions took place, the multiples will also be
different. If the current long term government interest rate were 1% lower today
than when the median for the comparable transactions took place, applying the
comparable’s multiple would result in a value that is far LOWER than it should
be.10
9
Steven N. Kaplan and Richard Ruback, “The Market Pricing of Cash Flow Forecasts: Discounted Cash
Flow vs. The Method of Comparables”, Journal of Applied Corporate Finance, Winter 1996, p.45
10
Consider the simple Gordon-Shapiro model. Value/Earnings = (1+g)/(i -g) where i is the interest rate, g is
the growth in earnings for the median firm and Value/Earnings is the median earnings multiple. Let us
assume that g is .05 and Ii is .10. The earning’s multiple is then 21. Let us say that these were the exact
circumstances that were in place 3 months ago. Firm A with earnings of $100,000 was sold for $2.1 million
(21 *$100,000) 3 months ago. Firm B is currently up for sale and also has earnings of $100,000. Since Firm
A was sold, interest rates fell from 10% to 9%. The earnings multiple is now 26.25 and Firm B is worth
$2,625,000. If the old multiple, 21, were used, then the owner of Firm B would have received $525,000 too
little for his firm.
Business Valuation Report For Tentex Corp.
October 1, 2013 Ross & Company CPA, PLLC Page 68 of 94
ROSS & COMPANY’S APPROACH TO VALUATION OF THIS FIRM
Per the requirements of Revenue Ruling 59-60, we have considered multiple methods to
generate valuation estimates for this firm. The first method described is the discounted
free cash flow method
The Discounted Free Cash Flow Forecasting Valuation Method
For the discounted free cash flow forecasting, there are key assumptions that must be
made in order to develop a reliable valuation. This approach relies on the assumption
that a reliable estimate of future cash flows can be generated for a company, and on the
assumption that the risk characteristics of the company can also be estimated. As
discussed in Sections 2 and 4, we have determined the most reasonable base year is a
weighted average of the most recent four years’ financials. For the projection period, we
have used a firm-specific projection, taking into account industry and economic factors.
Valuation of Tentex
The process of the valuation takes multiple steps to go through the analysis process:
First, we value 100% control of the firm as a C corporation with adjustments for
valuation purposes
Second, we value the tax pass-through associated with the firm’s dividend
payouts as an S corporation.
Third, we add in the value of non-operating assets and excess cash (none of
either for this firm)
Fourth, we make adjustments for the firm’s lack of liquidity to the company’s
equity
Fifth, we go through the same steps using a minority discount scenario
The elements of the discounted free cash flow valuation of 100% control of the firm as a
C corporation are shown in the table below. This analysis of adjusted earnings and cash
flows starts with Earnings before Interest Expense and Income Taxes (EBIT). We then
add back the adjustments discussed in Section 2, and calculate the net operating profit
after tax (NOPAT) based on an assumed corporate tax rate of 40%. From this NOPAT
line we make adjustments based on our capital expenditures and working capital review
in Section 4 to compute the free cash flows. These free cash flows are then discounted
by the weighted average cost of capital (WACC) to get a summation for their present
values.
The valuation calculations in the control scenario are shown below.

Business Valuation Report For Tentex Corp.
October 1, 2013 Ross & Company CPA, PLLC Page 69 of 94
Table 6-1: Valuation of Operating Business before Liquidity Adjustment – Control
Source: Ross & Company

Business Valuation Report For Tentex Corp.
October 1, 2013 Ross & Company CPA, PLLC Page 70 of 94
Valuation of Tax Pass-through
The next stage is to analyze the impact of the S corporation status on the value of
Tentex. Within the S corporation rules, a company is taxed only once on its profits by
passing these profits through to the personal tax returns of the owners. In addition,
there can be differences between the effective corporate tax rates and personal tax
rates, depending upon the number of owners and their salaries. The value of the S
corporation status is equal to:
The present value of the differences between taxing the profits of the company
as a C corporation versus taxing the distribution of those profits through the K-1
forms at the personal tax rate.
The present value of the difference between the taxes on dividends paid out by C
corporations, which are taxed to the recipient at 15% federal plus state personal
tax, versus the S corporation option of making distributions to owners on a tax-
free basis, since the owners have already been taxed on these S corporation
profits through their personal returns.
There is relatively little difference in the combined federal corporate tax rate and the
combined personal tax rate, so the value of the tax pass-through is largely based on the
avoidance of double taxation. For this calculation, we take the after-tax free cash flows
of Tentex, and apply a dividend tax over the projected period and take the present value
of the dividend tax as shown below.
Table 6-2: Valuation of Tax Pass-through – Control
Source: Ross & Company
We have added the value of the tax pass-through to the value of operations to get the
total value of the firm, which is $16,440,337. We have then subtracted the firm’s debt
and other liabilities from the total value of the firm with control before adjustments. This
consists of loan payable to a related party of $1,308,221, long-term debt of $7,792, and
current portion of long-term liabilities of $18,703, for a total of $1,334,716. The discount
for liquidity is applied to the equity portion of the value. The liquidity discount described
in Section 5 that is appropriate for an S type corporation is 25%. These calculations are
shown in the following table.
Row FYE 2013 FYE 2014 FYE 2015 FYE 2016 FYE 2017 Perpetuity
Avoided tax on Dividends: Value (1)
1 Free Cash Flow $1,684,002 $2,092,745 $2,425,133 $2,790,821 $2,999,719
2 Interest Expense $65,896 $65,896 $65,896 $65,896 $65,896
3 Free Cash Flow Less Interest Expense $1,618,106 $2,026,849 $2,359,237 $2,724,925 $2,933,823
4 Dividend Tax (R3 * Tax Rate) 20.00% $323,621 $405,370 $471,847 $544,985 $586,765 $3,034,768
5 Present Value Index (1 / (1+ Input B) ̂(Input D - Input C)) 0.90 0.74 0.60 0.49 0.40
6 Present Value (R4 * R5) $292,612 $299,651 $285,151 $269,257 $237,004 $1,225,793
7 Sum of Present Value $2,609,467
8 Value of Tax Passthrough (R7) $2,609,467
Notes:

Business Valuation Report For Tentex Corp.
October 1, 2013 Ross & Company CPA, PLLC Page 71 of 94
Table 6-3: Total Value of Tentex with Control
Source: Ross & Company
Valuation of a Minority Interest in Tentex
The process of valuing the firm for use in determining the value of minority interests
takes a similar path through the analysis process:
First, we value the firm as a C corporation without 100% control, i.e. for use in
determining the value of a minority interest where the owner of the shares has a
right to the available distributions, but does not have the right to control the
assets of the company. We used the difference between the industry’s RMA
estimated officer compensation and the benchmark officer compensation as the
proxy for the reduced EBIT that would be available to a minority owner.
Second, we value the tax pass-through associated with the firm’s dividend
payouts as an S corporation.
Third, we add in the value of the firm’s non-operating assets and excess cash
(non for this firm)
Fourth, we make adjustments for the firm’s lack of liquidity to the company’s
equity
As discussed in Section 5, we ran this type of analysis and extrapolated a minority
discount of 17.27%, which is a reasonable finding. The final results of this are shown in
the table below. The calculation for the discounted cash flow and the tax pass-through
can be found in Appendix D.
Tentex
Discounted Free Cash Flow Results- Control 9/30/2012
Value of Operations $13,830,870
Value of Tax Pass Thru $2,609,467
Total Value of Firm With Control Before Adjustments $16,440,337
Less: Value of Debt and Other Liabilities $1,334,716
Value of Equity With Control Before Adjustments $15,105,621
Liquidity Discount 25%
Loss of Value Due to Liquidity Discount $3,776,405
Value of Equity With Control After Liquidity Discount $11,329,216
Plus: Value of Debt and Other Liabilities $1,334,716
Total Fair Market Value of Firm $12,663,932
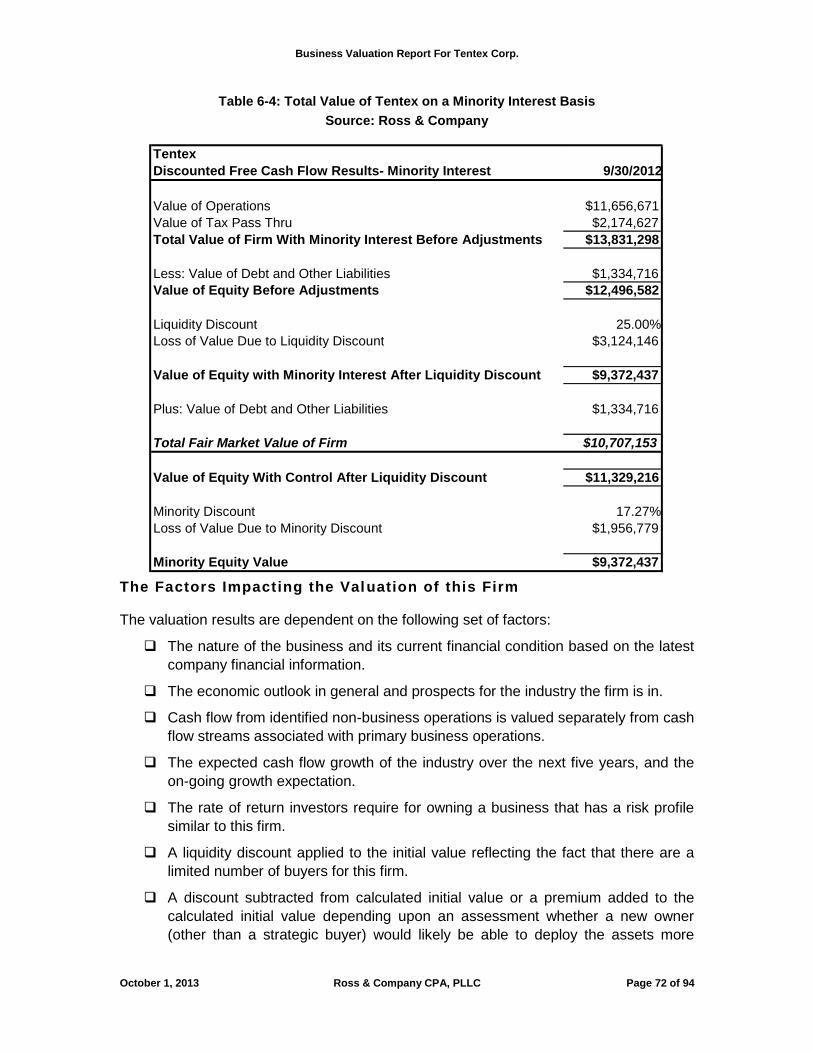
Business Valuation Report For Tentex Corp.
October 1, 2013 Ross & Company CPA, PLLC Page 72 of 94
Table 6-4: Total Value of Tentex on a Minority Interest Basis
Source: Ross & Company
The Factors Impacting the Valuation of this Firm
The valuation results are dependent on the following set of factors:
The nature of the business and its current financial condition based on the latest
company financial information.
The economic outlook in general and prospects for the industry the firm is in.
Cash flow from identified non-business operations is valued separately from cash
flow streams associated with primary business operations.
The expected cash flow growth of the industry over the next five years, and the
on-going growth expectation.
The rate of return investors require for owning a business that has a risk profile
similar to this firm.
A liquidity discount applied to the initial value reflecting the fact that there are a
limited number of buyers for this firm.
A discount subtracted from calculated initial value or a premium added to the
calculated initial value depending upon an assessment whether a new owner
(other than a strategic buyer) would likely be able to deploy the assets more
Tentex
Discounted Free Cash Flow Results- Minority Interest 9/30/2012
Value of Operations $11,656,671
Value of Tax Pass Thru $2,174,627
Total Value of Firm With Minority Interest Before Adjustments $13,831,298
Less: Value of Debt and Other Liabilities $1,334,716
Value of Equity Before Adjustments $12,496,582
Liquidity Discount 25.00%
Loss of Value Due to Liquidity Discount $3,124,146
Value of Equity with Minority Interest After Liquidity Discount $9,372,437
Plus: Value of Debt and Other Liabilities $1,334,716
Total Fair Market Value of Firm $10,707,153
Value of Equity With Control After Liquidity Discount $11,329,216
Minority Discount 17.27%
Loss of Value Due to Minority Discount $1,956,779
Minority Equity Value $9,372,437

Business Valuation Report For Tentex Corp.
October 1, 2013 Ross & Company CPA, PLLC Page 73 of 94
effectively than the current owner. A controlling or a majority interest in the firm
is more valuable than a minority interest. The reason is that controlling interest
confers the right on the controlling buyer to make decisions about how the assets
of the business are to be used. A minority interest does not confer this right and
therefore is less valuable. A minority interest only confers on the minority owner
the right to his/her pro-rata share of the firm’s earnings.
VALUATION REVIEW: PRIVATE AND PUBLIC COMPANY MARKET MULTIPLES
In accordance with IRS Revenue Ruling 59-60 (Appendix F), we have conducted a
review of companies similar to Tentex to determine whether information on the value of
these companies can be used in the valuation of Tentex. Ross & Company reviews the
major subscription transaction databases: Pratt’s Stats Private Company, Public Stats,
BizComps, and IBA Market Data. Each database differs in the type of data reported and
level of detail. In addition, since contributions to each database are purely voluntary the
information is not always reliable. Without considerable and painstaking effort to verify
and filter transaction data, making definitive conclusions on the bases of private market
transactions is difficult. Despite these shortcomings, if comparable transactions can be
identified, their market prices can be used anecdotally to substantiate the discounted
free cash flow method. Unfortunately, we were unable to find any appropriate
comparables to Tentex.
We have also searched for public companies that are similar to Tentex. However, we
were unable to identify any public companies that are comparable to Tentex.
WEIGHTING THE VALUATION METHODS
To determine a final value for the fair market value of Tentex, we have carefully
considered the degree to which the facts of this assignment are consistent with the key
assumptions of the methods of valuation used in this assignment, private company
transaction market multiples and discounted free cash flow.
It is our judgment that the private company transaction multiples available for use as
comparables are not appropriate to use due to important differences in size and
geographical coverage, compared to Tentex, and to the lack of a sufficient and current
sample size to provide reliable results. There are no facts in this assignment that limit
the appropriateness of the discounted free cash flow method to the valuation of Tentex.
Accordingly, we have assigned the weights as shown in the following table to the
valuation results generated by the different methods employed in this assignment.

Business Valuation Report For Tentex Corp.
October 1, 2013 Ross & Company CPA, PLLC Page 74 of 94
Table 6-5: Weighting of Different Valuation Results
Source: Ross & Company
The total fair market value of Tentex is $12,663,932. The value of equity with control is
$11,329,216. The results of our analysis indicate that there is a 17.27% discount for
having a minority interest. Thus, the value of equity on a minority basis is $9,372,437.
The value on a rounded basis of a 50% interest owned by Robert Rogers is $4,690,000.
These valuation results for Tentex, as of September 30, 2012, are shown in the table
below.
Table 6-6: Valuation Results
Source: Ross & Company
Valuation Weighting for Tentex as of September 30, 2012
Valuation Method Weight
Income Valuation: Discounted Free Cash Flow 100.00%
Market Valuation: Private Comparables Not Applicable
Market Valuation: Public Comparables Not Applicable
Sum of the Valuation Weights 100.00%
Tentex Corp. 9/30/2012
Total Fair Market Value of Firm $12,663,932
Less: Value of Debt and Other Liabilities $1,334,716
Value of Equity with Control $11,329,216
Minority Discount 17.27%
Loss of Value Due to Minority Discount $1,956,779
Minority Equity Value $9,372,437
Ownership % of Robert Rogers 50%
Value of Robert Rogers Minority Equity Interest $4,686,219
Value of Robert Rogers Minority Equity Interest (Rounded) $4,690,000

Business Valuation Report For Tentex Corp.
October 1, 2013 Ross & Company CPA, PLLC Page 75 of 94
APPENDIX A: ABOUT ROSS & COMPANY CPA, PLLC
Ross & Company, CPA’s roots date back to 1930 when Jack Ross partnered with Goldstein & Goldstein
CPA. In 1966, Mr. Jack Ross bought out the Goldstein partners with his son Myron Ross and changed the
name to Ross & Ross CPAs. In 1992, Mr. Myron Ross's son, Glen Ross, joined the firm. Upon Mr. Myron
Ross's retirement in June of 2005, Mr. Glen Ross changed the name to Ross & Company CPA, PLLC and
continues his grandfather's vision: to build the firm into a state of the art practice servicing a growing
clientele in an ever wider array of industries.
Today, Ross & Company, CPA has offices on Long Island, NY, Boynton Beach, FL and Oakland, ME
specializing in tax planning and preparation, personal financial planning, accounting and auditing, small
business consulting, as well as business valuations, appraisals and litigation consulting. The firm is capable
of providing a full complement of resources and services typically expected only from a large accounting
firm.
Financial Planning Services includes: Investment Consulting, Cash Flow & Budgeting
Analysis, Retirement Planning, Estate and Business Succession Planning and Insurance Consulting.
Tax Planning & Return Prep: The firm continuously monitors federal, state and local tax law changes to
minimize clients' current and future tax liabilities. If necessary, it implements tailor made detailed
compliance monitoring systems to prevent costly interest and penalty assessments attributed to late filing.
In addition, the firm offers full tax preparation and filing services.
Auditing Services: The firm examines company's financial statements in accordance with generally
accepted auditing standards. An audit requires the firm to examine internal controls and to complete
substantial testing of the information underlying the financial statements.
Business Valuation Services: The firm conducts comprehensive analysis that for making informed
decisions: ESOPs, litigation support, mergers and acquisitions, divorce settlements, and buy - sell
agreements.
Expert Witness Services: The firm offers witness testimony in the areas of business valuation and other
matters requiring forensic accounting expertise.
Forensic Accounting: The firm offers tailor made forensic accounting services as well as expert testimony.
Bookkeeping/Write-Up: The firm provides full-charge bookkeeping services, including general journal and
subsidiary ledger maintenance, bank statement reconciliation, and receivables and payables tracking and
analysis.
Financial Forecast and Projections: The firm provides complete financial and business forecasting
services, including proforma projections. It also customizes What-If planning scenarios to help management
plan for unexpected business contingencies.
Computer Consulting: Through a network of companies, business-savvy computer technicians and
programmers can explain even the most advanced high-tech concepts in plain English.
Internet Commerce: The firm offers advice on the upside and the downside to e-commerce.

Business Valuation Report For Tentex Corp.
October 1, 2013 Ross & Company CPA, PLLC Page 76 of 94
APPENDIX B: PROFESSIONAL QUALIFICATIONS
GLEN A. ROSS, CPA CVA
Mr. Ross graduated from Long Island University-CW Post Campus in 1992 with a Bachelor of Science Degree. He received his CPA designation-New York State licensure in 1998 and received his Certified Valuation Analyst (CVA) designation in 2003. Mr. Ross is a member of the New York State Society of Certified Public Accountants, the National Conference of Certified Public Accounting Practitioners and the National Association of Certified Valuation Analysts. Mr. Ross has worked for the CPA firm of Ross & Ross, CPA since 1992 and became a Partner of said firm in 1998. In 2005, the firm changed names to Ross & Company CPA, PLLC. He has been active in fundraising for L.I. Cares, an organization dedicated to fighting hunger on Long Island, and has fed hundreds of families over the past few years. In 1999, Mr. Ross founded an online interactive advertising company. He acted as President and CEO of the company until it was sold in 2001. In 2011, Mr. Ross became a member of the board of directors of a national wholesale insurance broker that writes premiums in excess of $200 million and in 2013 became a member of the board of directors of a not-for-profit. In 2012, he founded another online company that connects customers with tax preparers in need of service. In 2003 and 2004 Mr. Ross lectured on business valuations. His course, Understanding & Using Business Valuations, is approved for both CPE and CLE credit. Mr. Ross has specialized knowledge and experience in the following industries and areas:
Valuations of various entities and professional licenses including litigation support services.
Forensic accounting in the determination of fraud and true economic value.
Vast experience in taxation, tax planning and management advisory services for small, closely held businesses, new start-ups and going concern entities with a concentration in the insurance industry.
Financial statement presentation and support.
Computer consulting and integrated systems analysis. Mr. Ross has worked on many major projects over the years including, but not limited to:
Conducted and/or assisted in hundreds of valuation engagements consisting of: Matrimonial disputes of closely held businesses, valuations of professional licenses, valuations of closely held businesses for estate taxes, gifting, buy/sell agreements and ESOPs.
Mr. Ross was a Beta tester for “ValueSource Pro 2003” from John Wiley & Sons. This program is the leading valuation and financial analysis software in the country.
Mr. Ross has prepared and/or analyzed financial statement projections and related analysis for start-up organizations and/or going concern entities.
Mr. Ross has performed and/or assisted in certified audits for closely
held businesses since 1991, totaling in excess of 90 audits.
Business Valuation Report For Tentex Corp.
October 1, 2013 Ross & Company CPA, PLLC Page 77 of 94
Mr. Ross has been deposed in New York State Supreme Court, Kings County and has testified as an expert in New York State Supreme Court, Westchester County and as well as Kings County.
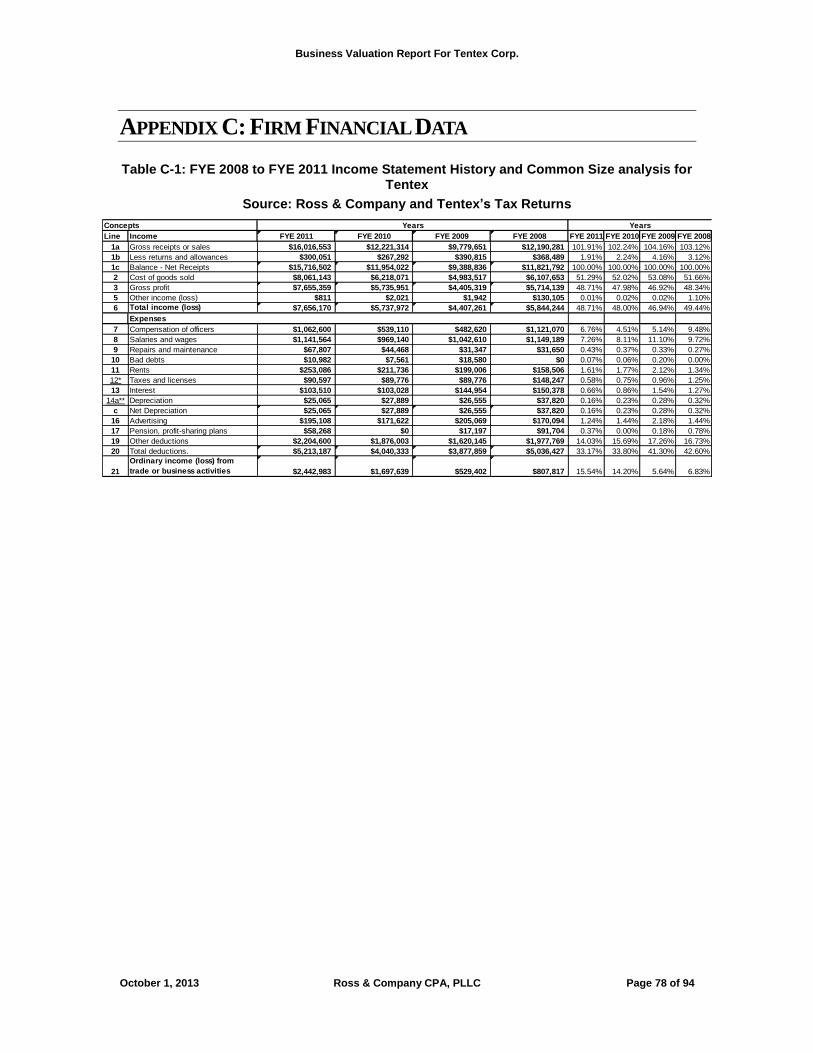
Business Valuation Report For Tentex Corp.
October 1, 2013 Ross & Company CPA, PLLC Page 78 of 94
APPENDIX C: FIRM FINANCIAL DATA
Table C-1: FYE 2008 to FYE 2011 Income Statement History and Common Size analysis for Tentex
Source: Ross & Company and Tentex’s Tax Returns
Concepts
Line Income FYE 2011 FYE 2010 FYE 2009 FYE 2008 FYE 2011 FYE 2010 FYE 2009 FYE 2008
1a Gross receipts or sales $16,016,553 $12,221,314 $9,779,651 $12,190,281 101.91% 102.24% 104.16% 103.12%
1b Less returns and allowances $300,051 $267,292 $390,815 $368,489 1.91% 2.24% 4.16% 3.12%
1c Balance - Net Receipts $15,716,502 $11,954,022 $9,388,836 $11,821,792 100.00% 100.00% 100.00% 100.00%
2 Cost of goods sold $8,061,143 $6,218,071 $4,983,517 $6,107,653 51.29% 52.02% 53.08% 51.66%
3 Gross profit $7,655,359 $5,735,951 $4,405,319 $5,714,139 48.71% 47.98% 46.92% 48.34%
5 Other income (loss) $811 $2,021 $1,942 $130,105 0.01% 0.02% 0.02% 1.10%
6 Total income (loss) $7,656,170 $5,737,972 $4,407,261 $5,844,244 48.71% 48.00% 46.94% 49.44%
Expenses
7 Compensation of officers $1,062,600 $539,110 $482,620 $1,121,070 6.76% 4.51% 5.14% 9.48%
8 Salaries and wages $1,141,564 $969,140 $1,042,610 $1,149,189 7.26% 8.11% 11.10% 9.72%
9 Repairs and maintenance $67,807 $44,468 $31,347 $31,650 0.43% 0.37% 0.33% 0.27%
10 Bad debts $10,982 $7,561 $18,580 $0 0.07% 0.06% 0.20% 0.00%
11 Rents $253,086 $211,736 $199,006 $158,506 1.61% 1.77% 2.12% 1.34%
12* Taxes and licenses $90,597 $89,776 $89,776 $148,247 0.58% 0.75% 0.96% 1.25%
13 Interest $103,510 $103,028 $144,954 $150,378 0.66% 0.86% 1.54% 1.27%
14a** Depreciation $25,065 $27,889 $26,555 $37,820 0.16% 0.23% 0.28% 0.32%
c Net Depreciation $25,065 $27,889 $26,555 $37,820 0.16% 0.23% 0.28% 0.32%
16 Advertising $195,108 $171,622 $205,069 $170,094 1.24% 1.44% 2.18% 1.44%
17 Pension, profit-sharing plans $58,268 $0 $17,197 $91,704 0.37% 0.00% 0.18% 0.78%
19 Other deductions $2,204,600 $1,876,003 $1,620,145 $1,977,769 14.03% 15.69% 17.26% 16.73%
20 Total deductions. $5,213,187 $4,040,333 $3,877,859 $5,036,427 33.17% 33.80% 41.30% 42.60%
21
Ordinary income (loss) from
trade or business activities $2,442,983 $1,697,639 $529,402 $807,817 15.54% 14.20% 5.64% 6.83%
Years Years

Business Valuation Report For Tentex Corp.
October 1, 2013 Ross & Company CPA, PLLC Page 79 of 94
Table C-2: Tax Return Income Statement Details & Common Size Analysis Tentex
Source: Ross & Company and Tentex’s Tax Returns
Travel $145,894 $118,053 $113,660 $111,030 0.93% 0.99% 1.21% 0.94%
Meals and Entertainment $8,628 $6,604 $6,543 $7,597 0.05% 0.06% 0.07% 0.06%
Allocated 263A Costs ($159,610) ($120,858) ($137,325) ($142,474) -1.02% -1.01% -1.46% -1.21%
Auto Lease $32,010 $21,912 $31,955 $44,802 0.20% 0.18% 0.34% 0.38%
Bank Charges $42,972 $60,955 $42,441 $41,794 0.27% 0.51% 0.45% 0.35%
Casual Labor $26,283 $7,365 $3,825 $410 0.17% 0.06% 0.04% 0.00%
Collection Costs $2,830 $4,466 $1,844 $2,288 0.02% 0.04% 0.02% 0.02%
Commission $776,443 $592,512 $469,296 $594,327 4.94% 4.96% 5.00% 5.03%
Consulting $2,466 $44,365 $0 $0 0.02% 0.37% 0.00% 0.00%
Data Processing $115,450 $19,675 $37,958 $48,530 0.73% 0.16% 0.40% 0.41%
Dues and Subscription $24,913 $0 $18,394 $14,997 0.16% 0.00% 0.20% 0.13%
Foreign Exchange Loss $749 $280 $9 0.00% 0.00% 0.00% 0.00%
Gifts $14,296 $8,090 $8,640 $25,448 0.09% 0.07% 0.09% 0.22%
Insurance $241,566 $214,770 $222,983 $321,187 1.54% 1.80% 2.37% 2.72%
Internet Service $111,118 $55,400 $23,926 $43,749 0.71% 0.46% 0.25% 0.37%
Laboratory Testing $21,745 $36,062 $17,539 $24,810 0.14% 0.30% 0.19% 0.21%
Leased Equipment $15,720 $15,499 $12,075 $11,408 0.10% 0.13% 0.13% 0.10%
Miscellaneous ($16,693) $5,141 $0 $0 -0.11% 0.04% 0.00% 0.00%
Office Cleaning $8,502 $5,649 $8,397 $12,378 0.05% 0.05% 0.09% 0.10%
Office Supplies & Postage $75,290 $69,713 $60,467 $63,356 0.48% 0.58% 0.64% 0.54%
Packaging $29,251 $24,227 $16,838 $21,632 0.19% 0.20% 0.18% 0.18%
Payroll Service Costs $3,563 $3,516 $3,537 $3,311 0.02% 0.03% 0.04% 0.03%
Pest Control $0 $0 $652 $652 0.00% 0.00% 0.01% 0.01%
Professional Fees $122,825 $119,498 $146,685 $125,463 0.78% 1.00% 1.56% 1.06%
Promotional Items $0 $104,415 $112,611 $115,437 0.00% 0.87% 1.20% 0.98%
Refuse Removal $8,065 $9,683 $10,464 $9,348 0.05% 0.08% 0.11% 0.08%
Royalties $0 $0 $0 $470 0.00% 0.00% 0.00% 0.00%
Samples $11,065 $10,723 $7,705 $10,140 0.07% 0.09% 0.08% 0.09%
Security Expense $2,530 $2,156 $2,143 $5,603 0.02% 0.02% 0.02% 0.05%
Shipping $401,258 $297,588 $237,931 $293,147 2.55% 2.49% 2.53% 2.48%
Telephone $30,864 $28,951 $28,921 $27,722 0.20% 0.24% 0.31% 0.23%
Trade Show Expense $27,680 $31,879 $41,332 $76,698 0.18% 0.27% 0.44% 0.65%
Utilities $76,927 $77,714 $68,699 $62,509 0.49% 0.65% 0.73% 0.53%
Total to Form 1120, Line 26 $2,204,600 $1,876,003 $1,620,145 $1,977,769 14.03% 15.69% 17.26% 16.73%
Schedule A- Cost of Goods Sold
Concepts
Line Income FYE 2011 FYE 2010 FYE 2009 FYE 2008
1 Inventory at beginning of year $2,194,436 $1,719,959 $2,356,885 $2,582,576 13.96% 14.39% 25.10% 21.85%
2 Purchases $7,571,995 $6,138,004 $3,877,168 $5,314,490 48.18% 51.35% 41.30% 44.96%
3 Cost of labor $241,574 $234,466 $202,983 $246,588 1.54% 1.96% 2.16% 2.09%
4 Additional Section 263A costs $159,610 $120,858 $137,325 $142,474 1.02% 1.01% 1.46% 1.21%
5 Other costs $170,743 $199,220 $129,115 $178,410 1.09% 1.67% 1.38% 1.51%
6 Total $10,338,358 $8,412,507 $6,703,476 $8,464,538 65.78% 70.37% 71.40% 71.60%
7 Inventory at end of year $2,277,215 $2,194,436 $1,719,959 $2,356,885 14.49% 18.36% 18.32% 19.94%
8 Cost of goods sold $8,061,143 $6,218,071 $4,983,517 $6,107,653 51.29% 52.02% 53.08% 51.66%
Schedule A- Statement 3
Cost of Goods Sold - Other Costs FYE 2011 FYE 2010 FYE 2009 FYE 2008
Payroll Tax $44,008 $32,990 $11,548 $11,830 0.28% 0.28% 0.12% 0.10%
Tooling $100,897 $116,808 $55,584 $90,420 0.64% 0.98% 0.59% 0.76%
Depreciation Expense $25,838 $49,422 $61,983 $69,210 0.16% 0.41% 0.66% 0.59%
Consulting $6,950 0.00% 0.00% 0.00% 0.06%
Total to Schedule A, Line 5 $170,743 $199,220 $129,115 $178,410 1.09% 1.67% 1.38% 1.51%
Years
Years
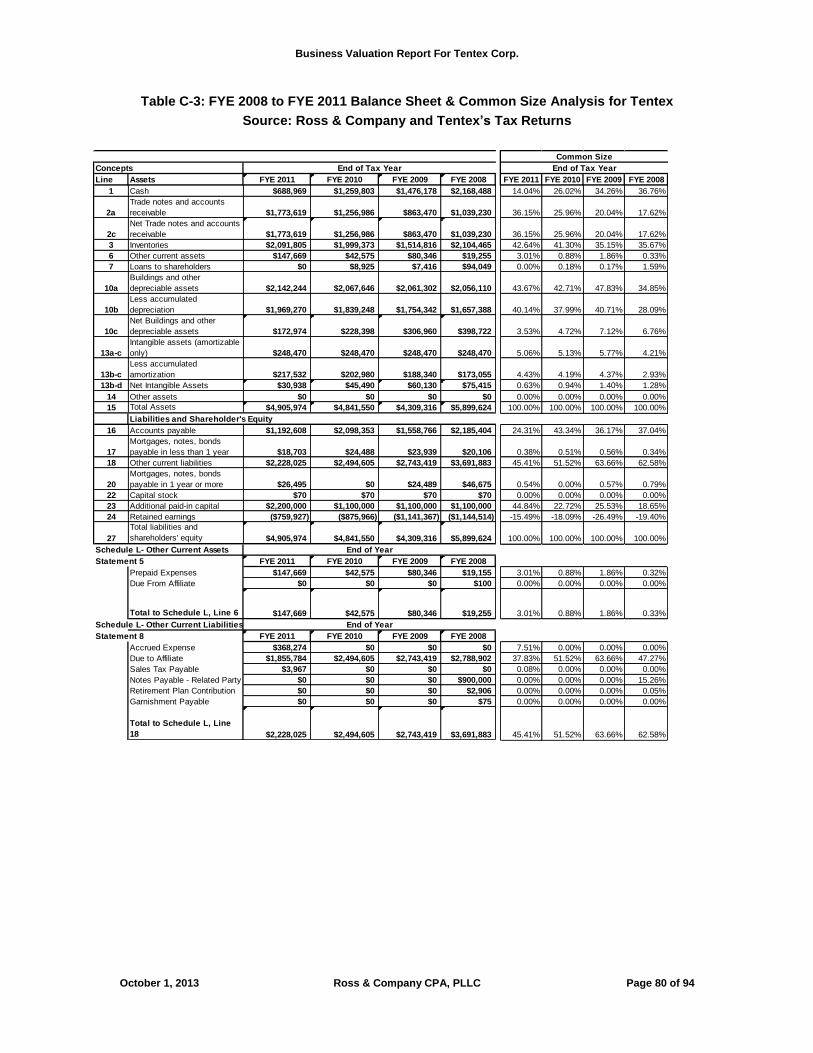
Business Valuation Report For Tentex Corp.
October 1, 2013 Ross & Company CPA, PLLC Page 80 of 94
Table C-3: FYE 2008 to FYE 2011 Balance Sheet & Common Size Analysis for Tentex
Source: Ross & Company and Tentex’s Tax Returns
Concepts
Line Assets FYE 2011 FYE 2010 FYE 2009 FYE 2008 FYE 2011 FYE 2010 FYE 2009 FYE 2008
1 Cash $688,969 $1,259,803 $1,476,178 $2,168,488 14.04% 26.02% 34.26% 36.76%
2a
Trade notes and accounts
receivable $1,773,619 $1,256,986 $863,470 $1,039,230 36.15% 25.96% 20.04% 17.62%
2c
Net Trade notes and accounts
receivable $1,773,619 $1,256,986 $863,470 $1,039,230 36.15% 25.96% 20.04% 17.62%
3 Inventories $2,091,805 $1,999,373 $1,514,816 $2,104,465 42.64% 41.30% 35.15% 35.67%
6 Other current assets $147,669 $42,575 $80,346 $19,255 3.01% 0.88% 1.86% 0.33%
7 Loans to shareholders $0 $8,925 $7,416 $94,049 0.00% 0.18% 0.17% 1.59%
10a
Buildings and other
depreciable assets $2,142,244 $2,067,646 $2,061,302 $2,056,110 43.67% 42.71% 47.83% 34.85%
10b
Less accumulated
depreciation $1,969,270 $1,839,248 $1,754,342 $1,657,388 40.14% 37.99% 40.71% 28.09%
10c
Net Buildings and other
depreciable assets $172,974 $228,398 $306,960 $398,722 3.53% 4.72% 7.12% 6.76%
13a-c
Intangible assets (amortizable
only) $248,470 $248,470 $248,470 $248,470 5.06% 5.13% 5.77% 4.21%
13b-c
Less accumulated
amortization $217,532 $202,980 $188,340 $173,055 4.43% 4.19% 4.37% 2.93%
13b-d Net Intangible Assets $30,938 $45,490 $60,130 $75,415 0.63% 0.94% 1.40% 1.28%
14 Other assets $0 $0 $0 $0 0.00% 0.00% 0.00% 0.00%
15 Total Assets $4,905,974 $4,841,550 $4,309,316 $5,899,624 100.00% 100.00% 100.00% 100.00%
Liabilities and Shareholder's Equity
16 Accounts payable $1,192,608 $2,098,353 $1,558,766 $2,185,404 24.31% 43.34% 36.17% 37.04%
17
Mortgages, notes, bonds
payable in less than 1 year $18,703 $24,488 $23,939 $20,106 0.38% 0.51% 0.56% 0.34%
18 Other current liabilities $2,228,025 $2,494,605 $2,743,419 $3,691,883 45.41% 51.52% 63.66% 62.58%
20
Mortgages, notes, bonds
payable in 1 year or more $26,495 $0 $24,489 $46,675 0.54% 0.00% 0.57% 0.79%
22 Capital stock $70 $70 $70 $70 0.00% 0.00% 0.00% 0.00%
23 Additional paid-in capital $2,200,000 $1,100,000 $1,100,000 $1,100,000 44.84% 22.72% 25.53% 18.65%
24 Retained earnings ($759,927) ($875,966) ($1,141,367) ($1,144,514) -15.49% -18.09% -26.49% -19.40%
27
Total liabilities and
shareholders' equity $4,905,974 $4,841,550 $4,309,316 $5,899,624 100.00% 100.00% 100.00% 100.00%
Schedule L- Other Current Assets
Statement 5 FYE 2011 FYE 2010 FYE 2009 FYE 2008
Prepaid Expenses $147,669 $42,575 $80,346 $19,155 3.01% 0.88% 1.86% 0.32%
Due From Affiliate $0 $0 $0 $100 0.00% 0.00% 0.00% 0.00%
Total to Schedule L, Line 6 $147,669 $42,575 $80,346 $19,255 3.01% 0.88% 1.86% 0.33%
Schedule L- Other Current Liabilities
Statement 8 FYE 2011 FYE 2010 FYE 2009 FYE 2008
Accrued Expense $368,274 $0 $0 $0 7.51% 0.00% 0.00% 0.00%
Due to Affiliate $1,855,784 $2,494,605 $2,743,419 $2,788,902 37.83% 51.52% 63.66% 47.27%
Sales Tax Payable $3,967 $0 $0 $0 0.08% 0.00% 0.00% 0.00%
Notes Payable - Related Party $0 $0 $0 $900,000 0.00% 0.00% 0.00% 15.26%
Retirement Plan Contribution $0 $0 $0 $2,906 0.00% 0.00% 0.00% 0.05%
Garnishment Payable $0 $0 $0 $75 0.00% 0.00% 0.00% 0.00%
Total to Schedule L, Line
18 $2,228,025 $2,494,605 $2,743,419 $3,691,883 45.41% 51.52% 63.66% 62.58%
End of Year
End of Year
End of Tax YearEnd of Tax Year
Common Size

Business Valuation Report For Tentex Corp.
October 1, 2013 Ross & Company CPA, PLLC Page 81 of 94
Table C-4: FYE 2012 Income Statement with Common Size Analysis for Tentex
Source: Ross & Company and Tentex’s Financial Statements
Tentex Corp FYE 2012 FYE 2012 REVENUE
Sales $20,631,214 101.72% Less: Returns & Allowances ($348,017) -1.72%
Net Revenue $20,283,197 100.00%
Cost of Goods Sold Purchases $10,113,356 49.86% Direct Labor $277,985 1.37%
Payroll Taxes $23,954 0.12% Tooling $121,998 0.60%
Total Other Overhead $145,952 0.72% Total Cost of Goods Sold $10,537,293 51.95%
Gross Profit $9,745,904 48.05%
SELLING, GENERAL & ADMINISTRATIVE Officers' Salaries $1,614,000 7.96% Depreciation & Amortization $97,748 0.48% Bad Debt Expense $9,347 0.05%
$0 0.00% SELLING EXPENSES $0 0.00% Payroll - sales $578,501 2.85% Payroll Taxes $49,850 0.25% Advertising $235,346 1.16% Business Gifts $20,253 0.10% Commission $994,314 4.90% Internet Charges $140,816 0.69% Meals and Entertainment $37,062 0.18% Packaging Expenses $32,324 0.16% Sample Items $8,870 0.04% Shipping $533,206 2.63% Trade Show Expenses $13,594 0.07% Travel $180,313 0.89%
$0 0.00% GENERAL AND ADMINISTRATIVE EXPENSES $0 0.00% Payroll - Office $926,991 4.57% Payroll Taxes $117,385 0.58% Auto Leases $41,492 0.20% Bank Charges $26,881 0.13% Casual Labor $23,844 0.12% Charitable Contributions $100 0.00% Collection Costs $1,560 0.01% Consulting $2,489 0.01% Data Processing $83,005 0.41% Dues and Subscriptions $23,640 0.12% Insurance - General $363,945 1.79% Internet Services $15,493 0.08% Laboratory Testing $40,820 0.20% Leases - Equipment $19,200 0.09% Merchant Processing Fees $17,268 0.09% Miscellaneous $2,625 0.01% Office and Postage $87,134 0.43% Payroll Processing Costs $4,124 0.02% Professional Fees $54,705 0.27% Recruitment Fees $2,031 0.01% Retirment Plan Expense $103,268 0.51% Telephone $34,258 0.17%
$0 0.00% OCCUPANCY COSTS $0 0.00% Payroll - Property Management $75,616 0.37% Payroll Taxes $6,516 0.03% Office Cleaning $8,915 0.04% Refuse Removal $7,904 0.04% Rent and Real Estate Taxes $278,506 1.37% Repairs and Maintenance $47,714 0.24% Security Expense $8,024 0.04% Utilities $67,297 0.33%
Total Selling, General & Administrative $7,038,294 34.70%
Operating Profit $2,707,610 13.35%
Common Size Analysis

Business Valuation Report For Tentex Corp.
October 1, 2013 Ross & Company CPA, PLLC Page 82 of 94
Table C-5: FYE 2012 Balance Sheet with Common Size Analysis for Tentex
Source: Ross & Company and Tentex’s Financial Statements
Tentex Corp As of 9/30/2012
ASSETS FYE 2012 FYE 2012
CURRENT ASSETS
Cash $215,941 4.15%
Accounts Receivable, net of allowance for bad debts $2,038,648 39.16%
Inventory $2,542,305 48.83%
Total Current Assets $4,796,894 92.14%
PROPERTY, PLANT & EQUIPMENT
Fixed Assets, net $145,538 2.80%
Total Property, Plant & Equipment $145,538 2.80%
OTHER ASSETS
Intangible Assets $20,830 0.40%
Federal Tax Deposit $242,772 4.66%
Total Other Assets $263,602 5.06%
Total Assets $5,206,034 100.00%
Liabilities & Shareholder Equity
CURRENT LIABILITIES
Accounts Payable and Accrued Expenses $2,288,326 43.96%
Current Portion of Long-Term Liabilities $18,703 0.36%
Retirement Plan Payable $45,000 0.86%
Sales Tax Payable $4,165 0.08%
Total Current Liabilities $2,356,194 45.26%
LONG-TERM DEBT
Long-Term Debt $7,792 0.15%
Loan Payable - Related Party $1,308,221 25.13%
Total Long-Term Debt $1,316,013 25.28%
SHAREHOLDER'S EQUITY
Common Stock - $1 par value, 70 shares authorized,
isued and outstanding, stated at $70 0.00%
Additional Paid-In Capital $2,200,000 42.26%
Accumulated Deficit ($666,243) -12.80%
Total Shareholder's Equity $1,533,827 29.46%
Total Liabilities and Shareholder's Equity $5,206,034 100.00%
Common Size Analysis

Business Valuation Report For Tentex Corp.
October 1, 2013 Ross & Company CPA, PLLC Page 83 of 94
APPENDIX D: DETAILED VALUATION CALCULATIONS
Table D-1: Valuation Results – Minority
Source: Ross & Company

Business Valuation Report For Tentex Corp.
October 1, 2013 Ross & Company CPA, PLLC Page 84 of 94
Table D-2: Valuation of Tax Pass-through – Minority
Source: Ross & Company
Row FYE 2013 FYE 2014 FYE 2015 FYE 2016 FYE 2017 Perpetuity
Avoided tax on Dividends: Value (1)
1 Free Cash Flow $1,268,663 $1,677,407 $2,009,794 $2,375,483 $2,584,380
2 Interest Expense $65,896 $65,896 $65,896 $65,896 $65,896
3 Free Cash Flow Less Interest Expense $1,202,767 $1,611,511 $1,943,898 $2,309,587 $2,518,484
4 Dividend Tax (R3 * Tax Rate) 20.00% $240,553 $322,302 $388,780 $461,917 $503,697 $2,605,139
5 Present Value Index (1 / (1+ Input B) ̂(Input D - Input C)) 0.90 0.74 0.60 0.49 0.40
6 Present Value (R4 * R5) $217,503 $238,247 $234,951 $228,216 $203,451 $1,052,259
7 Sum of Present Value $2,174,627
8 Value of Tax Passthrough (R7) $2,174,627
Notes:
1) Perpetuity Value = Dividend Tax * (1+Input A) / (Input B - Input A)

Business Valuation Report For Tentex Corp.
October 1, 2013 Ross & Company CPA, PLLC Page 85 of 94
Table D-3: Tentex Credit Analysis Original Data
Source: Ross & Company and Tentex’s financial statements & tax returns
Table D-4: Tentex Credit Rating Analysis Coefficients
Source: Ross & Company
Net Income
Depreciation and
Amortization
Funds From
Operation
(FFO) (1)
Capital
Expenditure
$2,702,907 $97,748 $2,800,655 $60,205
Current Assets
(Current)
Current Liabilities
(Current)
Current Assets
(1 Year Ago)
Current
Liabilities (1
Year Ago)
$4,796,894 $2,356,194 $4,702,062 $3,420,633
Cash and Cash
Equivalents (Current)
Short-term Debt
(Current)
Cash and Cash
Equivalents (1
Year Ago)
Short-term Debt
(1 Year Ago)
$215,941 $18,703 $688,969 $18,703
Free Operating Cash
Flow (2)
$1,108,151
Revenue $20,283,197
(1) FFO = Net Income + Depreciation and Amortization
(2)Free Operating Cash Flow = FFO - capital
expenditures -(+) increase (decrease) in working capital
(excluding changes in cash, marketable securities, and
short-term debt)
Value Source
Unlevered Beta 1.24
Median Unlevered
Beta for Public
Comps
BV D/E Ratio 0.08
Median D/E for
Public Comps
Levered Beta 1.30
Unlevered Beta * (1 +
(BV D/E Ratio) * (1 -
Tax Rate 40%))
Scenario
Free Operating Cash
Flow / Revenue (X1)
Unlevered Beta
(X2)
Unlevered Beta *
BV D/E (X3) Revenue (X4) IndustrialSecurity Credit
Assessment 0.0546 1.24 0.10 $20,283,197 9.7399
Ross & Company's
Regression Model
CoefficientsFree Operating Cash
Flow / Revenue Unlevered Beta
Unlevered Beta *
BV D/E Revenue Industrial
Coefficient -3.5490 2.5911 1.6733 -2.85E-11 9.7399
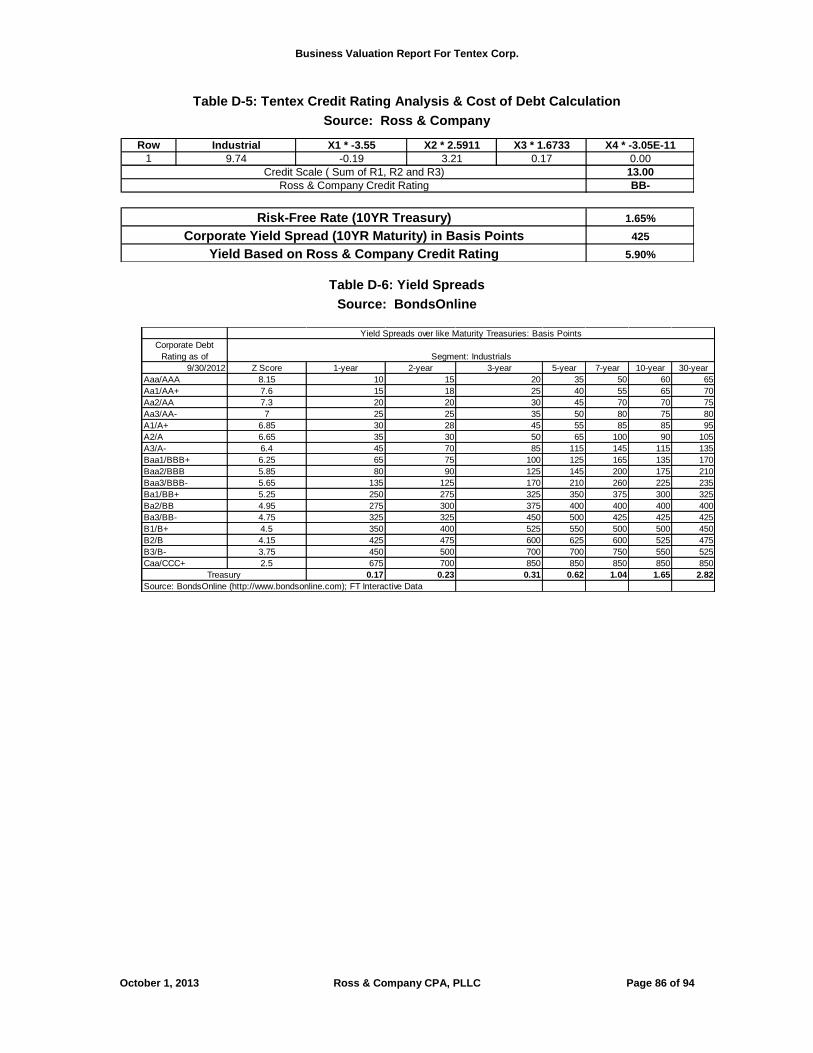
Business Valuation Report For Tentex Corp.
October 1, 2013 Ross & Company CPA, PLLC Page 86 of 94
Table D-5: Tentex Credit Rating Analysis & Cost of Debt Calculation
Source: Ross & Company
Table D-6: Yield Spreads
Source: BondsOnline
Row Industrial X1 * -3.55 X2 * 2.5911 X3 * 1.6733 X4 * -3.05E-11
1 9.74 -0.19 3.21 0.17 0.00
13.00
BB-
1.65%
425
5.90%
Credit Scale ( Sum of R1, R2 and R3)
Ross & Company Credit Rating
Risk-Free Rate (10YR Treasury)
Corporate Yield Spread (10YR Maturity) in Basis Points
Yield Based on Ross & Company Credit Rating
Corporate Debt
Rating as of
9/30/2012 Z Score 1-year 2-year 3-year 5-year 7-year 10-year 30-year
Aaa/AAA 8.15 10 15 20 35 50 60 65
Aa1/AA+ 7.6 15 18 25 40 55 65 70
Aa2/AA 7.3 20 20 30 45 70 70 75
Aa3/AA- 7 25 25 35 50 80 75 80
A1/A+ 6.85 30 28 45 55 85 85 95
A2/A 6.65 35 30 50 65 100 90 105
A3/A- 6.4 45 70 85 115 145 115 135
Baa1/BBB+ 6.25 65 75 100 125 165 135 170
Baa2/BBB 5.85 80 90 125 145 200 175 210
Baa3/BBB- 5.65 135 125 170 210 260 225 235
Ba1/BB+ 5.25 250 275 325 350 375 300 325
Ba2/BB 4.95 275 300 375 400 400 400 400
Ba3/BB- 4.75 325 325 450 500 425 425 425
B1/B+ 4.5 350 400 525 550 500 500 450
B2/B 4.15 425 475 600 625 600 525 475
B3/B- 3.75 450 500 700 700 750 550 525
Caa/CCC+ 2.5 675 700 850 850 850 850 850
0.17 0.23 0.31 0.62 1.04 1.65 2.82
Source: BondsOnline (http://www.bondsonline.com); FT Interactive Data
Segment: Industrials
Treasury
Yield Spreads over like Maturity Treasuries: Basis Points

Business Valuation Report For Tentex Corp.
October 1, 2013 Ross & Company CPA, PLLC Page 87 of 94
APPENDIX E: CERTIFICATION AND CONDITIONS
APPRAISAL CERTIFICATION
Ross and Company CPA, PLCC hereby certify the following statements regarding this business valuation:
We have not personally inspected the assets, properties, or business interests encompassed by this appraisal.
We have no present or prospective future interest in the assets, properties, or business interests that are the subject of this business valuation.
We have no personal interest or bias with respect to the subject matter of this report or the parties involved.
Our compensation for making the appraisal is in no way contingent upon the value reported or upon any predetermined value.
To the best of our knowledge and belief, the statements of facts contained in this report, upon which the analyses, conclusions, and opinions expressed herein are based, are true and correct
Our analyses, opinions, and conclusions were developed, and this report has been prepared, in conformity with the Uniform Standards of Professional Appraisal Practice, as promulgated by The Appraisal Foundation, except where noted.
Subject to certain limitations the reported analyses, opinions, and conclusions were developed, and this report has been prepared, in conformity with the requirements of the Code of Professional Ethics and the Standards of Professional Appraisal Practice of The Appraisal Institute, of the American Society of Appraisers, and of the other professional organizations, unless otherwise stated.
We have performed a historical analysis of the business’s financial statements. We assume that the financial and related information supplied by the firm’s representative reflects the normal operation of the business. To the extent this is not an accurate representation, the analysis and conclusions drawn are not valid and shall not be represented in any context that implicitly or explicitly suggests that Ross and Company CPA, PLCC and its representatives believe the business valuation to be accurate.
Business Valuation Report For Tentex Corp.
October 1, 2013 Ross & Company CPA, PLLC Page 88 of 94
STATEMENT OF CONTINGENT AND LIMITING CONDITIONS
This appraisal is made subject to these general contingent and limiting conditions:
We assume no responsibility for the legal description or matters including legal or title considerations. Title to the subject assets, properties, or business interests is assumed to be good and marketable unless otherwise stated.
The subject assets, properties, or business interests are appraised free and clear of any or all liens or encumbrances unless otherwise stated.
We assume responsible ownership and competent management with respect to the subject assets, properties, or business interests
The information furnished by others is believed to be reliable. However, we issue no warranty or other form of assurance regarding its accuracy.
We assume no hidden or unapparent conditions regarding its accuracy.
We assume that there is full compliance with all applicable federal, state, and local regulations and laws unless the lack of compliance is stated, defined, and considered in the appraisal report.
We assume that all required licenses, certificates of occupancy, consents, or legislative or administrative authority from any local, state, or national government, or private entity or organization have been or can be obtained or reviewed for any use on which the opinion contained in this report is based.
Unless otherwise stated in this report, we did not observe, and we have no knowledge of, the existence of hazardous materials with regard to the subject assets, properties, or business interests. However, we are not qualified to detect such substances. We assume no responsibility for such conditions or for any expertise required to discover them.
Possession of this report does not carry with it the right of publication. It may not be used for any purpose by any person other than the client whom it is addressed without our written consent and, in any event, only with proper written qualifications and only its entirety.
We, by reason of this opinion, are not required to furnish a complete valuation report, or to give testimony, or to be in attendance in court with reference to the assets, properties, or business interests in question unless arrangements have been previously made.
Neither all nor any part of the contents of this report shall be disseminated to the public through advertising, public relations, news, sales, or other media without our prior written consent and approval.
The analyses, opinions, and conclusions presented in this report apply to this engagement only and may not be used out of context presented herein. This report is valid only for the effective date(s) specified herein and only for the purpose(s) specified herein.
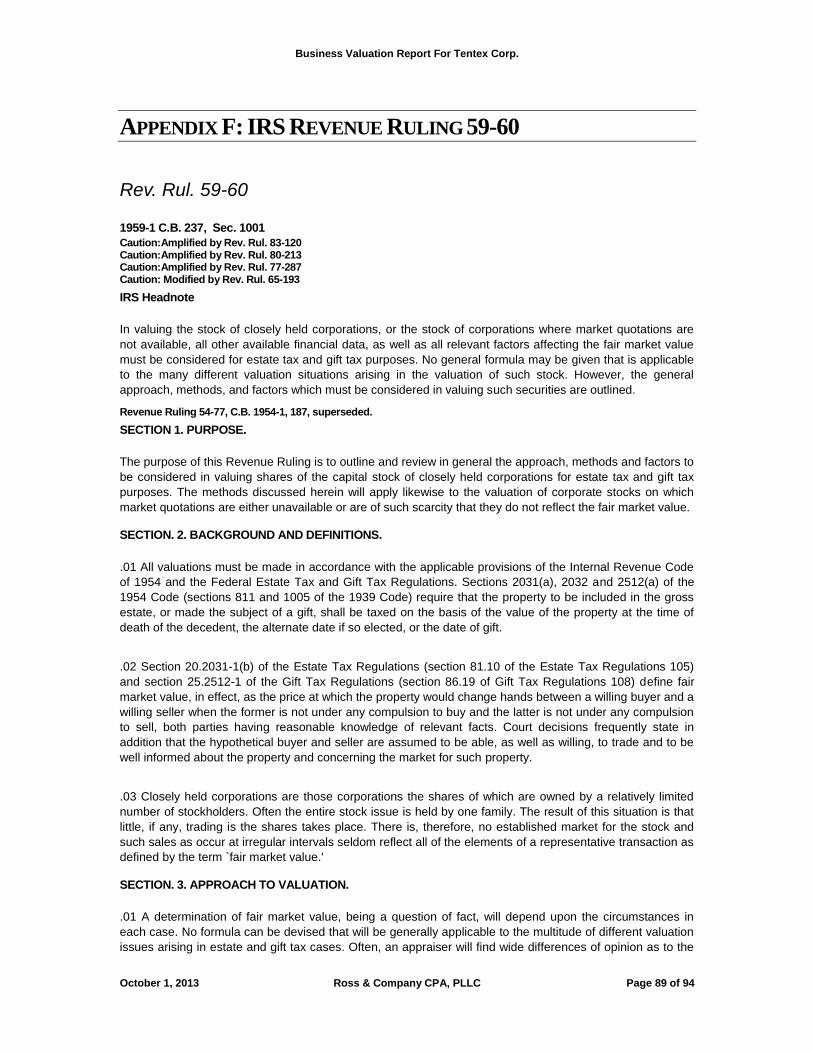
Business Valuation Report For Tentex Corp.
October 1, 2013 Ross & Company CPA, PLLC Page 89 of 94
APPENDIX F: IRS REVENUE RULING 59-60
Rev. Rul. 59-60
1959-1 C.B. 237, Sec. 1001
Caution:Amplified by Rev. Rul. 83-120 Caution:Amplified by Rev. Rul. 80-213 Caution:Amplified by Rev. Rul. 77-287 Caution: Modified by Rev. Rul. 65-193
IRS Headnote
In valuing the stock of closely held corporations, or the stock of corporations where market quotations are
not available, all other available financial data, as well as all relevant factors affecting the fair market value
must be considered for estate tax and gift tax purposes. No general formula may be given that is applicable
to the many different valuation situations arising in the valuation of such stock. However, the general
approach, methods, and factors which must be considered in valuing such securities are outlined.
Revenue Ruling 54-77, C.B. 1954-1, 187, superseded.
SECTION 1. PURPOSE.
The purpose of this Revenue Ruling is to outline and review in general the approach, methods and factors to
be considered in valuing shares of the capital stock of closely held corporations for estate tax and gift tax
purposes. The methods discussed herein will apply likewise to the valuation of corporate stocks on which
market quotations are either unavailable or are of such scarcity that they do not reflect the fair market value.
SECTION. 2. BACKGROUND AND DEFINITIONS.
.01 All valuations must be made in accordance with the applicable provisions of the Internal Revenue Code
of 1954 and the Federal Estate Tax and Gift Tax Regulations. Sections 2031(a), 2032 and 2512(a) of the
1954 Code (sections 811 and 1005 of the 1939 Code) require that the property to be included in the gross
estate, or made the subject of a gift, shall be taxed on the basis of the value of the property at the time of
death of the decedent, the alternate date if so elected, or the date of gift.
.02 Section 20.2031-1(b) of the Estate Tax Regulations (section 81.10 of the Estate Tax Regulations 105)
and section 25.2512-1 of the Gift Tax Regulations (section 86.19 of Gift Tax Regulations 108) define fair
market value, in effect, as the price at which the property would change hands between a willing buyer and a
willing seller when the former is not under any compulsion to buy and the latter is not under any compulsion
to sell, both parties having reasonable knowledge of relevant facts. Court decisions frequently state in
addition that the hypothetical buyer and seller are assumed to be able, as well as willing, to trade and to be
well informed about the property and concerning the market for such property.
.03 Closely held corporations are those corporations the shares of which are owned by a relatively limited
number of stockholders. Often the entire stock issue is held by one family. The result of this situation is that
little, if any, trading is the shares takes place. There is, therefore, no established market for the stock and
such sales as occur at irregular intervals seldom reflect all of the elements of a representative transaction as
defined by the term `fair market value.'
SECTION. 3. APPROACH TO VALUATION.
.01 A determination of fair market value, being a question of fact, will depend upon the circumstances in
each case. No formula can be devised that will be generally applicable to the multitude of different valuation
issues arising in estate and gift tax cases. Often, an appraiser will find wide differences of opinion as to the

Business Valuation Report For Tentex Corp.
October 1, 2013 Ross & Company CPA, PLLC Page 90 of 94
fair market value of a particular stock. In resolving such differences, he should maintain a reasonable
attitude in recognition of the fact that valuation is not an exact science. A sound valuation will be based upon
all the-relevant facts, but the elements of common sense, informed judgment and reasonableness must
enter into the process of weighing those facts and determining their aggregate significance.
.02 The fair market value of specific shares of stock will vary as general economic conditions change from
`normal' to `boom' or `depression,' that is, according to the degree of optimism or pessimism with which the
investing public regards the future at the required date of appraisal. Uncertainty as to the stability or
continuity of the future income from a property decreases its value by increasing the risk of loss of earnings
and value in the future. The value of shares of stock of a company with very uncertain future prospects is
highly speculative. The appraiser must exercise his judgment as to the degree of risk attaching to the
business of the corporation which issued the stock, but that judgment must be related to all of the other
factors affecting value.
.03 Valuation of securities is, in essence, a prophesy as to the future and must be based on facts available
at the required date of appraisal. As a generalization, the prices of stocks which are traded in volume in a
free and active market by informed persons best reflect the consensus of the investing public as to what the
future holds for the corporations and industries represented. When a stock is closely held, is traded
infrequently, or is traded in an erratic market, some other measure of value must be used. In many
instances, the next best measure may be found in the prices at which the stocks of companies engaged in
the same or a similar line of business are selling in a free and open market.
SECTION. 4. FACTORS TO CONSIDER.
.01 It is advisable to emphasize that in the valuation of the stock of closely held corporations or the stock of
corporations where market quotations are either lacking or too scarce to be recognized, all available
financial data, as well as all relevant factors affecting the fair market value, should be considered. The
following factors, although not all-inclusive are fundamental and require careful analysis in each case:
(a) The nature of the business and the history of the enterprise from its inception.
(b) The economic outlook in general and the condition and outlook of the specific industry in particular.
(c) The book value of the stock and the financial condition of the business.
(d) The earning capacity of the company.
(e) The dividend-paying capacity.
(f) Whether or not the enterprise has goodwill or other intangible value.
(g) Sales of the stock and the size of the block of stock to be valued.
(h) The market price of stocks of corporations engaged in the same or a similar line of business having
their stocks actively traded in a free and open market, either on an exchange or over-the-counter.
.02 The following is a brief discussion of each of the foregoing factors:
(a) The history of a corporate enterprise will show its past stability or instability, its growth or lack of
growth, the diversity or lack of diversity of its operations, and other facts needed to form an opinion
of the degree of risk involved in the business. For an enterprise which changed its form of
organization but carried on the same or closely similar operations of its predecessor, the history of
the former enterprise should be considered. The detail to be considered should increase with
approach to the required date of appraisal, since recent events are of greatest help in predicting the
future; but a study of gross and net income, and of dividends covering a long prior period, is highly

Business Valuation Report For Tentex Corp.
October 1, 2013 Ross & Company CPA, PLLC Page 91 of 94
desirable. The history to be studied should include, but need not be limited to, the nature of the
business, its products or services, its operating and investment assets, capital structure, plant
facilities, sales records and management, all of which should be considered as of the date of the
appraisal, with due regard for recent significant changes. Events of the past that are unlikely to
recur in the future should be discounted, since value has a close relation to future expectancy.
(b) A sound appraisal of a closely held stock must consider current and prospective economic
conditions as of the date of appraisal, both in the national economy and in the industry or industries
with which the corporation is allied. It is important to know that the company is more or less
successful than its competitors in the same industry, or that it is maintaining a stable position with
respect to competitors. Equal or even greater significance may attach to the ability of the industry
with which the company is allied to compete with other industries. Prospective competition which
has not been a factor in prior years should be given careful attention. For example, high profits due
to the novelty of its product and the lack of competition often lead to increasing competition. The
public's appraisal of the future prospects of competitive industries or of competitors within an
industry may be indicated by price trends in the markets for commodities and for securities. The
loss of the manager of a so-called `one-man' business may have a depressing effect upon the
value of the stock of such business, particularly if there is a lack of trained personnel capable of
succeeding to the management of the enterprise. In valuing the stock of this type of business,
therefore, the effect of the loss of the manager on the future expectancy of the business, and the
absence of management-succession potentialities are pertinent factors to be taken into
consideration. On the other hand, there may be factors which offset, in whole or in part, the loss of
the manager's services. For instance, the nature of the business and of its assets may be such that
they will not be impaired by the loss of the manager. Furthermore, the loss may be adequately
covered by life insurance, or competent management might be employed on the basis of the
consideration paid for the former manager's services. These, or other offsetting factors, if found to
exist, should be carefully weighed against the loss of the manager's services in valuing the stock of
the enterprise.
(c) Balance sheets should be obtained, preferably in the form of comparative annual statements for
two or more years immediately preceding the date of appraisal, together with a balance sheet at
the end of the month preceding that date, if corporate accounting will permit. Any balance sheet
descriptions that are not self-explanatory, and balance sheet items comprehending diverse assets
or liabilities, should be clarified in essential detail by supporting supplemental schedules. These
statements usually will disclose to the appraiser (1) liquid position (ratio of current assets to current
liabilities); (2) gross and net book value of principal classes of fixed assets; (3) working capital; (4)
long-term indebtedness; (5) capital structure; and (6) net worth. Consideration also should be given
to any assets not essential to the operation of the business, such as investments in securities, real
estate, etc. In general, such nonoperating assets will command a lower rate of return than do the
operating assets, although in exceptional cases the reverse may be true. In computing the book
value per share of stock, assets of the investment type should be revalued on the basis of their
market price and the book value adjusted accordingly. Comparison of the company's balance
sheets over several years may reveal, among other facts, such developments as the acquisition of
additional production facilities or subsidiary companies, improvement in financial position, and
details as to recapitalizations and other changes in the capital structure of the corporation. If the
corporation has more than one class of stock outstanding, the charter or certificate of incorporation
should be examined to ascertain the explicit rights and privileges of the various stock issues
including: (1) voting powers, (2) preference as to dividends, and (3) preference as to assets in the
event of liquidation.
(d) Detailed profit-and-loss statements should be obtained and considered for a representative period
immediately prior to the required date of appraisal, preferably five or more years. Such statements
should show (1) gross income by principal items; (2) principal deductions from gross income
including major prior items of operating expenses, interest and other expense on each item of long-
term debt, depreciation and depletion if such deductions are made, officers' salaries, in total if they
appear to be reasonable or in detail if they seem to be excessive, contributions (whether or not
deductible for tax purposes) that the nature of its business and its community position require the
corporation to make, and taxes by principal items, including income and excess profits taxes; (3)

Business Valuation Report For Tentex Corp.
October 1, 2013 Ross & Company CPA, PLLC Page 92 of 94
net income available for dividends; (4) rates and amounts of dividends paid on each class of stock;
(5) remaining amount carried to surplus; and (6) adjustments to, and reconciliation with, surplus as
stated on the balance sheet. With profit and loss statements of this character available, the
appraiser should be able to separate recurrent from nonrecurrent items of income and expense, to
distinguish between operating income and investment income, and to ascertain whether or not any
line of business in which the company is engaged is operated consistently at a loss and might be
abandoned with benefit to the company. The percentage of earnings retained for business
expansion should be noted when dividend-paying capacity is considered. Potential future income is
a major factor in many valuations of closely-held stocks, and all information concerning past
income which will be helpful in predicting the future should be secured. Prior earnings records
usually are the most reliable guide as to the future expectancy, but resort to arbitrary five-or-ten-
year averages without regard to current trends or future prospects will not produce a realistic
valuation. If, for instance, a record of progressively increasing or decreasing net income is found,
then greater weight may be accorded the most recent years' profits in estimating earning power. It
will be helpful, in judging risk and the extent to which a business is a marginal operator, to consider
deductions from income and net income in terms of percentage of sales. Major categories of cost
and expense to be so analyzed include the consumption of raw materials and supplies in the case
of manufacturers, processors and fabricators; the cost of purchased merchandise in the case of
merchants; utility services; insurance; taxes; depletion or depreciation; and interest.
(e) Primary consideration should be given to the dividend-paying capacity of the company rather than
to dividends actually paid in the past. Recognition must be given to the necessity of retaining a
reasonable portion of profits in a company to meet competition. Dividend-paying capacity is a factor
that must be considered in an appraisal, but dividends actually paid in the past may not have any
relation to dividend-paying capacity. Specifically, the dividends paid by a closely held family
company may be measured by the income needs of the stockholders or by their desire to avoid
taxes on dividend receipts, instead of by the ability of the company to pay dividends. Where an
actual or effective controlling interest in a corporation is to be valued, the dividend factor is not a
material element, since the payment of such dividends is discretionary with the controlling
stockholders. The individual or group in control can substitute salaries and bonuses for dividends,
thus reducing net income and understating the dividend-paying capacity of the company. It follows,
therefore, that dividends are less reliable criteria of fair market value than other applicable factors.
(f) In the final analysis, goodwill is based upon earning capacity. The presence of goodwill and its
value, therefore, rests upon the excess of net earnings over and above a fair return on the net
tangible assets. While the element of goodwill may be based primarily on earnings, such factors as
the prestige and renown of the business, the ownership of a trade or brand name, and a record of
successful operation over a prolonged period in a particular locality, also may furnish support for
the inclusion of intangible value. In some instances it may not be possible to make a separate
appraisal of the tangible and intangible assets of the business. The enterprise has a value as an
entity. Whatever intangible value there is, which is supportable by the facts, may be measured by
the amount by which the appraised value of the tangible assets exceeds the net book value of such
assets.
(g) Sales of stock of a closely held corporation should be carefully investigated to determine whether
they represent transactions at arm's length. Forced or distress sales do not ordinarily reflect fair
market value nor do isolated sales in small amounts necessarily control as the measure of value.
This is especially true in the valuation of a controlling interest in a corporation. Since, in the case of
closely held stocks, no prevailing market prices are available, there is no basis for making an
adjustment for blockage. It follows, therefore, that such stocks should be valued upon a
consideration of all the evidence affecting the fair market value. The size of the block of stock itself
is a relevant factor to be considered. Although it is true that a minority interest in an unlisted
corporation's stock is more difficult to sell than a similar block of listed stock, it is equally true that
control of a corporation, either actual or in effect, representing as it does an added element of
value, may justify a higher value for a specific block of stock.
(h) Section 2031(b) of the Code states, in effect, that in valuing unlisted securities the value of stock or
securities of corporations engaged in the same or a similar line of business which are listed on an

Business Valuation Report For Tentex Corp.
October 1, 2013 Ross & Company CPA, PLLC Page 93 of 94
exchange should be taken into consideration along with all other factors. An important
consideration is that the corporations to be used for comparisons have capital stocks which are
actively traded by the public. In accordance with section 2031(b) of the Code, stocks listed on an
exchange are to be considered first. However, if sufficient comparable companies whose stocks
are listed on an exchange cannot be found, other comparable companies which have stocks
actively traded in on the over-the-counter market also may be used. The essential factor is that
whether the stocks are sold on an exchange or over-the-counter there is evidence of an active, free
public market for the stock as of the valuation date. In selecting corporations for comparative
purposes, care should be taken to use only comparable companies. Although the only restrictive
requirement as to comparable corporations specified in the statute is that their lines of business be
the same or similar, yet it is obvious that consideration must be given to other relevant factors in
order that the most valid comparison possible will be obtained. For illustration, a corporation
having one or more issues of preferred stock, bonds or debentures in addition to its common stock
should not be considered to be directly comparable to one having only common stock outstanding.
In like manner, a company with a declining business and decreasing markets is not comparable to
one with a record of current progress and market expansion.
SECTION. 5. WEIGHT TO BE ACCORDED VARIOUS FACTORS.
The valuation of closely held corporate stock entails the consideration of all relevant factors as stated in
section 4. Depending upon the circumstances in each case, certain factors may carry more weight than
others because of the nature of the company's business. To illustrate:
(i) Earnings may be the most important criterion of value in some cases whereas asset value will
receive primary consideration in others. In general, the appraiser will accord primary consideration
to earnings when valuing stocks of companies which sell products or services to the public;
conversely, in the investment or holding type of company, the appraiser may accord the greatest
weight to the assets underlying the security to be valued.
(j) The value of the stock of a closely held investment or real estate holding company, whether or not
family owned, is closely related to the value of the assets underlying the stock. For companies of
this type the appraiser should determine the fair market values of the assets of the company.
Operating expenses of such a company and the cost of liquidating it, if any, merit consideration
when appraising the relative values of the stock and the underlying assets. The market values of
the underlying assets give due weight to potential earnings and dividends of the particular items of
property underlying the stock, capitalized at rates deemed proper by the investing public at the date
of appraisal. A current appraisal by the investing public should be superior to the retrospective
opinion of an individual. For these reasons, adjusted net worth should be accorded greater weight
in valuing the stock of a closely held investment or real estate holding company, whether or not
family owned, than any of the other customary yardsticks of appraisal, such as earnings and
dividend paying capacity.
SECTION. 6. CAPITALIZATION RATES.
In the application of certain fundamental valuation factors, such as earnings and dividends, it is necessary to
capitalize the average or current results at some appropriate rate. A determination of the proper
capitalization rate presents one of the most difficult problems in valuation. That there is no ready or simple
solution will become apparent by a cursory check of the rates of return and dividend yields in terms of the
selling prices of corporate shares listed on the major exchanges of the country. Wide variations will be found
even for companies in the same industry. Moreover, the ratio will fluctuate from year to year depending upon
economic conditions. Thus, no standard tables of capitalization rates applicable to closely held corporations
can be formulated. Among the more important factors to be taken into consideration in deciding upon a
capitalization rate in a particular case are: (1) the nature of the business; (2) the risk involved; and (3) the
stability or irregularity of earnings.

Business Valuation Report For Tentex Corp.
October 1, 2013 Ross & Company CPA, PLLC Page 94 of 94
SECTION. 7. AVERAGE OF FACTORS.
Because valuations cannot be made on the basis of a prescribed formula, there is no means whereby the
various applicable factors in a particular case can be assigned mathematical weights in deriving the fair
market value. For this reason, no useful purpose is served by taking an average of several factors (for
example, book value, capitalized earnings and capitalized dividends) and basing the valuation on the result.
Such a process excludes active consideration of other pertinent factors, and the end result cannot be
supported by a realistic application of the significant facts in the case except by mere chance.
SECTION. 8. RESTRICTIVE AGREEMENTS.
Frequently, in the valuation of closely held stock for estate and gift tax purposes, it will be found that the
stock is subject to an agreement restricting its sale or transfer. Where shares of stock were acquired by a
decedent subject to an option reserved by the issuing corporation to repurchase at a certain price, the option
price is usually accepted as the fair market value for estate tax purposes. See Rev. Rul. 54-76, C.B. 1954-1,
194. However, in such case the option price is not determinative of fair market value for gift tax purposes.
Where the option, or buy and sell agreement, is the result of voluntary action by the stockholders and is
binding during the life as well as at the death of the stockholders, such agreement may or may not,
depending upon the circumstances of each case, fix the value for estate tax purposes. However, such
agreement is a factor to be considered, with other relevant factors, in determining fair market value. Where
the stockholder is free to dispose of his shares during life and the option is to become effective only upon his
death, the fair market value is not limited to the option price. It is always necessary to consider the
relationship of the parties, the relative number of shares held by the decedent, and other material facts, to
determine whether the agreement represents a bona fide business arrangement or is a device to pass the
decedent's shares to the natural objects of his bounty for less than an adequate and full consideration in
money or money's worth. In this connection see Rev. Rul. 157 C.B. 1953-2, 255, and Rev. Rul.189, C.B.
1953-2, 294.
SECTION. 9. EFFECT ON OTHER DOCUMENTS.
Revenue Ruling 54-77, C.B. 1954-1, 187, is hereby superseded.