Bayesian Nonparametric Modeling of Dynamic International ... · Bayesian Nonparametric Modeling of...
13
Bayesian Nonparametric Modeling of Dynamic International Relations Modelli Bayesiani Nonparametrici per Relazioni Internazionali Dinamiche Daniele Durante and David B. Dunson Abstract Real world networks are often associated with a dynamic component and the development of flexible statistical methodologies to learn how the connectivity patterns are wired across time is a fundamental goal in many fields of application. News media reports currently provide a rich variety of complex dynamic networks along with novel applied questions. Our focus is on modeling dynamic networks of international relationships among countries during recent conflicts and crises. We accomplish this goal by leveraging a recent Bayesian nonparametric model which merges latent space representations of network data with Gaussian processes. Abstract Gli attuali dati di rete sono spesso associati ad una componente dinamica e lo sviluppo di metodologie statistiche per studiare come le connessioni evolvono nel tempo ` e un obiettivo importante in molte discipline. I mezzi d’informazione of- frono una grande variet` a di reti complesse cos` ı come nuovi interrogativi applicativi. Questo lavoro ha lo scopo di modellare reti dinamiche di relazioni tra stati durante i recenti conflitti. Per fare questo, si utilizzeranno recenti metodologie statistiche che fondono rappresentazioni a spazi latenti per dati di rete con processi Gaussiani. Key words: Dynamic network, Gaussian process, GDELT data, Latent space. 1 Introduction The last two decades have abounded with key financial and conflict events strongly affecting the world geo-political system. Notable examples include the 1997–2000 dot-com bubble [34], the 2004-2007 United States housing bubble [3] and the sub- Daniele Durante Department of Statistical Sciences, University of Padua, Padua, Italy. e-mail: [email protected] David B. Dunson Department of Statistical Science, Duke University, Durham, NC, USA. e-mail: [email protected] 1
-
Upload
hoangthuan -
Category
Documents
-
view
235 -
download
0
Transcript of Bayesian Nonparametric Modeling of Dynamic International ... · Bayesian Nonparametric Modeling of...
Bayesian Nonparametric Modeling of DynamicInternational RelationsModelli Bayesiani Nonparametrici per RelazioniInternazionali Dinamiche
Daniele Durante and David B. Dunson
Abstract Real world networks are often associated with a dynamic component andthe development of flexible statistical methodologies to learn how the connectivitypatterns are wired across time is a fundamental goal in many fields of application.News media reports currently provide a rich variety of complex dynamic networksalong with novel applied questions. Our focus is on modeling dynamic networks ofinternational relationships among countries during recent conflicts and crises. Weaccomplish this goal by leveraging a recent Bayesian nonparametric model whichmerges latent space representations of network data with Gaussian processes.Abstract Gli attuali dati di rete sono spesso associati ad una componente dinamicae lo sviluppo di metodologie statistiche per studiare come le connessioni evolvononel tempo e un obiettivo importante in molte discipline. I mezzi d’informazione of-frono una grande varieta di reti complesse cosı come nuovi interrogativi applicativi.Questo lavoro ha lo scopo di modellare reti dinamiche di relazioni tra stati durante irecenti conflitti. Per fare questo, si utilizzeranno recenti metodologie statistiche chefondono rappresentazioni a spazi latenti per dati di rete con processi Gaussiani.
Key words: Dynamic network, Gaussian process, GDELT data, Latent space.
1 Introduction
The last two decades have abounded with key financial and conflict events stronglyaffecting the world geo-political system. Notable examples include the 1997–2000dot-com bubble [34], the 2004-2007 United States housing bubble [3] and the sub-
Daniele DuranteDepartment of Statistical Sciences, University of Padua, Padua, Italy. e-mail: [email protected]
David B. DunsonDepartment of Statistical Science, Duke University, Durham, NC, USA. e-mail: [email protected]
1
2 Daniele Durante and David B. Dunson
2005 First Bimester
2010 First Bimester
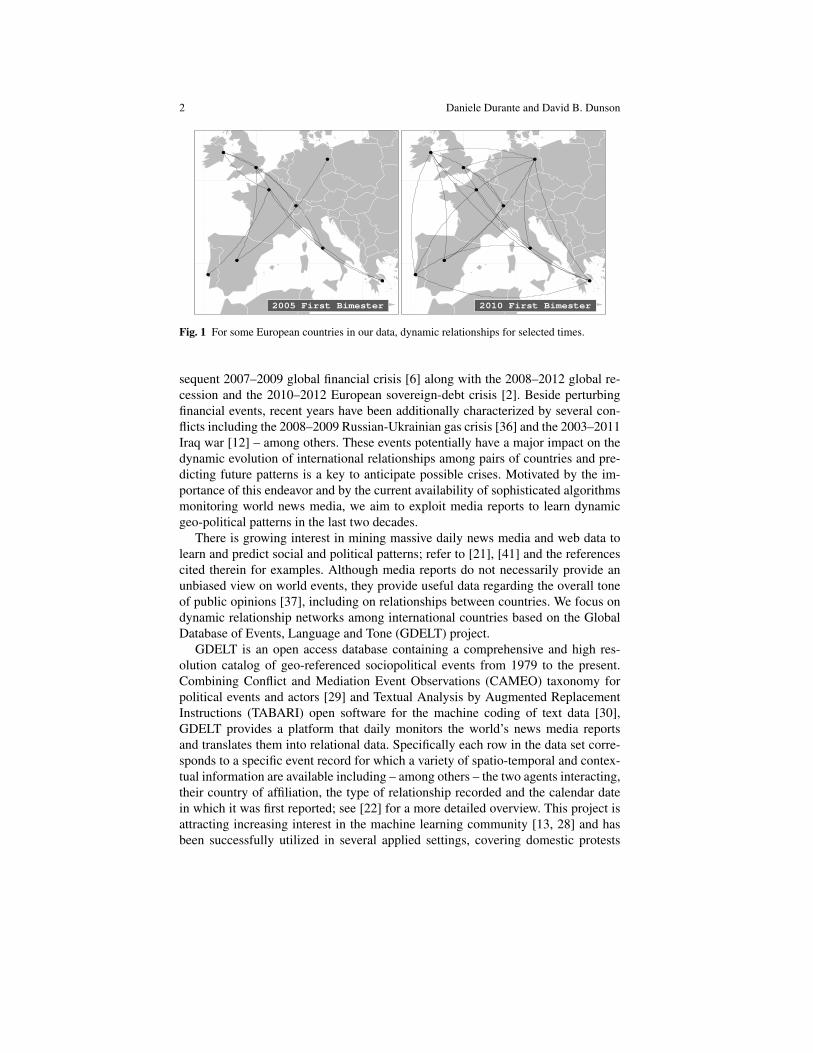
Fig. 1 For some European countries in our data, dynamic relationships for selected times.
sequent 2007–2009 global financial crisis [6] along with the 2008–2012 global re-cession and the 2010–2012 European sovereign-debt crisis [2]. Beside perturbingfinancial events, recent years have been additionally characterized by several con-flicts including the 2008–2009 Russian-Ukrainian gas crisis [36] and the 2003–2011Iraq war [12] – among others. These events potentially have a major impact on thedynamic evolution of international relationships among pairs of countries and pre-dicting future patterns is a key to anticipate possible crises. Motivated by the im-portance of this endeavor and by the current availability of sophisticated algorithmsmonitoring world news media, we aim to exploit media reports to learn dynamicgeo-political patterns in the last two decades.
There is growing interest in mining massive daily news media and web data tolearn and predict social and political patterns; refer to [21], [41] and the referencescited therein for examples. Although media reports do not necessarily provide anunbiased view on world events, they provide useful data regarding the overall toneof public opinions [37], including on relationships between countries. We focus ondynamic relationship networks among international countries based on the GlobalDatabase of Events, Language and Tone (GDELT) project.
GDELT is an open access database containing a comprehensive and high res-olution catalog of geo-referenced sociopolitical events from 1979 to the present.Combining Conflict and Mediation Event Observations (CAMEO) taxonomy forpolitical events and actors [29] and Textual Analysis by Augmented ReplacementInstructions (TABARI) open software for the machine coding of text data [30],GDELT provides a platform that daily monitors the world’s news media reportsand translates them into relational data. Specifically each row in the data set corre-sponds to a specific event record for which a variety of spatio-temporal and contex-tual information are available including – among others – the two agents interacting,their country of affiliation, the type of relationship recorded and the calendar datein which it was first reported; see [22] for a more detailed overview. This project isattracting increasing interest in the machine learning community [13, 28] and hasbeen successfully utilized in several applied settings, covering domestic protests
Bayesian Nonparametric Modeling of Dynamic International Relations 3
GREECE-USA
GREECE-GERMANY
IRAQ-USA
IRAQ-SYRIA
1994
1995
1996
1997
1998
1999
2000
2001
2002
2003
2004
2005
2006
2007
2008
2009
2010
2011
2012
2013
2014
2015
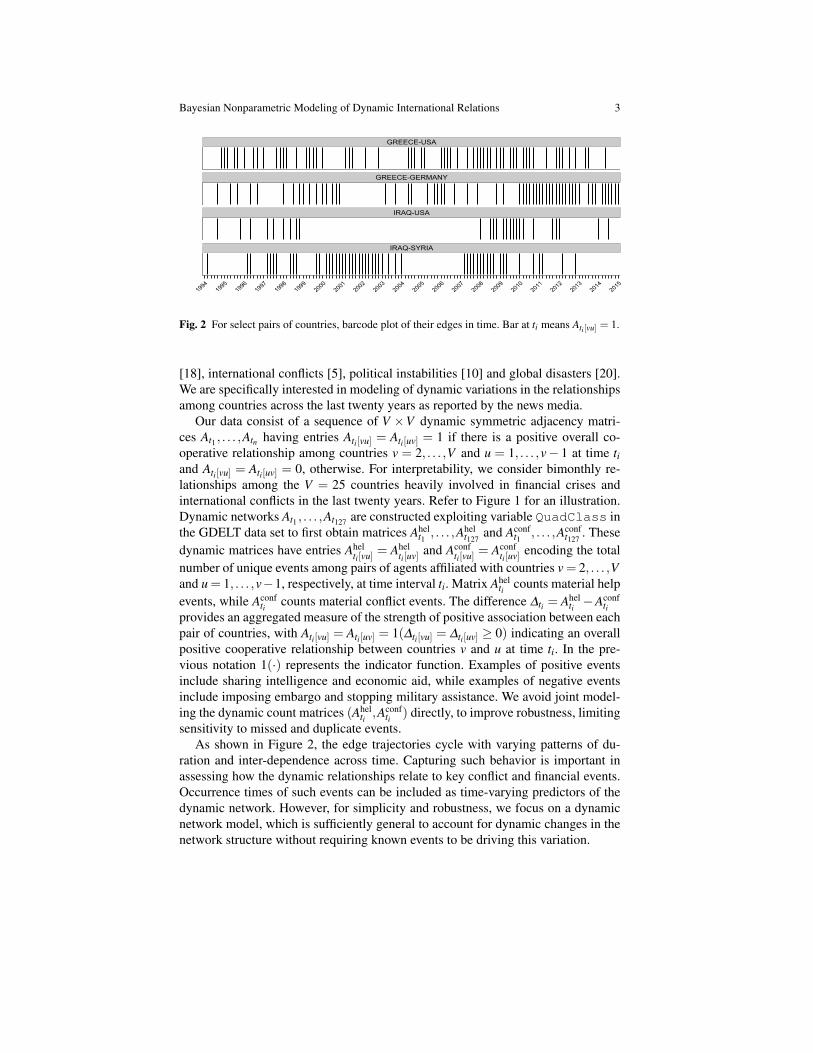
Fig. 2 For select pairs of countries, barcode plot of their edges in time. Bar at ti means Ati[vu] = 1.
[18], international conflicts [5], political instabilities [10] and global disasters [20].We are specifically interested in modeling of dynamic variations in the relationshipsamong countries across the last twenty years as reported by the news media.
Our data consist of a sequence of V ×V dynamic symmetric adjacency matri-ces At1 , . . . ,Atn having entries Ati[vu] = Ati[uv] = 1 if there is a positive overall co-operative relationship among countries v = 2, . . . ,V and u = 1, . . . ,v− 1 at time tiand Ati[vu] = Ati[uv] = 0, otherwise. For interpretability, we consider bimonthly re-lationships among the V = 25 countries heavily involved in financial crises andinternational conflicts in the last twenty years. Refer to Figure 1 for an illustration.Dynamic networks At1 , . . . ,At127 are constructed exploiting variable QuadClass inthe GDELT data set to first obtain matrices Ahel
t1 , . . . ,Ahelt127
and Aconft1 , . . . ,Aconf
t127. These
dynamic matrices have entries Ahelti[vu] = Ahel
ti[uv] and Aconfti[vu] = Aconf
ti[uv] encoding the totalnumber of unique events among pairs of agents affiliated with countries v = 2, . . . ,Vand u = 1, . . . ,v−1, respectively, at time interval ti. Matrix Ahel
ti counts material helpevents, while Aconf
ti counts material conflict events. The difference ∆ti = Ahelti −Aconf
tiprovides an aggregated measure of the strength of positive association between eachpair of countries, with Ati[vu] = Ati[uv] = 1(∆ti[vu] = ∆ti[uv] ≥ 0) indicating an overallpositive cooperative relationship between countries v and u at time ti. In the pre-vious notation 1(·) represents the indicator function. Examples of positive eventsinclude sharing intelligence and economic aid, while examples of negative eventsinclude imposing embargo and stopping military assistance. We avoid joint model-ing the dynamic count matrices (Ahel
ti ,Aconfti ) directly, to improve robustness, limiting
sensitivity to missed and duplicate events.As shown in Figure 2, the edge trajectories cycle with varying patterns of du-
ration and inter-dependence across time. Capturing such behavior is important inassessing how the dynamic relationships relate to key conflict and financial events.Occurrence times of such events can be included as time-varying predictors of thedynamic network. However, for simplicity and robustness, we focus on a dynamicnetwork model, which is sufficiently general to account for dynamic changes in thenetwork structure without requiring known events to be driving this variation.
4 Daniele Durante and David B. Dunson
1.1 Relevant Literature
There is a growing literature on dynamic networks, generalizing exponential ran-dom graph models (ERGMs) [16, 9], stochastic block models [23], mixed member-ship stochastic block models [1] and latent space models [15, 14] from the staticsetting to the time-varying one. Dynamic ERGMs are available via discrete timeMarkov models [26, 11] and continuous time specifications [33, 32]. Although dy-namic ERGMs can leverage the several techniques available for the static case andexplicitly account for suitable dependence structures among edges, these proceduresrely on restrictive homogeneity assumptions forcing the model parameters to beshared among nodes and typically constant across time. Accommodating dynamicheterogenous behaviors is a key in our motivating application.
The importance of this endeavor has motivated an intense research aimed at find-ing alternative specifications to ERGM type models. Time-varying stochastic blockmodels [40, 39] allow dynamic clustering of nodes according to their connectionpatterns. This framework can allow flexible changes over time, but imposes a com-munity structure. More flexible models include dynamic mixed membership blockmodels [38] and dynamic latent space models [27, 31]. Information is propagatedacross time via state space models, Markov processes and random walk trajectories,with several layers of approximation required for tractable inference.
Previous proposals lack computational tractability and few results on the flexibil-ity of the models are available. In dynamic modeling of international relationshipsdata we require procedures that can characterize heterogeneous dynamic patterns inthe interconnection among countries, while efficiently borrowing information withinthe network and across time to reduce dimensionality. In accomplishing this goal [7]define the edge probabilities as a function of pairwise distances among nodes in alatent space and enforce flexible dynamic changes in these probabilities by allowingthe nodes coordinates to evolve in continuous time via Gaussian processes (GP).
We evaluate their procedure in our motivating application. In particular, Section2 summarizes the procedure developed by [7]. Key steps for posterior computationare outlined in Section 3, while a careful analysis of the results in our motivatingapplication is presented in Section 4.
2 Time-varying Latent Space Formulation
Let Ati denote the adjacency matrix characterizing the undirected network with noself-relations at time ti ∈ℜ+. As self-relations are not of interest and Ati is symmet-ric, we model At1 , . . . ,Atn by defining a stochastic process for L (At1), . . . ,L (Atn),with L (Ati) = (Ati[21],Ati[31], . . . ,Ati[V 1],Ati[32], . . . ,Ati[V 2], . . . ,Ati[V (V−1)])
T the vectorencoding the lower triangular elements of Ati , which uniquely characterize the net-work as Ati[vu] = Ati[uv] for every v = 2, . . . ,V , u = 1, . . . ,v−1 and ti = t1, . . . , tn. As aresult, L (Ati) is a vector of binary elements L (Ati)l ∈0,1, l = 1, . . . ,V (V−1)/2,encoding the presence or absence of an edge for each pair of nodes l at time ti.
Bayesian Nonparametric Modeling of Dynamic International Relations 5
Based on previous notation, developing a probabilistic representation for a se-quence of time-varying undirected networks, translates into statistical modeling ofa multivariate time series L (At1), . . . ,L (Atn) arising from dynamic monitoring ofV (V − 1)/2 binary variables for n times. However, in accomplishing this goal it isimportant to explicitly account for the special structure of our data. Specifically, thekey difference between a general unstructured multivariate time series and our dy-namic vectors of edges is that the observed networks are potentially characterized byspecific underlying patterns – such as community structures and transitive relations– which induce dependence among edges at each time ti. As a result, by carefullyaccommodating the network structure in dynamic modeling of L (At1), . . . ,L (Atn),one might borrow information within each L (Ati) and across time, while reducingdimensionality and infer network properties along with their dynamic changes.
Consistently with the previous discussion, [7] assume data L (At1), . . . ,L (Atn)as n snapshots of a continuous latent process L (At) : t ∈T⊂ℜ+ over a possiblyunequally spaced time grid t1, . . . , tn. In particular they let
L (At)l | πl(t)∼ Bernπl(t) , (1)
independently for each pair of nodes l = 1, . . . ,V (V −1)/2 and t ∈ T, and focus ondeveloping a careful representation for the edge probabilities πl(t) ∈ (0,1) – com-prising the vector π(t) = π1(t), . . . ,πV (V−1)/2(t)T – in order to reduce the dimen-sionality and account for the network structure. This is accomplished by expressingthe log-odds Sl(t) = logitπl(t), l = 1, . . . ,V (V −1)/2 as a quadratic combinationof a set of node-specific coordinates in a latent space. Specifically, focusing on thelth pair, corresponding to nodes v and u, v > u, they let
Sl(t) = µ(t)+Xv(t)TXu(t) = µ(t)+R
∑r=1
Xvr(t)Xur(t), (2)
for every l = 1, . . . ,V (V −1)/2 and t ∈T, where Xv(t) = Xv1(t), . . . ,XvR(t)T ∈ℜR
and Xu(t) = Xu1(t), . . . ,XuR(t)T ∈ ℜR are the vectors of latent coordinates fornodes v and u at time t, respectively, while µ(t) ∈ℜ is a baseline trajectory center-ing the latent similarity process. According to (1)–(2), nodes with latent coordinatesin the same direction will be more similar and hence will have an higher edge prob-ability. Recalling our motivating application on international relationships data, thisconstruction has an appealing interpretation. In particular, each country is assigneda multifaceted latent position, which can be seen as representing its view on differ-ent debated topics or international policies. Countries having similar positions in thedifferent attributes, both positive or negative, will be more likely to cooperate thancountries with opposite positions. The similarity – or dissimilarity – will be higherthe stronger the positions in the same direction – or opposite direction.
Moreover factorization (2) reduces dimensionality from V (V − 1)/2 stochasticprocesses on the edge probabilities to V ×R latent trajectories – typically R V– and one baseline process, with the shared dependence on a common set of node-specific latent coordinates inducing rich dependence structures and accommodating
6 Daniele Durante and David B. Dunson
recurring network properties; see for example [15, 14, 19] and [17]. Note also thatthe latent coordinates in (2) are not identified. However, since we focus inference onthe edge probability trajectories πl(t), l = 1, . . . ,V (V−1)/2, we avoid identifiabilityconstraints, as they are not necessary to ensure identifiability of π(t).
To conclude the Bayesian specification, [7] choose independent priors for µ(t) :t ∈ T and Xvr(t) : t ∈ T, v = 1, . . . ,V and r = 1, . . . ,R, to induce a prior onπ(t) : t ∈ T which is able to borrow information across time, allow flexible tra-jectories in the edge probability processes and shrink towards lower-dimensionalrepresentations. This is accomplished by letting
Xvr(·)∼ GP(0,λrcX ), (3)
independently for v= 1, . . . ,V and r = 1, . . . ,R, with cX (ti, t j) = exp−κX (ti−t j)2,
κX > 0. The squared exponential covariance function is appealing in our applica-tions to enforce smoothness in analyzing cooperation data. Recalling [25], assump-tion (3) implies the following joint prior for the node-specific latent coordinates atthe time grid t1, . . . , tn on which networks L (At1), . . . ,L (Atn) are observed
Xvr(t1), . . . ,Xvr(tn)T ∼ Nn(0,λrKX ),
independently for v = 1, . . . ,V and r = 1, . . . ,R, where the covariance matrix KX haselements KX [i j] = exp−κX (ti− t j)
2 and λr ≥ 0 represents a scaling effect so thatwhen λr ≈ 0 the latent coordinates trajectories for dimension r collapse around thezero mean function. Hence to favor adaptive shrinkage, [7] assign a hyperprior forthe vector of scaling parameters λ = (λ1, . . . ,λR)
T that adaptively deletes redundantlatent space dimensions which are not required to characterize the dynamic edgeprobability vectors according to the observed data. Adapting [4], they let
λr =r
∏m=1
1ϑm
, ϑ1 ∼ Ga(a1,1), ϑm>1 ∼ Ga(a2,1), r = 1, . . . ,R. (4)
Prior (4) adaptively penalizes overparameterized representations favoring elementsλr to be increasingly concentrated towards 0 as r increases for appropriate choice ofa2. See [4] for further discussion and theoretical properties. To conclude the priorspecification, we let µ(·)∼ GP(0,cµ), with cµ(ti, t j) = exp−κµ(ti− t j)
2, κµ > 0.
3 Posterior Computation
Posterior computation exploits a recently developed Polya-gamma data augmenta-tion scheme for Bayesian logistic regression [24], which allows implementation of asimple Gibbs sampler. We outline in the following the key steps for implementation.
Algorithm 1 Gibbs sampler for the dynamic latent space model
[1] Sample Polya-gamma augmented data
Bayesian Nonparametric Modeling of Dynamic International Relations 7
for each l = 1, . . . ,V (V −1)/2 and ti = t1, . . . , tn doUpdate each augmented data ωl(ti) from the full conditional Polya-gamma
ωl(ti) | − ∼ PG
1,µ(ti)+L (X(ti)X(ti)T)l,
with X(ti) the V ×R matrix containing the R coordinates of the V nodes at ti.end for————————————————————————————————–[2] Sample the baseline trajectory µ = µ(t1), . . . ,µ(tn)T from
µ | − ∼ Nn
Σµ
∑V (V−1)/2l=1 L (At1)l−1/2−ωl(t1)L (X(t1)X(t1)T)l
...
∑V (V−1)/2l=1 L (Atn)l−1/2−ωl(tn)L (X(tn)X(tn)T)l
,Σµ
,
with Σµ =
diag(
∑V (V−1)/2l=1 ωl(t1), . . . ,∑
V (V−1)/2l=1 ωl(tn)
)+K−1
µ
−1, and Kµ the
Gaussian process covariance matrix with entries Kµ[i j] = exp−κµ(ti− t j)2.
————————————————————————————————–[3] Sample the matrix of coordinates trajectories X(t1), . . . ,X(tn)for v = 1, . . . ,V do
Block-sample Xv(t1), . . . ,Xv(tn) given X(−v) = Xu(ti) : u 6= v, ti = t1, . . . tn.1. Define X(v) = Xv1(t1), . . . ,Xv1(tn), . . . ,XvR(t1), . . . ,XvR(tn)T
2. Define a Bayesian logistic regression with X(v) acting as coefficient vectorand having prior, according to GP, X(v) ∼ Nn×R 0,diag(λ1, . . . ,λR)⊗KX
3. The Bayesian logistic regression to update X(v) is a follow
L (A)(v) ∼ Bern(π(v)) logit(π(v)) = 1V−1⊗µ + X(−v)X(v),
with L (A)(v) obtained by stacking vectors L (At1)l , . . . ,L (Atn)lT for allpairs l having v as a one of the two nodes, and π(v) is the correspondingvector of edge probabilities. Finally, X(−v) is the matrix of regressors withentries suitably chosen from X(−v), to reproduce (2) for the sub-sample con-sidered.
4. Hence the Polya-gamma sampling provides
X(v) | − ∼ Nn×R
(µx(v) ,Σx(v)
),
with Σx(v) =
XT(−v)Ω(v)X(−v)+diag(λ−1
1 , . . . ,λ−1R )⊗K−1
X
−1, Ω(v) a diag-
onal matrix with the corresponding Polya-gamma augmented data and meanvector µx(v) = Σx(v)
[XT(−v)
L (A)(v)− 1V−1⊗1n0.5−Ω(v)(1V−1⊗µ)
].
end for————————————————————————————————–
8 Daniele Durante and David B. Dunson
[4] Sample the gamma quantities defining the shrinkage parameters λ1, . . . ,λR
ϑ1 | − ∼ Ga
a1 +
V ×n×R2
,1+12
R
∑m=1
θ(−1)m
V
∑v=1
XTvmK−1
X Xvm
,
ϑr | − ∼ Ga
a2 +
V ×n× (R− r+1)2
,1+12
R
∑m=r
θ(−r)m
V
∑v=1
XTvmK−1
X Xvm
,
where θ(−r)m = ∏
mt=1,t 6=r ϑt for r = 1, . . . ,R and Xvm = Xvm(t1), . . . ,Xvm(tn)T.
————————————————————————————————–[5] Compute the dynamic edge probabilities πl(t1), . . . ,πl(tn) as
πl(ti) =
[1+ exp
−µ(ti)−
R
∑r=1
Xvr(ti)Xur(ti)
]−1
for every ti = t1, . . . , tn and l = 1, . . . ,V (V −1)/2, with v and u, v > u, the nodescharacterizing the lth pair.
In performing posterior computation, R is fixed at a conservative upper bound,allowing unnecessary extra dimensions to be effectively removed through posteriordistributions for λr that are concentrated near zero. The results are not sensitive toR unless R is chosen to be too small, in which case λR not concentrated near zeroprovides evidence that R should be increased.
4 Application to International Relationships Networks
We apply the dynamic network model outlined in Section 2 to the GDELT relation-ships data At1 , . . . ,At127 described in Section 1. For inference we choose R = 10 andlength scales κµ = κX = 0.05. The hyperparameters in (4) are set equal to a1 = 2.5and a2 = 3.5 in order to allow the priors for λr to increasingly concentrate massaround 0 as r increases, facilitating shrinkage. We consider 5,000 Gibbs iterations,and discard the first 1,000. Mixing has been assessed via effective sample sizesfor the quantities of interest, represented by πl(ti), for l = 1, . . . ,V (V − 1)/2 andti = t1, . . . , t127 after burn-in. Most of these values were around 1,500 out of 4,000,suggesting good mixing.
The trajectory of the posterior mean for the expected network density in Figure3 provides an appealing overview of the overall dynamic connectivity behavior inrelation to key financial and economic international events. Note that the posteriordistribution of this quantity – at every time ti – can be easily derived as a functionof the posterior samples for the edge probabilities, as E[∑
V (V−1)/2l=1 L (Ati)l/V (V −
1)/2] = ∑V (V−1)/2l=1 EL (Ati)l/V (V −1)/2 = ∑
V (V−1)/2l=1 πl(ti)/V (V −1)/2.
It is first interesting to notice how the posterior mean for the time-varying expected
Bayesian Nonparametric Modeling of Dynamic International Relations 9
NETWORK DENSITY
[A] [B] [C]0.2
0.3
0.4
1994
1995
1996
1997
1998
1999
2000
2001
2002
2003
2004
2005
2006
2007
2008
2009
2010
2011
2012
2013
2014
2015
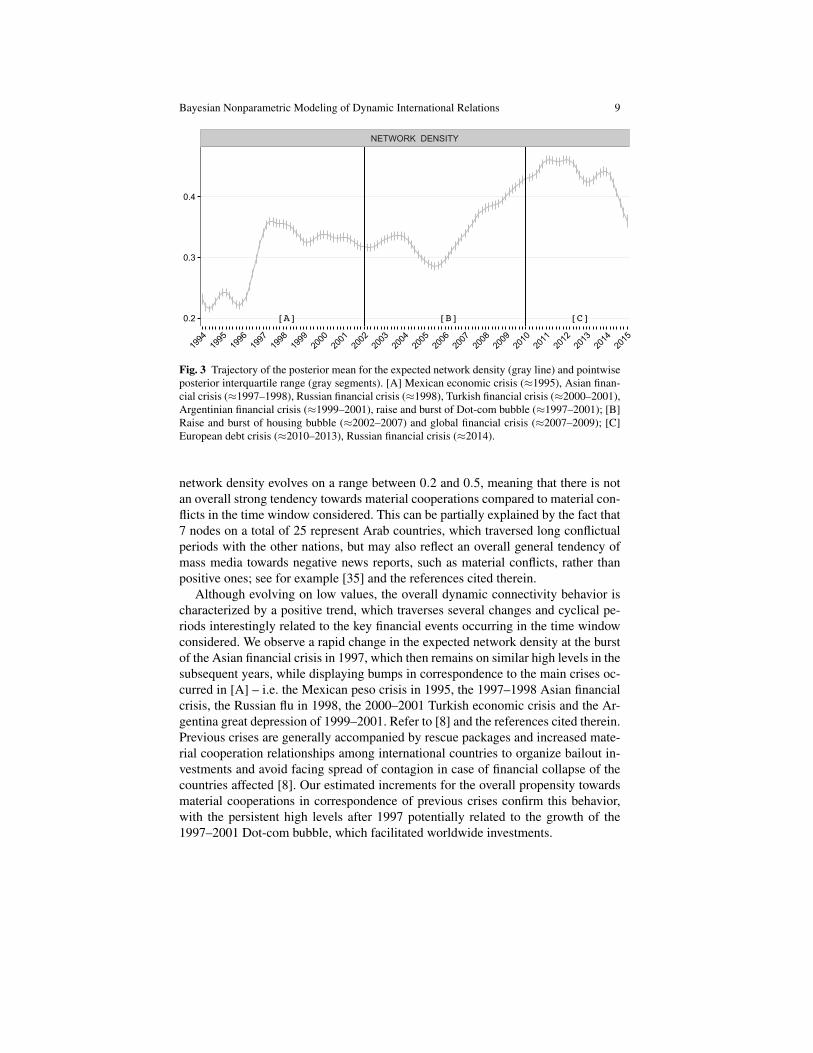
Fig. 3 Trajectory of the posterior mean for the expected network density (gray line) and pointwiseposterior interquartile range (gray segments). [A] Mexican economic crisis (≈1995), Asian finan-cial crisis (≈1997–1998), Russian financial crisis (≈1998), Turkish financial crisis (≈2000–2001),Argentinian financial crisis (≈1999–2001), raise and burst of Dot-com bubble (≈1997–2001); [B]Raise and burst of housing bubble (≈2002–2007) and global financial crisis (≈2007–2009); [C]European debt crisis (≈2010–2013), Russian financial crisis (≈2014).
network density evolves on a range between 0.2 and 0.5, meaning that there is notan overall strong tendency towards material cooperations compared to material con-flicts in the time window considered. This can be partially explained by the fact that7 nodes on a total of 25 represent Arab countries, which traversed long conflictualperiods with the other nations, but may also reflect an overall general tendency ofmass media towards negative news reports, such as material conflicts, rather thanpositive ones; see for example [35] and the references cited therein.
Although evolving on low values, the overall dynamic connectivity behavior ischaracterized by a positive trend, which traverses several changes and cyclical pe-riods interestingly related to the key financial events occurring in the time windowconsidered. We observe a rapid change in the expected network density at the burstof the Asian financial crisis in 1997, which then remains on similar high levels in thesubsequent years, while displaying bumps in correspondence to the main crises oc-curred in [A] – i.e. the Mexican peso crisis in 1995, the 1997–1998 Asian financialcrisis, the Russian flu in 1998, the 2000–2001 Turkish economic crisis and the Ar-gentina great depression of 1999–2001. Refer to [8] and the references cited therein.Previous crises are generally accompanied by rescue packages and increased mate-rial cooperation relationships among international countries to organize bailout in-vestments and avoid facing spread of contagion in case of financial collapse of thecountries affected [8]. Our estimated increments for the overall propensity towardsmaterial cooperations in correspondence of previous crises confirm this behavior,with the persistent high levels after 1997 potentially related to the growth of the1997–2001 Dot-com bubble, which facilitated worldwide investments.
10 Daniele Durante and David B. Dunson
The estimated expected network density remains approximately on the samelevel in later years until further increasing from 2006, with the burst of the UnitedStates housing bubble [34] and the subsequent 2007–2009 Global financial crisis[6] [B]. This behavior is interestingly consistent with our previous conclusions fortime window [A] and key analyses from [3], [6] and [34]. In particular, similarly tothe Dot-com bubble, the behavior prior to 2006 can be related to the growth of theUnited States housing bubble, which was stimulated by the unusually low interestrates decision of the Federal Reserve to mitigate the effects of the Dot-com bubble[34] and facilitated a wide network of material investments among countries undera ”global saving glut” scenario [3]. The increase of the expected network density inlater years is instead reasonably associated with need for international material co-operation to provide the many bailouts and bank rescue packages in order to avoidbankruptcy or spread of financial collapses. Refer to [6] for an overview of theinterventions required on key financial institutions covering Northern Rock, BearStearns, JP Morgan, Lehman Brother and others. A similar scenario applies duringthe subsequent European debt crisis, which required important bailout investmentsby the European Stability Mechanism and the International Monetary Fund to facethe most acute phases of the crises for Greece, Ireland, Portugal in 2010–2011 andSpain in 2012 [2]. Our dynamic network model captures also these events with highlevels in 2010–2012, which are followed by a last increment in correspondence withthe recent 2014 Russia ruble crisis.
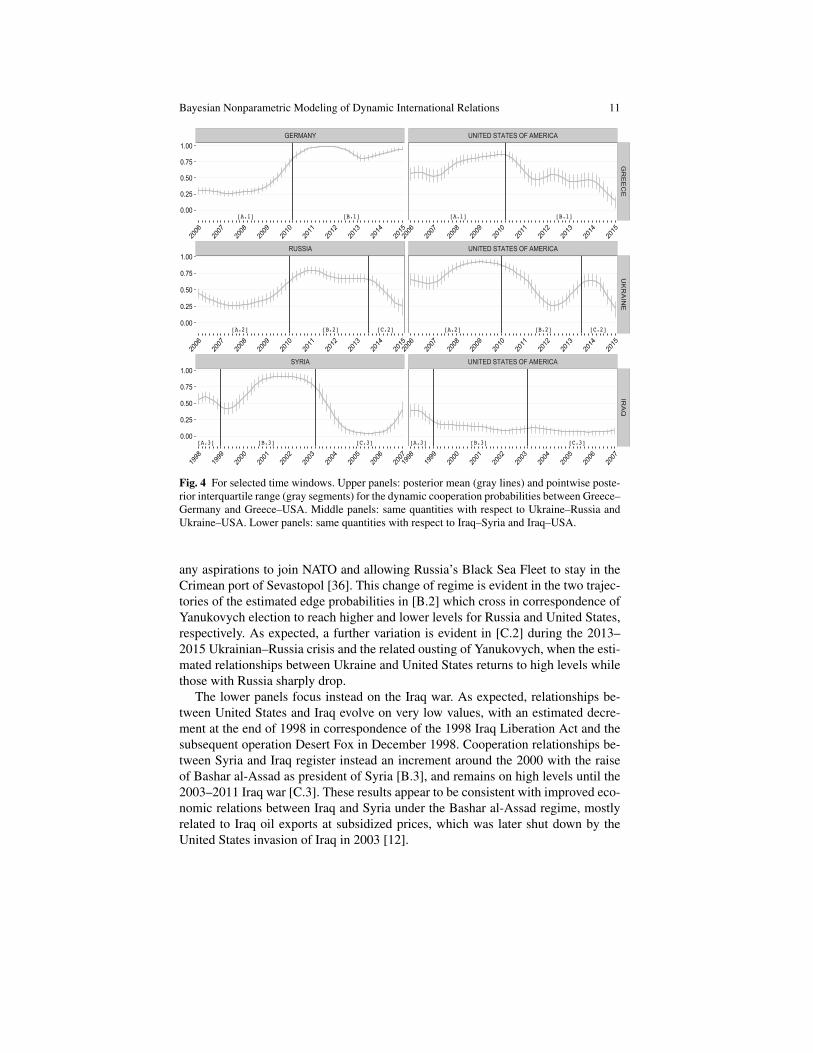
We provide further insights to specific events by focusing on the estimated dy-namic cooperation probabilities between selected pairs of countries, outlined in Fig-ure 4. Results in the top panels confirm previous discussion on the European debtcrisis with a specific focus to Greece. Consistently with the leading role of Germanyin guaranteeing financial stability of the Eurozone, the estimated cooperation prob-ability between Greece and Germany rapidly increases exactly at the burst of theGreek debt crisis and later stabilizes at very high levels. Conversely, the relation-ships between United States and Greece are instead characterized by a decreasingtrend starting in 2010. This may be a result of efforts to reduce inter-connection witha country in crisis.
The last two panels provide insights on the effect of recent conflicts on the dy-namics of the estimated cooperation probabilities. In the three time windows of themiddle panels we learn opposite behavior of United States and Russia in their co-operation relationships with Ukraine. In particular, window [A.2] refers to ViktorYushchenko president (2005–2010) and Yulia Tymoshenko prime minister (2007–2010) period who deepened relations with United States after the Orange Revolutionin 2004 and supported NATO membership for Ukraine while progressively increas-ing conflicts occasions with Russia, which culminated in the 2008–2009 Russian-Ukrainian gas crisis [36]. Consistently with the previous political background, welearn evident lower cooperation relationships between Russia and Ukraine com-pared to United States and Ukraine, with the latter evolving on very high levelsafter a bump in 2007 when the prime minister Viktor Yanukovych was succeededby Yulia Tymoshenko. Differently from Yushchenko and Tymoshenko, Yanukovychimproved relations with Russia since he was elected president in 2010, renouncing
Bayesian Nonparametric Modeling of Dynamic International Relations 11
GERMANY UNITED STATES OF AMERICA
[A.1] [B.1] [A.1] [B.1]0.00
0.25
0.50
0.75
1.00
GREECE
2006
2007
2008
2009
2010
2011
2012
2013
2014
20152006
2007
2008
2009
2010
2011
2012
2013
2014
2015
RUSSIA UNITED STATES OF AMERICA
[A.2] [B.2] [C.2] [A.2] [B.2] [C.2]0.00
0.25
0.50
0.75
1.00
UKRAINE
2006
2007
2008
2009
2010
2011
2012
2013
2014
20152006
2007
2008
2009
2010
2011
2012
2013
2014
2015
SYRIA UNITED STATES OF AMERICA
[A.3] [B.3] [C.3] [A.3] [B.3] [C.3]0.00
0.25
0.50
0.75
1.00
IRAQ
1998
1999
2000
2001
2002
2003
2004
2005
2006
20071998
1999
2000
2001
2002
2003
2004
2005
2006
2007
Fig. 4 For selected time windows. Upper panels: posterior mean (gray lines) and pointwise poste-rior interquartile range (gray segments) for the dynamic cooperation probabilities between Greece–Germany and Greece–USA. Middle panels: same quantities with respect to Ukraine–Russia andUkraine–USA. Lower panels: same quantities with respect to Iraq–Syria and Iraq–USA.
any aspirations to join NATO and allowing Russia’s Black Sea Fleet to stay in theCrimean port of Sevastopol [36]. This change of regime is evident in the two trajec-tories of the estimated edge probabilities in [B.2] which cross in correspondence ofYanukovych election to reach higher and lower levels for Russia and United States,respectively. As expected, a further variation is evident in [C.2] during the 2013–2015 Ukrainian–Russia crisis and the related ousting of Yanukovych, when the esti-mated relationships between Ukraine and United States returns to high levels whilethose with Russia sharply drop.
The lower panels focus instead on the Iraq war. As expected, relationships be-tween United States and Iraq evolve on very low values, with an estimated decre-ment at the end of 1998 in correspondence of the 1998 Iraq Liberation Act and thesubsequent operation Desert Fox in December 1998. Cooperation relationships be-tween Syria and Iraq register instead an increment around the 2000 with the raiseof Bashar al-Assad as president of Syria [B.3], and remains on high levels until the2003–2011 Iraq war [C.3]. These results appear to be consistent with improved eco-nomic relations between Iraq and Syria under the Bashar al-Assad regime, mostlyrelated to Iraq oil exports at subsidized prices, which was later shut down by theUnited States invasion of Iraq in 2003 [12].
12 Daniele Durante and David B. Dunson
References
1. Airoldi, E.M., Blei, D.M., Fienberg, S.E., Xing, E.P.: Mixed Membership Stochastic Block-models. Journal of Machine Learning Research 9, 1981–2014 (2008)
2. Belkin, P., Nelson R.M. Mix, D., Weiss, M.: The eurozone crisis: Overview and issues forcongress. Tech. Rep. R42377, Congressional Research Service (2012)
3. Bernanke, B.S.: Global imbalances: recent developments and prospects. Speech 317, Boardof Governors of the Federal Reserve System, U.S (2007)
4. Bhattacharya, A., Dunson, D.B.: Sparse bayesian infinite factor models. Biometrika 98(2),291–306 (2011)
5. Brandt, P.T., Freeman, J.R., Lin, T., Schrodt, P.A.: Forecasting conflict in the cross-straits:Long term and short term predictions. In: Annual Meeting of the American Political ScienceAssociation (2013)
6. Brunnermeier, M.K.: Deciphering the liquidity and credit crunch 2007–2008. Journal of Eco-nomic Perspectives 23(1), 77–100 (2009)
7. Durante, D., Dunson, D.B.: Nonparametric bayes dynamic modelling of relational data.Biometrika 101(4), 883–898 (2014)
8. Eun, C.S., Resnick, B.G.: International Financial Management. Tata McGraw-Hill Education(2010)
9. Frank, O., Strauss, D.: Markov graphs. Journal of the American Statistical Association81(395), 832–842 (1986)
10. Gao, J., Leetaru, K.H., Hu, J., Cioffi-Revilla, C., Schrodt, P.: Massive media event data anal-ysis to assess world-wide political conflict and instability. In: Social Computing, Behavioral-Cultural Modeling and Prediction, pp. 284–292 (2013)
11. Hanneke, S., Fu, W., Xing, E.P., et al.: Discrete temporal models of social networks. ElectronicJournal of Statistics 4, 585–605 (2010)
12. Hinnebush, R.: Syrian foreign policy under bashar al-asad. Ortadogu Etutleri 1, 7–26 (2009)13. Hoff, P.: Multilinear tensor regression for longitudinal relational data. Tech. Rep. 631, De-
partment of Statistics, University of Washington (2014)14. Hoff, P.D.: Modeling homophily and stochastic equivalence in symmetric relational data. In:
J. Platt, D. Koller, Y. Singer, S. Roweis (eds.) Advances in Neural Information ProcessingSystems 20, pp. 657–664. Curran Associates, Inc. (2008)
15. Hoff, P.D., Raftery, A.E., Handcock, M.S.: Latent space approaches to social network analysis.Journal of the American Statistical Association 97(460), 1090–1098 (2002)
16. Holland, P.W., Leinhardt, S.: An exponential family of probability distributions for directedgraphs. Journal of the American Statistical Association 76(373), 33–50 (1981)
17. Hunter, D.R., Krivitsky, P.N., Schweinberger, M.: Computational statistical methods for socialnetwork models. Journal of Computational and Graphical Statistics 21(4), 856–882 (2012)
18. Keneshloo, Y., Cadena, J., Korkmaz, G., Ramakrishnan, N.: Detecting and forecasting domes-tic political crises. In: Proceedings of the 2014 ACM conference on Web science - WebSci’14(2014)
19. Krivitsky, P.N., Handcock, M.S., Raftery, A.E., Hoff, P.D.: Representing degree distributions,clustering, and homophily in social networks with latent cluster random effects models. SocialNetworks 31(3), 204–213 (2009)
20. Kwak, H., An, J.: A first look at global news coverage of disasters by using the GDELT dataset.In: Lecture Notes in Computer Science, pp. 300–308 (2014)
21. Leetaru, K.: Culturomics 2.0: Forecasting large-scale human behavior using global news me-dia tone in time and space. First Monday 16(9) (2011)
22. Leetaru, K., Schrodt, P.A.: Gdelt: Global data on events, location and tone, 1979-2012. In:International Studies Association Annual Conference (2013)
23. Nowicki, K., Snijders, T.A.B.: Estimation and prediction for stochastic blockstructures. Jour-nal of the American Statistical Association 96(455), 1077–1087 (2001)
24. Polson, N.G., Scott, J.G., Windle, J.: Bayesian inference for logistic models usingpolya–gamma latent variables. Journal of the American Statistical Association 108(504),1339–1349 (2013)
Bayesian Nonparametric Modeling of Dynamic International Relations 13
25. Rasmussen, C.E., Williams, C.K.I.: Gaussian Processes for Machine Learning. The MIT Press(2006)
26. Robins, G., Pattison, P.: Random graph models for temporal processes in social networks. TheJournal of Mathematical Sociology 25(1), 5–41 (2001)
27. Sarkar, P., Moore, A.W.: Dynamic social network analysis using latent space models.SIGKDD Explor. Newsl. 7(2), 31–40 (2005)
28. Schein, A., Paisley, J., Blei, D., Wallach, H.: Inferring polyadic events with poisson tensorfactorization. In: NIPS 2014 Workshop on Networks (2014)
29. Schrodt, P.: Cameo conflict and mediation event observations event and actor codebook.http://data.gdeltproject.org/documentation/CAMEO.Manual.1.1b3.pdf (2012)
30. Schrodt, P.: Tabari textual analysis by augmented replacement instructions.http://eventdata.parusanalytics.com/tabari.dir/TABARI.0.8.4b3.manual.pdf (2014)
31. Sewell, D.K., Chen, Y.: Latent space models for dynamic networks. Journal of the AmericanStatistical Association to appear (2015)
32. Snijders, T.A., van de Bunt, G.G., Steglich, C.E.: Introduction to stochastic actor-based modelsfor network dynamics. Social Networks 32(1), 44–60 (2010)
33. Snijders, T.A.B.: Models for longitudinal network data. In: Models and Methods in SocialNetwork Analysis, pp. 215–247 (2005)
34. Taylor, J.B.: The financial crisis and the policy responses: An empirical analysis of what wentwrong. NBER Working Papers 14631, National Bureau of Economic Research, Inc (2009)
35. Thapthiang, N.: An analysis of news reporting and its effects, using ibil model: Lee gardensplaza and cs pattani hotels cases. Procedia-Social and Behavioral Sciences 91, 411–420 (2013)
36. Tsygankov, A.: Vladimir putin’s last stand: the sources of russia’s ukraine policy. Post-SovietAffairs 31(4), 279–303 (2015)
37. Wanta, W., Golan, G., Lee, C.: Agenda setting and international news: Media influence onpublic perceptions of foreign nations. Journalism & Mass Communication Quarterly 81(2),364–377 (2004)
38. Xing, E.P., Fu, W., Song, L.: A state-space mixed membership blockmodel for dynamic net-work tomography. Annal of Applied Statistics 4(2), 535–566 (2010)
39. Xu, K.S.: Stochastic block transition models for dynamic networks. Journal of Machine Learn-ing, Workshops & Proceedings 38, 1079–1087 (2015)
40. Xu, K.S., Hero, A.O.: Dynamic stochastic blockmodels for time-evolving social networks.IEEE Journal of Selected Topics in Signal Processing 8(4), 552–562 (2014)
41. Zaman, T., Fox, E.B., Bradlow, E.T.: A bayesian approach for predicting the popularity oftweets. Annal of Applied Statistics 8(3), 1583–1611 (2014)