Bayesian belief network modelling of household food ...
16
RESEARCH ARTICLE Open Access Bayesian belief network modelling of household food security in rural South Africa Robert W. Eyre 1 , Thomas House 2 , F. Xavier Gómez-Olivé 3 and Frances E. Griffiths 4,5* Abstract Background: Achieving food security remains a key challenge for public policy throughout the world. As such, understanding the determinants of food insecurity and the causal relationships between them is an important scientific question. We aim to construct a Bayesian belief network model of food security in rural South Africa to act as a tool for decision support in the design of interventions. Methods: Here, we use data from the Agincourt Health and Socio-demographic Surveillance System (HDSS) study area, which is close to the Mozambique border in a low-income region of South Africa, together with Bayesian belief network (BBN) methodology to address this question. Results: We find that a combination of expert elicitation and learning from data produces the most credible set of causal relationships, as well as the greatest predictive performance with 10-fold cross validation resulting in a Briers score 0.0846, information reward of 0.5590, and Bayesian information reward of 0.0057. We report the resulting model as a directed acyclic graph (DAG) that can be used to model the expected effects of complex interventions to improve food security. Applications to sensitivity analyses and interventional simulations show ways the model can be applied as tool for decision support for human experts in deciding on interventions. Conclusions: The resulting models can form the basis of the iterative generation of a robust causal model of household food security in the Agincourt HDSS study area and in other similar populations. Keywords: Directed acyclic graph, HDSS, Expert elicitation Background The Food and Agriculture Organization of the United Na- tions defines food security as “access of all people at all times to sufficient, nutritionally adequate, and safe food, without undue risk of losing such access” [1]. Many coun- tries have food-insecure populations but globally the num- ber of undernourished people is falling. However, the World Food Summit and the Millennial Development Goal 1.C to halve the proportion of people who suffer from hunger between 1990 and 2015 was not achieved and food insecurity remains an issue for many [2]. Prior to 1999, in South Africa 42% of the population lived below the food poverty line as measured using a quantitative method that relates monthly household food expenses with food insecurity [3]. The number of food insecure people in South Africa decreased between 1999 and 2008 [4] but over a third of children still had low dietary diversity [4] (i.e. few different foods or food groups eaten over a period of time) and the food inse- curity rate in rural areas of South Africa is twice that of urban areas [3]. Understanding the determinants of food insecurity therefore remains an important question, even © The Author(s). 2021 Open Access This article is licensed under a Creative Commons Attribution 4.0 International License, which permits use, sharing, adaptation, distribution and reproduction in any medium or format, as long as you give appropriate credit to the original author(s) and the source, provide a link to the Creative Commons licence, and indicate if changes were made. The images or other third party material in this article are included in the article's Creative Commons licence, unless indicated otherwise in a credit line to the material. If material is not included in the article's Creative Commons licence and your intended use is not permitted by statutory regulation or exceeds the permitted use, you will need to obtain permission directly from the copyright holder. To view a copy of this licence, visit http://creativecommons.org/licenses/by/4.0/. The Creative Commons Public Domain Dedication waiver (http://creativecommons.org/publicdomain/zero/1.0/) applies to the data made available in this article, unless otherwise stated in a credit line to the data. * Correspondence: [email protected] 4 Warwick Medical School, University of Warwick, Coventry CV4 7AL, UK 5 University of the Witwatersrand, Johannesburg, South Africa Full list of author information is available at the end of the article Eyre et al. BMC Public Health (2021) 21:935 https://doi.org/10.1186/s12889-021-10938-y
Transcript of Bayesian belief network modelling of household food ...

RESEARCH ARTICLE Open Access
Bayesian belief network modelling ofhousehold food security in rural SouthAfricaRobert W. Eyre1, Thomas House2, F. Xavier Gómez-Olivé3 and Frances E. Griffiths4,5*
Abstract
Background: Achieving food security remains a key challenge for public policy throughout the world. As such,understanding the determinants of food insecurity and the causal relationships between them is an importantscientific question. We aim to construct a Bayesian belief network model of food security in rural South Africa to actas a tool for decision support in the design of interventions.
Methods: Here, we use data from the Agincourt Health and Socio-demographic Surveillance System (HDSS) studyarea, which is close to the Mozambique border in a low-income region of South Africa, together with Bayesianbelief network (BBN) methodology to address this question.
Results: We find that a combination of expert elicitation and learning from data produces the most credible set ofcausal relationships, as well as the greatest predictive performance with 10-fold cross validation resulting in a Briersscore 0.0846, information reward of 0.5590, and Bayesian information reward of 0.0057. We report the resultingmodel as a directed acyclic graph (DAG) that can be used to model the expected effects of complex interventionsto improve food security. Applications to sensitivity analyses and interventional simulations show ways the modelcan be applied as tool for decision support for human experts in deciding on interventions.
Conclusions: The resulting models can form the basis of the iterative generation of a robust causal model ofhousehold food security in the Agincourt HDSS study area and in other similar populations.
Keywords: Directed acyclic graph, HDSS, Expert elicitation
BackgroundThe Food and Agriculture Organization of the United Na-tions defines food security as “access of all people at alltimes to sufficient, nutritionally adequate, and safe food,without undue risk of losing such access” [1]. Many coun-tries have food-insecure populations but globally the num-ber of undernourished people is falling. However, theWorld Food Summit and the Millennial DevelopmentGoal 1.C to halve the proportion of people who suffer
from hunger between 1990 and 2015 was not achievedand food insecurity remains an issue for many [2].Prior to 1999, in South Africa 42% of the population
lived below the food poverty line as measured using aquantitative method that relates monthly household foodexpenses with food insecurity [3]. The number of foodinsecure people in South Africa decreased between 1999and 2008 [4] but over a third of children still had lowdietary diversity [4] (i.e. few different foods or foodgroups eaten over a period of time) and the food inse-curity rate in rural areas of South Africa is twice that ofurban areas [3]. Understanding the determinants of foodinsecurity therefore remains an important question, even
© The Author(s). 2021 Open Access This article is licensed under a Creative Commons Attribution 4.0 International License,which permits use, sharing, adaptation, distribution and reproduction in any medium or format, as long as you giveappropriate credit to the original author(s) and the source, provide a link to the Creative Commons licence, and indicate ifchanges were made. The images or other third party material in this article are included in the article's Creative Commonslicence, unless indicated otherwise in a credit line to the material. If material is not included in the article's Creative Commonslicence and your intended use is not permitted by statutory regulation or exceeds the permitted use, you will need to obtainpermission directly from the copyright holder. To view a copy of this licence, visit http://creativecommons.org/licenses/by/4.0/.The Creative Commons Public Domain Dedication waiver (http://creativecommons.org/publicdomain/zero/1.0/) applies to thedata made available in this article, unless otherwise stated in a credit line to the data.
* Correspondence: [email protected] Medical School, University of Warwick, Coventry CV4 7AL, UK5University of the Witwatersrand, Johannesburg, South AfricaFull list of author information is available at the end of the article
Eyre et al. BMC Public Health (2021) 21:935 https://doi.org/10.1186/s12889-021-10938-y
for middle-income countries such as South Africa, par-ticularly in rural areas.Here we use a methodology that allows us to consider
causal interactions between the multiple, interacting var-iables involved in food security, applied to data from alow resource, rural South African community. In par-ticular, we construct belief networks between variablesusing Bayesian reasoning and consider how these com-pare with the community’s own beliefs about determi-nants of food security. Such belief networks can beinterpreted, with policy implications drawn out, by non-specialists, and as such we believe that the methodologycould usefully be applied more frequently in food secur-ity research.
Study settingThe Agincourt Health and Socio-demographic Surveil-lance System (HDSS) study area is located in a relativelydensely populated low-resource rural setting in ruralnortheast South Africa close to the Mozambique border.Originally the study area covered 57,600 people in 8900household and 20 villages [5] but by 2011 it had increasedto 90,000 people in 16,000 households and 27 villages [6].An annual survey of all households has been undertakensince 1992, with full methodological details available else-where [5, 6]. The study area is characterized by rudimen-tary sanitation, poor quality education, and poor qualityland that makes agricultural farming difficult, alongsidelimited healthcare and high unemployment.Previous studies published on household food security
in the Agincourt HDSS study area include, the impacts ofadult mortality [7, 8] the impact of the food retail sector[7], the quality of food security indicators [8], and howhousehold food security in the area varied over the 2008financial crisis [9]. These studies have tended to use stand-ard statistical methods in which e.g. a linear model is usedto establish the epidemiological relationship between aproposed determinant and food security.
Community concernsCommunity concern about food security was raised atan MRC/Wits-Agincourt Unit Community AdvisoryGroup (CAG) meeting in 2015. The CAG is composedof individuals who live in the Agincourt HDSS studyarea and act as liaisons from the community to the re-search unit. The perception of individuals within theCAG was of food insecurity being a persistent and wide-spread issue in the area, with high financial constraints,intermittent water access, poor land quality, and the un-fashionable status of subsistence farming amongst youngpeople making it difficult to attain enough food eachmonth to live a healthy and active lifestyle. The CAGexpressed frustration about not knowing where an inter-vention might make a difference to food security.
Modelling interventions in complex systems usingBayesian belief networksWhile standard methodology has the benefit that thepresence or absence of certain relationships can behypothesised and statistically tested, this approach islimited in what it is able to tell us about what is clearly acomplex system. In particular, we might expect on thebasis of expert opinion that there are relationships be-tween the many interrelated characteristics of a house-hold that contribute towards whether the household isor is not food secure. This would mean that a policybased on modification of one determinant might haveunexpected consequences due to the effects on otherfactors. Bayesian belief networks give a graphical repre-sentation of the probabilistic dependencies and indepen-dencies in a system, presenting a many-to-many viewwhere each variable is taken as random variable whichhas the potential to have a direct (probabilistic) relation-ship with any other variable. Although we are interestedin food security as an outcome, we can make use of ob-servations of any variables in the model to make infer-ences relevant to any of the other variables. This is incontrast to the many-to-one view of many other modelswhere we always have one dependent variable being in-ferred from a group of observed independent variables.The Bayesian belief network approach makes it possibleto capture the many and complex relationships expectedbetween variables.A Bayesian belief network will potentially provide a
model of food security with greater ability to capturecausal effects and provide a basis for intervention thanwe might otherwise have. It allows us to reason prob-abilistically about the system, in particular to ask ques-tions of how each variable impacts on each othervariable. Bayesian belief networks encode directional re-lationships between multiple variables with associatedconditional probability distributions. They can then beused to find how the likelihood of one variable having aparticular state or value changes given the states orvalues of other variables in the network through the dir-ect or indirect relationships they have with the variableof interest. This allows us to make interventional, coun-terfactual, and other more complicated queries of ourmodel [10].Due to these qualities, Bayesian belief networks have
been successfully used in many research areas, includingfor example semantic search [11], information retrieval[12], analysis of gene expressions [13], medical diagnosis[14], and filtering, smoothing, and prediction [15].Barons et al. [16] applied the method to food security inthe UK. Here we build a Bayesian belief network modelwith the specific aim of providing a causal representationof the interrelations between various characteristics ofhouseholds in the Agincourt HDSS study area within
Eyre et al. BMC Public Health (2021) 21:935 Page 2 of 16

the context of food security. Although we aim for theresulting model to provide causal insights into the sys-tem, we note that validating the accuracy of any causalrelationships the model implies is difficult, and it is bestviewed as a tool for decision support by human experts.In subsequent sections, we give details of the construc-
tion of our specific Bayesian network from choosing thevariables, through learning the structure and parameters,to seeking quantitative validation of the model. Finally,we give some elementary applications of the networks ininterventional inferences.
MethodsFormal description of Bayesian belief networksAs discussed in the Introduction above, Bayesian net-works are often used to give a representation of a set ofcausal beliefs about the system, often initially obtainedfrom experts. We define our model as a finite set of ran-dom variables V , which are also the vertices of a net-work, together with a set of edges E⊂V �V . A linkfrom variable A to variable B (mathematically, ðA;BÞ∈E )implies that A causes B, as well as that B is directlyprobabilistically dependent on A.Each of the possible states of each variable in the net-
work are encoded through conditional probability tables(CPTs) for each variable. An entry in the CPT of a vari-able contains the probability that the variable is in a par-ticular state given its parents are each in particular statesof their own. For example, if the food security variablehad one direct parent, such as socio-economic status,then the CPT for food security would contain probabil-ities that the household is food insecure or food securegiven socio-economic status is high, that it is food inse-cure or food secure given socio-economic status is low,and so on. Which variables are linked to which othervariables forms the discrete structure of our model, andthe entries of the conditional probability tables are thecontinuous parameters of our model.While a full algorithmic description of Bayesian be-
lief networks is beyond the scope of this paper, manyexcellent resources exist on details of the topic [17–19]. For inferences performed on our data with com-pleted network models, we obtained good perform-ance from the use of the Lauritzen-Spiegelhalter (LS)algorithm [20], as implemented by the gRain packagein the software R [21]. This algorithm is a specialisedvariation of belief propagation, taking advantage ofthe network structure to eliminate variables and sim-plify the calculation of probability distributions whenmaking inferences on the likelihood of variables hav-ing a particular value given the values other variablesin the network [20].
Overview of model building processHere we provide a summary overview of the processundertaken to build the Bayesian belief network model.Further detail for each step is given in subsequent sub-sections. The entire process is illustrated in Fig. 1.Given the initial motivation for this study came from
the MRC/Wits-Agincourt Unit Community AdvisoryGroup (CAG), as discussed in the Introduction, wewould expect that using expert knowledge from mem-bers of the community would help with learning thestructure of the network. This introduces a strong elem-ent of community involvement in the work and, on theassumption that such expert knowledge contains usefulinformation about the system, it can improve the possi-bility of discovering causal structure, which is difficult toachieve when learning from data alone [22].For expert elicitation to work, there must be no latent
variables not covered in the variables presented to ex-perts. We kept this in mind when selecting variables.When performing the expert elicitation, we followed aprotocol stated in [22], designed specifically for elicitinga causal structure from expert knowledge.Whilst expert elicitation can maximise the chances of
learning a causal structure, it relies entirely on the know-ledge of the experts, which could be narrowed by their lifeexperiences. Our experts were community members ra-ther than experts who had studied the problem as used byBarons et al. [16]. We therefore compared expert elicit-ation for learning network structure with learning thestructure algorithmically from the data.We were also able to construct a causal network com-
bining both the expert results and data-based learningby using the expert network as a prior for algorithms tobuild on using the data.The model building process (Fig. 1) therefore involved
the following steps:
1 Select variables and their order in the networkmodels (i.e. which variables are considered possiblycausally dependent on which other variables) via aliterature search [22].
2 Given the variables selected, specify our dataset.3 Construct the structure of our first network model
via expert elicitation.4 Construct the second network model structure by
learning from data.5 Using the expert elicited network structure as a
prior, use data to learn a refined structure as thethird network model.
6 For each network use parameter estimation tocalculate the conditional probability tables (CPTs).
7 Validate the models using causal validation, as wellas a predictive validation and, for the expert elicitedmodel, expert validation of the structure.
Eyre et al. BMC Public Health (2021) 21:935 Page 3 of 16

Variable selection and orderingThe first step in building our Bayesian belief networks,as detailed by the protocol being followed, involves a lit-erature search to discover the variables [22].The first step involved searching the literature for
household characteristics that form possible causes ofchange in household food security, which is our utilityvariable. The second step then involved searching the lit-erature for household characteristics that form possiblecauses of change in the characteristics found in step one.The third step looked for characteristics that form pos-sible causes of those from step two, and so on. This wasrepeated for as many steps as were possible, subject totwo constraints. First, we could only select variables thatare measured in the Agincourt HDSS dataset. Secondly,we needed to limit the burden on the community ex-perts when eliciting the structure of the network. Wetherefore limited the variables to those of greatest im-portance and relevance to food security. Further detailsof the literature search, the resulting variables in eachlevel and how each variable was calculated, can be foundin the Electronic Supplementary Material.Breaking up the variables into levels gave us a causal
ordering of the variables. This ordering is importantwhen eliciting the network structure from experts and ithelps minimize the possibility of leaving out latent vari-ables that could confound any causal findings.
Variable state calculation and specifying the datasetMost of the variables were calculated using a suitablecombination of variables in the Agincourt HDSS dataset,calculated at or aggregated to the household level. Whilemost variables can be straightforwardly taken from thedata, two require additional discussion.The first such variable is Food Security, which was cal-
culated from a single variable in the Agincourt HDSSdataset specifying whether the household had enoughfood to eat over the past year. While definitions of foodsecurity in the literature are often more nuanced thanthis measure, most other variables related to food secur-ity in the Agincourt HDSS dataset feature large amountsof missing data, but this variable does not. It is alsostrongly correlated with many more subtle measures offood security, despite its simplicity. When consideringthe results of applying the completed Bayesian network,however, we must simply remember that food securityin this case is defined as having had enough food to eatover the past year.The second such variable is the local vegetation level.
Following Nawrotzki et al., we calculated this from theNormalised Difference Vegetation Index (NDVI) [9, 23].NDVI data was obtained from the MODIS/Terra sensorsatellite images, which contains NDVI values for 250 mareas averaged over day periods [24]. As per Nawrotzkiet al., local vegetation level is calculated for a particular
Fig. 1 Process for building models. First variables are selected and ordered via literature search. Then three separate network structures are learnedfrom expert elicitation only, data only, and data with the expert network as a prior. Parameter estimation and appropriate model validations areperformed for all three networks
Eyre et al. BMC Public Health (2021) 21:935 Page 4 of 16
household as the NDVI over the 2000 km region aroundthe household (not including land within villages so asto avoid including privately owned land) averaged overthe households within that region. Though Nawrotzkiet al. averaged these values over the preceding 3 years ofthe year of analysis, we only averaged them over the yearof analysis to avoid removing detail of differences be-tween each year.Variables that were calculated from the Agincourt
HDSS food security module were done so for the years2007, 2010, and 2013, i.e. the years in which the modulewas performed during the census. For the other vari-ables, their value from the nearest previous year whenthe data to calculate them was collected was used foreach household at each of the three food security mod-ule years. Our sample was formed by households thatprovided complete enough data to calculate values foreach of the variables for at least one of the food securitymodule years. For each household, the latest entry fromeither 2007, 2010, or 2013 was taken, as it was foundthat allowing households to have multiple entries for dif-ferent years reduced the performances of the modelsseen in the model validations and comparisons. Thesample size for our dataset was 11,739 households.Although it would be possible to construct a dynamic
Bayesian network with nodes for the different variablesat each of the different time points [19], the data wasonly sufficiently informative to support construction of astatic network.Values/states of each variable were taken from the
values/states recorded in the Agincourt HDSS questions.Several of the variables were discretised, as detailed inthe Electronic Supplementary Material, in order to re-duce the number of possible states and simplify the cal-culations involved in finding the parameters of themodel and performing inferences. This was done in sucha way to coarse-grain the distribution of the variable, ei-ther by combining neighbouring states that occurredrarely, or by binning the data for that variable to an ap-propriate number of histogram bins.
Structure learning via expert elicitationWe performed an expert elicitation to find a possiblecausal structure for the Agincourt HDSS food securitybelief network, relying on the knowledge of members ofthe Community Advisory Group (CAG). To perform thiselicitation we relied on the protocol described in [22].After selecting a set of variables and a causal orderingfor them, as described above, we carried out the elicit-ation. A pilot study for the elicitation was carried out ona convenience sample of University students andemployees (including from a non-mathematicalbackground) to confirm that the process would beunderstandable for experts.
The elicitation was performed by the Head of the Pub-lic Engagement Office of the MRC/Wits-Agincourt Unitfollowing our design and instructions in the MRC/WitsAgincourt Unit offices on 28th October 2016. The ex-perts were guided through a list of the variables, in theorder defined by the causal ordering starting with thehighest level variables (which our ordering specifies haveno possible causes within the other variables, but arepossible causes for all the other variables) and finishingwith the lowest level variable food security (which is spe-cified to cause none of the other variables, and can becaused by all other variables). For each variable, weattempted to establish based on the local knowledge ofour experts which of the previous variables in the listwould have an effect on the beliefs of the experts onwhat state the variable in question would take for a gen-eric household. We carefully designed our questions toattempt to capture the conditional independences be-tween the variables by asking the experts to first con-sider the hypothetical situation where they already knowthe states for a household of all the variables previous inthe list except one, and then whether learning the stateof that one extra variable would provide any extra im-pact on their belief of the variable of interest.In order to prepare the experts for the elicitation, they
were first told the purpose of the work and what out-comes are hoped for, as well as a brief lay explanation ofBayesian networks. They were guided through a set ofexample questions on a different smaller system takenfrom the Agincourt HDSS study area in order to helpthem understand how to answer the questions, and toget them used to answering them before having to an-swer the ones we cared about. The elicitation was per-formed with the experts as a group to reduce theburden. The experts were also reassured that none oftheir answers would be incorrect in order to avoid anybiases such as adjusting their answers to try and get tothe ‘right one’.
Structure learning via dataIn order to learn an alternative possible causal networkfor our system we used a constraint-based algorithmknown as Max-Min Parents and Children (MMPC) [25,26]. For each node A, the MMPC algorithm attempts todiscover the set of parents and children of A. TheMMPC algorithm can be performed for each node tofind all the local structures and construct a skeleton ofthe network (i.e. with no directions).This was performed for our Agincourt HDSS house-
hold food security dataset using the asymptotic normalJonckheere-Terpstra test for conditional independenceto take into account the ordinal nature of the variables[27]. Links that would go against the causal ordering wedefined in our literature search were disallowed from the
Eyre et al. BMC Public Health (2021) 21:935 Page 5 of 16
start. The order of the variables used in the expert elicit-ation was used to gain directions in the skeleton networkachieved by the algorithm. The algorithm was trained onall 11,739 households in the dataset, each household act-ing as an individual observation.
Parameter estimationFormally speaking, the network parameters for themodel are:
θijk ¼ Pr Ai ¼ j jpa Aið Þ ¼ kð Þ;
where Ai is an individual variable, j is a possible state ofthat variable, pa(Ai) are the parent variables of Ai in thenetwork, and k are the states of the parent variables. Al-though it is possible to elicit these from experts as well,we instead estimated them from data. This both avoidedthe many cognitive biases that the experts could beprone to, and avoided placing an additional and im-mense burden on the experts on top of what we havealready asked of them. The parameters were estimatedby their maximum a posteriori (MAP) values found bymaximising the product of the multinomial likelihood ofthe network (arising from the discrete nature of all thevariables) with a Dirichlet prior that was equivalent toadd-one smoothing [17]. The choice of prior eases com-putations as Dirichlet is the conjugate prior of the multi-nomial likelihood. The add-one smoothing adjusts forcases where no occurrences of a particular combinationof variable and parent states appear in the data. Likewith using the data to learn the network structure, theparameters were fitted using all 11,739 households, witheach acting as an individual observation.
Expert validationConditional and unconditional independences in aBayesian network can be found using the mathematicalconcept of d-separation [19, 22]. We performed one val-idation of our expert elicited structure by testing rela-tionships found via d-separation with the expectations ofour experts.Since over 8000 different independence relationships
are implied by the network’s structure, the number to beworked with was severely reduced in a structured fash-ion. In order to make it simpler for the experts, only re-lationships of the kind A ⊥ B ∣C where A and B onlycontained one variable each and B came before A in thecausal ordering defined in the literature search werequestioned. From these, examples where the fact that Ais at all independent of B appears counter-intuitive wereselected as these seemed the most pertinent to check. Fi-nally, for each possible pair of A and B in the remainingrelationships, the relationship A ⊥ B ∣C where C con-tained the smallest set of nodes was selected, again to
make it easier for the experts. This resulted in 34 rela-tionships to check against the beliefs of the experts.This elicitation was performed with a new set of ex-
perts, still taken from the CAG. It was again performedby Head of the Public Engagement Office of the MRC/Wits-Agincourt Unit following our design and instruc-tions, located in the MRC/Wits-Agincourt Unit officesin March 2017.
Predictive validationThe ability of a model to predict does not imply that it is agood causal model. Nevertheless, predictive power is a de-sirable feature of a causal model, and so we test for it.To achieve this, we performed a 10-fold cross valid-
ation for each network, where the network structureswere kept constant but parameter values were allowedto vary dependent on the data subset they were being fit-ted to. Since there are different classifiers to allow us tobest distinguish between the networks. The first, Briersscoring, gives a heavier penalisation the lower the pre-dicted probability of the correct food security state ofthe household, with severe penalisation given for par-ticularly extreme incorrect results [28]. The second, in-formation reward, prefers models that estimateprobabilities of the correct state that are better than ran-dom and penalize ones that are worse [29]. The last,Bayesian information reward, prefers models that esti-mate probabilities of the correct states that are betterthan some chosen prior probabilities (here chosen to beequal to the empirical frequency of food insecure house-holds in the training data), and then penalises ones thatare worse – thereby indicating whether a given networkstructure allows for better prediction of food insecuritythan what we can tell by simply looking at the data [30].
Causal validationThere is no widely accepted way to measure the faithful-ness of a model to the causal relationships of the systemit represents using observational data. Rather, the ac-cepted method for validation of causal structure is tomeasure the effects of interventions on the outcomes ofinterest. Since running our own interventions wouldhave been impractical and unethical, we looked for dataon food security interventions performed on similarpopulations to ours, and looked to see which models (ifany) successfully capture these results. To do this weperformed a thorough search of the literature, lookingfor interventions aimed at food security in populationssimilar to that of the Agincourt HDSS study area i.e.rural populations in low to middle income countriesthroughout Sub-Saharan Africa, Asia, and Latin Amer-ica. We then performed interventional inferences exam-ining the effect of such interventions on the probabilityof a household being food insecure. This was done using
Eyre et al. BMC Public Health (2021) 21:935 Page 6 of 16

the standard approach necessary for interventional infer-ences where the state of the interventional variable is setin the network and all incoming links to that variableare removed before calculating the conditional probabil-ity of food insecurity given the interventional variablebeing in the chosen state. This reflects the fact that inthis case the variable has been artificially set by an out-side force, and is no longer dependent on the factorsthat usually influence it [19].
ApplicationsFinally, we considered some applications of such aBayesian network model for food security. One interest-ing application is in using them to find which of the var-iables have the greatest probabilistic impact on foodsecurity, which can be done through a sensitivity ana-lysis. This was performed following Barons et al. by cal-culating values for mutual information reduction andexpected change of belief [16].The most useful application of a causal Bayesian net-
work is in simulating possible interventions on it to seewhether they should be attempted in actuality. As such,we performed some possible novel interventional strat-egies based on findings from a search of the literaturefor food security interventions in rural populations oflow to middle income countries.
ResultsNetwork structureThe variable-selection step of the expert elicitation re-sulted in the inclusion of the following variables along-side food security, further details of which can be seenin the Electronic Supplementary Material: child grantstatus (CGS); education level (EdL); employment level(EmL); household head gender (HHG); level of localvegetation (LLV); number of dependants (ND); numberof working age adults (NWAA); receipt of communalaid (RCA); refugee status (RS); selling of crops and live-stock (SCL); socio-economic status (SES); use of cropsand livestock (UCL); use of wild foods (UWF); and wateraccess (WA). The resulting network structures for eachof our three possible methods of structure learning canbe seen in Fig. 2. The figure only show the networkstructures and not the accompanying conditional prob-ability tables that parameterise the models due to thevery high number of parameter values in the model (thecombination of all possible states and all possible parentstates of each variable). As we are interested in the pos-sible causal implications of the models, given by thestructures themselves, this is still of value.The resulting network from the expert elicitation
(Fig. 2(i)) shows some interesting discrepancies fromfindings in the literature. For instance, expert opinion isthat household head gender has no impact on any of the
other variables. Refugee status is also held to have min-imal direct impact. Also, water access is elicited as hav-ing no impact on the growing of crops due toindividuals relying on rainwater rather than the watersupply to water their crops and gardens.The data-learned network (Fig. 2(ii)) shows some sub-
stantial differences compared to the expert elicited net-work, which is unsurprising given the very different setsof information each network was built upon. Most dif-ferent is the much greater level of sparseness in thedata-learned network. Household head gender is alsolinked into the data-learned network, unlike the expertelicited one, but selling of crops and livestock is now dis-connected. Child grant status has no directed path tofood security either, meaning that neither of these nodeswould be effective means of intervention according tothis network.The final resulting network from a combination of ex-
pert and data learning (Fig. 2(iii)) appears sparser thanthe other two but still has all nodes linked into the net-work. There are also more leaf nodes in the networkwith no children such as selling of crops and livestock,level of local vegetation, and child grant status again. Ifthis approach is correct, these nodes would be ineffectivefor any interventions against food insecurity.Despite the efforts to ensure relationships going
against causality were avoided, some seemingly counter-intuitive ones still appeared such as the number of work-ing age adults and refugee status having a causal impacton household head gender. These relationships are not,however, counter-intuitive when interpreted correctly –e.g. the gender of an individual is not determined byrefugee status, but refugee status can influence whichgender heads the household.
Model validation resultsThe results of the initial expert-based validation of theexpert structure implies that the initial elicited structureproves quite robust against checks of relationships dis-covered via d-separation. Only 11 out of 34 of the rela-tionships were deemed to be false (though 2 wereunanswered). Typically this was due to the new set ofexperts thinking that household head gender does im-pact on certain variables, Mozambican refugees are nowindistinguishable from South African nationals, and thatboth age and education impact on attitudes which inturn impact on things such as the willingness to farm,forage for food, and claim welfare.When it came to the predictive validation, unsurpris-
ingly learning the structure from data gave greater pre-dictive performance than relying on the expertelicitation in terms of overall cross validation scores(Table 1). The data gave a greater population view ofwhat is happening than the experts, although did not
Eyre et al. BMC Public Health (2021) 21:935 Page 7 of 16
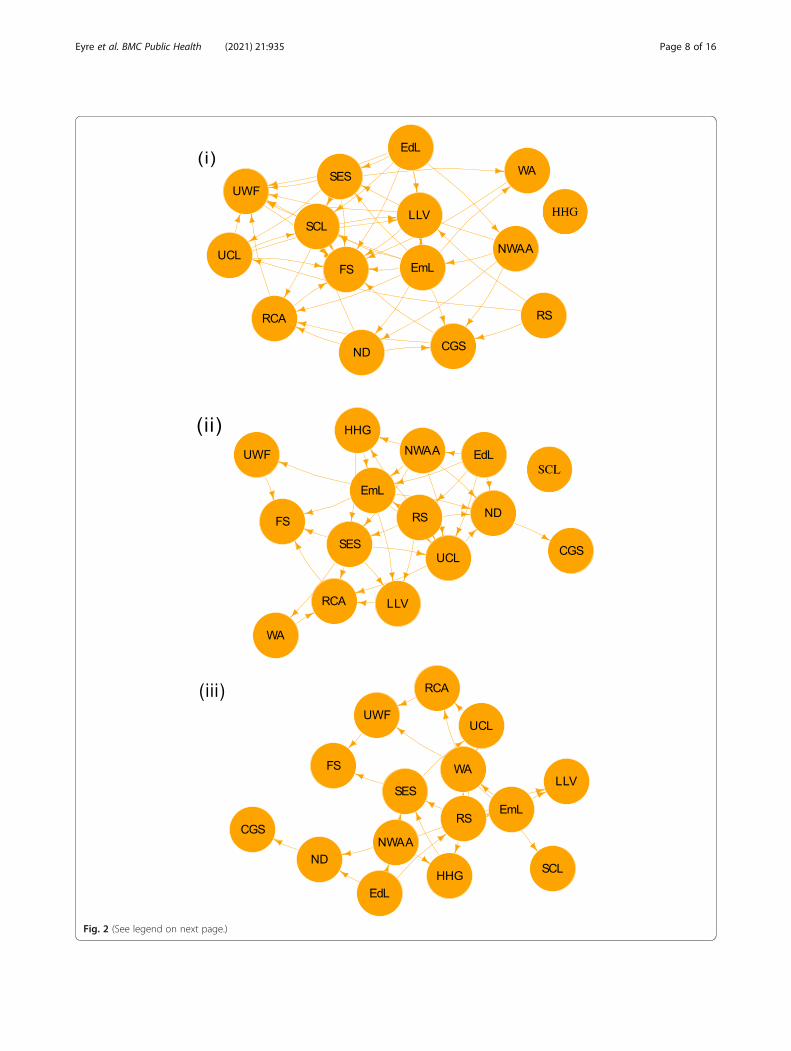
Fig. 2 (See legend on next page.)
Eyre et al. BMC Public Health (2021) 21:935 Page 8 of 16

give an improvement on performance compared to sim-ply relying on the empirical data frequencies. Usingdata-learning with the expert network as a prior resultsin an increase in performance over the data-learnedmethod and in fact is the only method to improve uponrelying on the empirical frequencies.Examining the confusion matrices, calculated by learn-
ing the models from a randomly chosen subset forming90% of the data and then predicting the food securitystate of the remaining 10%, shows less of a distinctionbetween the different models (Table 2). However, usingdata-learning with the expert network as a prior stillseems to give some improvement here. The state of theconfusion matrices is also reliant on the random split-ting of the data used. Due to the use of cross validation,the combination of scores still give a more reliable com-parative measure of performance between the models.
Model simulations and comparison with interventionstudiesThe literature review for real food security interventionsperformed in rural populations in low to middle incomecountries found that several agricultural interventionshave been performed in the form of community agricul-tural projects, homestead food production, and the de-velopment of gardens in countries and regions such asBangladesh, South-East Asia, Latin America, Rwanda,South Africa itself, and other low to middle incomecountries [31–37]. Various financial interventions havealso been performed, such as providing public sectoremployment and cash transfers in Latin America andEthiopia [35, 38], as well as micro-loans and micro-credit in sub-Saharan Africa [39, 40]. In addition tothese, we also found interventions on water qualitythroughout Asia and Africa [34].
It should be noted that whilst some of the interven-tions discovered by the literature review were parts ofcontrolled studies, others were reports of governmentstrategies that therefore may not have successfully con-trolled for confounding variables which may undermineany causal implications we can take from them. Theymay also be subject to publication bias, causal structuremay vary across space and time meaning that we cannotcompare across years and countries, and some considera different definition of food security from ours. Never-theless, it is interesting to look at what our networkswould predict for interventions analogous to those inthe empirical studies.The interventions found in the literature therefore
gave us possible simulations to run on our networks. Inparticular, we simulated setting the values for the ‘use ofcrops and livestock’, ‘child grant status’, ‘selling of cropsand livestock’, ‘socio-economic status’, ‘employmentlevel’, and ‘water access’ variables individually andlooked at the impact on the probability of the householdbeing food secure. The simulation results can be seen inFigs. 3 and 4, with further results in the Electronic Sup-plementary Material, and we see from these that food se-curity changes depend on both the variable(s) changedand the causal network structure.
(See figure on previous page.)Fig. 2 Agincourt HDSS food security belief networks with structure learned from (i) expert elicitation only (ii) data only (iii) data with the expertnetwork as a prior. CGS – child grant status. EdL – education level. EmL – employment level. FS – food security. HHG – household head gender.LLV – level o3f3 local vegetation. ND – number of dependents. NWAA – number of working age adults. RCA – receipt of communal aid. RS –refugee status. SCL – selling of crops and livestock. SES – socio-economic status. UCL – use of crops and livestock. UWF – use of wild foods. WA– water access
Table 1 Model comparison of predictive performance for thedifferent network structures learned from a 10-fold crossvalidation. Briers score, information reward, and Bayesianinformation reward indicate that learning from data massivelyoutperforms learning from experts, but using expert knowledgeas a prior provides an additional small increase in performance
Learning method SB SIR SBIR
Expert elicitation 0.1321 0.3908 −1.9004
Data-learned 0.0851 0.5577 −0.0270
Data-learned with expert prior 0.0846 0.5590 0.0057
Table 2 Predictive confusion matrices for each network structure,displaying numbers of true positives, false positives, truenegatives, and false negatives. These values were calculated bylearning the structure and parameter values from a randomsubset forming 90% of the overall data, then making predictionsfor whether a household is food secure or not for the remaining10% of the data. These show less distinction between thedifferent network structures in terms of performance but usingexpert knowledge as a prior still seems to give a small boost
True state
Predicted state Food secure Food insecure
(a) Expert elicitation
Food secure 570 34
Food insecure 492 79
(b) Data-learned
Food secure 554 42
Food insecure 508 71
(c) Data-learned with expert prior
Food secure 617 44
Food insecure 445 69
Eyre et al. BMC Public Health (2021) 21:935 Page 9 of 16

Fig. 3 (See legend on next page.)
Eyre et al. BMC Public Health (2021) 21:935 Page 10 of 16
In particular, we see that for employment and educa-tion levels (Fig. 3(i, iii)) the expert elicited and data-learned networks produce counter-intuitive results – i.e.that increases to these variables decrease the probabilityof food security – that conflict with empirical studies,while the network combining data learning with expertelicited priors produces results that do not. For socio-economic status (Fig. 3(ii)), we see consistently strongeffects, which implies that socio-economic status is asimportant to food security as we expect it to be, perhapsmore so than any other household characteristic. Givenhow it relates so heavily to many household characteris-tics it is not surprising that it could capture much ofwhat makes a household food secure or not. For thisvariable, the monotone response of the network combin-ing data learning with expert elicited priors is more con-sistent with intuition and empirical observations.We stress that the considerations of confounding, publi-
cation bias, context etc. above mean that these results can-not provide more than very indirect evidence in favour ofone causal network or another. They do, however, showthat much more could be done to validate different causalrepresentations of the system, although this is beyond thescope of this current work. Nevertheless, it is suggestivethat the combination of data learning and expert elicit-ation is more consonant with other sources of informationthan either data or elicitation alone.
ApplicationsOur results indicate possible avenues for interventionalstudies if the networks are taken with a causal interpret-ation. Otherwise, they show us the variables with thegreatest probabilistic relationships with food security(Table 3), which may aid in streamlining efforts to iden-tify potential food insecure households, which may behelpful given how rarely food security information is col-lected compared to other information. The expert elic-ited network results also give an indication of whatvariables have the greatest impact on the beliefs of amember of the community when considering what otherhouseholds may be food insecure.When considering possible interventions for similar
populations (rural populations in low to middle incomecountries), various observational studies imply that edu-cation, communal aid, local vegetation, and being a refu-gee should each individually have a substantial effect onfood security [9, 41, 42]. However, our inferences implythat these variables actually have only negative, if any,
impact on food security (examples for education leveland refugee status are shown in Fig. 3(iii) and (iv), withfurther results available in the Electronic SupplementaryMaterial) dependent on the network used. This onlymatches the literature for refugee status, where it implieswe should expect a negative impact (although our effectis quite small).Dovie et al. found that use of wild foods is prevalent in
the Bushbuckridge district, within which the AgincourtHDSS study area is situated [43]. Performing an inter-vention on this variable shows that increased use of wildfoods leads to lower probability of food security(Fig. 3(v)) completely irrespective of the network. It ispossible here that the direction of the relationship is in-correct, as perhaps more food insecure households useforaging as a coping strategy so that use of wild foodsonly occurs after food insecurity has been attained.Mabuza et al. found that non-farming income provides
for greater food security than farming income [44]. If welook at a combined inference of selling of crops and live-stock and employment level at the same time (Fig. 4(i))we find that selling crops and livestocks makes largelyno difference. Controlling for it though does allow foran impact from employment level, though this is onlypositive for the data-learned network with the expertprior where the effect is also quite small.M’Kaibi et al. examined the impact of both agriculture
and the environment on food security [45]. We can dothe same by performing a combined inference on levelof local vegetation, use of wild foods, and use of cropsand livestock (Fig. 4(ii)). Both vegetation level and use ofcrops and livestock have little to no impact but holdingthem fixed again allows an impact from use of crops andlivestock (though not so much for the expert elicitednetwork). As we have seen before, this impact is stillnegative for both data-learned networks which perhapslends greater support to our earlier hypothesis of the re-lational direction between food security and use of wildfoods being opposite to that in the models.Finally, Pereira et al. examined the impact of income
on food security [7]. We can look at different incomesources by performing a combined inference on sellingof crops and livestock, child grant status, and employ-ment level (Fig. 4(iii)). As expected from the sensitivityanalysis, child grant status and selling of crops and live-stock have little impact. Therefore, we conclude that ac-tual income is more important to food security thanwelfare or commercial farming, though it is only a
(See figure on previous page.)Fig. 3 Single intervention predictions. Simulations of setting the state of (i) ‘employment level’ (EmL) (ii) ‘socio-economic status’ (SES) (iii) ‘educationlevel’ (EdL) (iv) ‘refugee status’ (RS) (v) ‘use of wild foods’ (UWF) in order to alter32 the probability of a household being food secure (Pr(FS = 0)) on thedifferent possible Agincourt HDSS food security belief networks. a: expert elicited structure; b: data-learned structure. c: data-learned structure with theexpert network as a prior
Eyre et al. BMC Public Health (2021) 21:935 Page 11 of 16
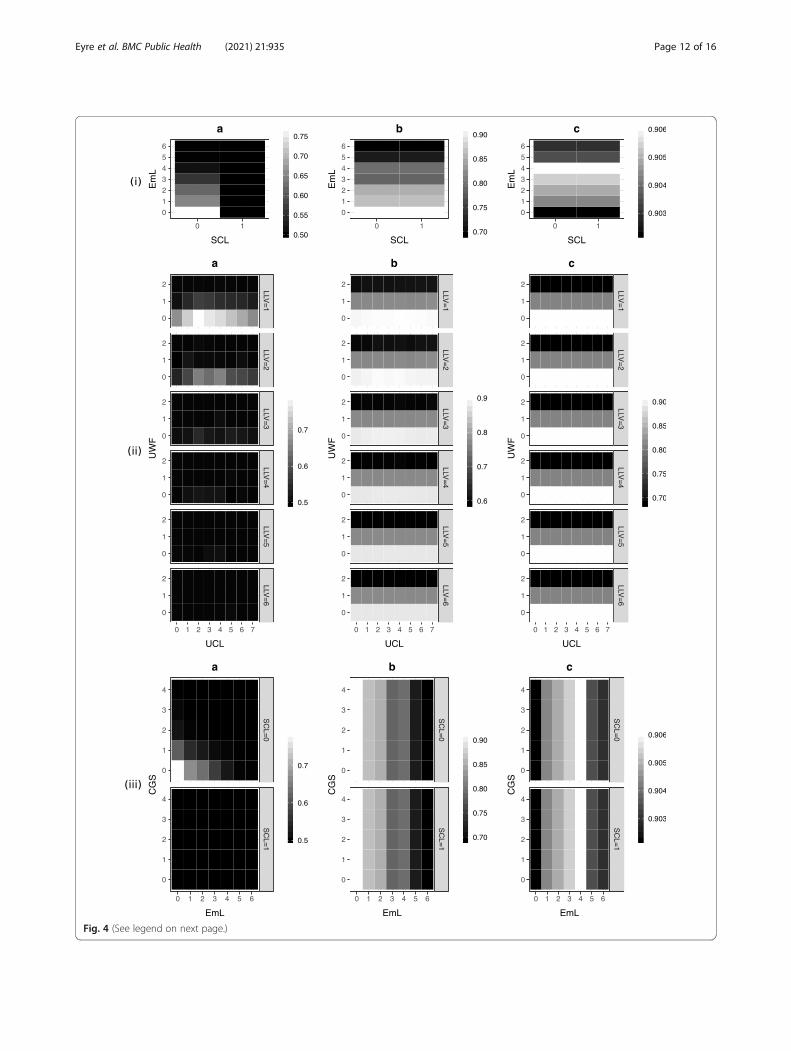
Fig. 4 (See legend on next page.)
Eyre et al. BMC Public Health (2021) 21:935 Page 12 of 16

positive impact for the data-learned network with expertprior again. This implies that it is perhaps the paths go-ing through these other nodes in the network that leadsto the switching of the relationship between employmentand food security to being negative.
DiscussionIn this paper we have considered the building ofthree different potential causal Bayesian belief net-work models of household food security in ruralSouth Africa. Other research in this area has oftenbeen performed using generalised linear models, stat-istical tests, and summary statistics [7–9, 46, 47]. Thishas produced many worthwhile results, but there arelimitations with what can be inferred from, and whatactions can be justified by, these models. The Bayes-ian network models we presented here better reflectthe complexity inherent within the system. This isachieved by the inbuilt modelling of indirect
probabilistic relationships. In this way we end up withmore of a ‘many-to-many’ model rather than the‘many-to-one’ model that linear regression gives us.Accompanied by a causal explanation, this enables usto more effectively model different possible actions,events, and interventions on the system.On top of this better reflection of complexity, network
models also come with a higher level of interpretability.They better reflect what we see in the world around us,where many things cannot be simply considered as hav-ing direct and linear relationships with each other. Theresulting models are therefore much more satisfying inboth their utility and their ability to represent thesystem.Though we were unable to test the causal faithful-
ness of our models to the system, this is a problemthat is shared by all the methods that came before.Our models are still much more suitable for causallymodelling the system, as they have the directionalstructure that is necessary in order to do so [48]. The
(See figure on previous page.)Fig. 4 Multiple / complex intervention predictions. Interventional inference on the impact of (i) both ‘employment level’ (EmL) and ‘selling ofcrops and livestock’ (SCL) simultaneously (ii) ‘level of local vegetation’ (LLV), ‘use of wild foods’ (UWF), and ‘use of crops and livestock’ (UCL) (iii)‘child grant status’ (CGS), ‘employment level’ (EmL), and ‘selling of crops and livestock’ (SCL) on the probability of a household being food secure(Pr(FS = 0)) on the different possible Agincourt HDSS food security belief networks. a: expert elicited structure; b: data-learned structure. c: data-learned structure with the expert network
Table 3 Sensitivity analysis results
a: Expert elicitation b: Data-learned c: Data + expert prior
Variable I I/H S2 I I/H S2 I I/H S2
CGS 0.0099 0.0115 0.0030 0.0000 0.0000 0.0000 0.0002 0.0004 0.0000
EdL 0.0078 0.0091 0.0023 0.0000 0.0000 0.0000 0.0001 0.0001 0.0000
EmL 0.0177 0.0205 0.0052 0.0001 0.0002 0.0000 0.0082 0.0165 0.0013
HHG 0.0000 0.0000 0.0000 0.0002 0.0004 0.0000 0.0000 0.0001 0.0000
LLV 0.0264 0.0307 0.0079 0.0000 0.0000 0.0000 0.0028 0.0056 0.0005
ND 0.0021 0.0025 0.0006 0.0001 0.0001 0.0000 0.0008 0.0016 0.0001
NWAA 0.0007 0.0008 0.0002 0.0007 0.0014 0.0001 0.0005 0.0011 0.0001
RCA 0.0083 0.0097 0.0025 0.0000 0.0001 0.0000 0.0066 0.0133 0.0010
RS 0.0000 0.0000 0.0000 0.0007 0.0016 0.0001 0.0003 0.0005 0.0000
SCL 0.0108 0.0126 0.0034 0.0000 0.0000 0.0000 0.0000 0.0000 0.0000
SES 0.0067 0.0078 0.0020 0.0112 0.0244 0.0014 0.0114 0.0228 0.0017
UCL 0.0039 0.0046 0.0011 0.0011 0.0025 0.0001 0.0008 0.0017 0.0001
UWF 0.0334 0.0388 0.0101 0.0043 0.0093 0.0007 0.0066 0.0133 0.0012
WA 0.0049 0.0056 0.0014 0.0000 0.0000 0.0000 0.0001 0.0003 0.0000
Mutual information reduction I (also divided by food security information H) and expected change of belief S2 for food security given each of the other variablesfor the three different networksCGS child grant status, EdL education level, EmL employment level, FS food security, HHG household head gender, LLV level of local vegetation, ND number ofdependents, NWAA number of working age adults, RCA receipt of communal aid, RS refugee status, SCL selling of crops and livestock, SES socio-economic status,UCL use of crops and livestock, UWF use of wild foods, WA water access
Eyre et al. BMC Public Health (2021) 21:935 Page 13 of 16
lack of such structure undermines the ability to makeany causal inferences from the models of previousstudies. Time could have been incorporated into themodel by designing a dynamic Bayesian network, butdoing so would have severely limited the amount ofdata that could be used to estimate each parameter aswell as requiring the uncertain assumption that causaleffects last over 3 years due to the gap between col-lection of the food security census module. It wouldhave also presented a much greater additional burdento our experts in the elicitation, which we were ex-pressly unable to do due to our limited resources.If the causal interpretation of any one of the three pos-
sible household food security models presented here canbe confirmed, then that model will be a valuable tool indesigning and simulating basic interventions againstfood insecurity in the Agincourt HDSS study area. Inparticular, the model can be evolved via an iterativeprocess of using it to inform intervention trials and thenusing the results of these trials to further develop themodel. Though food insecurity is decreasing in sub-Saharan Africa [4, 49] it is still a great concern of theAgincourt HDSS community, as discovered by our meet-ings with the MRC/Wits-Agincourt Unit CommunityAdvisory Group. Demonstrating actions and improve-ments in this area would obviously be of great import-ance to them, and may therefore further reinforce theirsupport of the research unit (though support is alreadygreat due to the benefits the census already provides thearea). Beyond the Agincourt HDSS study area, themodels could also form the basis for the design of simi-lar models in similar populations across the world.As with all research, this study comes with limita-
tions. The MRC/Wits-Agincourt Unit goes to greatefforts to ensure the reliability of the Agincourt HDSSdata [6].Despite this, there are some errors, misreporting,
and missing data that we are unable to account for.However, the dataset is of a size and quality thatthese do not produce any substantial issues and donot seriously undermine the results presented or thecompleteness of the data in terms of its ability tocover all variables needed to fully causally model thesystem without the need of any latent variables. Thismeans that again the choice of variables is a greatlimitation as it is possible that latent variables mayhave been missed, though this was again mitigated bychoosing the variables in an informed way.In addition, the results from the expert elicitation pro-
duced some very counter intuitive findings. The findingsmay be heavily related to the nature of the experts weused, as our experts were experts in life in the locality.Other studies, such as that of Barons et al., used expertsthat had a greater overview of a wide range of evidence
on the topic in question and great understanding of thatevidence [16]. The benefits of such an approach must betraded off against community involvement in research,but it raises the interesting possible future research areaas to the effect of using different expert groups. Thoughthe results we obtained from our expert elicitations arequite possibly biased by the locality of their knowledge,the community-driven nature of that particular analysiscan still be viewed as a great advantage. It is importantin Public Health, considering the complexity of the sys-tems analysed, the public nature of research funding,and the possibility of biases in our research due to lackof knowledge or perspective, to involve the individualswho our research is based on into that research.Overall, these limitations do not undermine the useful-
ness of developing these models, though do emphasisethe need to perform more research with much greaterresources before the models can be fully put into prac-tise to model interventions.
ConclusionsWe believe that the Bayesian belief network modelsof household food security we presented here canform the basis of the iterative generation of a robustcausal model of household food security in the Agin-court HDSS study area and elsewhere. As there is noestablished test of causal faithfulness beyond experi-mentation, the models can be used to inform possibleinterventional studies that could then be used to fur-ther develop the model and so on. In addition, it ispossible that methods of testing causal faithfulnessfrom observational data could be explored, but thiscomes with obvious limitations. An alternative to ex-perimentation would be to use further expert elicita-tions. Another way to improve the causal applicabilityof the methods would be to develop them into dy-namic Bayesian networks that include temporal rela-tionships, which would also require further resourcesin terms of data and expert elicitations. Beyond thefurther development of these models, they can alsoform the basis of developing similar models of house-hold food security for other populations.
AbbreviationsHDSS: Health and socio-demographic surveillance system; BBN: Bayesianbelief network; DAG: Directed acyclic graph; CAG: Community advisorygroup; CPT: Conditional probability table; LS: Lauritzen-Spiegelhalteralgorithm; NDVI: Normalised difference vegetation index; MMPC: Max-minparents and children; BIC: Bayesian information criterion; MAP: Maximum aposteriori; CGS: Child grant status; EdL: Education level; EmL: Employmentlevel; HHG: Household head gender; LLV: Level of local vegetation;ND: Number of dependants; NWAA: Number of working age adults;RCA: Receipt of communal aid; RS: Refugee status; SCL: Selling of crops andlivestock; SES: Socio-economic status; UCL: Use of crops and livestock;UWF: Use of wild foods; WA: Water access
Eyre et al. BMC Public Health (2021) 21:935 Page 14 of 16
Supplementary InformationThe online version contains supplementary material available at https://doi.org/10.1186/s12889-021-10938-y.
Additional file 1. Bayesian belief network modelling of household foodsecurity in rural South Africa - supplementary material. Further details onthe variable selection literature search, as well as further results for boththe simulations of established food security interventions and theinterventional inferences.
AcknowledgementsThe authors gratefully acknowledge the Medical Research Council/WitsUniversity Rural Public Health and Health Transitions Research Unit DataSection team for providing the data, and to the Land Process DistributedActive Archive Center for making available the MODIS/Terra sensor satelliteimage dataset. Thanks also goes to the Public Engagement Office of theMRC/Wits-Agincourt Unit for organising the initial meeting with members ofMRC/Wits-Agincourt Unit Community Advisory Group, and for performingthe two expert elicitations following guidance by the authors. Finally, thanksmust also go to the members of the MRC/Wits-Agincourt Unit CommunityAdvisory Group, including George Shabangu, Ralbon Godi, Polite Zitha,Happy Mnisi, Aubrey Nkuna, Sibangile Khosa, and Busi Mdluli for coming tothe initial meeting and fulfilling the role of experts in the first elicitation, andBetty Masinga, Thelma Nyathi, Thandiwe Whati, Aubrey Nkuna, Happy Mnisi,Larry Mzimba, Glory Khoza, and Monical Khosa for fulfilling the role ofexperts in the second elicitation.
Authors’ contributionsRE performed the data analysis and prepared the manuscript. FG, TH, andXGO contributed to the development of the research question, securing thedata, advising on the analysis, and editing the manuscript. All authors readand approved the final manuscript. The research presented in the paperformed part of: Eyre, Robert W. (2018) Complex statistical modelling of socio-economic variables in public health. PhD thesis, University of Warwick,available at: http://wrap.warwick.ac.uk/106563/. PhD supervisors FG, TH andXGO.
FundingRE was supported by the Engineering and Physical Sciences ResearchCouncil (grant EP/I01358X/1) whilst working on this manuscript at the Centrefor Complexity Science in the University of Warwick, followed by a salaryfrom Spectra Analytics, a data analysis company. TH was supported by theEngineering and Physical Sciences Research Council (grant EP/N033701/1).These funders had no role in the development of the research question,securing and analysis of the data, decision to publish, or preparation of themanuscript.
Availability of data and materialsThe data that support the findings of this study are available from theMedical Research Council/Wits University Rural Public Health and HealthTransitions Research Unit but restrictions apply to the availability of thesedata, which were used under license for the current study, and so are notpublicly available. Data are however available from the authors uponreasonable request and with permission of the Medical Research Council/Wits University Rural Public Health and Health Transitions Research Unit. TheMOD13Q1: MODIS/Terra Vegetation Indices 16-Day L3 Global 250 m SIN GridV006 data was retrieved from the online Data Pool, courtesy of the NASAEOSDIS Land Processes Distributed Active Archive Center (LP DAAC), USGS/Earth Resources Observation and Science (EROS) Center, Sioux Falls, SouthDakota, https://doi.org/10.5067/modis/mod13q1.006.
Declarations
Ethics approval and consent to participateAll census activities have carried an unconditional ethical clearance since1996 from the University of the Witwatersrand’s Committee for Research onHuman Subjects (Medical). This ethical clearance (protocol M960720) wasrenewed in 2011 (protocol M110138). Data from the Agincourt Health andSocio-demographic Surveillance System study was used with permission ofthe Medical Research Council/Wits University Rural Public Health and Health
Transitions Research Unit. The MOD13Q1: MODIS/Terra Vegetation Indices16-Day L3 Global 250 m SIN Grid V006 data is available openly online viahttps://doi.org/10.5067/modis/mod13q1.006.
Consent for publicationNot applicable.
Competing interestsThe authors declare that they have no competing interests.
Author details1Spectra Analytics, 70 Gracechurch Street, London EC3V 0HR, UK.2Department of Mathematics, University of Manchester, Oxford Road,Manchester M13 9PL, UK. 3Medical Research Council/Wits University RuralPublic Health and Health Transitions Research Unit (Agincourt), School ofPublic Health, Faculty of Health Sciences, University of the Witwatersrand,Johannesburg, South Africa. 4Warwick Medical School, University of Warwick,Coventry CV4 7AL, UK. 5University of the Witwatersrand, Johannesburg,South Africa.
Received: 9 March 2020 Accepted: 28 April 2021
References1. Food and Agriculture Organization of the United Nations. Food security:
policy brief. 2006.2. Devereux S. Food insecurity and famine. Handbook of African Development,
165; 2018.3. Rose D, Charlton KE. Prevalence of household food poverty in South Africa:
results from a large, nationally representative survey. Public Health Nutr.2002;5(3):383–9. https://doi.org/10.1079/PHN2001320.
4. Labadarios D, Mchiza ZJ-R, Steyn NP, Gericke G, Maunder EMW, Davids YD,et al. Food security in South Africa: a review of national surveys. Bull WorldHealth Organ. 2011;89(12):891–9. https://doi.org/10.2471/BLT.11.089243.
5. Kahn K, Tollman SM, Collinson MA, Clark SJ, Twine R, Clark BD, et al.Research into health, population and social transitions in rural South Africa:data and methods of the Agincourt health and demographic surveillancesystem. Scand J Public Health. 2007;35(69 12 suppl):8–20.
6. Kahn K, Collinson MA, Gómez-Olivé FX, Mokoena O, Twine R, Mee P, et al.Profile: Agincourt health and socio-demographic surveillance system. Int JEpidemiol. 2012;41(4):988–1001. https://doi.org/10.1093/ije/dys115.
7. Pereira LM, Cuneo CN, Twine WC. Food and cash: understanding the role ofthe retail sector in rural food security in South Africa. Food security. 2014;6(3):339–57. https://doi.org/10.1007/s12571-014-0349-1.
8. Kirkland TM, Kemp RJ, Hunter LM, Twine WM. Toward improvedunderstanding of food security: a methodological examination based inrural South Africa. Food Cult Soc. 2013;16(1):65–84. https://doi.org/10.2752/175174413X13500468045407.
9. Nawrotzki RJ, Robson K, Gutilla MJ, Hunter LM, Twine W, Norlund P.Exploring the impact of the 2008 global food crisis on food security amongvulnerable households in rural South Africa. Food Secur. 2014;6(2):283–97.https://doi.org/10.1007/s12571-014-0336-6.
10. Pearl J. Graphical models for probabilistic and causal reasoning. In:Computing handbook, 3rd Edition: computer science and softwareengineering, volume I; 2013. p. 1–29.
11. Koumenides CL, Shadbolt NR. Combining link and content-basedinformation in a bayesian inference model for entity search. In: Proceedingsof the 1st joint international workshop on entity-oriented and semantic 2526 search: ACM; 2012. p. 3.
12. de Campos LM, Fernández-Luna JM, Huete JF. Bayesian networks andinformation retrieval: an introduction to the special issue. Inf Process Manag.2004;40(5):727–33.
13. Friedman N, Linial M, Nachman I, Pe’er D. Using bayesian networks toanalyze expression data. J Comp Biol. 2000;7(3–4):601–20. https://doi.org/10.1089/106652700750050961.
14. Jiang X, Cooper GF. A bayesian spatio-temporal method for diseaseoutbreak detection. J Am Med Inform Assoc. 2010;17(4):462–71. https://doi.org/10.1136/jamia.2009.000356.
15. Weiss Y, Campus GR, Pearl J. Belief propagation–perspectives. CommunACM. 2010;53(1).
Eyre et al. BMC Public Health (2021) 21:935 Page 15 of 16
16. Barons, M., Zhong, X., Smith, J.: Dynamic bayesian networks for decisionsupport and sugar food security. CRiSM Rep. 2014. https://warwick.ac.uk/fac/sci/statistics/crism/research/paper14-18/14-18w.pdf.
17. Murphy KP. Machine learning: a probabilistic perspective. Cambridge: MITpress; 2012.
18. Korb KB, Nicholson AE. Bayesian Artificial Intelligence. Boca Raton: Chapman& Hall/CRC; 2003. https://doi.org/10.1201/9780203491294.
19. Koller D, Friedman N. Probabilistic graphical models: principles andtechniques. Cambridge: MIT press; 2009.
20. Lauritzen SL, Spiegelhalter DJ. Local computations with probabilities ongraphical structures and their application to expert systems. J Roy Stat SocB. 1988:157–224.
21. Højsgaard S. Graphical independence networks with the grain package for r.J Stat Softw. 2012;46(10):1–26.
22. Smith JQ. 7. Bayesian decision analysis: principles and practice. Cambridge:Cambridge University Press; 2010.
23. Tucker CJ. Red and photographic infrared linear combinations formonitoring vegetation. Remote Sens Environ. 1979;8(2):127–50. https://doi.org/10.1016/0034-4257(79)90013-0.
24. Didan, K. MOD13Q1 MODIS/Terra vegetation indices 16-day L3 global 250mSIN grid V006. 2015. https://doi.org/10.5067/modis/mod13q1.006. Accessed:31 Jan 2017.
25. Tsamardinos I, Aliferis CF, Statnikov A. Time and sample efficient discoveryof markov blankets and direct causal relations. In: Proceedings of the 9thACM SIGKDD international conference on knowledge discovery and datamining: ACM; 2003. p. 673–8.
26. Tsamardinos I, Brown LE, Aliferis CF. The max-min hill-climbing bayesiannetwork structure learning algorithm. Mach Learn. 2006;65(1):31–78. https://doi.org/10.1007/s10994-006-6889-7.
27. Jonckheere AR. A distribution-free k-sample test against orderedalternatives. Biometrika. 1954;41(1/2):133–45. https://doi.org/10.1093/biomet/41.1-2.133.
28. Schwarz G, et al. Estimating the dimension of a model. Ann Stat. 1978;2:461–4.
29. Good IJ. Rational decisions. J Roy Stat Soc B. 1952;14(1):107–14.30. Hope LR, Korb KB. A bayesian metric for evaluating machine learning
algorithms. In: Australian conference on artificial intelligence: Springer; 2004.p. 991–7.
31. Helen Keller International. Homestead food production model contributesto improved household food security, nutrition and female empowerment–experience from scaling-up programs in Asia (Bangladesh, Cambodia, Nepaland Philippines). Nutr Bull. 2010;8(1).
32. Bushamuka VN, de Pee S, Talukder A, Kiess L, Panagides D, Taher A, et al.Impact of a homestead gardening program on household food securityand empowerment of women in Bangladesh. Food Nutr Bull. 2005;26(1):17–25. https://doi.org/10.1177/156482650502600102.
33. Galhena DH, Freed R, Maredia KM. Home gardens: a promising approach toenhance household food security and wellbeing. Agric Food Secur. 2013;2(1):8. https://doi.org/10.1186/2048-7010-2-8.
34. Gaihre S, Kyle J, Semple S, Smith J, Subedi M, Marais D. Type and extent oftrans-disciplinary co-operation to improve food security, health andhousehold environment in low and middle income countries: systematicreview. BMC Public Health. 2016;16(1):1093. https://doi.org/10.1186/s12889-016-3731-4.
35. Rose DD. Interventions to reduce household food insecurity: a synthesis ofcurrent concepts and approaches for Latin America. Rev Nutr. 2008;21:159–73.
36. Nsabuwera V, Hedt-Gauthier B, Khogali M, Edginton M, Hinderaker SG,Nisingizwe MP, et al. Making progress towards food security: evidence froman intervention in three rural districts of Rwanda. Public Health Nutr. 2016;19(07):1296–304. https://doi.org/10.1017/S1368980015002207.
37. Faber M, Witten C, Drimie S. Community-based agricultural interventions inthe context of food and nutrition security in South Africa. S Afr J Clin Nutr.2011;24(1):21–30. https://doi.org/10.1080/16070658.2011.11734346.
38. Coll-Black S, Gilligan DO, Hoddinott J, Kumar N, Wiseman W. Targeting foodsecurity interventions in Ethiopia: the productive safety net. Food AgricEthiop. 2012;74:280.
39. Stewart R, van Rooyen C, Dickson K, Majoro M, de Wet T. What is theimpact of microfinance on poor people?: a systematic review of evidencefrom sub-Saharan Africa: EPPI-Centre, Social Science Research Unit, Instituteof Education, University of London; 2010.
40. Van Rooyen C, Stewart R, De Wet T. The impact of microfinance in sub-Saharan Africa: a systematic review of the evidence. World Dev. 2012;40(11):2249–62. https://doi.org/10.1016/j.worlddev.2012.03.012.
41. Leyna G, Mnyika K, Mmbaga E, Hussain A, Klouman E, Holm-Hansen C, et al.Food insufficiency in rural Kilimanjaro, Tanzania. East Afr Med J. 2007;84(4):163–71. https://doi.org/10.4314/eamj.v84i4.9520.
42. Kaschula S. Using people to cope with the hunger: social networks andfood transfers amongst HIV/AIDS afflicted households in Kwazulu-Natal,South Africa. AIDS Behav. 2011;15(7):1490–502. https://doi.org/10.1007/s10461-011-0006-z.
43. Dovie DB, Shackleton CM, Witkowski E. Conceptualizing the human use of wildedible herbs for conservation in south African communal areas. J EnvironManag. 2007;84(2):146–56. https://doi.org/10.1016/j.jenvman.2006.05.017.
44. Mabuza ML, Ortmann GF, Wale E, Mutenje MJ. The effect of major incomesources on rural household food (in)security: evidence from Swaziland andimplications for policy. Ecol Food Nutr. 2016;55(2):209–30. https://doi.org/10.1080/03670244.2015.1121482.
45. M’Kaibi FK, Steyn NP, Ochola S, Du Plessis L. Effects of agriculturalbiodiversity and seasonal rain on dietary adequacy and household foodsecurity in rural areas of Kenya. BMC Public Health. 2015;15(1):422. https://doi.org/10.1186/s12889-015-1755-9.
46. Twine W, Hunter LM. Adult mortality and household food security in ruralSouth Africa: does aids represent a unique mortality shock? Dev South Afr.2011;28(4):431–44. https://doi.org/10.1080/0376835X.2011.605559.
47. Hunter LM, Twine W, Patterson L. “Locusts are now our beef”: adultmortality and household dietary use of local environmental resources inrural South Africa. Scand J Public Health. 2007;35(69 suppl):165–74.
48. Pearl J. Causal inference in statistics: an overview. Stat Surv. 2009;3:96–146.49. Rosen S, Meade B, Fuglie K, Rada N. International food security assessment,
2014-2024. Econ Res. 2016;2014:2024.
Publisher’s NoteSpringer Nature remains neutral with regard to jurisdictional claims inpublished maps and institutional affiliations.
Eyre et al. BMC Public Health (2021) 21:935 Page 16 of 16