Bayer Cropscience - initiating...
35
Edelweiss Research is also available on www.edelresearch.com, Bloomberg EDEL <GO>, Thomson First Call, Reuters and Factset. Edelweiss Securities Limited Bayer Cropscience (Bayer), by virtue of a dominant 50% share in hybrid rice seeds and 15% share in agrochemicals, is the domestic market leader. A comprehensive distribution network, branded portfolio, launch of innovative products and parent’s (Bayer AG) R&D capabilities effectively anchor the company to outpace the Indian agrochemical and seed markets. These attributes equip it to post sales and PAT CAGR of 15.8% and 21.4% in FY13-16E (FY08-13 CAGR of 17.0% and 34.5%), respectively. We expect it to generate free cash flow of INR8bn over FY14-16E and augment FY13 net cash/share by 1.6x to INR425 (~26% of current market price). Hence, we initiate coverage with ‘BUY’. Innovative product launches to spur market share Bayer has chalked out an ambitious strategy to introduce two-three innovative products annually on back of robust R&D capabilities of its parent, Bayer AG. This, coupled with a comprehensive distribution network and robust brand recall (40,000 dealers and reach to ~3mn farmers) will facilitate market share gain. Ergo, we expect the company’s domestic agrochemical business to post 17.4% CAGR over FY13-16E (FY08-13 CAGR: 15.6%), outpacing the anticipated industry growth of 10-12%. Sowing seeds of a rich harvest In India, an abysmal 2mha of the total 40mha rice crop is under hybrid seed. Bayer, besides an emphatic 50% market share in hybrid rice seed, has a formidable presence in cotton, pearl millet, corn, sorghum and mustard as well. Moreover, on the anvil is launch of 13-14 hybrid seed products over the next three years. Hence, we estimate 20.7% CAGR in seed business over FY13-16E (FY08-13 CAGR: 18.2%) versus estimated industry growth of 12-15%. Outlook and valuations: Prime potential; initiating with ‘BUY’ Rich product mix, innovative products and superior operating leverage will spur Bayer’s EBITDA margin. The company boasts of robust earnings growth trajectory, debt-free balance sheet and strong cash flow with healthy RoE (ex cash: 25-30%). We have not considered recent announcement of share buyback nor the sale of Ankaleshwar plant in our estimates. We value it at P/E of 20x FY15E and initiate coverage with ‘BUY’ recommendation. INITIATING COVERAGE BAYER CROPSCIENCE Seeding Growth EDELWEISS RATINGS Absolute Rating BUY Investment Characteristics Growth MARKET DATA (R: BAYE .BO, B: BYRCS IN) CMP : INR 1,610 Target Price : INR 1,968 52-week range (INR) : 1,789/1,040 Share in issue (mn) : 39.5 M cap (INR bn/USD mn) : 63.6 /1,060 Avg. Daily Vol. BSE/NSE (‘000) : 21.9 SHARE HOLDING PATTERN (%) Current Q1FY14 Q4FY13 Promoters * 71.1 71.1 71.1 MF's, FI's & BKs 10.9 11.6 11.7 FII's 6.9 5.3 4.7 Others 11.1 12.0 12.5 * Promoters pledged shares (% of share in issue) : NIL PRICE PERFORMANCE (%) Sensex Stock Stock over Sensex 1 month 1.1 4.6 3.4 3 months 3.6 (7.1) (10.8) 12 months 11.8 50.6 38.9 Manish Mahawar +91 22 6623 3481 [email protected] Manoj Bahety, CFA +91 22 6623 3362 [email protected] India Equity Research| Agriculture October 21, 2013 Financials Year to March FY13 FY14E FY15E FY16E Net revenues (INR mn) 27,253 31,196 36,428 42,296 EBITDA (INR mn) 3,456 3,909 4,932 5,923 Core profit (INR mn) 2,650 3,094 3,887 4,743 Diluted shares (mn) 40 40 40 40 EPS (INR) 67.1 78.3 98.4 120.1 P/E (x) 23.8 20.4 16.3 13.3 EV/EBITDA (x) 14.7 12.6 9.6 7.4 ROAE (%) 19.5 14.9 16.3 17.0 (Click on image to view video)
-
Upload
nguyennguyet -
Category
Documents
-
view
219 -
download
5
Transcript of Bayer Cropscience - initiating...

Edelweiss Research is also available on www.edelresearch.com, Bloomberg EDEL <GO>, Thomson First Call, Reuters and Factset. Edelweiss Securities Limited
Bayer Cropscience (Bayer), by virtue of a dominant 50% share in hybrid rice seeds and 15% share in agrochemicals, is the domestic market leader. A comprehensive distribution network, branded portfolio, launch of innovative products and parent’s (Bayer AG) R&D capabilities effectively anchor the company to outpace the Indian agrochemical and seed markets. These attributes equip it to post sales and PAT CAGR of 15.8% and 21.4% in FY13-16E (FY08-13 CAGR of 17.0% and 34.5%), respectively. We expect it to generate free cash flow of INR8bn over FY14-16E and augment FY13 net cash/share by 1.6x to INR425 (~26% of current market price). Hence, we initiate coverage with ‘BUY’.
Innovative product launches to spur market share Bayer has chalked out an ambitious strategy to introduce two-three innovative products annually on back of robust R&D capabilities of its parent, Bayer AG. This, coupled with a comprehensive distribution network and robust brand recall (40,000 dealers and reach to ~3mn farmers) will facilitate market share gain. Ergo, we expect the company’s domestic agrochemical business to post 17.4% CAGR over FY13-16E (FY08-13 CAGR: 15.6%), outpacing the anticipated industry growth of 10-12%.
Sowing seeds of a rich harvest
In India, an abysmal 2mha of the total 40mha rice crop is under hybrid seed. Bayer, besides an emphatic 50% market share in hybrid rice seed, has a formidable presence in cotton, pearl millet, corn, sorghum and mustard as well. Moreover, on the anvil is launch of 13-14 hybrid seed products over the next three years. Hence, we estimate 20.7% CAGR in seed business over FY13-16E (FY08-13 CAGR: 18.2%) versus estimated industry growth of 12-15%.
Outlook and valuations: Prime potential; initiating with ‘BUY’ Rich product mix, innovative products and superior operating leverage will spur Bayer’s EBITDA margin. The company boasts of robust earnings growth trajectory, debt-free balance sheet and strong cash flow with healthy RoE (ex cash: 25-30%). We have not considered recent announcement of share buyback nor the sale of Ankaleshwar plant in our estimates. We value it at P/E of 20x FY15E and initiate coverage with ‘BUY’ recommendation.
INITIATING COVERAGE
BAYER CROPSCIENCESeeding Growth
EDELWEISS RATINGS
Absolute Rating BUY
Investment Characteristics Growth
MARKET DATA (R: BAYE .BO, B: BYRCS IN)
CMP : INR 1,610
Target Price : INR 1,968
52-week range (INR) : 1,789/1,040
Share in issue (mn) : 39.5
M cap (INR bn/USD mn) : 63.6 /1,060
Avg. Daily Vol. BSE/NSE (‘000) : 21.9
SHARE HOLDING PATTERN (%)
Current Q1FY14 Q4FY13
Promoters * 71.1 71.1 71.1
MF's, FI's & BKs 10.9 11.6 11.7
FII's 6.9 5.3 4.7
Others 11.1 12.0 12.5 * Promoters pledged shares (% of share in issue)
: NIL
PRICE PERFORMANCE (%)
Sensex Stock
Stock over Sensex
1 month 1.1 4.6 3.4
3 months 3.6 (7.1) (10.8)
12 months 11.8 50.6 38.9
Manish Mahawar +91 22 6623 3481 [email protected] Manoj Bahety, CFA +91 22 6623 3362 [email protected]
India Equity Research| Agriculture
October 21, 2013
FinancialsYear to March FY13 FY14E FY15E FY16ENet revenues (INR mn) 27,253 31,196 36,428 42,296 EBITDA (INR mn) 3,456 3,909 4,932 5,923 Core profit (INR mn) 2,650 3,094 3,887 4,743 Diluted shares (mn) 40 40 40 40 EPS (INR) 67.1 78.3 98.4 120.1 P/E (x) 23.8 20.4 16.3 13.3 EV/EBITDA (x) 14.7 12.6 9.6 7.4 ROAE (%) 19.5 14.9 16.3 17.0
(Click on image to view video)

Agriculture
2 Edelweiss Securities Limited
Investment Rationale
Market leader with wide distribution network Increasing food consumption, rising minimum support price, sharpened government focus and mounting cost of labour are set to propel the domestic agrochemical market to post 10-12% CAGR in the near term. Bayer, with domestic market share of 15%, is well placed to capture emerging opportunities in the Indian agrochemical market leveraging its comprehensive distribution network, branded portfolio and launch of innovative products. The company is equipped with the widest distribution network of 40,000 dealers and reaches about 3mn farmers in India. It has 3,500 sales managers and field advisors. It competes with Syngenta (12% market share) and Rallis India (10% market share), the other key players in India; United Phosphorus, PI Industries, Dhanuka Agritech etc., are other competitors.
Innovative product launches to spur market share Bayer is registering and launching innovative agrochemical products on a continuous basis. The company has a strategy to introduce two-three innovative products annually on the back of robust R&D capabilities of its parent, Bayer AG. We believe innovative product launches coupled with a wide distribution reach and strong brand recall will facilitate market share gain, going forward. Bayer is planning to launch six-eight agrochemical products over the next three years. During FY14, the company is expected to get approval and launch two globally renowned agrochemical products i.e.,
1) Insecticide for the sugarcane crop.
2) Seed treatment product for wheat crop. Bayer is a leading innovation-driven company and 16% of its FY13 products are patented; balance products are off patented. However, it caters to only branded products. Chart 1: Innovative product launches to drive growth
Source: Company, Edelweiss research
1
3
4
6
7
9
FY08 FY09 FY10 FY11 FY12 FY14E
(Nos
.)
Bayer is well-placed to capture emerging opportunities in the Indian agrochemical market given its healthy distribution network, branded portfolio and launch of innovative products
The company has a strategy to introduce two-three innovative products annually on the back of robust R&D capabilities of its parent Bayer AG
The company is expected to launch six-eight agrochemical products over the next three years
Bayer Cropscience
3 Edelweiss Securities Limited
12% of Bayer’s FY13 sales are from products launched over the past five years. Its top five products (including seeds) contribute 30% to FY13 sales.
Table 1: Some key agrochemical products launched over past five years
Source: Company, Edelweiss research
Bayer’s brands command a significant pricing power over competition. The price difference between the company’s and competition’s products is almost 100% in a few cases. Table 2: Bayer commands pricing power (INR)
Source: Industry, Edelweiss research
Note: Above analysis on grape crop based on our channel checks.
*Technical of Dupont's Coragen is Chlorantraniliprole. However, it competes with flubendiamide. Based on our channel checks, below are Bayer’s top 10 agrochemical products. Of these, Fame (Flubendiamide 480SC) and Confidor/Confidor super (Imidacloprid) have sales above INR1bn each.
Products Category Crops DiseaseSectin Fungicide Potato, Grape Late blight and downy mildewOberon Insecticide Brinjal, Apple, Chill i , Tea, Okra Red sider mite, european red mite, Yellow miteJump Insecticide Rice Stem borer, leaf folderConfidor Super Insecticide
Cotton & RiceJassids, aphids, thrips, brown plant hopper, white backed plant hopper
Ricestar Herbicide Rice Echinocloa spp.Nativo Fungicide
RiceSheath blight, leaf blast & neck blast, glume discolouration (dirty panicle)
Glamore Insecticide Rice Brown plant hoppers and white backed plant hoppers Accord Plus Herbicide Wheat Phalaris minor and broad leaf weeds.Solitude Fungicide Soyabean Rids weeds
Technical - Imidacloprid MRP/Litre Dose/Acre Cost/AcreBayer - Confidor/Confidor Super 2,400 250ml 600 Rall is - Tata Mida 1,800 250ml 450 PI Industries - Jumbo 1,300 250ml 325
Technical - Flubendiamide MRP/100ml Dose/Acre Cost/AcreBayer - Fame 1,800 50ml 900 Dupont - Coragen* 1,800 60ml 1,080 Rall is - Takumi 800 100ml 800 PI Industries - Fluton 765 100ml 765
Bayer’s brands command a significant pricing power over competition
Bayer has multiple products with sales in each product exceeding INR1bn
Agriculture
4 Edelweiss Securities Limited
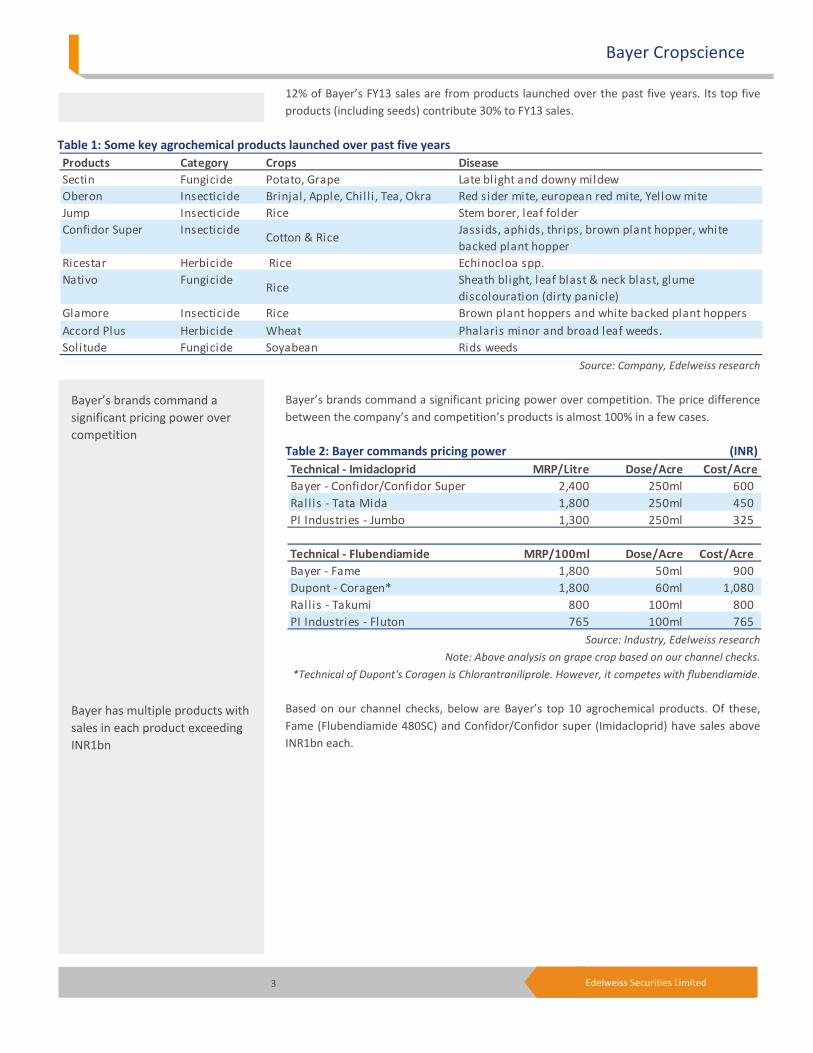
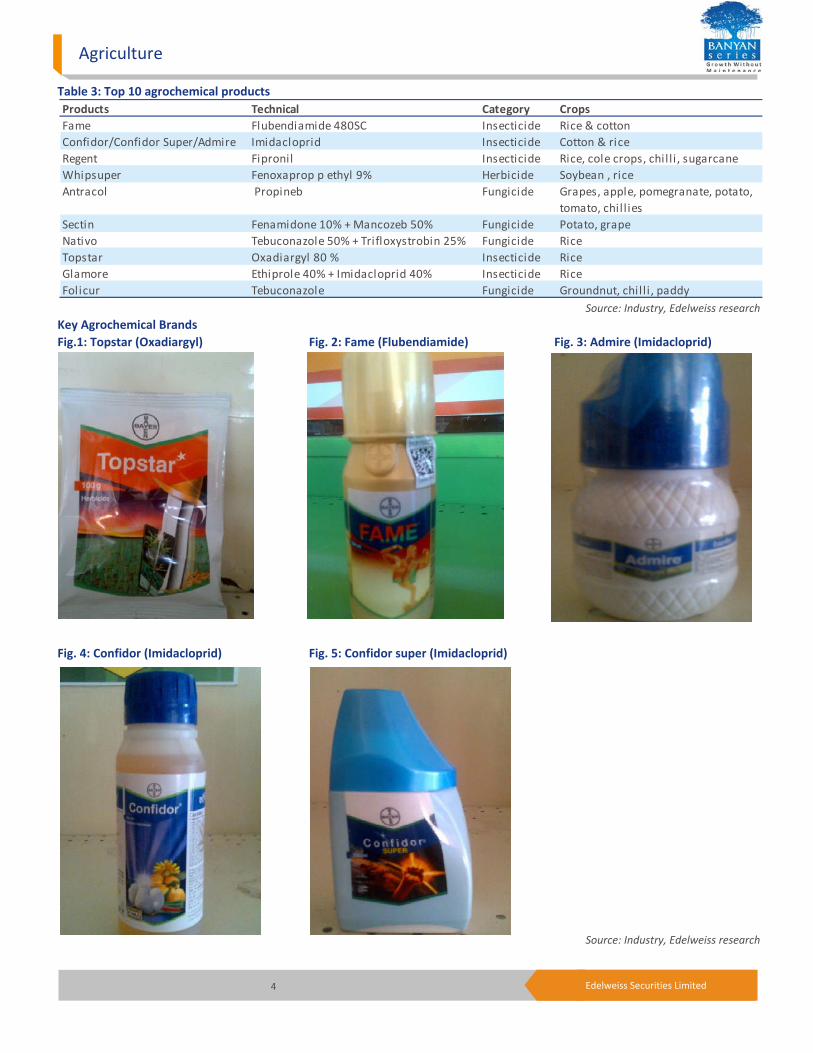
Table 3: Top 10 agrochemical products
Source: Industry, Edelweiss research
Key Agrochemical Brands Fig.1: Topstar (Oxadiargyl) Fig. 2: Fame (Flubendiamide) Fig. 3: Admire (Imidacloprid)
Fig. 4: Confidor (Imidacloprid) Fig. 5: Confidor super (Imidacloprid)
Source: Industry, Edelweiss research
Products Technical Category CropsFame Flubendiamide 480SC Insecticide Rice & cottonConfidor/Confidor Super/Admire Imidacloprid Insecticide Cotton & riceRegent Fipronil Insecticide Rice, cole crops, chil l i , sugarcaneWhipsuper Fenoxaprop p ethyl 9% Herbicide Soybean , riceAntracol Propineb Fungicide Grapes, apple, pomegranate, potato,
tomato, chil l iesSectin Fenamidone 10% + Mancozeb 50% Fungicide Potato, grapeNativo Tebuconazole 50% + Trifloxystrobin 25% Fungicide RiceTopstar Oxadiargyl 80 % Insecticide RiceGlamore Ethiprole 40% + Imidacloprid 40% Insecticide RiceFolicur Tebuconazole Fungicide Groundnut, chil l i , paddy

Bayer Cropscience
5 Edelweiss Securities Limited
Agrochemical business expected to outstrip industry Bayer’s agrochemicals sales have posted FY08-13 CAGR of 19.4% contributed by both formulation (FY08-13 CAGR of 15.2%) and active ingredients (FY08-13 CAGR of 34.7%). Further, sales were also driven by domestic as well as export markets, which posted FY08-13 CAGR of 15.6% and 23.3%, respectively. The company has proactively phased out WHO class 1 (toxic) products in FY11 which were contributing sales of INR1bn/p.a. This resulted in single digit growth in agrochemical sales during FY12.
On a conservative basis, we have assumed domestic agrochemical sales CAGR of 17.4% over FY13-16 versus expected industry CAGR of 10-12% supported by better monsoon and pricing environment in FY14.
Chart 2: Agrochemical business continues to outperform
Source: Company, Edelweiss research
Seeds business to spur growth Bayer is primarily a seed distribution arm and sources 100% seeds from its group company Bayer BioScience India (BBS). BBS is a forerunner in seed business in India. Located in Hyderabad, it is engaged in research, development, production and marketing of high quality hybrid seeds for field crops. To cater to the specific needs of farmers, BBS’ hybrid seeds offer a wide product range covering hybrid rice, cotton, pearl millet, corn, grain sorghum and mustard. Indian seed market is expected to post 12-15% CAGR in the coming years. India has a dismal 2mha of the total 40mha under hybrid seed in rice crop, thus leaving enough room for penetrating untapped markets. According to our channel checks, Bayer has ~50% market share in hybrid rice seeds and we believe that it is well equipped to ride this surge on back of product launches and healthy distribution network. The company’s key competitors in the seed business are Pioneer (Syngenta), JK Agri, Rallis India, Kaveri Seeds, Ankur seeds, Rashi seeds, among others.
0.0
9.0
18.0
27.0
36.0
45.0
5,000
12,000
19,000
26,000
33,000
40,000
FY09 FY10 FY11 FY12 FY13 FY14E FY15E FY16E
(%)
(INR
mn)
Formulation sales Active ingredients Growth (%)
We have assumed domestic agrochemical sales CAGR of 17.4% over FY13-16 supported by better monsoon and pricing environment in FY14
The company is planning to launch 13-14 hybrid seed products over the next three years

Agriculture
6 Edelweiss Securities Limited
Bayer has chalked out a strategy to introduce new products annually on back of robust R&D capabilities of its parent, Bayer AG. The company is planning to launch 13-14 hybrid seed products over the next three years. It is expected to launch five seed products during FY14. Chart 3: Seed products launched
Source: Company, Edelweiss research
Table 4: Some of the key seed products launched over past five years
Source: Company, Edelweiss research
Bayer’s seed sales have posted 18.2% CAGR over FY08-13. It is worth highlighting that the company has launched five products in FY13 and is expected to launch further five in FY14E versus 14 over FY08-12. Hence, we have assumed seed sales CAGR of 20.7% over FY13-16E versus expected domestic industry CAGR of 12-15% as we believe that the recent product launches will drive near-term growth.
1
2
3
4
5
6
FY08 FY09 FY10 FY11 FY12 FY13 FY14E
(Nos
.)
Products Crops DescriptionArize Dhani Rice World's first hybrid rice variety resistant to the dreaded disease - bacterial leaf blightSurpass Goldmine Bt Cotton India's high performing Bt cotton hybridArize Swift Rice Short duration hybrid that assures heavy weight grain and high yieldSurpass Aasha Cotton High yielding hybrid of cotton seedArize 6444 Gold Rice Hybrid for protection against bacterial leaf blightSurpass SP 7007 Cotton High yielder hybrid with wider adaptability in North IndiaProagro 9450 Millet Higher yielding, lodging and Downy Mildew (DM) disease tolerant Proagro 5121 Mustard Hybrid Seed with higher yield potential and better oil contentArize 6129 Gold Rice Short duration hybrid seed to combat bacterial leaf blightProagro 7701 Gold MIllet Hybrid seed offering heat and lodging tolerance with high grain yieldProagro 9444 Gold Millet Hybrid seed offering heat and lodging and disease toleranceSurpass - First Class Cotton High yielding hybrid with wider adaptability and better yield stabil ity
The company has launched five seed products in FY13 and is expected to launch another five in FY14E versus 14 over FY08-12

Bayer Cropscience
7 Edelweiss Securities Limited
Chart 4: Under penetrated hybrid rice seed and product launches to drive growth
Source: Company, Edelweiss research
Bayer AG targeting Indian sales of EUR1bn by 2015 Bayer AG, Bayer’s parent, is targeting sales of EUR1bn by 2015 from its Indian operations (crop science, material science, healthcare) primarily on account of better availability of its products in India. Crop science, material science and healthcare business verticals will contribute to 60%, 30% and 10%, respectively to the sales target. Considering the parent’s aim, Bayer is targeting sales of INR50bn (60% of EUR1bn) based on present EUR/INR of 83.50 in 2015 (FY13-16 CAGR of 22.4%) versus our estimate of INR42.3bn in FY16 (FY13-16 CAGR of 15.8%).
8.0
12.8
17.6
22.4
27.2
32.0
1,500
2,900
4,300
5,700
7,100
8,500
FY09 FY10 FY11 FY12 FY13 FY14E FY15E FY16E
(%)
(INR
mn)
Sales (INR mn) Growth (%)
Bayer AG, Bayer’s parent, is targeting sales of EUR1bn by 2015 from its Indian operations
Agriculture
8 Edelweiss Securities Limited
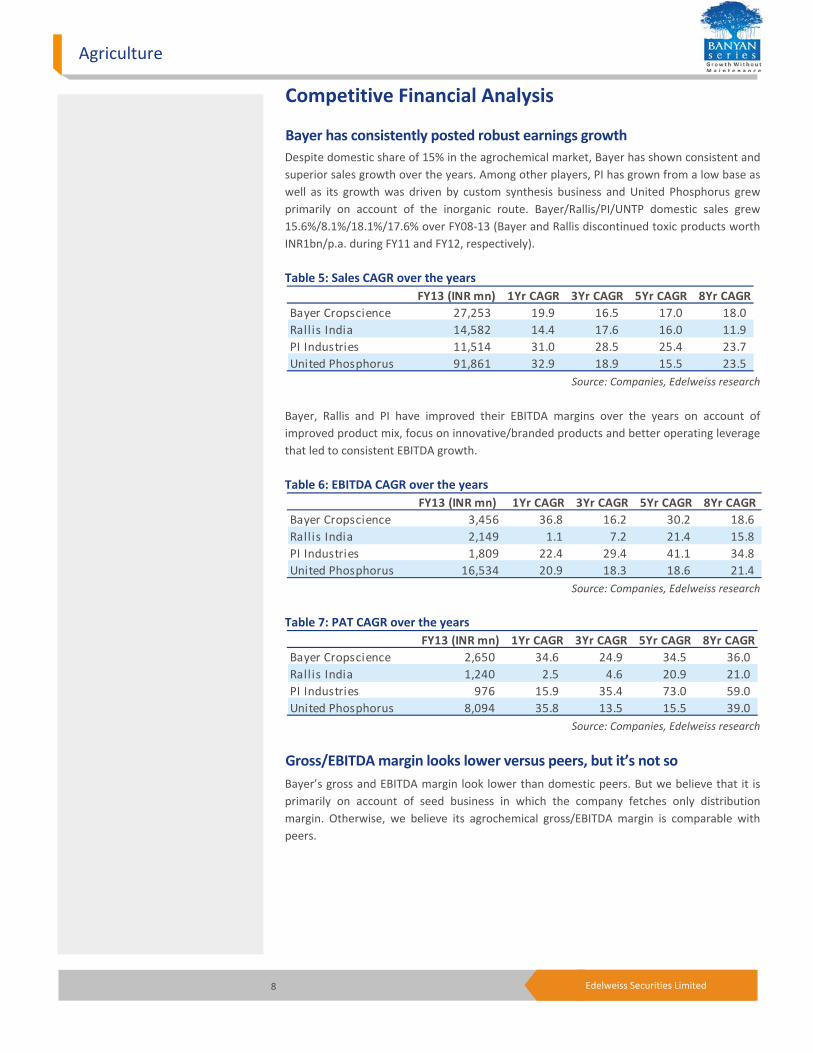
Competitive Financial Analysis
Bayer has consistently posted robust earnings growth Despite domestic share of 15% in the agrochemical market, Bayer has shown consistent and superior sales growth over the years. Among other players, PI has grown from a low base as well as its growth was driven by custom synthesis business and United Phosphorus grew primarily on account of the inorganic route. Bayer/Rallis/PI/UNTP domestic sales grew 15.6%/8.1%/18.1%/17.6% over FY08-13 (Bayer and Rallis discontinued toxic products worth INR1bn/p.a. during FY11 and FY12, respectively). Table 5: Sales CAGR over the years
Source: Companies, Edelweiss research
Bayer, Rallis and PI have improved their EBITDA margins over the years on account of improved product mix, focus on innovative/branded products and better operating leverage that led to consistent EBITDA growth. Table 6: EBITDA CAGR over the years
Source: Companies, Edelweiss research
Table 7: PAT CAGR over the years
Source: Companies, Edelweiss research
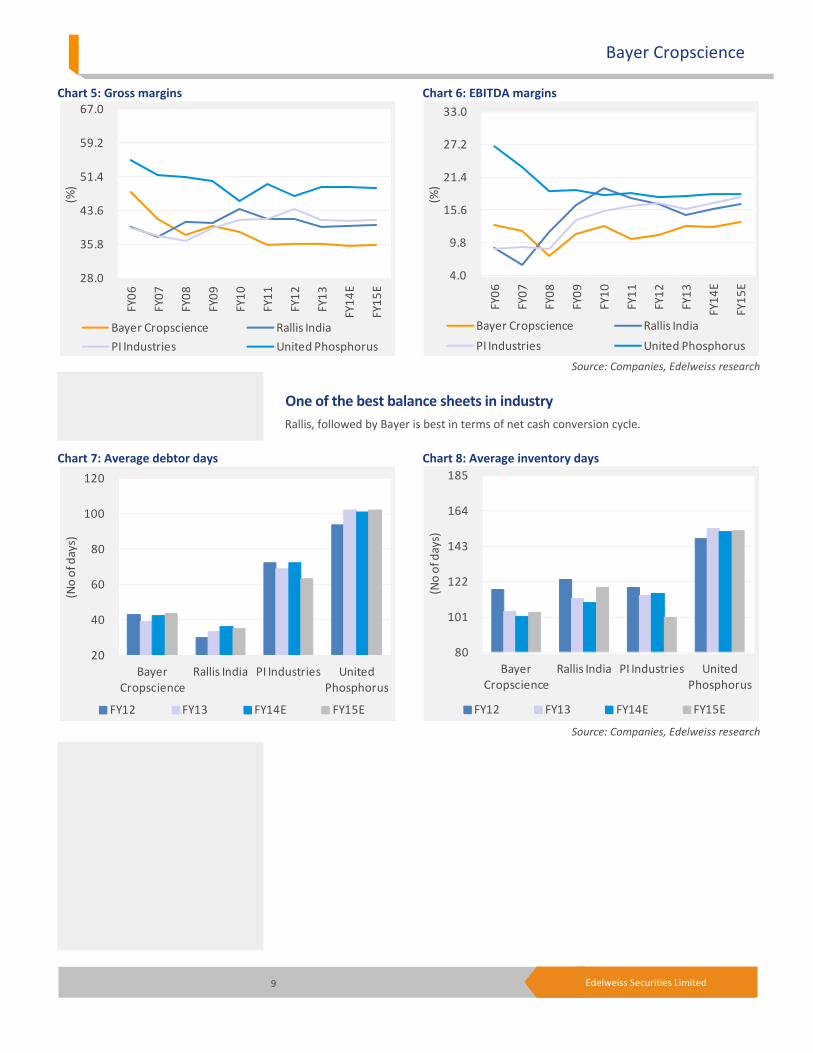
Gross/EBITDA margin looks lower versus peers, but it’s not so Bayer’s gross and EBITDA margin look lower than domestic peers. But we believe that it is primarily on account of seed business in which the company fetches only distribution margin. Otherwise, we believe its agrochemical gross/EBITDA margin is comparable with peers.
FY13 (INR mn) 1Yr CAGR 3Yr CAGR 5Yr CAGR 8Yr CAGRBayer Cropscience 27,253 19.9 16.5 17.0 18.0Rallis India 14,582 14.4 17.6 16.0 11.9PI Industries 11,514 31.0 28.5 25.4 23.7United Phosphorus 91,861 32.9 18.9 15.5 23.5
FY13 (INR mn) 1Yr CAGR 3Yr CAGR 5Yr CAGR 8Yr CAGRBayer Cropscience 3,456 36.8 16.2 30.2 18.6Rall is India 2,149 1.1 7.2 21.4 15.8PI Industries 1,809 22.4 29.4 41.1 34.8United Phosphorus 16,534 20.9 18.3 18.6 21.4
FY13 (INR mn) 1Yr CAGR 3Yr CAGR 5Yr CAGR 8Yr CAGRBayer Cropscience 2,650 34.6 24.9 34.5 36.0Rall is India 1,240 2.5 4.6 20.9 21.0PI Industries 976 15.9 35.4 73.0 59.0United Phosphorus 8,094 35.8 13.5 15.5 39.0
Bayer Cropscience
9 Edelweiss Securities Limited
Chart 5: Gross margins Chart 6: EBITDA margins
Source: Companies, Edelweiss research
One of the best balance sheets in industry Rallis, followed by Bayer is best in terms of net cash conversion cycle.
Chart 7: Average debtor days Chart 8: Average inventory days
Source: Companies, Edelweiss research
28.0
35.8
43.6
51.4
59.2
67.0
FY06
FY07
FY08
FY09
FY10
FY11
FY12
FY13
FY14
E
FY15
E
(%)
Bayer Cropscience Rallis India
PI Industries United Phosphorus
20
40
60
80
100
120
Bayer Cropscience
Rallis India PI Industries United Phosphorus
(No
of d
ays)
FY12 FY13 FY14E FY15E
4.0
9.8
15.6
21.4
27.2
33.0
FY06
FY07
FY08
FY09
FY10
FY11
FY12
FY13
FY14
E
FY15
E
(%)
Bayer Cropscience Rallis India
PI Industries United Phosphorus
80
101
122
143
164
185
Bayer Cropscience
Rallis India PI Industries United Phosphorus
(No
of d
ays)
FY12 FY13 FY14E FY15E

Agriculture
10 Edelweiss Securities Limited
Chart 9: Average payable days Chart 10: Net cash conversion days
Source: Companies, Edelweiss research
Chart 11: RoE looks suppressed led by huge cash in balance sheet
Source: Companies, Edelweiss research
Bayer has highest FAT ratio resulting in superior returns The company follows the strategy of outsourcing its manufacturing and 70% of its formulation business is contract manufactured (FY12) which we believe will increase in the coming years. Recently, it has entered into an agreement to sell its Ankaleshwar plant to Deccan Fine Chemicals and Bayer Material Science which is expected to improve the fixed asset turnover ratio further.
0
50
100
150
200
250
Bayer Cropscience
Rallis India PI Industries United Phosphorus
(No
of d
ays)
FY12 FY13 FY14E FY15E
11.0
16.6
22.2
27.8
33.4
39.0
FY12 FY13 FY14E FY15E
(%)
Bayer Cropscience Rallis India PI Industries United Phosphorus
(50)
10
70
130
190
250
Bayer Cropscience
Rallis India PI Industries United Phosphorus
(No
of d
ays)
FY12 FY13 FY14E FY15E
70% of its formulation business is contract-manufactured (FY12) which we believe will increase in the coming years

Bayer Cropscience
11 Edelweiss Securities Limited
Chart 12: Fixed asset turnover ratio
Source: Companies, Edelweiss research
Table 8: Bayer has debt free balance sheet
Source: Companies, Edelweiss research
Table 9: Bayer’s stellar performance reflects in stock return as well
Source: Bloomberg, Edelweiss research
Table 10: Stellar performance is expected to continue
Source: Companies, Edelweiss research
0.0 5.0 10.0 15.0
Bayer Cropscience
Rallis India
PI Industries
United Phosphorus
(x)FY12 FY13 FY14E FY15E
Debt/equity (x) FY12 FY13 FY14E FY15EBayer Cropscience - - - - Rall is India 0.3 0.2 0.1 - PI Industries 0.8 0.4 0.3 0.2United Phosphorus 0.8 0.9 0.7 0.5
(%) 1Yr CAGR 3Yr CAGR 5Yr CAGR 8Yr CAGRBayer Cropscience 49.0 16.2 45.0 24.8Rallis India 0.7 1.1 41.0 27.0PI Industries 48.0 47.2 82.6 NAUnited Phosphorus 15.8 (5.9) 6.5 5.1
FY12 FY13 FY14E FY15E FY12 FY13 FY14E FY15E FY12 FY13 FY14E FY15EBayer Cropscience 6.3 19.9 14.5 16.8 13.4 36.8 13.1 26.2 45.4 34.6 16.7 25.6Rallis India 17.4 14.4 17.7 15.2 11.0 1.1 25.4 21.5 (2.7) 1.1 37.9 29.4PI Industries 22.1 31.0 28.0 20.5 26.6 22.4 36.9 28.3 40.5 15.9 46.1 34.6United Phosphorus 32.9 20.0 13.1 10.4 27.8 20.9 15.9 10.6 5.4 20.9 24.2 17.2
Sales Growth (%) EBITDA Growth (%) PAT Growth (%)

Agriculture
12 Edelweiss Securities Limited
Valuations Given strong demand drivers, Bayer is expected to post sales and PAT CAGR of 15.8% and 21.4% over FY13-16E (FY08-13 CAGR of 17.0% and 34.5% (excl assets sale)), respectively. We expect the company to generate FCF of INR8bn over FY14-16E and it would augment FY13 net cash/share by 1.6x to INR425 (~26% of current market price). Further, Bayer’s EBITDA margin is likely to expand led by superior product mix, innovative products and better operating leverage. The company has a strong earnings growth trajectory, debt-free balance sheet, robust cash flows with healthy RoE (excluding cash 25-30%). We have not considered recent announcement of buyback of shares nor sale of Ankaleshwar plant in our estimates. Bayer is trading at par with global peers and at a premium than its domestic peer set on account of its strong brands, healthy distribution network, robust R&D capabilities coupled with strong earnings growth. We believe the company will continue to trade at a premium versus domestic peers considering strong agrochemicals as well as seed product pipeline and earning visibility. Hence, we initiate coverage on the stock with ‘BUY’ recommendation and target price of INR1,968 based on 20xFY15E EPS versus its past four years’ trading average of 14x (peak multiple: 20.5x).
Table 11: Peer Comparison
Source: Bloomberg, Edelweiss research
Companies Mcap DPS D-Yield(USD bn) CY13/FY14E CY14/FY15E CY13/FY14E CY14/FY15E CY13/FY14E CY14/FY15E CY12/FY13 %
Domestic PlayersBayer Cropscinece 1.1 16.7 25.7 20.4 16.3 14.9 16.3 5.0 0.3 Rall is India 0.5 32.8 28.2 19.0 14.8 24.4 26.2 2.3 1.4 PI Industries 0.4 46.1 34.6 15.6 11.6 24.0 26.0 1.0 0.6 United Phosphorus 1.2 23.6 17.0 6.9 5.9 19.7 19.5 2.5 1.6 Big Six Global PlayersMonsanto 56.4 15.9 13.8 20.0 17.6 20.8 21.3 3.0 2.8 Syngenta 37.2 18.4 12.0 14.6 13.0 21.8 21.9 10.4 2.9 Bayer 101.3 7.0 12.8 15.6 13.8 21.0 21.2 1.9 2.1 BASF 89.7 (6.4) 10.2 13.6 12.4 18.6 18.6 2.6 3.6 Dupont 55.1 14.5 12.8 15.6 13.9 31.5 29.0 1.7 2.9 Dow Chemical 50.0 25.1 22.1 17.4 14.2 14.3 16.3 1.2 2.9
EPS Growth (%) P/E (x) ROE (%)
We believe that Bayer will continue to trade at a premium valuation versus domestic peers considering strong agrochemicals as well as seed product pipeline and earning visibility
Bayer Cropscience
13 Edelweiss Securities Limited
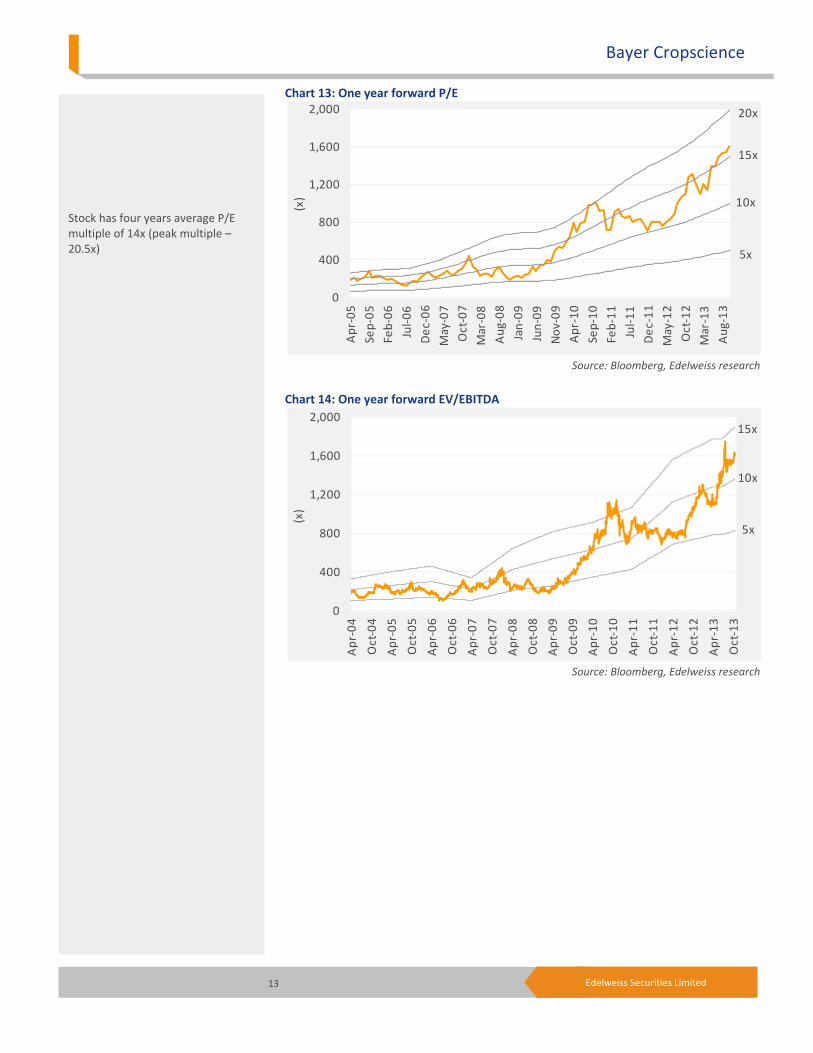
Chart 13: One year forward P/E
Source: Bloomberg, Edelweiss research
Chart 14: One year forward EV/EBITDA
Source: Bloomberg, Edelweiss research
5x
10x
15x
20x
0
400
800
1,200
1,600
2,000
Apr
-05
Sep-
05
Feb-
06
Jul-0
6
Dec
-06
May
-07
Oct
-07
Mar
-08
Aug
-08
Jan-
09
Jun-
09
Nov
-09
Apr
-10
Sep-
10
Feb-
11
Jul-1
1
Dec
-11
May
-12
Oct
-12
Mar
-13
Aug
-13
(x)
5x
10x
15x
0
400
800
1,200
1,600
2,000
Apr
-04
Oct
-04
Apr
-05
Oct
-05
Apr
-06
Oct
-06
Apr
-07
Oct
-07
Apr
-08
Oct
-08
Apr
-09
Oct
-09
Apr
-10
Oct
-10
Apr
-11
Oct
-11
Apr
-12
Oct
-12
Apr
-13
Oct
-13
(x)
Stock has four years average P/E multiple of 14x (peak multiple – 20.5x)

Agriculture
14 Edelweiss Securities Limited
Key Risks Weather: The crop protection industry faces risks of seasonal weather. Weather can affect pest infestations presence as well as demand for crop-protection products. In the domestic market, sales are highly seasonal, primarily during the monsoon. Any adverse change in the weather will negatively affect sales. Further, delayed or adverse monsoon could affect the collection of receivables negatively. However, Bayer has continued to post strong sales in its domestic business during adverse monsoon years. We believe it is primarily on account of its strong branded portfolio. Chart 15: Correlation of monsoon with Bayer’s domestic sales growth
Source: IMD, Company, Edelweiss research
Note: We have not considered FY08 as the company has changed its accounting year. Genetically modified (GM) crops: The use of crop protection products is significantly less for GM crops. Hence, growth and acceptance of GM crops by consumers may adversely affect Bayer’s business. Overseas regulation: Bayer is registering its products in overseas markets. Any negative measures by respective countries can affect the company’s growth adversely.
(28.0)
(17.2)
(6.4)
4.4
15.2
26.0
FY05 FY06 FY07 FY09 FY10 FY11 FY12 FY13
(%)
Monsoon departure Bayer domestic sales growth

Bayer Cropscience
15 Edelweiss Securities Limited
Company Description
About Bayer AG Bayer AG is a global enterprise with core competencies in health care, agriculture and high-tech materials. Bayer CropScience, the subgroup of Bayer AG responsible for the agricultural business, has annual sales of EUR8.4bn (2012) and is one of the world’s leading innovative crop science companies in seeds, crop protection and non-agricultural pest control. The company offers a wide range of products including high value seeds, innovative crop protection solutions as well as an extensive service back up for modern, sustainable agriculture. In non-agricultural applications, Bayer has a broad portfolio of products and services to control pests from home and garden to forestry applications. The company has a global workforce of 20,800 and is represented in more than 120 countries.
Chart 16: Bayer AG’s sales break up (2012) Chart 17: Bayer AG’s crop science sales break up (2012)
Source: Bayer AG, Edelweiss research
Chart 18: Bayer AG’s crop protection sales break up (2012)
Source: Bayer AG, Edelweiss research
Healthcare48%
Cropscience22%
Material Science
30%
Insecticide22%
Fungicide30%
Herbicide35%
Seed growth nutrient
13%
Crop Protection
80%
Seeds12%
Environmental Science
8%

Agriculture
16 Edelweiss Securities Limited
Bayer AG believes that it will continue to outperform global agrochemical market in coming years. Further, seed business will post double digit sales CAGR over 2015.
Table 12: Bayer AG’s aspiration
Source: Bayer AG, Edelweiss research
Bayer Cropscience: India Bayer is the largest agrochemicals player in India. It also sources 100% of seeds from its group company Bayer BioScience (India) and sells it through its distribution network. The company was founded on September 3, 1958, and is headquartered in Mumbai. Bayer AG, parent company, holds 71% in Bayer Cropscience India. The company has two production units in India—Ankaleshwar and Himatnagar (Gujarat). It has entered into a business transfer agreement to sell part of the Ankaleshwar unit to Deccan Fine (Chemical). It manufactures poly-isocyanate products on job work basis for Bayer Material Science, a group company. Hence, Bayer is transferring part unit to Bayer Material Science. The company has employee strength of 1,810 as on March 31, 2013.
Chart 19: Sales break up (FY13)
Source: Company. Edelweiss research
Particulars 2012 Growth (%) 2013 Target Aspiration 2015Sales growth (above market growth) 12.4 High single digit % CAGR ~6%Seeds (Extend footprints) 14.0 Double digit growth% Double digit growth PA
Agrochemical, 82%
Seed, 14%
Other, 4%Fungicide,
18.0%
Insecticide, 48.0%
Herbicide, 16.0%
Seeds, 14.0%
Others, 4.0%

Bayer Cropscience
17 Edelweiss Securities Limited
Chart 20: Sales break up (FY13)
Source: Company. Edelweiss research
Domestic , 83%
Exports, 17%

Agriculture
18 Edelweiss Securities Limited
Bayer has a well diversified product portfolio in agrochemicals and crops. Table 13: Bayer’s agrochemical product portfolio
Source: Company. Edelweiss research
Products Crop InsecticideAdmire Cotton, riceAlanto Cotton, rice, chil l iConfidor Cotton, okra, sugarcane, mango, rice, citrus, groundnut, chill i , sunflowerConfidor Super 350SC Cotton & riceDadeci RiceDecis 2.8 Bengalgram, chill i , cotton, brinjal, mango, okra, redgram, groundnut, teaDecis 100 Cotton, okra, tomatoFame Rice & cottonGlamore RiceJump RiceLarvin Cotton, cabbage, brinjal, pigeonpea, chill iOberon Brinjal, apple, chill i , tea, okraRegent SC Rice, cole crops, chil l i , sugarcaneRegent GR Rice, sugarcaneSevin Cotton, tobacco, paddy, bengalgram, red/black/green gram, castor, groundnutSpintor CottonTamaron Cotton, safflower and riceHerbicidesAccord Plus WheatAdora Rice (Nursery, transplanted and direct seeded) Atlantis WheatBasta TeaKlass Cotton, banana, citrus, grapes, maize, rubberPuma Power WheatRaft Rice, cumin, mustardRicestar RiceSencor Sugarcane, tomato, potato, wheat, soyabeanSunrice Transplanted riceTopstar RiceWhipsuper Soybean , riceFungicidesAliette Grapes, cardamomAntracol Grapes, apple, pomegranate, potato, tomato, chil l iesBaycor Apple, wheat, tea, groundnutBayleton Grapes, mango, chill ies, pea, wheat, soybean, coffeeDerosal Rice, wheat, barkey, tapioca, cotton, jute, ground nut, sugarbeet, peas, cluster beans, cucurbits, chill i ,
brinjal, apple grapes, walnut, rose, ber, moong, cowpea, tobaccoFolicur Groundnut, chill i , paddyMonceren PaddyNativo RiceSectin Potato, grapeSolitude Soyabean Quintal PaddySeed treatmentGaucho Cotton, sunflower, okra, pearl millets, sorghumRaxil Wheat, groundnutPlant growth regulatorsEthrel Mango, tomato, coffee, groundnut, rubber, cucumber, pineapplePlanofix Grapes, apple, mango, citrus, tomato, chill ies, pea, brinjal, cotton, pineapple, l itchi, watermelon, oranges

Bayer Cropscience
19 Edelweiss Securities Limited
Bayer also supplies its products to group companies (primarily parent Bayer AG); it contributes 17.7% to FY13 sales. Further, the company’s ~50% raw material sourcing (including seeds) comes from group companies. Chart 21: Sales/purchases to/from group companies
Source: Company, Edelweiss research
Bayer pays minuscule (FY13: INR16mn) royalty to its parent towards sale of select products in the domestic market.
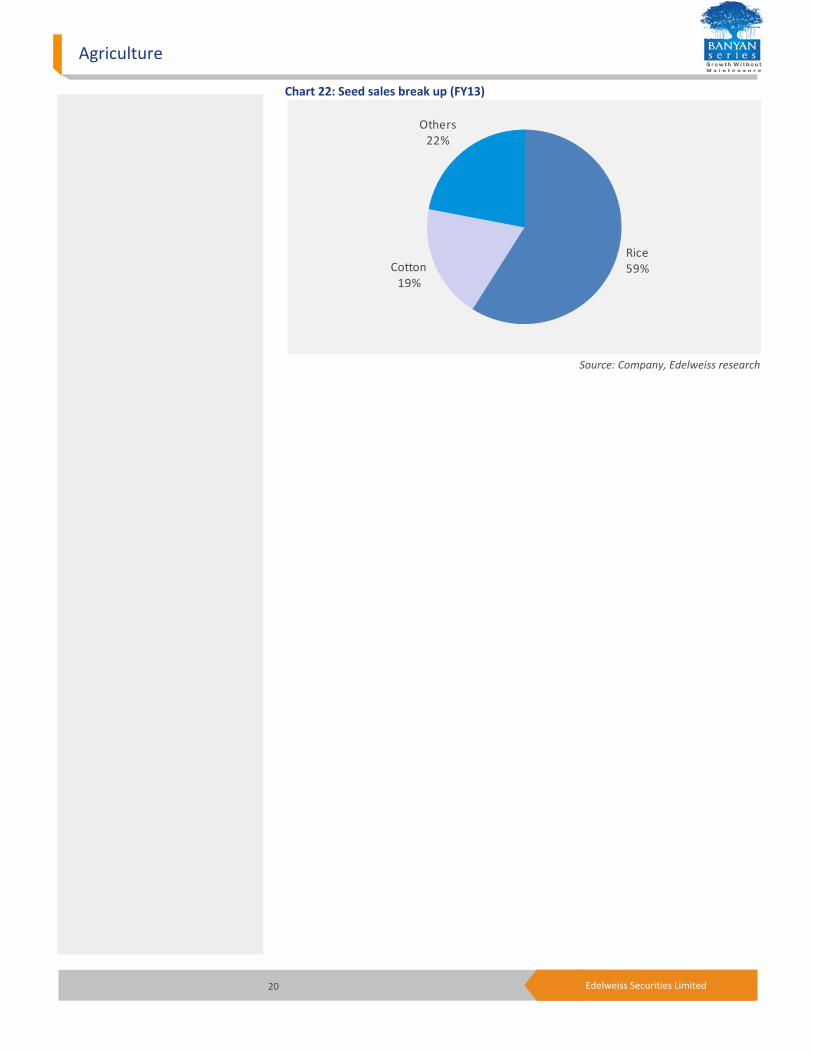
About seed business Bayer is primarily a seed distribution arm and sources 100% seeds from its group company Bayer BioScience (BBS). BBS, headquartered in Hyderabad, has about 400 employees. It is a forerunner in seed business in India. It is engaged in research, development, production and marketing of high quality hybrid seeds for field crops. To cater for the specific needs of farmers, BBS’ hybrid seeds offer a wide product range covering hybrid rice, cotton, pearl millet, corn, grain sorghum as well as mustard. With a capacity to process and package more than 200MT/day of high-quality seeds, BBS has established seed production centers in four states—Andhra Pradesh, Karnataka, Tamil Nadu and Haryana—and plans to develop production centers in other states as well. The company has four seed conditioning plants in Hyderabad. It draws its cutting-edge R&D from competence centres in Gent (Belgium) and Potsdam (Germany). According to our channel checks, Bayer has ~50% market share in hybrid rice seed and we believe it is well equipped to capture the unpenetrated domestic hybrid rice seed market. Hybrid rice and cotton seed constitute 59% and 19% of Bayer’s FY13 seed sales, respectively.
37.0
42.4
47.8
53.2
58.6
64.0
7.0
10.0
13.0
16.0
19.0
22.0
FY08 FY09 FY10 FY11 FY12 FY13
(%)
(%)
Sales (as % of net sales) Purchases (as % of raw material consumed)
Agriculture
20 Edelweiss Securities Limited
Chart 22: Seed sales break up (FY13)
Source: Company, Edelweiss research
Rice59%Cotton
19%
Others22%

Bayer Cropscience
21 Edelweiss Securities Limited
Industry highlights
Agrochemical Industry
Global market The global agrochemical industry has posted CY01-12 CAGR of ~5% and is worth ~USD47bn. Crop protection industry players are categorised into innovators and generics. Innovators are research & development patented product based players like Bayer, Syngenta, BASF, Monsanto, Dow and Dupont. While off-patented product based players are termed generic players. Generic players have a key strength of low-cost manufacturing and wide distribution network. Chart 23: Global agrochemical industry
Source: Company, Edelweiss research
Agrochemicals are necessary to avoid large losses due to weeds, fungal disease and insect infestations to crops. According to Cheminova (global generic crop protection player), 30-50% of crops are saved by usage of spray globally. As per Philips McDougall report (2007), patented products contribute only ~25% to the global crop protection market, while balance market is off-patented (generics). However, 45% of the generic market is still marketed by innovator companies. Hence, we believe that it will be an attractive opportunity for generic players in the future.
20.0
26.8
33.6
40.4
47.2
54.0
2001 2002 2003 2004 2005 2006 2007 2008 2009 2010 2011 2012
(USD
bn)

Agriculture
22 Edelweiss Securities Limited
Chart 24: Global patented and off-patented market Chart 25: Share of innovators in off-patented market
Source: Philips McDougall, Edelweiss research
Chart 26: Geography-wise global agrochemical market
Source: United Phosphorus, Edelweiss research
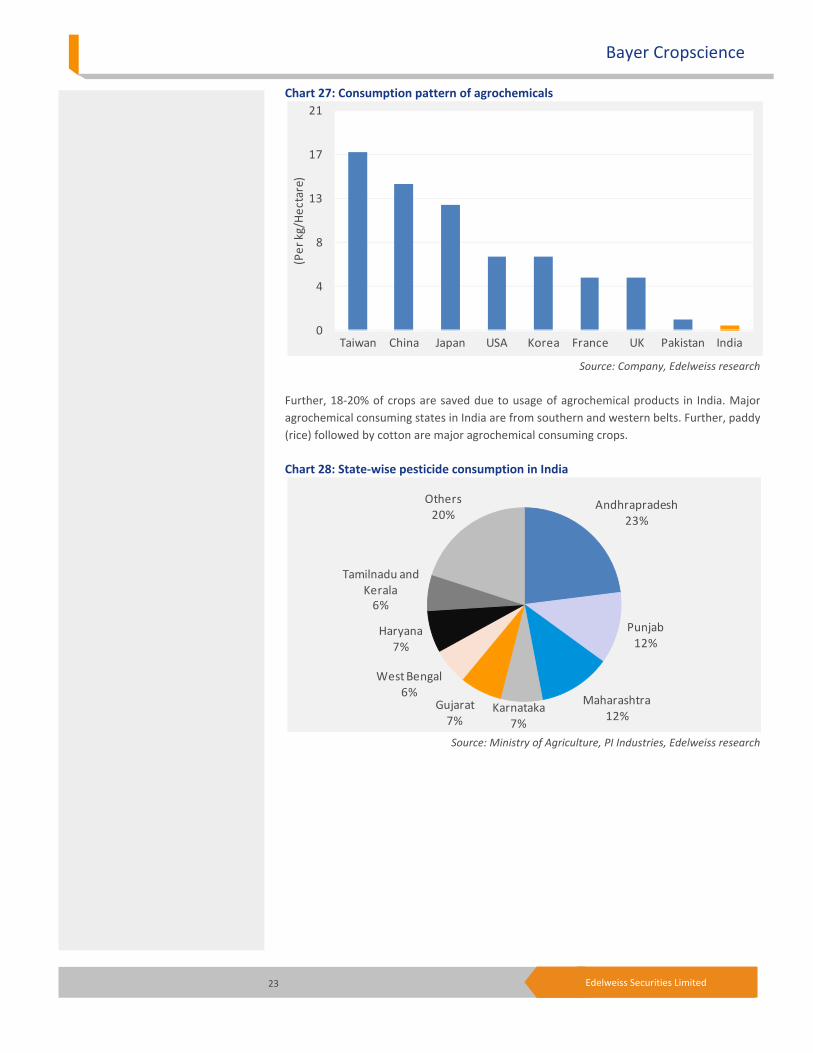
Domestic market According to the industry, the domestic agrochemical sector has posted 10 year CAGR (FY01-10) of 7-8% and is worth INR80bn currently. The domestic agrochemical market is expected to post 10-12% CAGR in the near term on back of increasing food consumption, rising MSP, better government focus and mounting cost of labour. In India, consumption of agrochemical is well below global standards.
Patented25%
Off Patented
75%
Europe27%
Latin America22%North America
21%
Asia26%
Rest of World4%
Generic Players
55%
Innovators45%
Bayer Cropscience
23 Edelweiss Securities Limited
Chart 27: Consumption pattern of agrochemicals
Source: Company, Edelweiss research
Further, 18-20% of crops are saved due to usage of agrochemical products in India. Major agrochemical consuming states in India are from southern and western belts. Further, paddy (rice) followed by cotton are major agrochemical consuming crops. Chart 28: State-wise pesticide consumption in India
Source: Ministry of Agriculture, PI Industries, Edelweiss research
0
4
8
13
17
21
Taiwan China Japan USA Korea France UK Pakistan India
(Per
kg/
Hec
tare
)
Andhrapradesh23%
Punjab12%
Maharashtra12%
Karnataka7%
Gujarat7%
West Bengal6%
Haryana7%
Tamilnadu and Kerala
6%
Others20%

Agriculture
24 Edelweiss Securities Limited
Chart 29: Crop-wise pesticide consumption in India
Source: Industry, Edelweiss research
Global as well domestic food demand has been driven by increasing population, declining arable land and shift from food to fuels. In India, arable land has been declining since the past four decades. However, food production posted 2.1% CAGR (during 1960-2010) primarily on back of yield improvement. Chart 30: Stagnant India’s arable land
Source: Department of Agriculture, Edelweiss research
Paddy35%
Cotton25%
Others40%
80
92
104
116
128
140
FY60
FY62
FY64
FY66
FY68
FY70
FY72
FY74
FY76
FY78
FY80
FY82
FY84
FY86
FY88
FY90
FY92
FY94
FY96
FY98
FY00
FY02
FY04
FY06
FY08
FY10
(m h
ecat
res)

Bayer Cropscience
25 Edelweiss Securities Limited
Chart 31: India’s food production
Source: Department of Agriculture, Edelweiss research
India’s agricultural yield is rising in tandem with the global CAGR despite having an absolute yield, which is much lower than the latter. Demand for food is growing consistently on account of rising population, diversion from food to fuels, rising income in developing countries etc. Further, declining arable land and climatic problems are imposing supply-side pressures. Hence, we believe the only solution to increase food availability is to improve agricultural yield that ensures strong trajectory for agricultural inputs like fertilisers, crop protection products, seeds and irrigation facilities. Chart 32: Agricultural yield
Source: USDA, Department of Agriculture (India), Edelweiss research
57
102
147
192
237
282
FY60
FY62
FY64
FY66
FY68
FY70
FY72
FY74
FY76
FY78
FY80
FY82
FY84
FY86
FY88
FY90
FY92
FY94
FY96
FY98
FY00
FY02
FY04
FY06
FY08
FY10
(m m
t)
0.0
0.8
1.6
2.4
3.2
4.0
FY60
FY62
FY64
FY66
FY68
FY70
FY72
FY74
FY76
FY78
FY80
FY82
FY84
FY86
FY88
FY90
FY92
FY94
FY96
FY98
FY00
FY02
FY04
FY06
FY08
FY10
(mt /
hec
tare
)
World's Yield India's Yield

Agriculture
26 Edelweiss Securities Limited
Seed Industry Indian seed industry is the eighth largest in the world and market size is estimated to be INR80-100bn (including vegetable seeds market size INR20bn). Domestic seed industry is growing at the rate of 12% compared to 6-7% globally and is expected to post 12-15% CAGR in coming years. Of this, domestic cotton seed market is worth INR40bn and is expected to be same over the next two to three years on account of declining cotton acreage in India. Nuziveedu Seeds is the largest player in hybrid cotton seeds with 25% market share, followed by Rashi Seeds and Myhco. The seed industry has a long business cycle of 13-14 years (R&D: ~7years, production: ~3 years and commercialisation: ~3 years) which is a big entry barrier. India has ~2mha (of total 40mha) under hybrid seed in rice crop, which is the next big opportunity for the industry. Area under rice hybrid seed is likely to reach 4-5mha over the next three to four years. Chart 33: Indian seed industry crop-wise
Source: Kaveri Seeds, Edelweiss research
Cotton40%
Vegetable and fruits20%
Others40%

Bayer Cropscience
27 Edelweiss Securities Limited
Financial Outlook Product launches, margin expansion to drive earnings growth We expect net sales and PAT CAGR of 15.8% and 21.4%, respectively, over FY13-16E (FY08-13 CAGR of 17.0% and 34.5%) on back of growth in agrochemicals as well as seed businesses. On conservative basis, we have considered 14%/17% agrochemical sales growth during FY14/15E (FY08-13 CAGR of 19.4%), primarily on account of volume growth that we expect to be driven by innovative products supported by good monsoon and product pricing environment during FY14. Bayer’s seed sales posted CAGR of 18.2% over FY08-13. It is worth highlighting that the company has launched five products in FY13 and is expected to launch further five in FY14E versus 14 over FY08-12. Hence, we have assumed seed sales CAGR of 20.7% over FY13-16 versus expected domestic industry CAGR of 12-15% as we believe the recent product launches will drive growth in the near term. Chart 34: Strong revenue growth to continue
Chart 35: Robust PAT growth trajectory
Source: Company, Edelweiss research
0
10,000
20,000
30,000
40,000
50,000
FY08 FY09 FY10 FY11 FY12 FY13 FY14E FY15E FY16E
(INR
mn)
Active Ingredients Formulation Seeds Others
0
1,000
2,000
3,000
4,000
5,000
FY08 FY09 FY10 FY11 FY12 FY13 FY14E FY15E FY16E
(INR
mn)
On conservative basis, we have considered 14%/17% agrochemical sales growth during FY14/15E (FY08-13 CAGR of 19.4%), primarily on account of volume growth that we expect to be driven by innovative products
Agriculture
28 Edelweiss Securities Limited
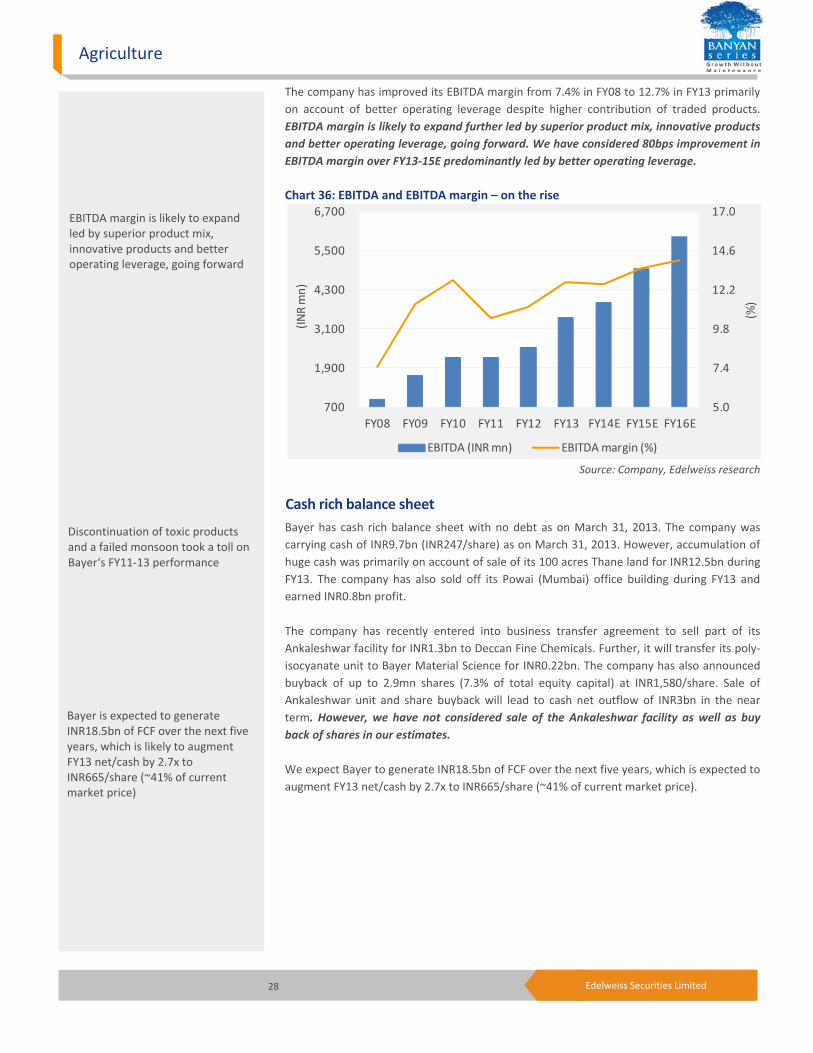
The company has improved its EBITDA margin from 7.4% in FY08 to 12.7% in FY13 primarily on account of better operating leverage despite higher contribution of traded products. EBITDA margin is likely to expand further led by superior product mix, innovative products and better operating leverage, going forward. We have considered 80bps improvement in EBITDA margin over FY13-15E predominantly led by better operating leverage. Chart 36: EBITDA and EBITDA margin – on the rise
Source: Company, Edelweiss research
Cash rich balance sheet Bayer has cash rich balance sheet with no debt as on March 31, 2013. The company was carrying cash of INR9.7bn (INR247/share) as on March 31, 2013. However, accumulation of huge cash was primarily on account of sale of its 100 acres Thane land for INR12.5bn during FY13. The company has also sold off its Powai (Mumbai) office building during FY13 and earned INR0.8bn profit. The company has recently entered into business transfer agreement to sell part of its Ankaleshwar facility for INR1.3bn to Deccan Fine Chemicals. Further, it will transfer its poly-isocyanate unit to Bayer Material Science for INR0.22bn. The company has also announced buyback of up to 2.9mn shares (7.3% of total equity capital) at INR1,580/share. Sale of Ankaleshwar unit and share buyback will lead to cash net outflow of INR3bn in the near term. However, we have not considered sale of the Ankaleshwar facility as well as buy back of shares in our estimates. We expect Bayer to generate INR18.5bn of FCF over the next five years, which is expected to augment FY13 net/cash by 2.7x to INR665/share (~41% of current market price).
5.0
7.4
9.8
12.2
14.6
17.0
700
1,900
3,100
4,300
5,500
6,700
FY08 FY09 FY10 FY11 FY12 FY13 FY14E FY15E FY16E
(%)
(INR
mn)
EBITDA (INR mn) EBITDA margin (%)
EBITDA margin is likely to expand led by superior product mix, innovative products and better operating leverage, going forward
Discontinuation of toxic products and a failed monsoon took a toll on Bayer‘s FY11-13 performance
Bayer is expected to generate INR18.5bn of FCF over the next five years, which is likely to augment FY13 net/cash by 2.7x to INR665/share (~41% of current market price)
Bayer Cropscience
29 Edelweiss Securities Limited
Table 14: FCF analysis
Source: Company, Edelweiss research
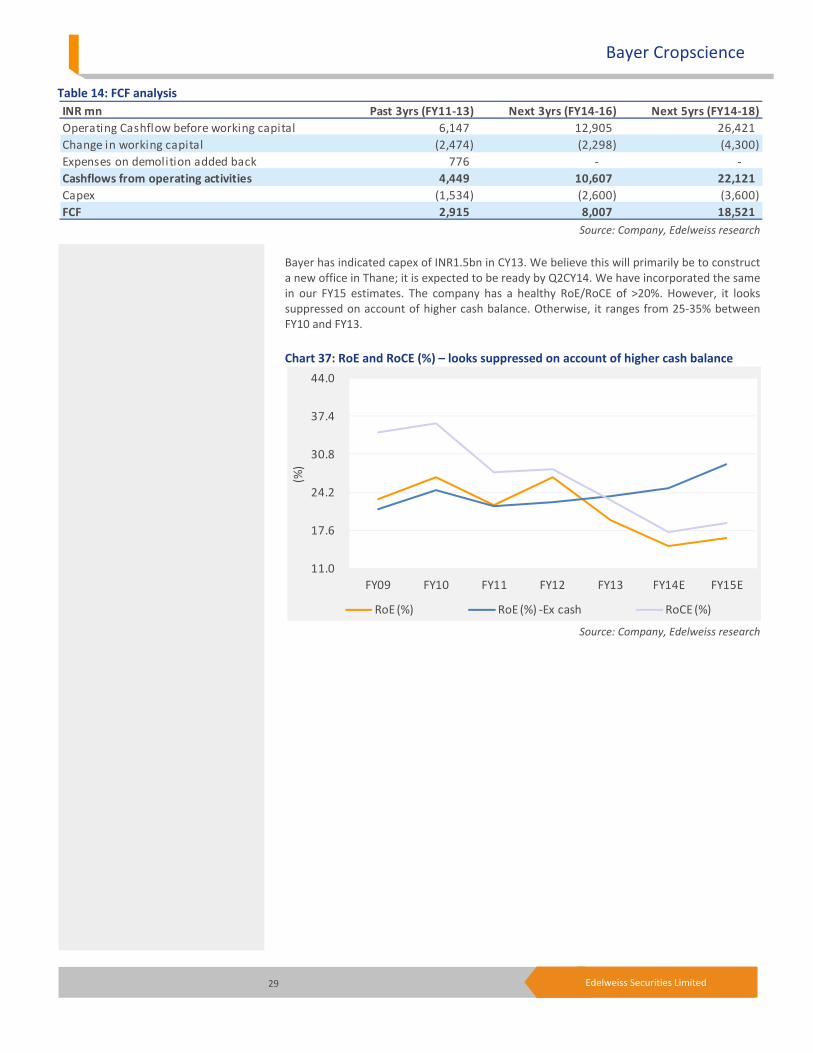
Bayer has indicated capex of INR1.5bn in CY13. We believe this will primarily be to construct a new office in Thane; it is expected to be ready by Q2CY14. We have incorporated the same in our FY15 estimates. The company has a healthy RoE/RoCE of >20%. However, it looks suppressed on account of higher cash balance. Otherwise, it ranges from 25-35% between FY10 and FY13. Chart 37: RoE and RoCE (%) – looks suppressed on account of higher cash balance
Source: Company, Edelweiss research
INR mn Past 3yrs (FY11-13) Next 3yrs (FY14-16) Next 5yrs (FY14-18)Operating Cashflow before working capital 6,147 12,905 26,421Change in working capital (2,474) (2,298) (4,300)Expenses on demolition added back 776 - - Cashflows from operating activities 4,449 10,607 22,121Capex (1,534) (2,600) (3,600)FCF 2,915 8,007 18,521
11.0
17.6
24.2
30.8
37.4
44.0
FY09 FY10 FY11 FY12 FY13 FY14E FY15E
(%)
RoE (%) RoE (%) -Ex cash RoCE (%)

Agriculture
30 Edelweiss Securities Limited
Financial Statements
Key assumptions
FY13 FY14E FY15E FY16E
Macro
GDP(Y-o-Y %) 5.0 4.8 6.0 -
Inflation (Avg) 7.4 6.0 6.0 -
Repo rate (exit rate) 7.5 7.8 7.0 -
USD/INR (Avg) 54.5 62.0 60.0 -
Company
Agrochemical rev. growth (%) 23.3 14.1 16.5 15.9
Seeds revenue growth (%) 12.2 20.0 22.0 20.0
Domestic revenue growth (%) 16.5 18.2 17.4 16.6
Export revenue growth (%) 47.6 -20.0 12.0 12.0
Cost Assumptions
Raw mat. cost as % net rev. 64.0 64.6 64.3 64.4
Employee exp. as % net rev. 6.6 6.4 6.2 5.9
Other exp. as % net revenue 16.7 16.5 16.0 15.7
Financial Assumptions
Dep. as % of avg. gross block 8.7 6.4 6.4 6.0
Int. rate as % of avg. gross debt NA NA NA NA
Tax rate as % of PBT 29.2 29.0 29.0 29.0
Capex (INR mn) (3,806) 600 1,500 500
Net borrowings (INR mn) (9,741) (11,527) (13,302) (16,778)
Receivable (days) 39 42 43 43
Inventory (days) 105 101 104 104
Payable (days) 106 98 101 100
Cash conversion cycle (dayes) 38 45 46 47
Income statement (INR mn)Year to March FY13 FY14E FY15E FY16ENet revenues 27,253 31,196 36,428 42,296Raw material costs 17,446 20,143 23,409 27,237Gross profit 9,807 11,053 13,018 15,059Employee expenses 1,810 1,997 2,259 2,495Other expenses 4,541 5,147 5,828 6,641Operating expenses 6,351 7,144 8,087 9,136Total expenditure 23,797 27,287 31,496 36,373EBITDA 3,456 3,909 4,932 5,923Depreciation & amortisation 366 312 417 452EBIT 3,090 3,597 4,514 5,471Interest expense 37 40 40 40Other income 689 800 1,000 1,250 Profit before tax 3,742 4,357 5,474 6,681 Provision for tax 1,092 1,264 1,588 1,937 Core profit 2,650 3,094 3,887 4,743 Extraordinary/ Prior period item 8,967 - - - Profit after tax 11,617 3,094 3,887 4,743 Profit after minority interest 11,617 3,094 3,887 4,743 Equity shares outstanding (mn) 39.5 39.5 39.5 39.5EPS (INR) basic 67.1 78.3 98.4 120.1Diluted shares (mn) 39.5 39.5 39.5 39.5EPS (INR) diluted 67.1 78.3 98.4 120.1CEPS 76.4 86.2 109.0 131.5DPS 5.0 6.0 7.0 8.0Dividend payout (%) 7.4 7.7 7.1 6.7
Common size metrics (% net revenues)Year to March FY13 FY14E FY15E FY16EGross margin 36.0 35.4 35.7 35.6Operating expenses 23.3 22.9 22.2 21.6EBITDA margins 12.7 12.5 13.5 14.0EBIT margin 11.3 11.5 12.4 12.9Interest 0.1 0.1 0.1 0.1Net profit margin 9.7 9.9 10.7 11.2
Growth metrics (%)Year to March FY13 FY14E FY15E FY16ERevenues 19.9 14.5 16.8 16.1EBITDA 36.8 13.1 26.2 20.1PBT 42.7 16.4 25.6 22.0Net profit 34.6 16.7 25.6 22.0EPS 34.6 16.7 25.6 22.0

31 Edelweiss Securities Limited
Bayer Cropscience
Peer comparison valuation
Source: Bloomberg, Edelweiss research
Balance sheet (INR mn)As on 31st March FY13 FY14E FY15E FY16EShare capital 395 395 395 395Reserves & surplus 18,918 21,734 25,298 29,671Shareholder equity 19,313 22,129 25,693 30,066Deferred tax liability/asset 18 18 18 18Sources of funds 19,331 22,147 25,711 30,084Tangible assets 2,157 3,616 4,699 4,746Intangible assets 29 29 29 29CWIP (incl. intangible) 1,271 100 100 100Total net fixed assets 3,457 3,745 4,828 4,875Non current investments 37 37 37 37Investments 37 37 37 37Cash and cash equivalents 9,741 11,527 13,302 16,778Inventories 5,000 6,179 7,159 8,325Sundry debtors 3,224 4,003 4,632 5,392Loans and advances 2,594 2,594 2,594 2,594Other assets 97 97 97 97
Total current assets (ex cash) 10,915 12,873 14,482 16,408
Trade payable 1,972 3,090 3,580 4,163
Other current liabilities & prov. 2,847 2,946 3,359 3,852
Total current liabilities & prov. 4,819 6,035 6,938 8,014
Net current assets (ex cash) 6,096 6,838 7,544 8,394
Application of funds 19,331 22,147 25,711 30,084
Book value per share (INR) 489 560 650 761
Free cash flow (INR mn)
Year to March FY13 FY14E FY15E FY16E
Net profit 11,617 3,094 3,887 4,743
Add: Depreciation 366 312 417 452
Add: Int & other non-cash items* (9,403) - - -
Gross cash flow 2,580 3,406 4,304 5,196
Less: Changes in working cap. 1,197 742 705 850
Operating cash flow 1,383 2,663 3,599 4,345
Less: Capex* (3,806) 600 1,500 500
Free cash flow 5,189 2,063 2,099 3,845
*Company has sold off Thane land and Powai office building in FY13
Companies Mcap DPS D-Yield(INR bn) FY14E FY15E FY14E FY15E FY14E FY15E FY12/FY13 %
Bayer Cropscinece 63 16.7 25.6 20.4 16.3 14.9 16.3 5.0 0.3 Rallis India 31 32.8 28.2 19.0 14.8 24.4 26.2 2.3 1.4 PI Industries 22 46.1 34.6 15.6 11.6 24.0 26.0 1.0 0.6 United Phosphorus 69 23.6 17.0 6.9 5.9 19.7 19.5 2.5 1.6
EPS Growth (%) P/E (x) ROE (%)
Cash flow metrics
Year to March FY13 FY14E FY15E FY16E
Operating cash flow 1,383 2,663 3,599 4,345
Financing cash flow (213) (277) (324) (370)
Investing cash flow 4,270 (600) (1,500) (500)
Net cash flow 5,440 1,786 1,775 3,476
Capex 3,806 (600) (1,500) (500)
Dividends paid (193) (277) (324) (370)
Profitability ratios
Year to March FY13 FY14E FY15E FY16E
ROACE (%) 22.8 17.4 18.9 19.6ROAE (%) 19.5 14.9 16.3 17.0ROA (%) 19.5 14.9 16.2 17.0Current ratio 2.3 2.1 2.1 2.0Receivables (days) 39 42 43 43Inventory (days) 105 101 104 104Payables (days) 106 98 101 100Cash conversion cycle (days) 38 45 46 47
Operating ratios (x)Year to March FY13 FY14E FY15E FY16ETotal asset turnover 2.0 1.5 1.5 1.5Fixed asset turnover 11.8 7.6 8.1 8.9Equity turnover 2.0 1.5 1.5 1.5
Valuation parametersYear to March FY13 FY14E FY15E FY16EDiluted EPS (INR) 67.1 78.3 98.4 120.1Y-o-Y growth (%) 34.6 16.7 25.6 22.0CEPS (INR) 76.4 86.2 109.0 131.5Diluted P/E (x) 23.8 20.4 16.3 13.3P/BV (x) 3.3 2.9 2.5 2.1EV/Sales (x) 1.9 1.6 1.3 1.0EV/EBITDA (x) 14.7 12.6 9.6 7.4Dividend yield(%) 0.3 0.4 0.4 0.5

Agriculture
32 Edelweiss Securities Limited
Holding Top -10Perc. Holding Perc. Holding
Bajaj Allianz Life Insurance Co 2.45 Pinebridge Investment Asia 1.35
DSP Blackrock Investment Manager 2.35 Indian Syntans Investments 1.14
Birla Sunlife Asset Management 1.83 Meenakshi Narayanan Invest 1.04
AIG Global Investment Corp 1.59 Norges Bank 0.80
HDFC Asset Management Co 1.58 Oppenheimer Funds Incorporated 0.63
*as per last available data
Insider Trades Reporting Data Acquired / Seller B/S Qty Traded No Data Available
*as per last available data
Bulk Deals Data Acquired / Seller B/S Qty Traded Price
No Data Available
*as per last available data
Additional Data
Directors Data Dr. Vijay Mallya Chairman Stephan Gerlich Vice Chairman and MD Sharad M. Kulkarni Non Executive Independent Director A. K. R. Nedungadi Non Executive Independent DirectorVimal Bhandari Non Executive Independent Director Peter Mueller Non Executive DirectorTobias Marchand Non Executive Director Kaikobad B. Mistry Non Executive DirectorDr. Thomas Hoffmann Whole Time Director
Auditors - Price Waterhouse
*as per last available data
33 Edelweiss Securities Limited
Bayer Cropscience
Edelweiss Securities Limited, Edelweiss House, off C.S.T. Road, Kalina, Mumbai – 400 098. Board: (91-22) 4009 4400, Email: [email protected]
Vikas Khemani Head Institutional Equities [email protected] +91 22 2286 4206
Nischal Maheshwari Co-Head Institutional Equities & Head Research [email protected] +91 22 4063 5476
Nirav Sheth Head Sales [email protected] +91 22 4040 7499
Coverage group(s) of stocks by primary analyst(s): Agriculture Jain Irrigation, PI Industries, Rallis India, United Phosphorus
Distribution of Ratings / Market Cap
Edelweiss Research Coverage Universe
Rating Distribution* 127 44 8 180* 1 stocks under review
Market Cap (INR) 112 54 14
> 50bn Between 10bn and 50 bn < 10bn
Date Company Title Price (INR) Recos
Buy Hold Reduce Total
Recent Research
26-Sep-13 United Phosphorus
Enriched growth; Visit Note
144 Buy
06-Aug-13 PI Industries Stellar performance;Visit Note
130 Buy
05-Aug-13 SolarIndustries
Result disappoints; long-term growth intact; Result Update
870 Hold
Rating Interpretation
Buy appreciate more than 15% over a 12-month period
Hold appreciate up to 15% over a 12-month period
Reduce depreciate more than 5% over a 12-month period
Rating Expected to
Agriculture
34 Edelweiss Securities Limited
DISCLAIMER General Disclaimer:
This report has been prepared by Edelweiss Securities Limited (Edelweiss). Edelweiss, its holding company and associate companies are a full service, integrated investment banking, portfolio management and brokerage group. Our research analysts and sales persons provide important input into our investment banking activities. This report does not constitute an offer or solicitation for the purchase or sale of any financial instrument or as an official confirmation of any transaction. The information contained herein is from publicly available data or other sources believed to be reliable, but we do not represent that it is accurate or complete and it should not be relied on as such. Edelweiss or any of its affiliates/ group companies shall not be in any way responsible for any loss or damage that may arise to any person from any inadvertent error in the information contained in this report. This report is provided for assistance only and is not intended to be and must not alone be taken as the basis for an investment decision. The user assumes the entire risk of any use made of this information. Each recipient of this report should make such investigation as it deems necessary to arrive at an independent evaluation of an investment in the securities of companies referred to in this report (including the merits and risks involved), and should consult his own advisors to determine the merits and risks of such investment. The investment discussed or views expressed may not be suitable for all investors. We and our affiliates, group companies, officers, directors, and employees may: (a) from time to time, have long or short positions in, and buy or sell the securities thereof, of company (ies) mentioned herein or (b) be engaged in any other transaction involving such securities and earn brokerage or other compensation or act as advisor or lender/borrower to such company (ies) or have other potential conflict of interest with respect to any recommendation and related information and opinions. This information is strictly confidential and is being furnished to you solely for your information. This information should not be reproduced or redistributed or passed on directly or indirectly in any form to any other person or published, copied, in whole or in part, for any purpose. This report is not directed or intended for distribution to, or use by, any person or entity who is a citizen or resident of or located in any locality, state, country or other jurisdiction, where such distribution, publication, availability or use would be contrary to law, regulation or which would subject Edelweiss and affiliates/ group companies to any registration or licensing requirements within such jurisdiction. The distribution of this report in certain jurisdictions may be restricted by law, and persons in whose possession this report comes, should inform themselves about and observe, any such restrictions. The information given in this report is as of the date of this report and there can be no assurance that future results or events will be consistent with this information. This information is subject to change without any prior notice. Edelweiss reserves the right to make modifications and alterations to this statement as may be required from time to time. However, Edelweiss is under no obligation to update or keep the information current. Nevertheless, Edelweiss is committed to providing independent and transparent recommendation to its client and would be happy to provide any information in response to specific client queries. Neither Edelweiss nor any of its affiliates, group companies, directors, employees, agents or representatives shall be liable for any damages whether direct, indirect, special or consequential including lost revenue or lost profits that may arise from or in connection with the use of the information. Past performance is not necessarily a guide to future performance. The disclosures of interest statements incorporated in this report are provided solely to enhance the transparency and should not be treated as endorsement of the views expressed in the report. Edelweiss Securities Limited generally prohibits its analysts, persons reporting to analysts and their dependents from maintaining a financial interest in the securities or derivatives of any companies that the analysts cover. The information provided in these reports remains, unless otherwise stated, the copyright of Edelweiss. All layout, design, original artwork, concepts and other Intellectual Properties, remains the property and copyright Edelweiss and may not be used in any form or for any purpose whatsoever by any party without the express written permission of the copyright holders. Analyst Certification:
The analyst for this report certifies that all of the views expressed in this report accurately reflect his or her personal views about the subject company or companies and its or their securities, and no part of his or her compensation was, is or will be, directly or indirectly related to specific recommendations or views expressed in this report. Analyst holding in the stock: No. Edelweiss shall not be liable for any delay or any other interruption which may occur in presenting the data due to any reason including network (Internet) reasons or snags in the system, break down of the system or any other equipment, server breakdown, maintenance shutdown, breakdown of communication services or inability of the Edelweiss to present the data. In no event shall the Edelweiss be liable for any damages, including without limitation direct or indirect, special, incidental, or consequential damages, losses or expenses arising in connection with the data presented by the Edelweiss through this presentation.

35 Edelweiss Securities Limited
Bayer Cropscience
Access the entire repository of Edelweiss Research on www.edelresearch.com
Disclaimer for U.S. Persons
This research report is a product of Edelweiss Securities Limited, which is the employer of the research analyst(s) who has prepared the research report. The research analyst(s) preparing the research report is/are resident outside the United States (U.S.) and are not associated persons of any U.S. regulated broker-dealer and therefore the analyst(s) is/are not subject to supervision by a U.S. broker-dealer, and is/are not required to satisfy the regulatory licensing requirements of FINRA or required to otherwise comply with U.S. rules or regulations regarding, among other things, communications with a subject company, public appearances and trading securities held by a research analyst account.
This report is intended for distribution by Edelweiss Securities Limited only to "Major Institutional Investors" as defined by Rule 15a-6(b)(4) of the U.S. Securities and Exchange Act, 1934 (the Exchange Act) and interpretations thereof by U.S. Securities and Exchange Commission (SEC) in reliance on Rule 15a 6(a)(2). If the recipient of this report is not a Major Institutional Investor as specified above, then it should not act upon this report and return the same to the sender. Further, this report may not be copied, duplicated and/or transmitted onward to any U.S. person, which is not the Major Institutional Investor.
In reliance on the exemption from registration provided by Rule 15a-6 of the Exchange Act and interpretations thereof by the SEC in order to conduct certain business with Major Institutional Investors, Edelweiss Securities Limited has entered into an agreement with a U.S. registered broker-dealer, Enclave Capital, LLC ("Enclave").
Transactions in securities discussed in this research report should be effected through Enclave Capital, LLC.
Disclaimer for U.K. Persons
The contents of this research report have not been approved by an authorised person within the meaning of the Financial Services and Markets Act 2000 ("FSMA").
In the United Kingdom, this research report is being distributed only to and is directed only at (a) persons who have professional experience in matters relating to investments falling within Article 19(5) of the FSMA (Financial Promotion) Order 2005 (the “Order”); (b) persons falling within Article 49(2)(a) to (d) of the Order (including high net worth companies and unincorporated associations); and (c) any other persons to whom it may otherwise lawfully be communicated (all such persons together being referred to as “relevant persons”).
This research report must not be acted on or relied on by persons who are not relevant persons. Any investment or investment activity to which this research report relates is available only to relevant persons and will be engaged in only with relevant persons. Any person who is not a relevant person should not act or rely on this research report or any of its contents. This research report must not be distributed, published, reproduced or disclosed (in whole or in part) by recipients to any other person.
Disclaimer for Canadian Persons
This research report is a product of Edelweiss Securities Limited ("ESL"), which is the employer of the research analysts who have prepared the research report. The research analysts preparing the research report are resident outside the Canada and are not associated persons of any Canadian registered adviser and/or dealer and, therefore, the analysts are not subject to supervision by a Canadian registered adviser and/or dealer, and are not required to satisfy the regulatory licensing requirements of the Ontario Securities Commission, other Canadian provincial securities regulators, the Investment Industry Regulatory Organization of Canada and are not required to otherwise comply with Canadian rules or regulations regarding, among other things, the research analysts' business or relationship with a subject company or trading of securities by a research analyst.
This report is intended for distribution by ESL only to "Permitted Clients" (as defined in National Instrument 31-103 ("NI 31-103")) who are resident in the Province of Ontario, Canada (an "Ontario Permitted Client"). If the recipient of this report is not an Ontario Permitted Client, as specified above, then the recipient should not act upon this report and should return the report to the sender. Further, this report may not be copied, duplicated and/or transmitted onward to any Canadian person.
ESL is relying on an exemption from the adviser and/or dealer registration requirements under NI 31-103 available to certain international advisers and/or dealers. Please be advised that (i) ESL is not registered in the Province of Ontario to trade in securities nor is it registered in the Province of Ontario to provide advice with respect to securities; (ii) ESL's head office or principal place of business is located in India; (iii) all or substantially all of ESL's assets may be situated outside of Canada; (iv) there may be difficulty enforcing legal rights against ESL because of the above; and (v) the name and address of the ESL's agent for service of process in the Province of Ontario is: Bamac Services Inc., 181 Bay Street, Suite 2100, Toronto, Ontario M5J 2T3 Canada.
Copyright 2009 Edelweiss Research (Edelweiss Securities Ltd). All rights reserved