
Battery electric vehicles can reduce greenhouse gas ... · Battery electric vehicles can reduce...
46
Battery electric vehicles can reduce greenhouse gas emissions and make renewable energy cheaper in India Anand Gopal 1 Maggie Witt 1 Nikit Abhyankar 1 Colin Sheppard 2 Andrew Harris 2 Energy Technologies Area, Lawrence Berkeley National Laboratory 1 Schatz Energy Research Center (SERC), Humboldt State University 2 June 2015 This work was jointly supported by the Assistant Secretary, Office of International Affairs, U.S. Department of Energy and by the Assistant Secretary, Bureau of Oceans and International Environmental and Scientific Affairs, U.S. Department of State under Contract No. DE-AC02-05CH11231. ERNEST ORLANDO LAWRENCE BERKELEY NATIONAL LABORATORY LBNL-184562
Transcript of Battery electric vehicles can reduce greenhouse gas ... · Battery electric vehicles can reduce...

Battery electric vehicles can reduce greenhouse gas emissions and make renewable energy cheaper in India Anand Gopal1
Maggie Witt1
Nikit Abhyankar1 Colin Sheppard2
Andrew Harris2
Energy Technologies Area, Lawrence Berkeley National Laboratory1 Schatz Energy Research Center (SERC), Humboldt State University2
June 2015
This work was jointly supported by the Assistant Secretary, Office of International Affairs, U.S. Department of Energy and by the Assistant Secretary, Bureau of Oceans and International Environmental and Scientific Affairs, U.S. Department of State under Contract No. DE-AC02-05CH11231.
ERNEST ORLANDO LAWRENCE BERKELEY NATIONAL LABORATORY
LBNL-184562
ii
Disclaimer
This document was prepared as an account of work sponsored by the United States Government. While this document is believed to contain correct information, neither the United States Government nor any agency thereof, nor The Regents of the University of California, nor any of their employees, makes any warranty, express or implied, or assumes any legal responsibility for the accuracy, completeness, or usefulness of any information, apparatus, product, or process disclosed, or represents that its use would not infringe privately owned rights. Reference herein to any specific commercial product, process, or service by its trade name, trademark, manufacturer, or otherwise, does not necessarily constitute or imply its endorsement, recommendation, or favoring by the United States Government or any agency thereof, or The Regents of the University of California. The views and opinions of authors expressed herein do not necessarily state or reflect those of the United States Government or any agency thereof, or The Regents of the University of California.
Ernest Orlando Lawrence Berkeley National Laboratory is an equal opportunity employer
iii
Table of Contents Executive Summary .................................................................................................................................. 1
1. Introduction ........................................................................................................................................ 3 Grid Impacts and Benefits of BEVs ................................................................................................... 4 1.1. Climate and Primary Fossil Energy Impacts of BEVs ............................................................... 4 1.2.
2. The Renewables and Electric Vehicles (REV) Model ......................................................... 6 PEV Infrastructure (PEVI) Model ...................................................................................................... 7 2.1.2.1.1. Model Overview ................................................................................................................................ 7 2.1.2. National Capital Territory (NCT) of Delhi ............................................................................. 8 2.1.3. 2025 Delhi Vehicle Stock and Characteristics ..................................................................... 9 2.1.4. EV Charger Capital and Operational Costs ......................................................................... 10 2.1.5. Optimal Siting of Charging Infrastructure .......................................................................... 11 2.1.6. Producing Charging Profiles for PLEXOS ............................................................................ 11 Grid Planning and Dispatch Model: PLEXOS ............................................................................. 12 2.2.2.2.1. Summary of Model Customization ........................................................................................ 12 2.2.2. Hourly solar and wind generation forecast ....................................................................... 14 2.2.2.1. Wind Energy Generation Profiles ................................................................................................... 14 2.2.2.2. Solar Energy Generation Profiles .................................................................................................... 15
2.2.3. Existing Generation Capacity in Delhi .................................................................................. 16 2.2.4. Operational Parameters of Generators ............................................................................... 16 2.2.5. Hydro capacity and energy model ......................................................................................... 18 2.2.6. Costs .................................................................................................................................................... 18 2.2.7. Fuel Prices ........................................................................................................................................ 19 2.2.8. Transmission .................................................................................................................................. 20 2.2.9. Scenarios for Modeling ............................................................................................................... 20 2.2.10. Penetration of BEVs in Delhi ................................................................................................. 20 2.2.11. 20% of Supply from Renewable Sources ......................................................................... 20 2.2.12. Modeling the Smart Charging of EVs ................................................................................. 20 2.2.13. PLEXOS Outputs .......................................................................................................................... 21 Economic and Environmental Impacts (EEI) Model ............................................................. 21 2.3.2.3.1. Primary fossil energy consumption ...................................................................................... 21 2.3.2. CO2 emissions (per kilometer) ................................................................................................ 22 Cost of vehicle ownership ................................................................................................................. 23 2.4.2.4.1. Vehicle Operating Cost (per km) ............................................................................................ 23
3. Results ................................................................................................................................................. 23 At 15% penetration, BEVs only add 1% additional load to peak demand ................... 24 3.1. At 15% penetration, BEVs exhibit substantial load shifting potential .......................... 26 3.2.3.2.1. Smart charging with no renewable energy on the grid ................................................ 26 3.2.2. Smart charging with 20% renewable energy generation ........................................... 27 At 15% penetration, BEV Smart charging lowers the cost of integrating renewables 3.3.
by 2%. ...................................................................................................................................................................... 29

iv
BEVs reduce CO2 emissions by 30-‐50% over conventional vehicles under various 3.4.scenarios ................................................................................................................................................................ 30
15% penetration of BEVs reduce primary fossil energy consumption by 16% in 3.5.Delhi 32
BEV operating costs are 6 -‐ 9 lower than conventional vehicle operating costs. ..... 33 3.6.
4. Policy Implications ........................................................................................................................ 34 Recommendations to Facilitate PEV Smart Charging ........................................................... 35 4.1.
References .................................................................................................................................................. 37
v
List of Figures
Figure 1. India's Power generation by fuel. Sources: (CEA 2015b; CEA 2015d) ............................ 5 Figure 2. Summary of the REV Modeling Framework ................................................................................ 6 Figure 3. Summary of the Grid Dispatch Modeling Methodology Hourly demand forecast ... 12 Figure 4. Delhi Electricity Demand (non-‐BEV) for 2025 -‐ Average Daily Load Curves for each
season. ................................................................................................................................................................ 13 Figure 5. Load Duration Curves for Delhi for 2025 .................................................................................. 13 Figure 6. Average daily wind generation curve (fraction of the installed capacity) in Gujarat
and Rajasthan .................................................................................................................................................. 14 Figure 7. Average daily solar generation curve (simulated, as fraction of the installed
capacity) in the northern region ............................................................................................................. 15 Figure 8. Average Daily Two-‐wheeler BEV Charging (at 15% BEV penetration in Delhi) ...... 24 Figure 9. Average Daily BEV Charging Curve from Cars and Vans (at 15% BEV fleet
penetration in New Delhi) ......................................................................................................................... 25 Figure 10. Average Delhi Load Curve, January 2025 with 15% EV penetration and
unmanaged charging .................................................................................................................................... 26 Figure 11. Average Delhi Load Curve, July 2025 with 15% EV penetration and unmanaged
charging ............................................................................................................................................................. 26 Figure 12. Average Delhi Load Curve, January 2025 with 15% EV penetration and smart
charging ............................................................................................................................................................. 27 Figure 13. Average Delhi Load Curve, January 2025 with 15% EV penetration and smart
charging ............................................................................................................................................................. 27 Figure 14. Average EV load (smart and unmanaged charging scenarios) and renewable
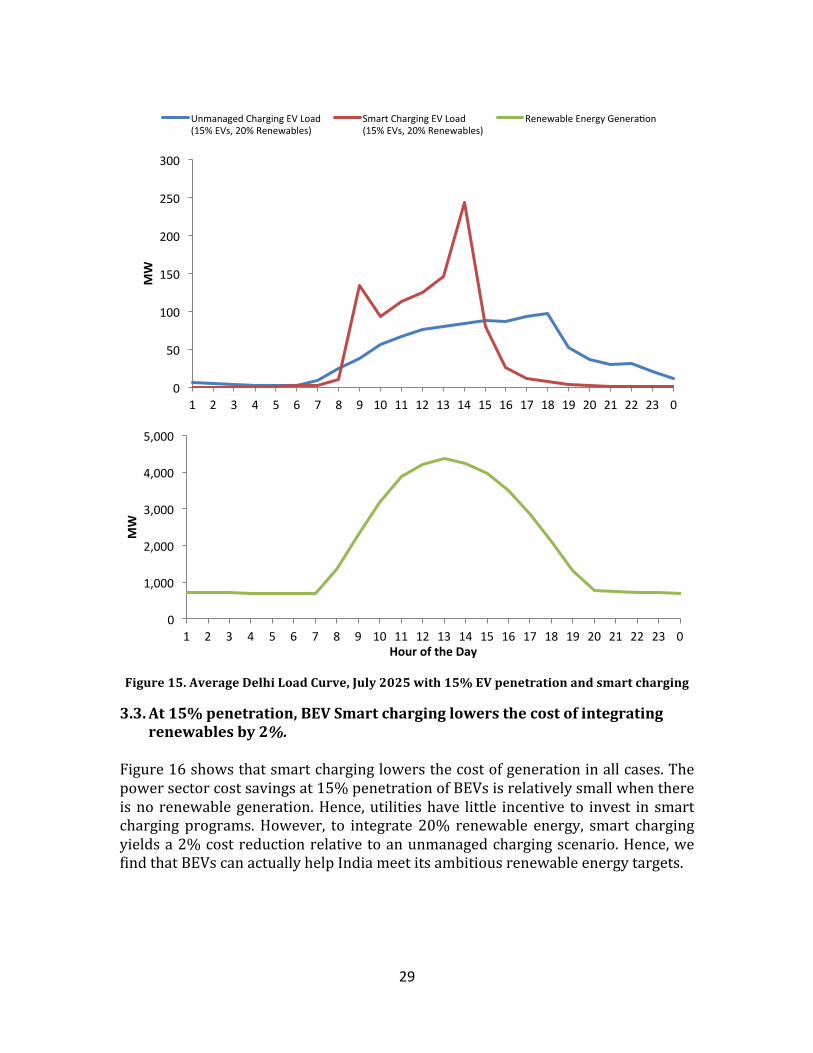
energy generation, January 2025 with 15% EV penetration and 20% renewables ....... 28 Figure 15. Average Delhi Load Curve, July 2025 with 15% EV penetration and smart
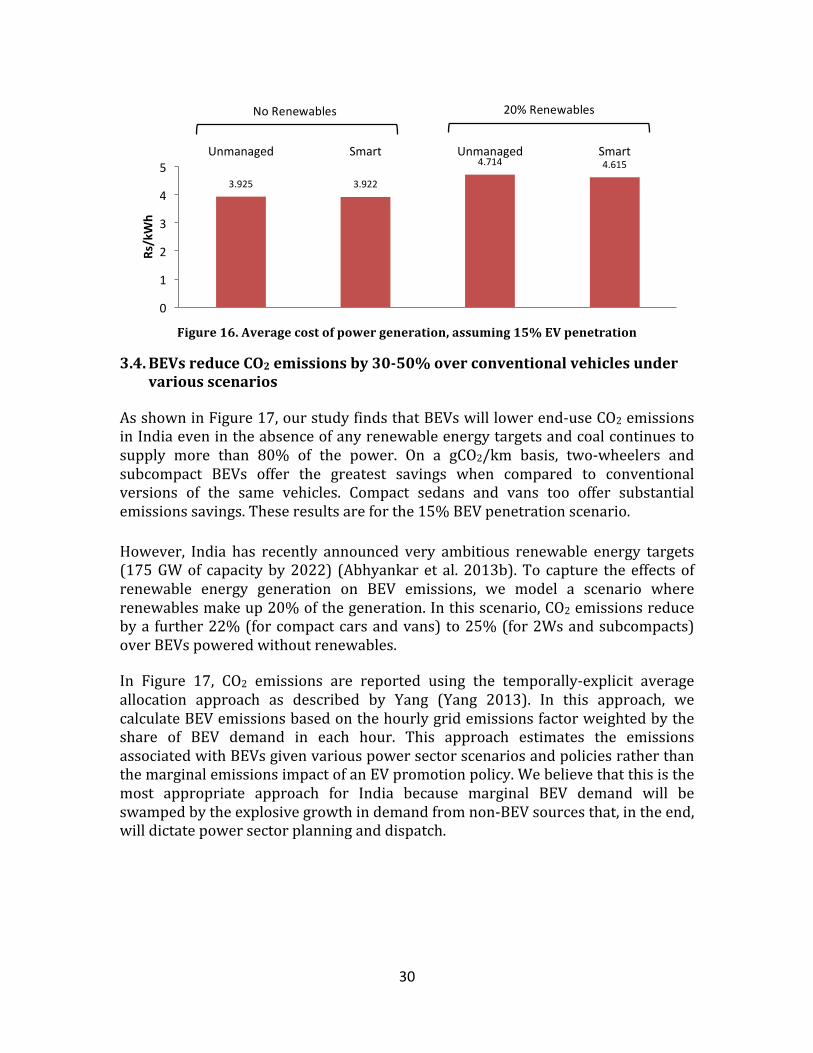
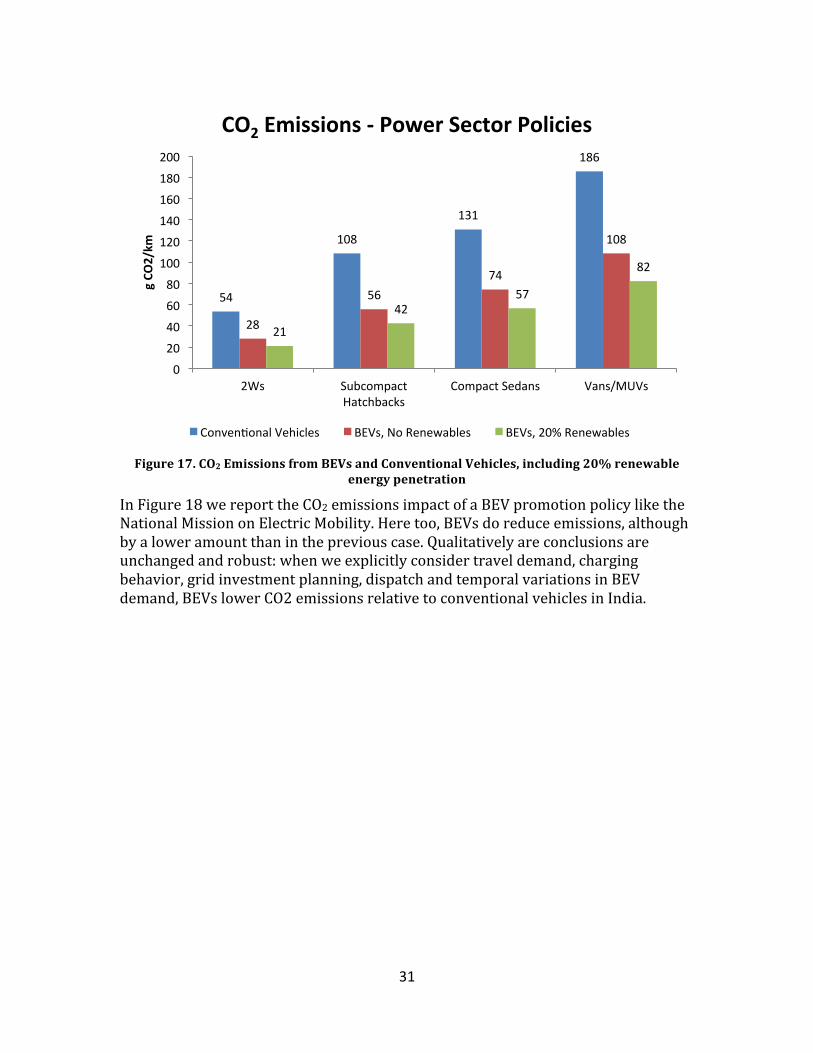
charging ............................................................................................................................................................. 29 Figure 16. Average cost of power generation, assuming 15% EV penetration ............................ 30 Figure 17. CO2 Emissions from BEVs and Conventional Vehicles, including 20% renewable
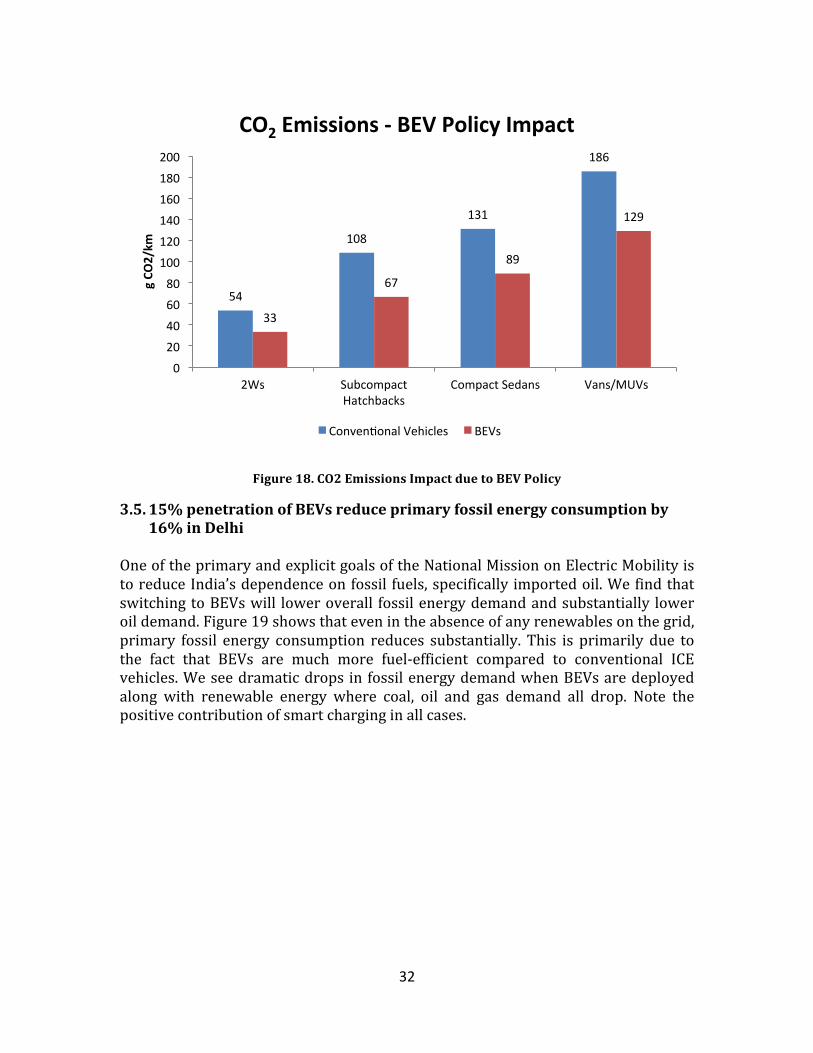
energy penetration ....................................................................................................................................... 31 Figure 18. CO2 Emissions Impact due to BEV Policy ............................................................................... 32 Figure 19. Change in Primary Fossil Energy Consumption at 15% BEV penetration ............... 33 Figure 20. Operating costs of BEVs and conventional vehicles ........................................................... 34

vi
List of Tables
Table 1. Stock of vehicles in New Delhi, 2025 ............................................................................................ 10 Table 2. Characteristics of EVSE assumed in the PEVI model. ............................................................ 10 Table 3. Existing Installed Capacity in Delhi (including allocations from the Central sector
plants) as of March 2015 ..................................................................................................................... 16 Table 4. Operational parameters of generating stations ....................................................................... 17 Table 5. Monthly Capacity Factors of Hydroelectric Projects in the Northern Region ............. 18 Table 6. Assumptions for capital cost and fixed O&M Cost of Power Plants ................................. 19 Table 7. Assumptions for fuel calorific values and prices ..................................................................... 19
1
Executive Summary India’s National Mission on Electric Mobility (NMEM) sets a countrywide goal of deploying 6 to 7 million hybrid and electric vehicles (EVs) by 2020. There are widespread concerns, both within and outside the government, that the Indian grid is not equipped to accommodate additional power demand from battery electric vehicles (BEVs). Such concerns are justified on the grounds of India’s notorious power sector problems pertaining to grid instability and chronic blackouts. Studies have claimed that deploying BEVs in India will only increase CO2 emissions because a majority (71% in 2011/2012) of India’s electricity generation comes from coal-‐fired power plants. In this study, we address the questions and concerns outlined above. First, we assess the grid impacts and economics of 5% and 15% BEV penetration in New Delhi. We assess the following scenarios, (1) BEV owners charge their vehicles whenever they desire without consideration for the cost of power provision in any hour, (2) BEVs are charged in a smart manner to reduce the cost of power provision in a scenario where there is no intermittent, renewable generation (solar and wind) and, (3) BEVs are smart charged to reduce the cost of power provision where 20% of the generation comes from wind and solar. Smart charging, for the purposes of this study, is altering the start time and length of BEV charging1 events within a 24-‐hour period to provide valued load-‐shifting without affecting the mobility needs of the BEV driver. Second, we also calculate the net greenhouse gas and primary energy impacts of increasing BEV penetration in New Delhi. Although our analysis focuses on New Delhi, for reasons we outline in the report, we believe that our conclusions can be extended to the nation as a whole. To answer these questions, we have developed an integrated modeling platform called Renewables and Electric Vehicles (REV). The REV model enables us to assess the benefits, costs, climate and primary energy impacts of battery electric vehicles when including power system planning, dispatch and the integration of renewable sources of electricity. The model considers real-‐world travel demand, based on origin-‐destination (O-‐D) data and travel surveys, and demographic data to project BEV adoption, driving and charging behavior. The key results from our study are:
1. Load growth from non-‐BEV sources is expected to be so rapid in Delhi that in 2025, even if BEVs made up 15% of the vehicle fleet, they would only add 1% to the peak daily power demand. Even this 1% increment to peak demand is almost entirely eliminated if smart charging of BEVs is implemented.
2. Due to the large number of two-‐wheelers, the flexibility in shifting charging periods is very high, implying a large smart charging potential. However, due to the very small share of BEV demand in 2025, smart charging does not
1 Throughout this paper, we do not consider the discharging of the vehicle battery into the grid, which is known as V2G. We only alter the timing and length of grid-‐to-‐vehicle charging events.
2
significantly lower overall power generation costs, if no renewable energy is added to the grid.
3. If renewables are added, BEV smart charging lowers the cost of integrating them into the grid by 2% (at 15% penetration level for BEVs). Hence, we find that promotion and deployment of BEVs will help instead of hurt the expansion of renewables in the Indian power sector.
4. BEVs reduce CO2 emissions by 30% to 50% over conventional vehicles in India. This result is in direct contradiction to some studies that only consider an average grid emissions factor and do not consider real-‐world Indian driving and charging behavior.
5. BEV operating costs in India are 6 to 10 times cheaper than conventional vehicle operating costs. This is significantly higher than the factor of 4 typically seen in the US.
In conclusion, we find that there are significant synergies between the National Mission on Electric Mobility, the National Smart Grid Mission and the National Renewable Energy Mission. Hence, we recommend that specific programs and policies under each Mission be developed in a coordinated manner.
3
1. Introduction India’s National Mission on Electric Mobility (NMEM) sets a countrywide goal of deploying 6 to 7 million hybrid and electric vehicles (EVs) by 2020 (Department of Heavy Industry, Government of India 2012). There are widespread concerns, both within and outside the government, that the Indian grid is not equipped to accommodate additional power demand from battery electric vehicles (BEVs). Such concerns are justified on the grounds of India’s notorious power sector problems pertaining to grid instability and chronic blackouts (Ahn, Sun-‐Joo and Graczyk, Dagmar 2012). The great Indian blackout of July 2012, which left 600 million people without power (Joshua J. Romero 2012), further exacerbated these concerns. The climate and environmental impacts of this level of EV deployment has also raised concerns, since a majority (71% in 2011/2012) of India’s electricity generation comes from coal-‐fired power plants (Ahn, Sun-‐Joo and Graczyk, Dagmar 2012). For example, Doucette and McCulloch (Doucette and McCulloch 2011) find that BEVs may increase CO2 emissions in India relative to conventional vehicles based on the average grid emissions factor. However, theirs, like many other studies that have been done in other regions, (Kennedy, Ibrahim, and Hoornweg 2014; MacPherson, Keoleian, and Kelly 2012; Hawkins, Gausen, and Strømman 2012; Campanari, Manzolini, and Garcia de la Iglesia 2009; McCleese and LaPuma 2002) do not model regional EV travel demand and charging, nor do they use a grid investment and dispatch model to estimate temporally-‐explicit emissions due to BEV charging. In this study, we address the questions and concerns outlined above. First, we assess the grid impacts and economics of 5% and 15% BEV penetration in New Delhi. We assess the following scenarios, (1) BEV owners charge their vehicles whenever they desire without providing any grid services, (2) BEVs are charged in a smart manner to provide support services to a grid that has no intermittent, renewable generation (solar and wind) and, (3) BEVs are smart charged to provide support services to a grid where 20% of the generation comes from wind and solar. Smart charging, for the purposes of this study, is altering the start time and length of BEV charging2 events within a 24-‐hour period to provide valued grid services without affecting the mobility needs of the BEV driver. Second, we also calculate the net greenhouse gas and primary energy impacts of increasing BEV penetration in New Delhi. Although our analysis focuses on New Delhi, for the following reasons, we believe that our conclusions can be extended to the nation as a whole for the levels of vehicle electrification that we study (up to 15% penetration):
1. Travel demand by mode and time of day in most medium and large Indian cities do not differ substantially from New Delhi (Bose 1998).
2. Growth in electricity demand from non-‐BEV sources (like air conditioners) will occur at a similar rate in other cities since incomes are rapidly growing in most cities (Phadke, Abhyankar, and Shah 2013).
2 Throughout this paper, we do not consider the discharging of the vehicle battery into the grid, which is known as V2G. We only alter the timing and length of grid-‐to-‐vehicle charging events.
4
3. The long-‐run marginal generation mix is likely to be similar in most parts of the country due to rapid build out of transmission capacity and regional uniformity in power plant costs by fuel (Abhyankar et al. 2013b).
4. Due to the massive concentrations of wealth and multi-‐modal transport demand in India’s medium and large cities, it is likely that almost all EV uptake over the next two decades will occur only in these cities (Das and Parikh 2004).
Grid Impacts and Benefits of BEVs 1.1. To better characterize the grid impacts and benefits of BEVs in India, our approach includes the following features:
• Using the best available data, projections and agent-‐based modeling techniques, we model the time dependence and magnitude of BEV charging load. Simply quantifying the total electricity requirements for vehicles is insufficient to study grid impacts.
• Using official government data, we project hourly electricity demand from sources other than BEVs.
• We customize an industry-‐standard grid dispatch and planning model (PLEXOS) for India and the New Delhi region to meet power demand on an hourly basis throughout the year.
• We use the same dispatch model to implement smart charging programs for BEVs to minimize the total cost of providing power without affecting the mobility needs of BEV drivers.
• We estimate the cost of integrating solar and wind generation into the grid with and without the smart charging of BEVs to assess if BEVs could lower the cost of integrating renewables into the grid in India.
We discuss the policy and regulatory gaps that need to be addressed in order to feasibly implement smart charging programs in India. Finally, although beyond the scope of this paper, we recognize that an array of smart grid technologies need to be deployed in India before any end-‐use smart charging or demand response programs can be designed.
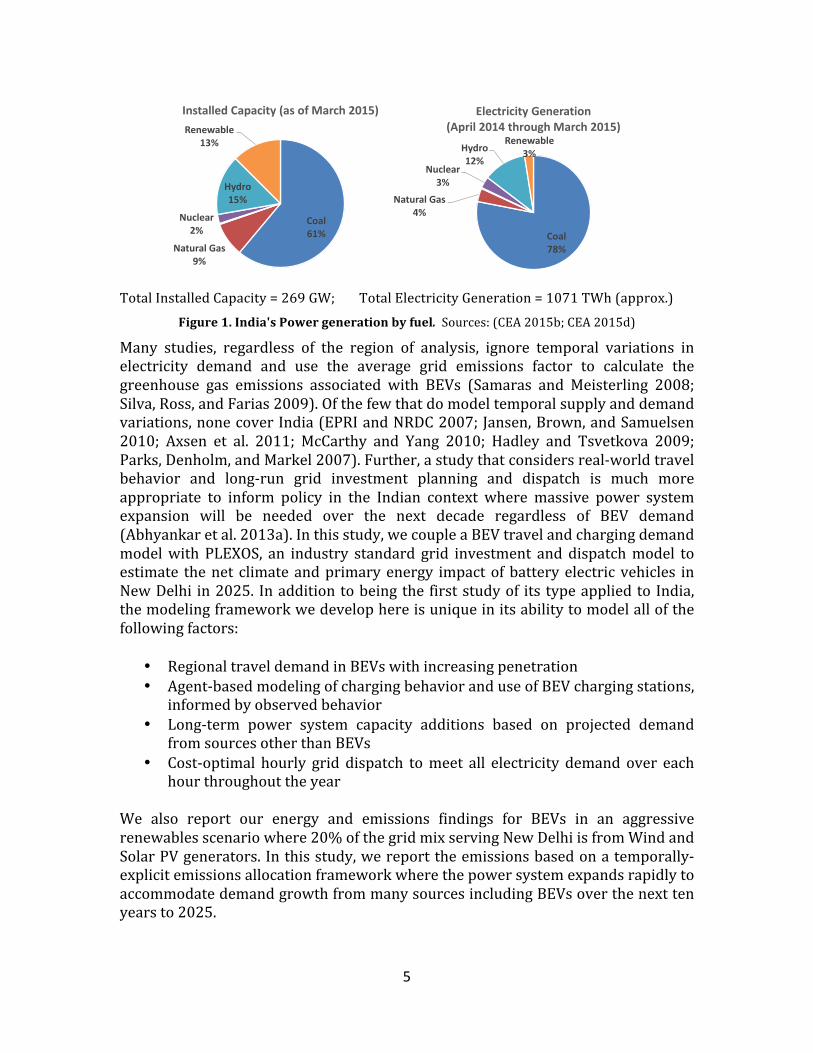
Climate and Primary Fossil Energy Impacts of BEVs 1.2. Fears that BEVs may increase CO2 emissions and primary fossil energy use compared to equivalent use by conventional vehicles are mostly based on India’s current grid fuel mix and expectations of continued dominance of coal for the foreseeable future. Currently, power generation in India is dominated by coal, both in terms of installed capacity and generated electricity (see Figure 1). As mentioned previously, the sparse literature available on this topic suggests that this kind of grid fuel mix may actually increase, rather than decrease, CO2/km emissions if BEVs replace conventional cars (Doucette and McCulloch 2011).
5
Total Installed Capacity = 269 GW; Total Electricity Generation = 1071 TWh (approx.) Figure 1. India's Power generation by fuel. Sources: (CEA 2015b; CEA 2015d)
Many studies, regardless of the region of analysis, ignore temporal variations in electricity demand and use the average grid emissions factor to calculate the greenhouse gas emissions associated with BEVs (Samaras and Meisterling 2008; Silva, Ross, and Farias 2009). Of the few that do model temporal supply and demand variations, none cover India (EPRI and NRDC 2007; Jansen, Brown, and Samuelsen 2010; Axsen et al. 2011; McCarthy and Yang 2010; Hadley and Tsvetkova 2009; Parks, Denholm, and Markel 2007). Further, a study that considers real-‐world travel behavior and long-‐run grid investment planning and dispatch is much more appropriate to inform policy in the Indian context where massive power system expansion will be needed over the next decade regardless of BEV demand (Abhyankar et al. 2013a). In this study, we couple a BEV travel and charging demand model with PLEXOS, an industry standard grid investment and dispatch model to estimate the net climate and primary energy impact of battery electric vehicles in New Delhi in 2025. In addition to being the first study of its type applied to India, the modeling framework we develop here is unique in its ability to model all of the following factors:
• Regional travel demand in BEVs with increasing penetration • Agent-‐based modeling of charging behavior and use of BEV charging stations,
informed by observed behavior • Long-‐term power system capacity additions based on projected demand
from sources other than BEVs • Cost-‐optimal hourly grid dispatch to meet all electricity demand over each
hour throughout the year
We also report our energy and emissions findings for BEVs in an aggressive renewables scenario where 20% of the grid mix serving New Delhi is from Wind and Solar PV generators. In this study, we report the emissions based on a temporally-‐explicit emissions allocation framework where the power system expands rapidly to accommodate demand growth from many sources including BEVs over the next ten years to 2025.
Coal61%
Natural Gas9%
Nuclear2%
Hydro15%
Renewable13%
Installed Capacity (as of March 2015)
Coal78%
Natural Gas4%
Nuclear3%
Hydro12%
Renewable3%
Electricity Generation (April 2014 through March 2015)
6
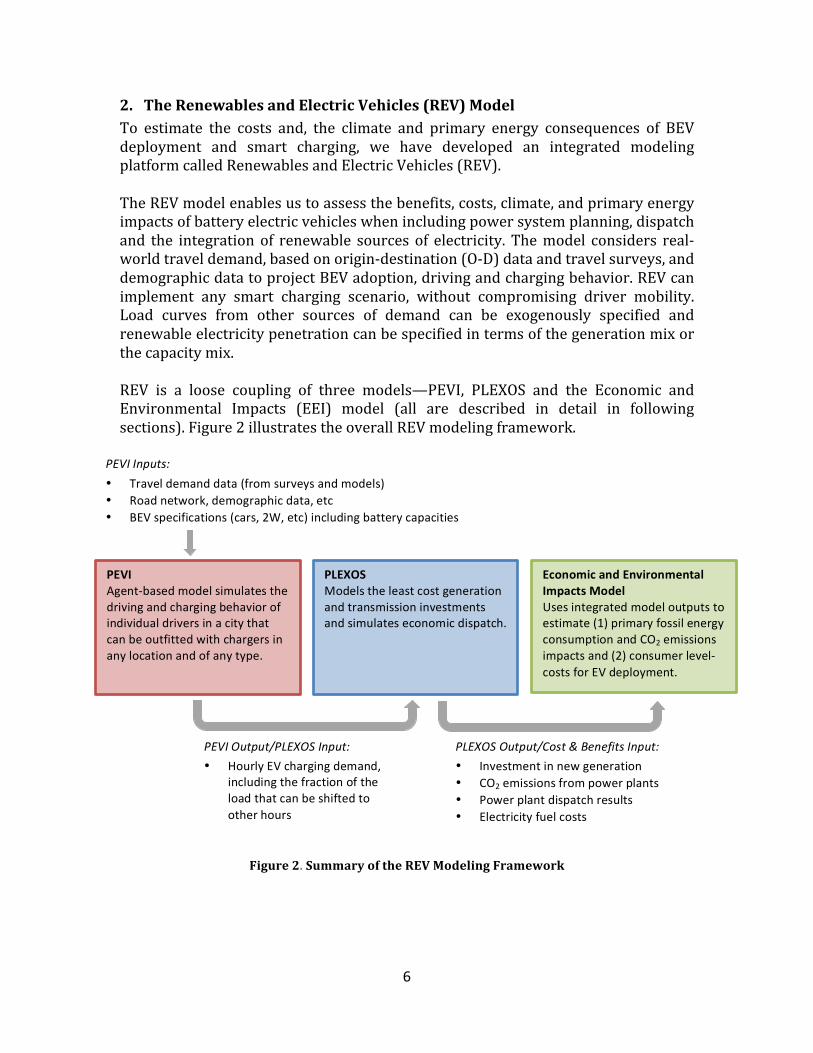
2. The Renewables and Electric Vehicles (REV) Model To estimate the costs and, the climate and primary energy consequences of BEV deployment and smart charging, we have developed an integrated modeling platform called Renewables and Electric Vehicles (REV). The REV model enables us to assess the benefits, costs, climate, and primary energy impacts of battery electric vehicles when including power system planning, dispatch and the integration of renewable sources of electricity. The model considers real-‐world travel demand, based on origin-‐destination (O-‐D) data and travel surveys, and demographic data to project BEV adoption, driving and charging behavior. REV can implement any smart charging scenario, without compromising driver mobility. Load curves from other sources of demand can be exogenously specified and renewable electricity penetration can be specified in terms of the generation mix or the capacity mix. REV is a loose coupling of three models—PEVI, PLEXOS and the Economic and Environmental Impacts (EEI) model (all are described in detail in following sections). Figure 2 illustrates the overall REV modeling framework.
Figure 2. Summary of the REV Modeling Framework
PEVI Output/PLEXOS Input: • Hourly EV charging demand,
including the fraction of the load that can be shifted to other hours
PEVI Agent-‐based model simulates the driving and charging behavior of individual drivers in a city that can be outfitted with chargers in any location and of any type.
PLEXOS Models the least cost generation and transmission investments and simulates economic dispatch.
Economic and Environmental Impacts Model Uses integrated model outputs to estimate (1) primary fossil energy consumption and CO2 emissions impacts and (2) consumer level-‐costs for EV deployment.
PEVI Inputs: • Travel demand data (from surveys and models) • Road network, demographic data, etc • BEV specifications (cars, 2W, etc) including battery capacities
PLEXOS Output/Cost & Benefits Input: • Investment in new generation • CO2 emissions from power plants • Power plant dispatch results • Electricity fuel costs
7
For this study, we utilize the REV model to evaluate BEV grid, energy and climate impacts in New Delhi, though it’s important to note that this framework can be used anywhere depending on data availability. We model BEV penetrations of 5%, 10%, and 15% of the Delhi vehicle fleet in the year 2025. We choose 2025 as our simulation year because it is an aggressive but realistic target year where high BEV penetration in New Delhi could be achieved. The choice of an appropriate simulation year in India is especially important due to rapid growth in electricity demand from other sources. Hence, any analysis based on current power demand for scenarios with significant BEV penetration would be largely meaningless.
PEV Infrastructure (PEVI) Model 2.1.2.1.1. Model Overview We used the Plug-‐in Electric Vehicle Infrastructure Model (PEVI) to develop projections of aggregate charging demand profiles for the national capital territory (NCT) of Delhi in the year 2025. PEVI is an agent-‐based model that simulates the driving and charging behavior of individual drivers in a virtual road network that can be outfitted with public and private charging infrastructure of any type (i.e. Level 1, Level 2, or DC Fast). Given the need to model future charging behavior, we first use ward-‐level demographic data from the Indian census to spatially model the adoption of BEVs in New Delhi with increasing penetration. We then run PEVI to site chargers throughout the region to achieve the least-‐cost minimization of the negative experiences of drivers (schedule delays and strandings).
Siting EV charging infrastructure in a realistic and cost-‐effective manner requires that the planner address the following questions:
• Where do PEV drivers live? • Where and when do they drive? • How long do they spend at their destinations? • If drivers have a choice of EVSE to use, which will they choose? • How do drivers impact each other’s access to EVSE? • How do drivers adapt when they need a charge but no station is available? • How will a given deployment of EVSE improve the experience of drivers?
Can we quantify the improvement?
PEVI is capable of simultaneously addressing all of the above considerations for any metropolitan region by providing a flexible and powerful agent-‐based framework for evaluating the impact of infrastructure on PEV drivers’ experiences. Building any agent-‐based model consists of the following key steps:
1. Create a virtual environment. 2. Create virtual agents with a set of rules describing how to interact with the
environment and with each other. 3. Place the agents in the environment and let the system evolve according to
the rules.
8
4. Observe what happens.
In this case, the virtual environment is the Delhi regional road network, including the charging infrastructure. The agents are the PEV drivers. Drivers interact with the environment according to the following rules:
• Every driver is given a vehicle with configurable properties such battery capacity and fuel economy.
• Each driver follows a unique daily itinerary, i.e., a table of times and destinations defining when and where he or she will attempt to travel.
• If drivers need fuel to complete their next trip (or, in some cases, to complete the remaining trips in their itinerary) then they attempt to charge.
• Drivers also attempt to charge even if they don’t need the energy; this occurs according to a stochastic process generated from observed behavior.
• Drivers choose which EVSE to use based on minimizing their cost. This decision includes the fee for using the charger and, if the driver must make an unplanned stop or is delayed, the value of the driver’s time ($3.80/hour).
• Some drivers have a charger at home and elect to charge at the end of the day according to a stochastic process generated from observed behavior.
The model simulates four days of driving, and any delays or changes to driver itineraries are tracked. At the end of a model run, the experience of individual drivers can be examined or the entire run can be summarized by a variety of metrics.
PEVI is a stochastic model, meaning that a variety of processes and decisions within the model are based on probability distribution functions. The primary purpose of including stochastic processes in PEVI is to avoid reaching conclusions that are overly customized to suit one particular scenario. Instead, the model is run many times with the same set of initial conditions and the average benefit of a given EVSE infrastructure is calculated.
The utility of such a model is intimately linked to the quality of the data used to drive simulations. As described below, it was possible to procure the best available region-‐specific data, allowing us to base the analysis on travel patterns specific to Delhi.
2.1.2. National Capital Territory (NCT) of Delhi The region of application of the EV charger siting analysis was the NCT of Delhi, India. The metropolitan area covers 1400 square kilometers containing over 2300 kilometers of paved road surfaces. In 2008, 52% of households owned a motorized vehicle and 19% owned a car. Residents traveled approximately 22 million kilometers per day in cars and taxis, about 19% of total daily travel (RITES 2005).
Several general-‐purpose transportation-‐planning studies have been commissioned by the NCT of Delhi. With the generous support of members of the Government of
9
India and staff at RITES Ltd, we were able to acquire projections to 2021 of travel intensities throughout the Delhi metropolitan area. In addition, our team procured results from the most recent household travel survey, containing over 45,000 responses by Delhi residents (RITES and MVA Asia 2008).
These data products were primarily used to develop a set of travel itineraries that define the daily driving patterns of individuals. The itineraries were constructed using a non-‐parametric resampling technique, which simultaneously preserves the projected 2021 geographic travel patterns of Delhi and the temporal patterns of the survey respondents (particularly time of travel and dwell duration between trips).
The itineraries that drivers follow are based on two critical sources of data: 1) results from the most recent travel demand model (RITES 2005) commissioned by the NCT of Delhi and implemented by RITES Ltd., and 2) results from the most recent household travel survey with 45,000 respondents (RITES and MVA Asia 2008). A stochastic, non-‐parametric resampling technique was used to blend these two data sources into dozens of unique sets of itineraries, which were used in the context of Monte Carlo simulation to include a suitable amount of variability in the analysis. In addition, data from The EV Project were used in the development of probability distributions that characterize aspects of driver behavior as well as for model calibration (Ecotality 2013).
During a model run, drivers attempt to execute their travel itineraries by following their behavioral rule set. The experience of every driver is traceable in full detail, charging events are tracked temporally and spatially, inconvenience experienced by drivers is logged, and the model run can be summarized across a variety of metrics.
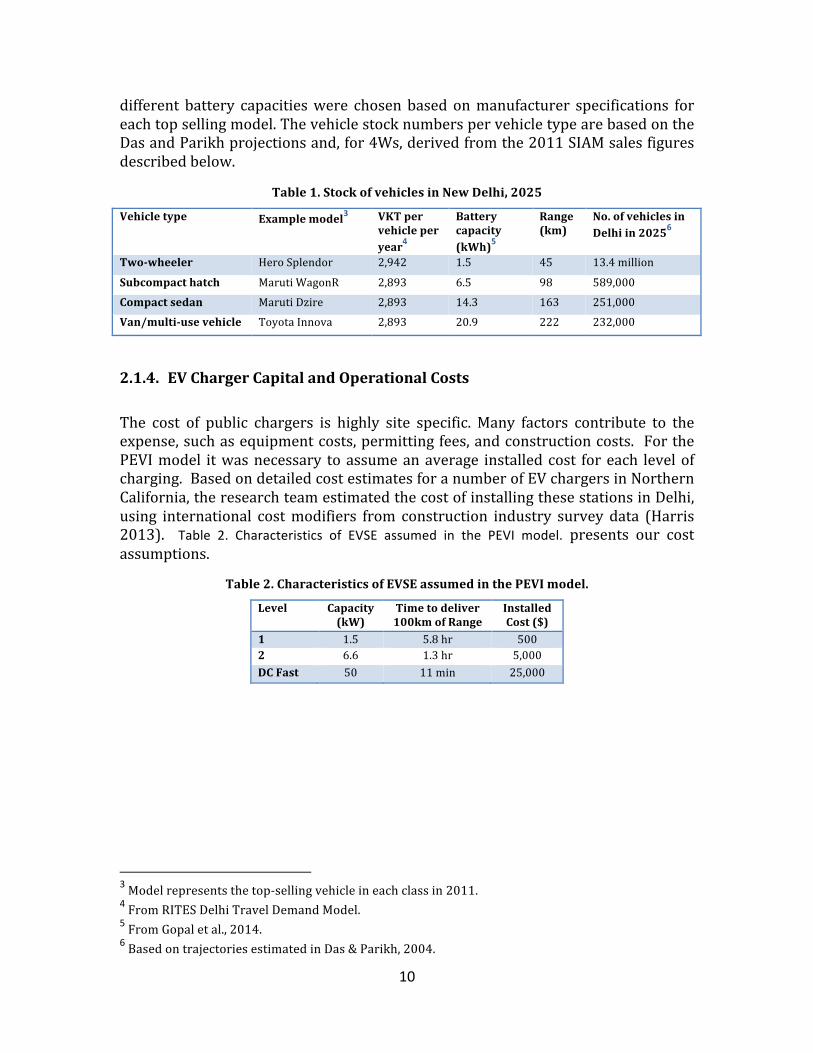
2.1.3. 2025 Delhi Vehicle Stock and Characteristics Total vehicle stock in our study is based on Delhi-‐specific projections published by Das and Parikh (Das and Parikh 2004). The econometric model used to estimate vehicle stock in 2005, 2010, 2015, and 2020 considers six different types of vehicles: two wheelers, cars and jeeps, three wheelers, taxis, buses, and goods vehicles. For our study, we focus only on two-‐wheelers (2Ws) and passenger four-‐wheelers (4Ws) since those are the primary targets of vehicle electrification. Additionally, since we are concerned with 2025, we use logarithmic extrapolation to estimate total 2W and 4W vehicle stock five years beyond what Das and Parikh estimate. Our study breaks down 4Ws into three different classes of vehicles: subcompact hatchbacks, compact sedans, and vans/multi-‐use vehicles. These classes and the market share of each are derived from 2011 vehicle sales data originally published by the Society of Indian Automobile Manufacturers (SIAM) and correspond to the three top selling vehicle classes in 2011 (SIAM 2011). Table 1 below illustrates the vehicle-‐specific characteristics that we used to model vehicles in PEVI and also to conduct analyses highlighted in the Results section. The VKT/year numbers come from the same RITES data discussed above and the four
10
different battery capacities were chosen based on manufacturer specifications for each top selling model. The vehicle stock numbers per vehicle type are based on the Das and Parikh projections and, for 4Ws, derived from the 2011 SIAM sales figures described below.
Table 1. Stock of vehicles in New Delhi, 2025
Vehicle type Example model3 VKT per vehicle per year4
Battery capacity (kWh)5
Range (km)
No. of vehicles in Delhi in 20256
Two-‐wheeler Hero Splendor 2,942 1.5 45 13.4 million
Subcompact hatch Maruti WagonR 2,893 6.5 98 589,000
Compact sedan Maruti Dzire 2,893 14.3 163 251,000
Van/multi-‐use vehicle Toyota Innova 2,893 20.9 222 232,000
2.1.4. EV Charger Capital and Operational Costs The cost of public chargers is highly site specific. Many factors contribute to the expense, such as equipment costs, permitting fees, and construction costs. For the PEVI model it was necessary to assume an average installed cost for each level of charging. Based on detailed cost estimates for a number of EV chargers in Northern California, the research team estimated the cost of installing these stations in Delhi, using international cost modifiers from construction industry survey data (Harris 2013). Table 2. Characteristics of EVSE assumed in the PEVI model. presents our cost assumptions.
Table 2. Characteristics of EVSE assumed in the PEVI model.
Level Capacity (kW)
Time to deliver 100km of Range
Installed Cost ($)
1 1.5 5.8 hr 500 2 6.6 1.3 hr 5,000 DC Fast 50 11 min 25,000
3 Model represents the top-‐selling vehicle in each class in 2011. 4 From RITES Delhi Travel Demand Model. 5 From Gopal et al., 2014. 6 Based on trajectories estimated in Das & Parikh, 2004.

11
2.1.5. Optimal Siting of Charging Infrastructure The PEVI model provides a quantitative basis for evaluating the efficacy of a given deployment of chargers throughout the region. A gradient descent optimization algorithm is then employed to determine the set of chargers that provide the biggest benefit to PEV drivers for a given amount of public investment. The objective of the optimization is to minimize the monetary cost of delay for drivers by installing charging infrastructure. The cost metric is calculated as the present value of 10-‐years of driver delay encountered with a given infrastructure portfolio7. Beginning with zero installed public chargers, the algorithm sequentially evaluates siting options at every potential location and charger level. The alternative selected is the one that provides the largest reduction in driver delay per dollar spent on infrastructure8. The siting process stops when the return on investment has been sufficiently diminished: when the reduction in overall cost becomes less than one dollar per dollar spent on infrastructure.
For more information on the PEVI model, the optimization process, and key model assumptions, see our report from last year (Gopal et al. 2014).
2.1.6. Producing Charging Profiles for PLEXOS The infrastructure portfolio resulting from the optimization described above is used in a final PEVI simulation to estimate the hourly aggregate electricity demand for charging across the NCT of Delhi. In addition to producing hourly charging profiles, we also use the PEVI model outputs to estimate the amount of energy demand that can be shifted to other hours without affecting mobility needs. This estimation involves tracking the travel and charging behavior of each driver and disaggregating all energy charged into one of two categories, energy that is “essential” and “non-‐essential” for each daily itinerary. For example, if a driver has a 20km trip approaching but only 10km of range remaining in their vehicle, they will engage in a charging session. If that charging session adds 20km of range, then half of the delivered energy is considered essential and the other half is considered non-‐essential. As described below, these outputs are used by the PLEXOS model to simulate scenarios where smart charging mechanisms shift non-‐essential EV charging into less expensive hours of the day.
7 A period of 10 years is assumed as representative of the lifetime of EV charging stations. 8 The change in the objective is normalized by the cost of the infrastructure in order to account for the difference in cost between charging levels.
12
Grid Planning and Dispatch Model: PLEXOS 2.2.
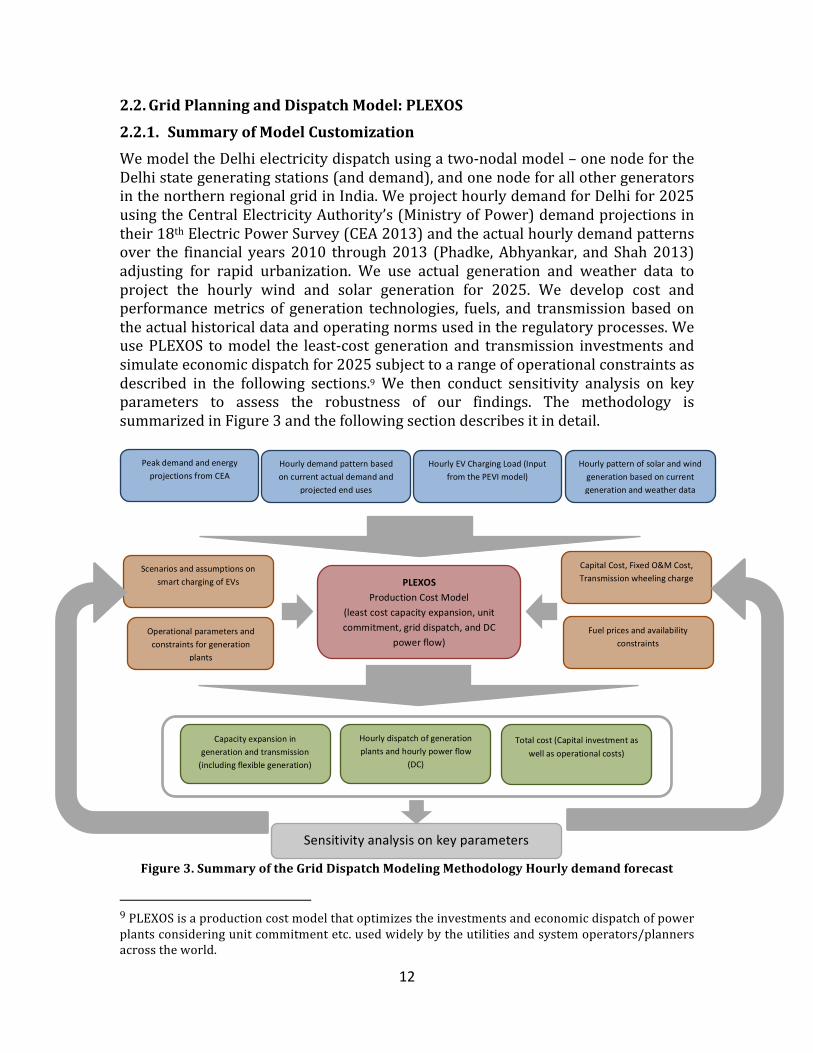
2.2.1. Summary of Model Customization We model the Delhi electricity dispatch using a two-‐nodal model – one node for the Delhi state generating stations (and demand), and one node for all other generators in the northern regional grid in India. We project hourly demand for Delhi for 2025 using the Central Electricity Authority’s (Ministry of Power) demand projections in their 18th Electric Power Survey (CEA 2013) and the actual hourly demand patterns over the financial years 2010 through 2013 (Phadke, Abhyankar, and Shah 2013) adjusting for rapid urbanization. We use actual generation and weather data to project the hourly wind and solar generation for 2025. We develop cost and performance metrics of generation technologies, fuels, and transmission based on the actual historical data and operating norms used in the regulatory processes. We use PLEXOS to model the least-‐cost generation and transmission investments and simulate economic dispatch for 2025 subject to a range of operational constraints as described in the following sections.9 We then conduct sensitivity analysis on key parameters to assess the robustness of our findings. The methodology is summarized in Figure 3 and the following section describes it in detail.
Figure 3. Summary of the Grid Dispatch Modeling Methodology Hourly demand forecast
9 PLEXOS is a production cost model that optimizes the investments and economic dispatch of power plants considering unit commitment etc. used widely by the utilities and system operators/planners across the world.
Hourly demand pattern based on current actual demand and
projected end uses
Peak demand and energy projections from CEA
Capital Cost, Fixed O&M Cost, Transmission wheeling charge
Scenarios and assumptions on smart charging of EVs
Hourly dispatch of generation plants and hourly power flow
(DC)
Capacity expansion in generation and transmission (including flexible generation)
Hourly pattern of solar and wind generation based on current generation and weather data
Total cost (Capital investment as well as operational costs)
PLEXOS Production Cost Model
(least cost capacity expansion, unit commitment, grid dispatch, and DC
power flow) Operational parameters and constraints for generation
plants
Fuel prices and availability constraints
Sensitivity analysis on key parameters
Hourly EV Charging Load (Input from the PEVI model)
13
(a) Summer (April-‐May) (b) Monsoon (June-‐August) (c) Winter (Dec-‐Feb)
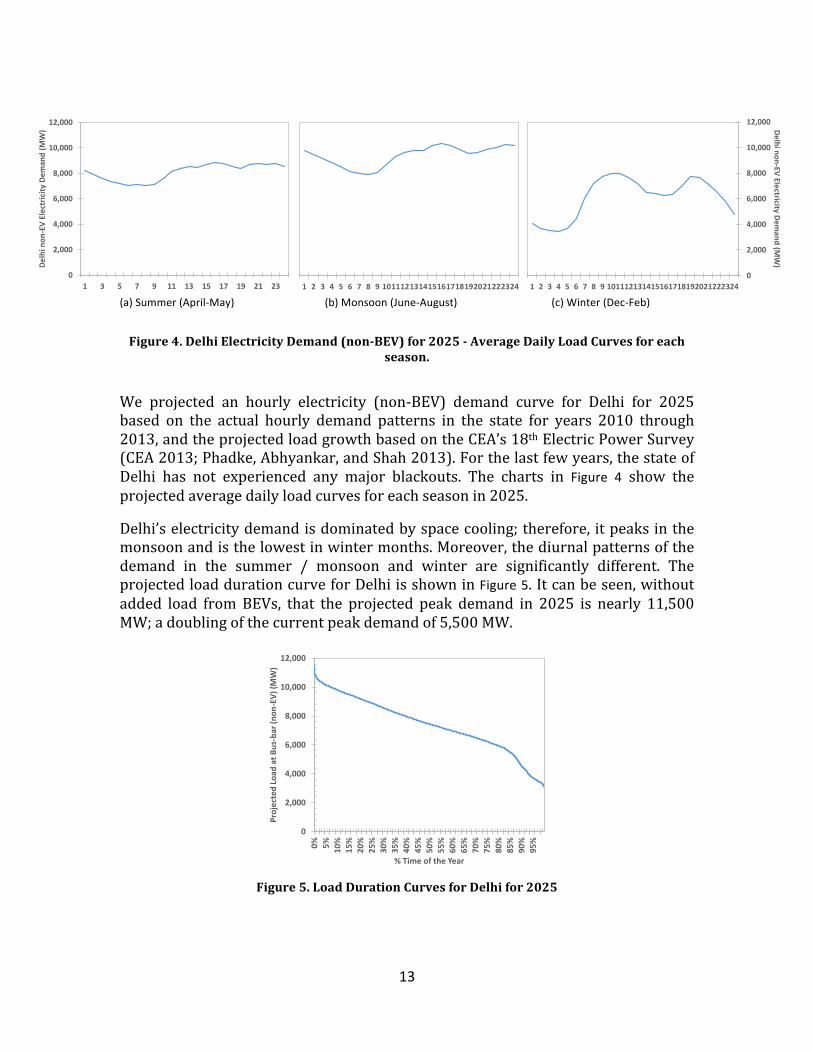
Figure 4. Delhi Electricity Demand (non-‐BEV) for 2025 -‐ Average Daily Load Curves for each season.
We projected an hourly electricity (non-‐BEV) demand curve for Delhi for 2025 based on the actual hourly demand patterns in the state for years 2010 through 2013, and the projected load growth based on the CEA’s 18th Electric Power Survey (CEA 2013; Phadke, Abhyankar, and Shah 2013). For the last few years, the state of Delhi has not experienced any major blackouts. The charts in Figure 4 show the projected average daily load curves for each season in 2025. Delhi’s electricity demand is dominated by space cooling; therefore, it peaks in the monsoon and is the lowest in winter months. Moreover, the diurnal patterns of the demand in the summer / monsoon and winter are significantly different. The projected load duration curve for Delhi is shown in Figure 5. It can be seen, without added load from BEVs, that the projected peak demand in 2025 is nearly 11,500 MW; a doubling of the current peak demand of 5,500 MW.
Figure 5. Load Duration Curves for Delhi for 2025
0
2,000
4,000
6,000
8,000
10,000
12,000
1 3 5 7 9 11 13 15 17 19 21 23
Delhi non
-‐EV Electricity
Dem
and (M
W)
1 2 3 4 5 6 7 8 9 1011121314151617181920212223240
2,000
4,000
6,000
8,000
10,000
12,000
1 2 3 4 5 6 7 8 9 101112131415161718192021222324
Delhi non-‐EV Electricity Demand (M
W)
0
2,000
4,000
6,000
8,000
10,000
12,000
0% 5% 10%
15%
20%
25%
30%
35%
40%
45%
50%
55%
60%
65%
70%
75%
80%
85%
90%
95%
Projected Load
at B
us-‐bar (n
on-‐EV) (M
W)
% Time of the Year
14
2.2.2. Hourly solar and wind generation forecast 2.2.2.1. Wind Energy Generation Profiles
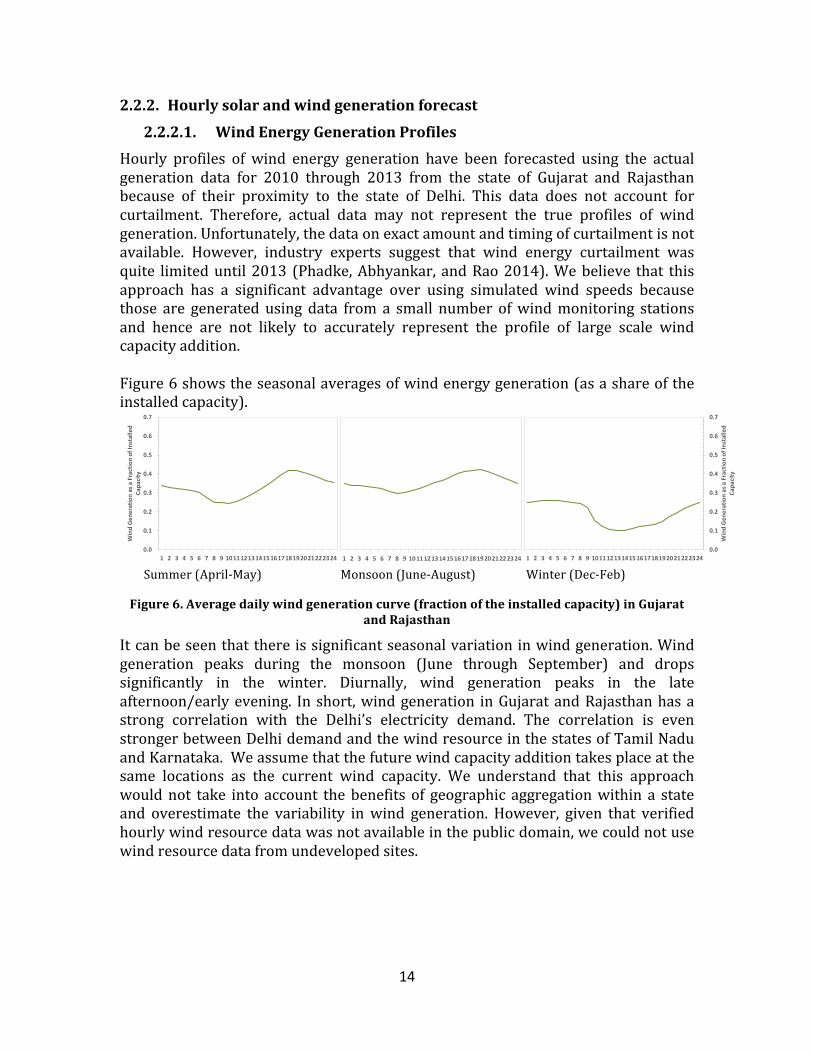
Hourly profiles of wind energy generation have been forecasted using the actual generation data for 2010 through 2013 from the state of Gujarat and Rajasthan because of their proximity to the state of Delhi. This data does not account for curtailment. Therefore, actual data may not represent the true profiles of wind generation. Unfortunately, the data on exact amount and timing of curtailment is not available. However, industry experts suggest that wind energy curtailment was quite limited until 2013 (Phadke, Abhyankar, and Rao 2014). We believe that this approach has a significant advantage over using simulated wind speeds because those are generated using data from a small number of wind monitoring stations and hence are not likely to accurately represent the profile of large scale wind capacity addition. Figure 6 shows the seasonal averages of wind energy generation (as a share of the installed capacity).
Summer (April-‐May) Monsoon (June-‐August) Winter (Dec-‐Feb) Figure 6. Average daily wind generation curve (fraction of the installed capacity) in Gujarat
and Rajasthan
It can be seen that there is significant seasonal variation in wind generation. Wind generation peaks during the monsoon (June through September) and drops significantly in the winter. Diurnally, wind generation peaks in the late afternoon/early evening. In short, wind generation in Gujarat and Rajasthan has a strong correlation with the Delhi’s electricity demand. The correlation is even stronger between Delhi demand and the wind resource in the states of Tamil Nadu and Karnataka. We assume that the future wind capacity addition takes place at the same locations as the current wind capacity. We understand that this approach would not take into account the benefits of geographic aggregation within a state and overestimate the variability in wind generation. However, given that verified hourly wind resource data was not available in the public domain, we could not use wind resource data from undeveloped sites.
0.0
0.1
0.2
0.3
0.4
0.5
0.6
0.7
1 2 3 4 5 6 7 8 9 101112131415161718192021222324
Wind Gen
eration as a Fraction of In
stalled
Capa
city
1 2 3 4 5 6 7 8 9 1011121314151617181920212223240.0
0.1
0.2
0.3
0.4
0.5
0.6
0.7
1 2 3 4 5 6 7 8 9 101112131415161718192021222324
Wind Gen
eration as a Fraction of In
stalled
Capa
city
15
2.2.2.2. Solar Energy Generation Profiles
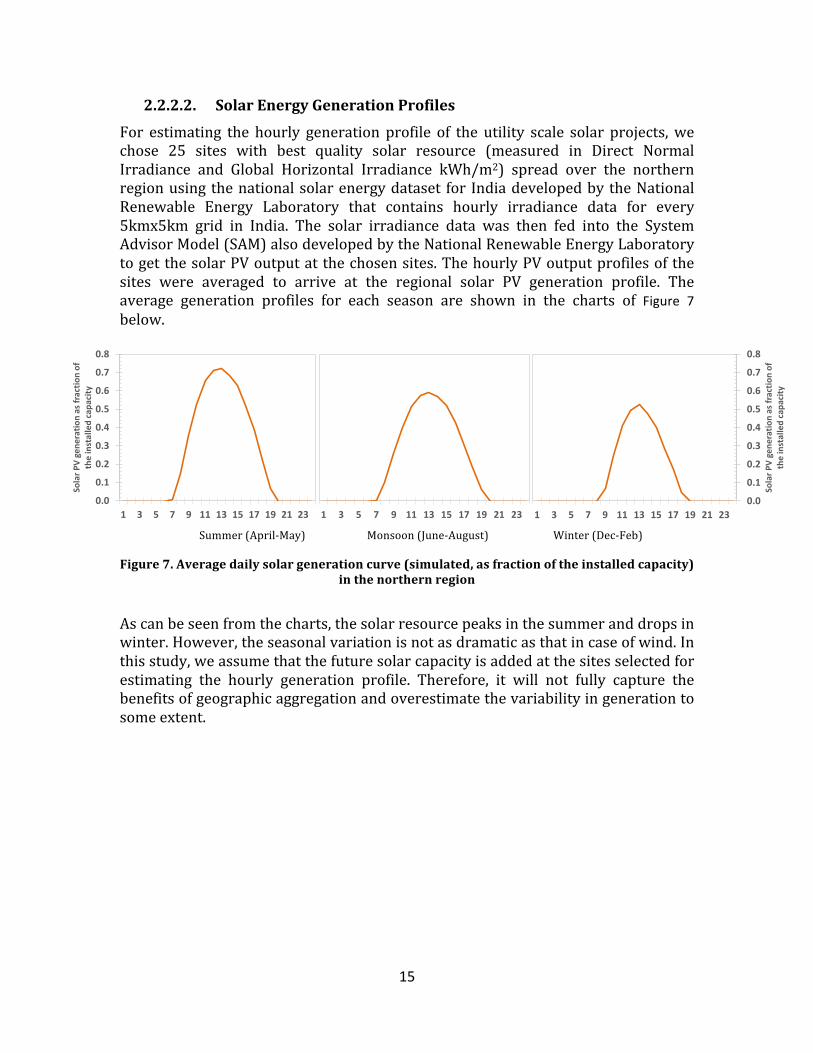
For estimating the hourly generation profile of the utility scale solar projects, we chose 25 sites with best quality solar resource (measured in Direct Normal Irradiance and Global Horizontal Irradiance kWh/m2) spread over the northern region using the national solar energy dataset for India developed by the National Renewable Energy Laboratory that contains hourly irradiance data for every 5kmx5km grid in India. The solar irradiance data was then fed into the System Advisor Model (SAM) also developed by the National Renewable Energy Laboratory to get the solar PV output at the chosen sites. The hourly PV output profiles of the sites were averaged to arrive at the regional solar PV generation profile. The average generation profiles for each season are shown in the charts of Figure 7 below.
Summer (April-‐May) Monsoon (June-‐August) Winter (Dec-‐Feb) Figure 7. Average daily solar generation curve (simulated, as fraction of the installed capacity)
in the northern region
As can be seen from the charts, the solar resource peaks in the summer and drops in winter. However, the seasonal variation is not as dramatic as that in case of wind. In this study, we assume that the future solar capacity is added at the sites selected for estimating the hourly generation profile. Therefore, it will not fully capture the benefits of geographic aggregation and overestimate the variability in generation to some extent.
0.0
0.1
0.2
0.3
0.4
0.5
0.6
0.7
0.8
1 3 5 7 9 11 13 15 17 19 21 23
Solar P
V gene
ratio
n as fractio
n of
the installed capa
city
1 3 5 7 9 11 13 15 17 19 21 230.0
0.1
0.2
0.3
0.4
0.5
0.6
0.7
0.8
1 3 5 7 9 11 13 15 17 19 21 23
Solar P
V gene
ratio
n as fractio
n of
the installed capa
city
16
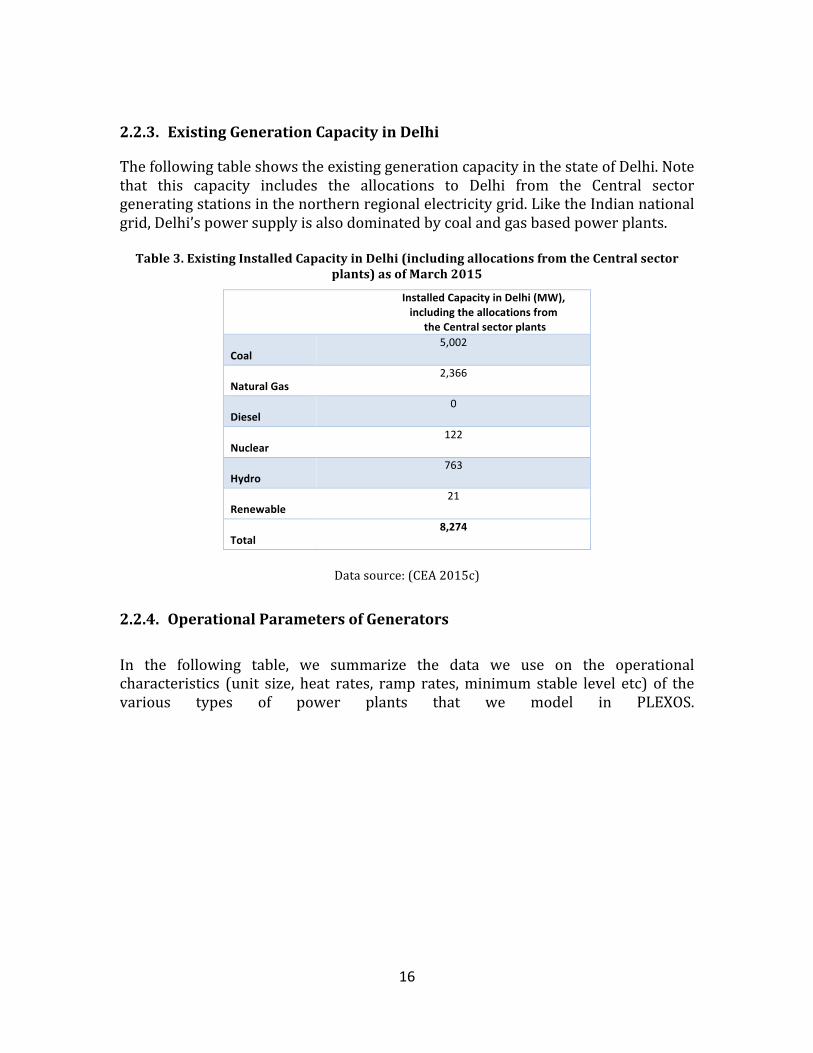
2.2.3. Existing Generation Capacity in Delhi
The following table shows the existing generation capacity in the state of Delhi. Note that this capacity includes the allocations to Delhi from the Central sector generating stations in the northern regional electricity grid. Like the Indian national grid, Delhi’s power supply is also dominated by coal and gas based power plants. Table 3. Existing Installed Capacity in Delhi (including allocations from the Central sector
plants) as of March 2015
Installed Capacity in Delhi (MW), including the allocations from the Central sector plants
Coal 5,002
Natural Gas 2,366
Diesel 0
Nuclear 122
Hydro 763
Renewable 21
Total 8,274
Data source: (CEA 2015c)
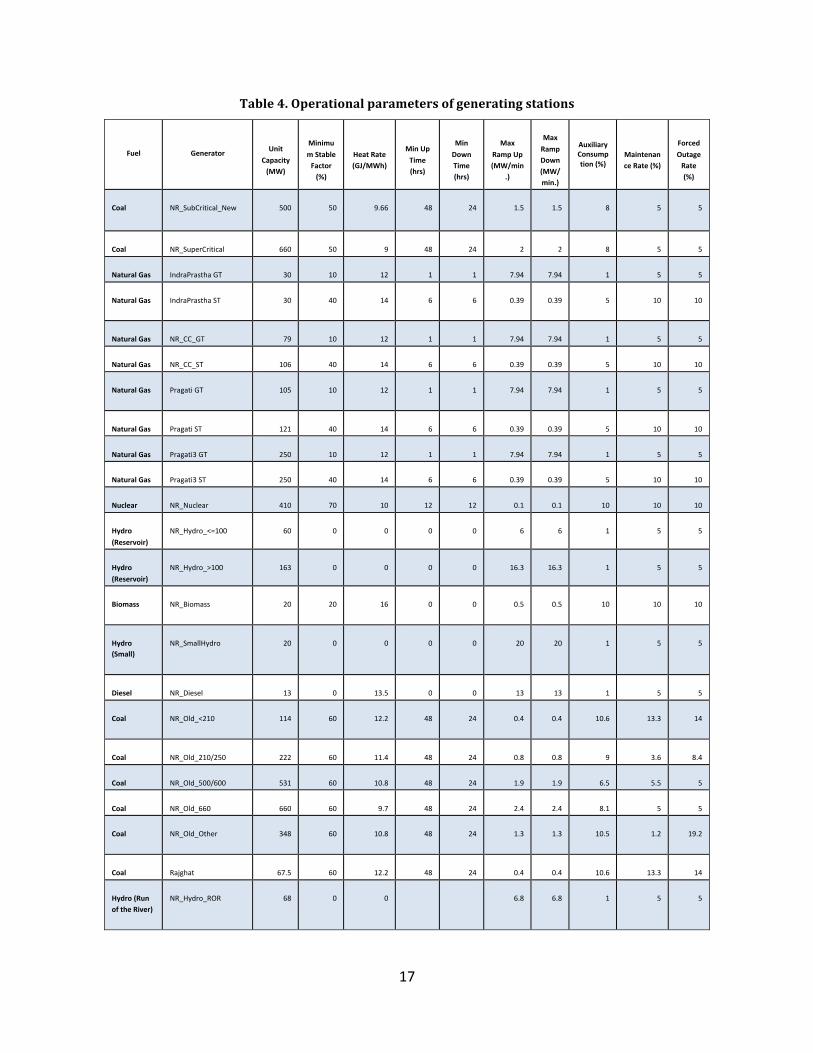
2.2.4. Operational Parameters of Generators In the following table, we summarize the data we use on the operational characteristics (unit size, heat rates, ramp rates, minimum stable level etc) of the various types of power plants that we model in PLEXOS.
17
Table 4. Operational parameters of generating stations
Fuel Generator Unit Capacity (MW)
Minimum Stable Factor (%)
Heat Rate (GJ/MWh)
Min Up Time (hrs)
Min Down Time (hrs)
Max Ramp Up (MW/min
.)
Max Ramp Down (MW/min.)
Auxiliary Consumption (%)
Maintenance Rate (%)
Forced Outage Rate (%)
Coal NR_SubCritical_New 500 50 9.66 48 24 1.5 1.5 8 5 5
Coal NR_SuperCritical 660 50 9 48 24 2 2 8 5 5
Natural Gas IndraPrastha GT 30 10 12 1 1 7.94 7.94 1 5 5
Natural Gas IndraPrastha ST 30 40 14 6 6 0.39 0.39 5 10 10
Natural Gas NR_CC_GT 79 10 12 1 1 7.94 7.94 1 5 5
Natural Gas NR_CC_ST 106 40 14 6 6 0.39 0.39 5 10 10
Natural Gas Pragati GT 105 10 12 1 1 7.94 7.94 1 5 5
Natural Gas Pragati ST 121 40 14 6 6 0.39 0.39 5 10 10
Natural Gas Pragati3 GT 250 10 12 1 1 7.94 7.94 1 5 5
Natural Gas Pragati3 ST 250 40 14 6 6 0.39 0.39 5 10 10
Nuclear NR_Nuclear 410 70 10 12 12 0.1 0.1 10 10 10
Hydro (Reservoir)
NR_Hydro_<=100 60 0 0 0 0 6 6 1 5 5
Hydro (Reservoir)
NR_Hydro_>100 163 0 0 0 0 16.3 16.3 1 5 5
Biomass NR_Biomass 20 20 16 0 0 0.5 0.5 10 10 10
Hydro (Small)
NR_SmallHydro 20 0 0 0 0 20 20 1 5 5
Diesel NR_Diesel 13 0 13.5 0 0 13 13 1 5 5
Coal NR_Old_<210 114 60 12.2 48 24 0.4 0.4 10.6 13.3 14
Coal NR_Old_210/250 222 60 11.4 48 24 0.8 0.8 9 3.6 8.4
Coal NR_Old_500/600 531 60 10.8 48 24 1.9 1.9 6.5 5.5 5
Coal NR_Old_660 660 60 9.7 48 24 2.4 2.4 8.1 5 5
Coal NR_Old_Other 348 60 10.8 48 24 1.3 1.3 10.5 1.2 19.2
Coal Rajghat 67.5 60 12.2 48 24 0.4 0.4 10.6 13.3 14
Hydro (Run of the River)
NR_Hydro_ROR 68 0 0
6.8 6.8 1 5 5

18
The values have been estimated using the actual plant level hourly dispatch data, actual outage and other performance data, regulatory orders on heat rates and costs, other relevant literature, and conversations with the system operators in India about actual practices. We assume that the gas turbines in the combined cycle gas plants could be operated in open cycle mode.
2.2.5. Hydro capacity and energy model Hydro capacity is modeled using a fixed monthly energy budget. Based on the historical dispatch and minimum flow and spill constraints we estimated the capacity factors of the hydro power plants for every month. Subject to such monthly capacity factor constraints, reservoir based hydro power plants are assumed to be optimally dispatched. The following table shows the monthly capacity factors for hydro plants in the northern region:
Table 5. Monthly Capacity Factors of Hydroelectric Projects in the Northern Region January February March April May June July August September October November December Annual
Average 24% 29% 36% 40% 62% 64% 67% 67% 71% 40% 29% 26% 46%
Data sources: (CEA 2015a) and authors’ calculations Hydro capacity factors depend on a variety of factors including high recharge season (such as summer or monsoon), irrigation and minimum flow requirements etc. More than 50% of India’s current hydro capacity is run of the river; output of the run-‐of-‐the-‐river plants is assumed to be flat subject to the monthly capacity factor constraint. 2.2.6. Costs The following table shows our data on capital cost and fixed O&M costs for each technology. They are from the Central Electricity Regulatory Commission’s (CERC) tariff norms 2014 (CERC 2014). Solar capital costs have been estimated using the latest solar auction results in India. Capital costs of these technologies have been assumed to remain the same even in the future.

19
Table 6. Assumptions for capital cost and fixed O&M Cost of Power Plants
Coal Super Critical Capital Cost $/kW Fixed O&M Cost $/kW/yr
Coal (Supercritical) 900 35 Coal (Subcritical) 925 35 Gas_CCGT 800 30 Nuclear 1500 50 Hydro (Large Reservoir) 1500 50 Hydro (Run-‐of-‐River) 1500 50 Small Hydro 1200 40 Biomass 800 20 Diesel 600 15 Wind 900 12 Solar PV 1400 15
Data source: (CERC 2014) The economic life of all generation assets has been assumed to be 25 years and the weighted average cost of capital is assumed to be 12%.
2.2.7. Fuel Prices The fuel prices have been taken as the long run marginal costs and have been assumed to stay constant in real terms. The following table summarizes our assumptions on fuel availability and prices.
Table 7. Assumptions for fuel calorific values and prices
Fuel Gross Calorific Value
Price ($/GJ)
Domestic Coal 4000 kCal/kg 4.5
Imported Coal 5400 kCal/kg 5.5
Domestic Gas 9000 kCal/m3 8.5
Imported LNG 9000 kCal/m3 12.0
Diesel 10000 kCal/lit 20.0
Biomass 3000 kCal/kg 5.0
20
2.2.8. Transmission Recently the southern regional grid in India was integrated with the northern regional grid. Additionally, there have been significant transmission investments planned in the near future. Therefore, we have assumed no constraints on transmission.
2.2.9. Scenarios for Modeling We created scenarios based on variation in (a) EV penetration and (b) Share of generation from renewable sources. In each case, we ran the REV model for both an unmanaged charging case and a smart charging case.
2.2.10. Penetration of BEVs in Delhi
As explained earlier, we create three scenarios for BEV penetration in Delhi viz. 0%, 5%, and 15%. The 0% BEV penetration case serves as the baseline for our analysis. Each of the other two penetration scenarios adds charging load to the Delhi electric grid and therefore would have different investment and dispatch results relative to the base case (no BEV penetration). As described earlier, the BEV charging profiles are inputs from PEVI.
2.2.11. 20% of Supply from Renewable Sources
In order to assess the impact of a cleaner grid on BEVs and vice-‐versa, we created a scenario with significant penetration of renewable energy in Delhi’s electricity grid. In such scenario, we assume that 20% of Delhi’s electricity (by energy) is supplied by renewable energy sources from the resource rich areas in the northern regional electricity grid such as Rajasthan and northern Gujarat.10 About 15% of such energy is assumed to be supplied by solar power from Rajasthan and 5% is assumed to be supplied by wind power in Rajasthan and Gujarat.
2.2.12. Modeling the Smart Charging of EVs We allow for the shifting of charging events for the non-‐essential charging demand that is calculated in PEVI for each hour. Smart charging is subject to the daily energy constraint i.e. the amount of energy used to charge a vehicle should be exactly the same as the energy used by the vehicle during the day. There is no literature available on integrating smart vehicle charging with an electricity production cost model such as Plexos. In Plexos, we implemented the smart charging system by modeling the charger/vehicle system as flexible storage; the non-‐essential part of this hypothetical storage (in the form of car batteries) could be charged any time during the day so that the system cost is minimized. One of the implicit assumptions here is that daily BEV itineraries are decided at the start of each day and are not altered at any time during the course of the day. We intend to relax this constraint in our future work.
10 Technically, Gujarat is part of the Western regional electricity grid in India; however, all regional grids have now been synchronized and it is expected that inter-‐regional transfer of power would not be a concern in the near future.
21
2.2.13. PLEXOS Outputs
The outputs from the PLEXOS modeling are sent as inputs to the Economic and Environmental Impacts model. Key outputs include:
• Load curves for all model runs • Costs at the level of each power plant • Fossil fuel use and CO2 emissions for each plant • The full generation portfolio including new investments to meet demand
Economic and Environmental Impacts (EEI) Model 2.3. The Economic and Environmental Impacts (EEI) model uses outputs from the integrated PEVI and PLEXOS models to estimate (1) the change in primary fossil energy consumption and end-‐use CO2 emissions due to BEV deployment, and (2) BEV and conventional vehicle costs for consumers. The following sections outline the methodology, input data, and assumptions used to estimate these metrics in the EEI model.
2.3.1. Primary fossil energy consumption The EEI model evaluates how BEV deployment changes fossil energy consumption by quantifying both gasoline consumption (for conventional cars) and grid electricity consumption (for BEVs). The EEI model estimates fossil energy from gasoline consumption for each conventional vehicle type using the following equation. 𝐹𝑜𝑠𝑠𝑖𝑙 𝐸𝑛𝑒𝑟𝑔𝑦 𝐶𝑜𝑛𝑠𝑢𝑚𝑝𝑡𝑖𝑜𝑛!"#$%#&'"#() =𝑁𝑜. 𝑣𝑒ℎ𝑖𝑐𝑙𝑒𝑠 𝑥 !"#$%&'&() !"#$%&%'/!"!!"#$
!"#$𝑥 ! !"#$%&'( !"#$%&'(
!" 𝑥 !"#
!.!"#$% !𝑥 ! !!" !"#!" !"# !"#$%&'(
𝑥 !.! !"!!" !"#
Where:
• Kilometers traveled per year per vehicle is based on vehicle type and derived from the RITES Travel Demand Model (RITES 2005).
• For subcompact hatchbacks and compact sedans, fuel consumption (liters of fuel per kilometer) is based on real-‐world driving in New Delhi, modeled using the Autonomie powertrain modeling platform. For 2Ws, fuel consumption is derived from the International Council on Clean Transportation’s Global Roadmap Model. For vans/MUVs, fuel consumption is based on vehicle specifications for the example models presented in Table 1.
• Indian refineries are assumed to perform similarly to US refineries, which the Energy Information Administration reports yield 19 gallons of gasoline per barrel of oil refined.
• Each barrel of oil is assumed to contain 6.1 GJ of energy.
22
To measure fossil energy consumed by BEVs, we directly use the outputs from PLEXOS, which reports consumption of fossil fuel by each plant for each model run. PLEXOS reports this as “fuel offtake,” measured in TJ, for each fossil fuel type found on the grid. To determine fossil energy consumption attributable to BEVs, the EEI model subtracts base case fossil energy consumption from fossil energy consumption for each BEV deployment scenario considered.
2.3.2. CO2 emissions (per kilometer) The EEI model also estimates per kilometer CO2 emissions for each type of BEV for each scenario. The base case scenario assumes no BEVs, so per kilometer emissions are calculated using gasoline combustion emission factors and fuel consumption rates, as follows:
𝑔 𝐶𝑂!𝑘𝑚 !"#$%#&'"#()
=𝐿 𝑔𝑎𝑠𝑜𝑙𝑖𝑛𝑒 𝑐𝑜𝑛𝑠𝑢𝑚𝑒𝑑
𝑘𝑚𝑥8.78 𝑘𝑔 𝐶𝑂!𝑔𝑎𝑙 𝑔𝑎𝑠𝑜𝑙𝑖𝑛𝑒
𝑥1 𝑔𝑎𝑙
3.78541 𝐿𝑥1000 𝑔𝑘𝑔
Where:
• Fuel consumption is derived from the same source as explained in section 2.3.1 above.
• The assumed gasoline emissions factor (8.78 kg CO2 per gallon gasoline) comes from the US EPA “Emission Factors for Greenhouse Gas Inventories.”11
For BEVs, this metric is calculated using the system-‐wide grid emissions factor reported by PLEXOS for each grid dispatch scenario. With this data, per kilometer CO2 emissions are calculated with the following equation:
𝑔 𝐶𝑂!𝑘𝑚 !"#$
=𝑘𝑔 𝐶𝑂!𝑀𝑊ℎ 𝑥
𝑘𝑊ℎ𝑘𝑚 𝑥
𝑀𝑊ℎ1000 𝑘𝑊ℎ
Where:
• The electric fuel consumption rates (kWh/km) are derived as described in section 2.3.1.
11 http://www.epa.gov/climateleadership/documents/emission-‐factors.pdf
23
Cost of vehicle ownership 2.4. The EEI model can also calculate the per-‐kilometer levelized cost of vehicle ownership from a social, external or consumer perspective. For this study, we were most interested in comparing the cost of vehicle operation, from a consumer perspective, for conventional vehicles and BEVs charged with and without renewables. 2.4.1. Vehicle Operating Cost (per km) For conventional vehicles, per kilometer vehicle operating cost was calculated using the following formula:
𝑃𝑒𝑟 𝑘𝑖𝑙𝑜𝑚𝑒𝑡𝑒𝑟 𝑜𝑝𝑒𝑟𝑎𝑡𝑖𝑛𝑔 𝑐𝑜𝑠𝑡 (𝑐𝑜𝑛𝑣𝑒𝑛𝑡𝑖𝑜𝑛𝑎𝑙 𝑣𝑒ℎ𝑖𝑐𝑙𝑒𝑠)
= 𝐿 𝑔𝑎𝑠𝑜𝑙𝑖𝑛𝑒 𝑐𝑜𝑛𝑠𝑢𝑚𝑒𝑑
𝑘𝑖𝑙𝑜𝑚𝑒𝑡𝑒𝑟 𝑥 𝑅𝑠𝐿
Where:
• Fuel consumption is derived from the same source as explained in section 2.3.1. above.
• Fuel cost (Rs/L) is based on average 2015 at-‐the-‐pump fuel prices. For BEVs, per kilometer vehicle operating cost was calculated using this formula: 𝑃𝑒𝑟 𝑘𝑖𝑙𝑜𝑚𝑒𝑡𝑒𝑟 𝑜𝑝𝑒𝑟𝑎𝑡𝑖𝑛𝑔 𝑐𝑜𝑠𝑡 𝐸𝑉𝑠 = !"!
!"𝑥 !"
!"!
Where:
• Electrical consumption is derived in the same way presented in section 2.3.2. above.
• Consumer electricity cost is based on the Delhi Electricity Regulatory Commission’s Tariff Schedule.
3. Results The key findings from this study are:
1. BEV demand will be relatively small, at all hours, even at the 15% penetration level, compared to other electricity loads in Delhi in 2025.
2. Due to the large number of two-‐wheelers, the flexibility in shifting charging periods is very high.
3. For the grid, the value of BEV smart charging increases significantly with renewable energy penetration.
4. BEVs reduce CO2 emissions and primary fossil energy consumption even in the current coal dominated grid mix. These savings increase substantially with renewable energy penetration.
24
5. BEV operating costs in India are 6 to 10 times cheaper than conventional vehicle operating costs.
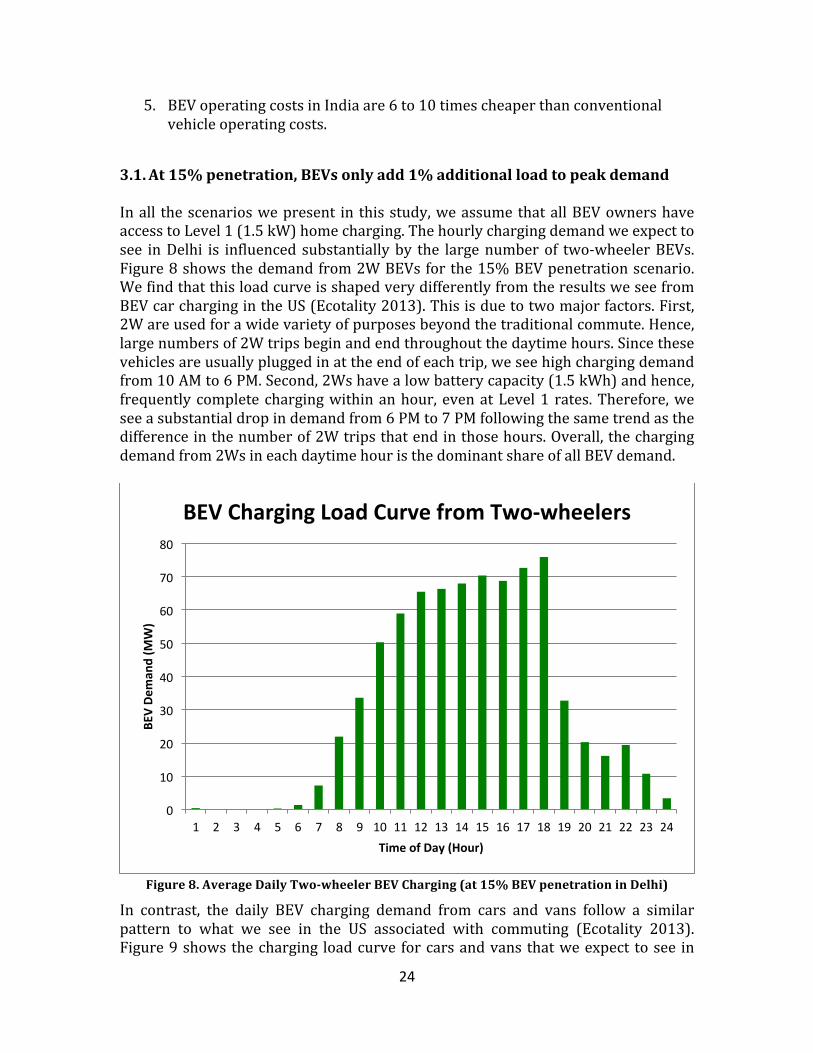
At 15% penetration, BEVs only add 1% additional load to peak demand 3.1. In all the scenarios we present in this study, we assume that all BEV owners have access to Level 1 (1.5 kW) home charging. The hourly charging demand we expect to see in Delhi is influenced substantially by the large number of two-‐wheeler BEVs. Figure 8 shows the demand from 2W BEVs for the 15% BEV penetration scenario. We find that this load curve is shaped very differently from the results we see from BEV car charging in the US (Ecotality 2013). This is due to two major factors. First, 2W are used for a wide variety of purposes beyond the traditional commute. Hence, large numbers of 2W trips begin and end throughout the daytime hours. Since these vehicles are usually plugged in at the end of each trip, we see high charging demand from 10 AM to 6 PM. Second, 2Ws have a low battery capacity (1.5 kWh) and hence, frequently complete charging within an hour, even at Level 1 rates. Therefore, we see a substantial drop in demand from 6 PM to 7 PM following the same trend as the difference in the number of 2W trips that end in those hours. Overall, the charging demand from 2Ws in each daytime hour is the dominant share of all BEV demand.
Figure 8. Average Daily Two-‐wheeler BEV Charging (at 15% BEV penetration in Delhi)
In contrast, the daily BEV charging demand from cars and vans follow a similar pattern to what we see in the US associated with commuting (Ecotality 2013). Figure 9 shows the charging load curve for cars and vans that we expect to see in
0
10
20
30
40
50
60
70
80
1 2 3 4 5 6 7 8 9 10 11 12 13 14 15 16 17 18 19 20 21 22 23 24
BEV De
man
d (M
W)
Time of Day (Hour)
BEV Charging Load Curve from Two-‐wheelers
25
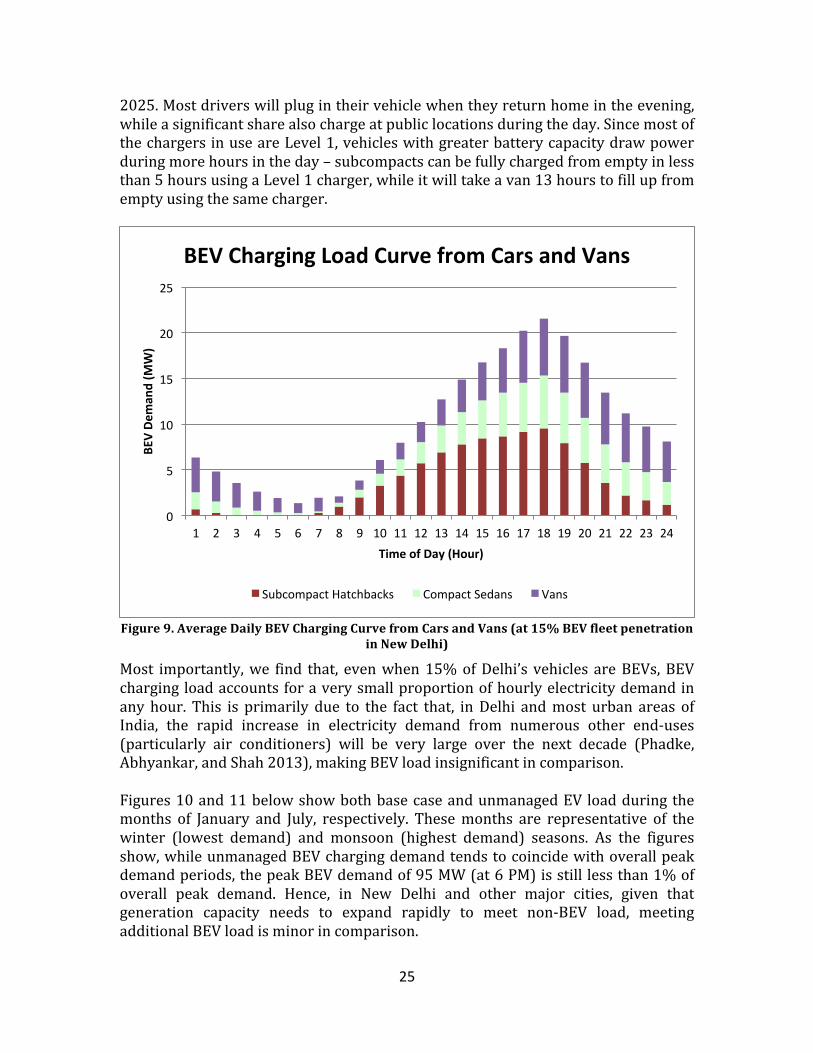
2025. Most drivers will plug in their vehicle when they return home in the evening, while a significant share also charge at public locations during the day. Since most of the chargers in use are Level 1, vehicles with greater battery capacity draw power during more hours in the day – subcompacts can be fully charged from empty in less than 5 hours using a Level 1 charger, while it will take a van 13 hours to fill up from empty using the same charger.
Figure 9. Average Daily BEV Charging Curve from Cars and Vans (at 15% BEV fleet penetration
in New Delhi)
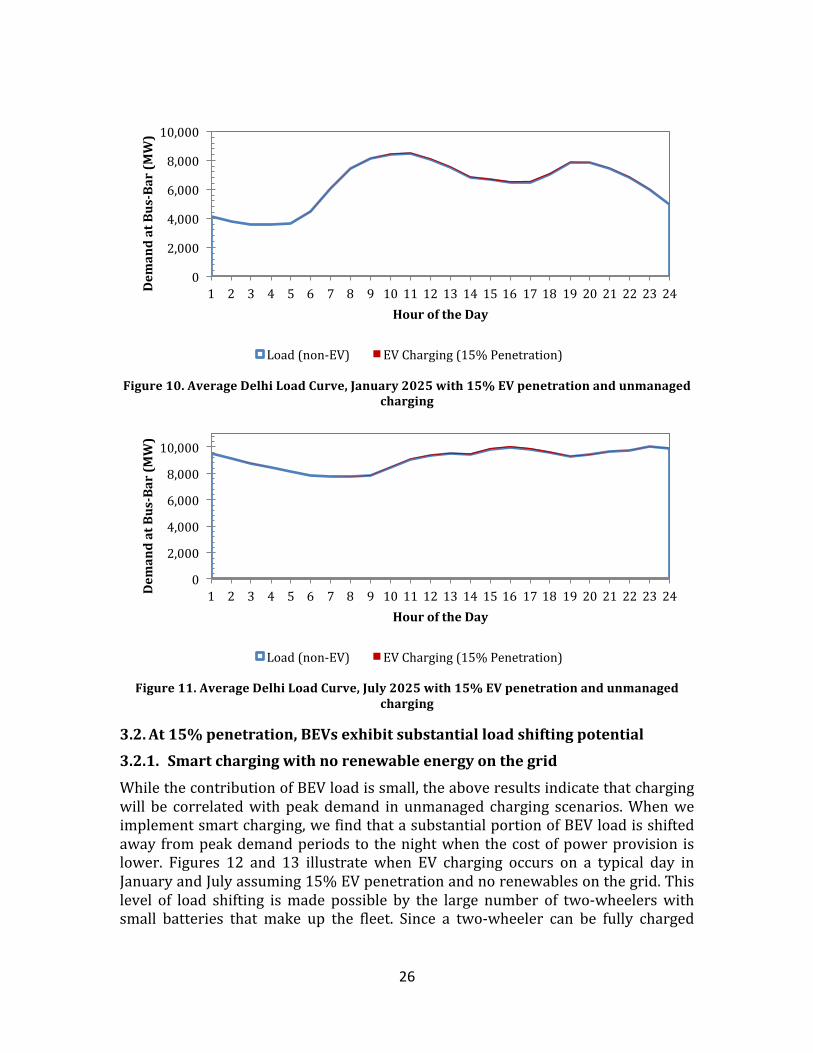
Most importantly, we find that, even when 15% of Delhi’s vehicles are BEVs, BEV charging load accounts for a very small proportion of hourly electricity demand in any hour. This is primarily due to the fact that, in Delhi and most urban areas of India, the rapid increase in electricity demand from numerous other end-‐uses (particularly air conditioners) will be very large over the next decade (Phadke, Abhyankar, and Shah 2013), making BEV load insignificant in comparison. Figures 10 and 11 below show both base case and unmanaged EV load during the months of January and July, respectively. These months are representative of the winter (lowest demand) and monsoon (highest demand) seasons. As the figures show, while unmanaged BEV charging demand tends to coincide with overall peak demand periods, the peak BEV demand of 95 MW (at 6 PM) is still less than 1% of overall peak demand. Hence, in New Delhi and other major cities, given that generation capacity needs to expand rapidly to meet non-‐BEV load, meeting additional BEV load is minor in comparison.
0
5
10
15
20
25
1 2 3 4 5 6 7 8 9 10 11 12 13 14 15 16 17 18 19 20 21 22 23 24
BEV De
man
d (M
W)
Time of Day (Hour)
BEV Charging Load Curve from Cars and Vans
Subcompact Hatchbacks Compact Sedans Vans
26
Figure 10. Average Delhi Load Curve, January 2025 with 15% EV penetration and unmanaged
charging
Figure 11. Average Delhi Load Curve, July 2025 with 15% EV penetration and unmanaged
charging
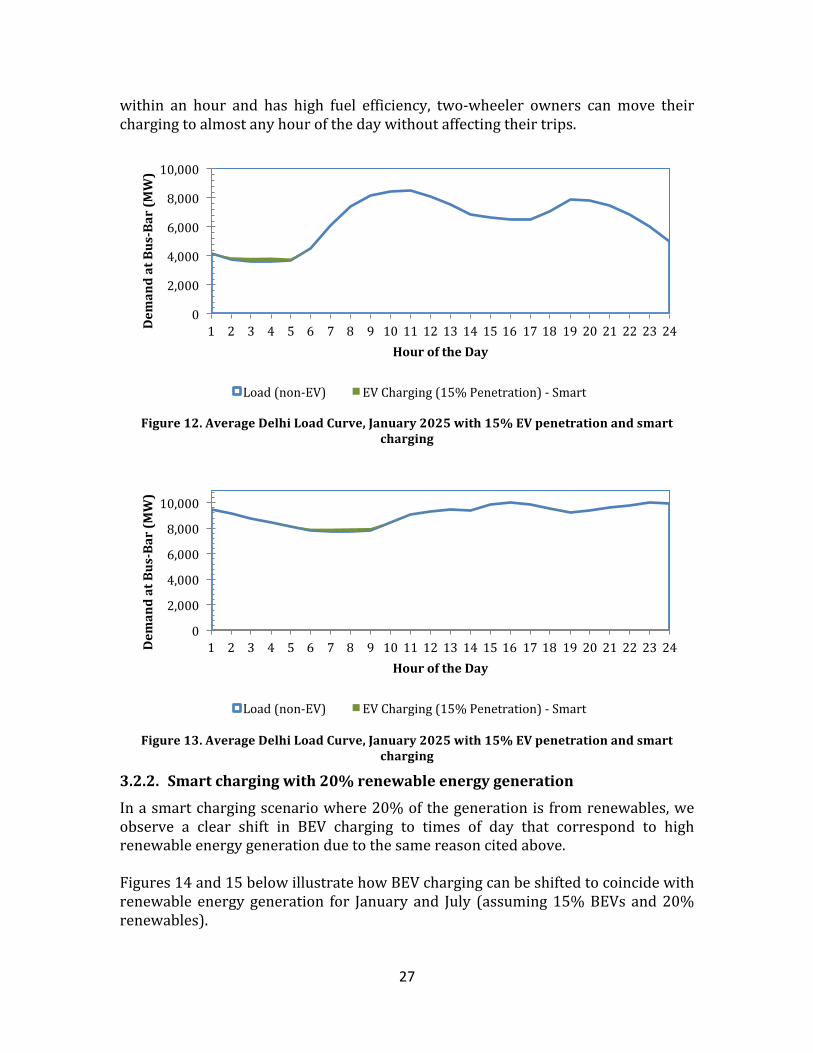
At 15% penetration, BEVs exhibit substantial load shifting potential 3.2.3.2.1. Smart charging with no renewable energy on the grid While the contribution of BEV load is small, the above results indicate that charging will be correlated with peak demand in unmanaged charging scenarios. When we implement smart charging, we find that a substantial portion of BEV load is shifted away from peak demand periods to the night when the cost of power provision is lower. Figures 12 and 13 illustrate when EV charging occurs on a typical day in January and July assuming 15% EV penetration and no renewables on the grid. This level of load shifting is made possible by the large number of two-‐wheelers with small batteries that make up the fleet. Since a two-‐wheeler can be fully charged
0
2,000
4,000
6,000
8,000
10,000
1 2 3 4 5 6 7 8 9 10 11 12 13 14 15 16 17 18 19 20 21 22 23 24 Dem
and at Bus-‐Bar (M
W)
Hour of the Day
Load (non-‐EV) EV Charging (15% Penetration)
0
2,000
4,000
6,000
8,000
10,000
1 2 3 4 5 6 7 8 9 10 11 12 13 14 15 16 17 18 19 20 21 22 23 24 Dem
and at Bus-‐Bar (M
W)
Hour of the Day
Load (non-‐EV) EV Charging (15% Penetration)
27
within an hour and has high fuel efficiency, two-‐wheeler owners can move their charging to almost any hour of the day without affecting their trips.
Figure 12. Average Delhi Load Curve, January 2025 with 15% EV penetration and smart
charging
Figure 13. Average Delhi Load Curve, January 2025 with 15% EV penetration and smart
charging
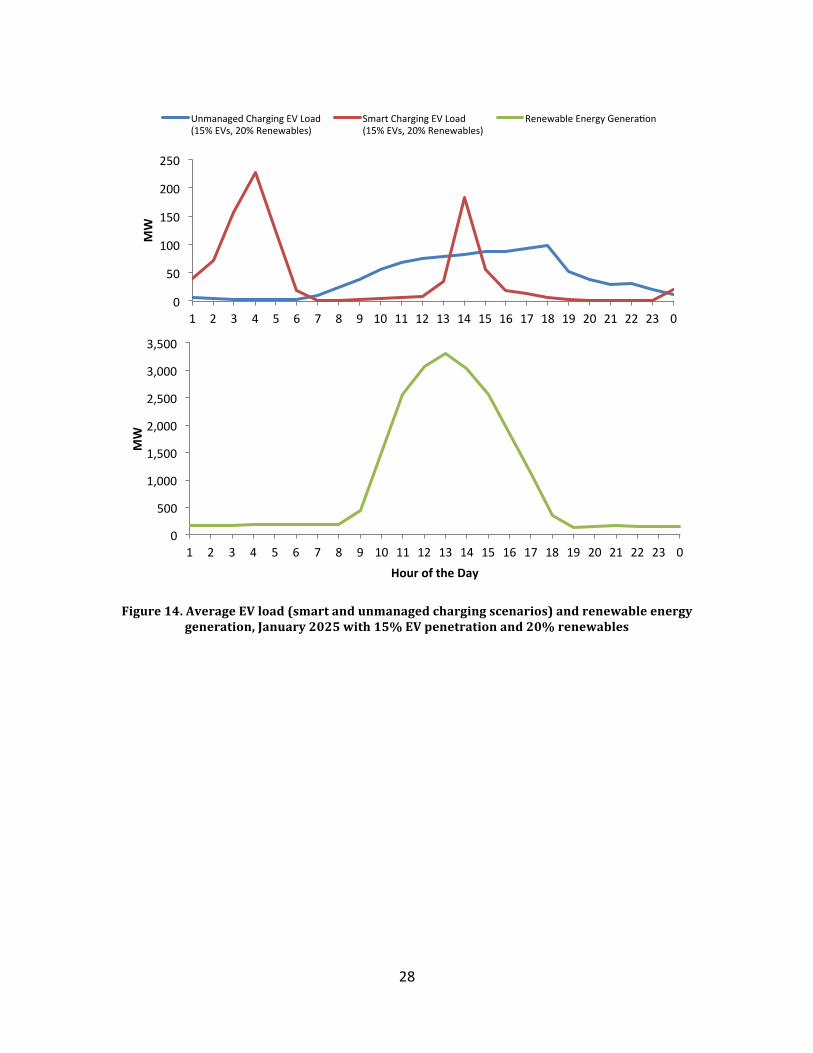
3.2.2. Smart charging with 20% renewable energy generation In a smart charging scenario where 20% of the generation is from renewables, we observe a clear shift in BEV charging to times of day that correspond to high renewable energy generation due to the same reason cited above. Figures 14 and 15 below illustrate how BEV charging can be shifted to coincide with renewable energy generation for January and July (assuming 15% BEVs and 20% renewables).
0
2,000
4,000
6,000
8,000
10,000
1 2 3 4 5 6 7 8 9 10 11 12 13 14 15 16 17 18 19 20 21 22 23 24 Dem
and at Bus-‐Bar (M
W)
Hour of the Day
Load (non-‐EV) EV Charging (15% Penetration) -‐ Smart
0
2,000
4,000
6,000
8,000
10,000
1 2 3 4 5 6 7 8 9 10 11 12 13 14 15 16 17 18 19 20 21 22 23 24 Dem
and at Bus-‐Bar (M
W)
Hour of the Day
Load (non-‐EV) EV Charging (15% Penetration) -‐ Smart
28
Figure 14. Average EV load (smart and unmanaged charging scenarios) and renewable energy generation, January 2025 with 15% EV penetration and 20% renewables
0
50
100
150
200
250
1 2 3 4 5 6 7 8 9 10 11 12 13 14 15 16 17 18 19 20 21 22 23 0
MW
Unmanaged Charging EV Load (15% EVs, 20% Renewables)
Smart Charging EV Load (15% EVs, 20% Renewables)
Renewable Energy Generaeon
0
500
1,000
1,500
2,000
2,500
3,000
3,500
1 2 3 4 5 6 7 8 9 10 11 12 13 14 15 16 17 18 19 20 21 22 23 0
MW
Hour of the Day
29
Figure 15. Average Delhi Load Curve, July 2025 with 15% EV penetration and smart charging
At 15% penetration, BEV Smart charging lowers the cost of integrating 3.3.renewables by 2%.
Figure 16 shows that smart charging lowers the cost of generation in all cases. The power sector cost savings at 15% penetration of BEVs is relatively small when there is no renewable generation. Hence, utilities have little incentive to invest in smart charging programs. However, to integrate 20% renewable energy, smart charging yields a 2% cost reduction relative to an unmanaged charging scenario. Hence, we find that BEVs can actually help India meet its ambitious renewable energy targets.
0
50
100
150
200
250
300
1 2 3 4 5 6 7 8 9 10 11 12 13 14 15 16 17 18 19 20 21 22 23 0
MW
Unmanaged Charging EV Load (15% EVs, 20% Renewables)
Smart Charging EV Load (15% EVs, 20% Renewables)
Renewable Energy Generaeon
0
1,000
2,000
3,000
4,000
5,000
1 2 3 4 5 6 7 8 9 10 11 12 13 14 15 16 17 18 19 20 21 22 23 0
MW
Hour of the Day
30
Figure 16. Average cost of power generation, assuming 15% EV penetration
BEVs reduce CO2 emissions by 30-‐50% over conventional vehicles under 3.4.various scenarios
As shown in Figure 17, our study finds that BEVs will lower end-‐use CO2 emissions in India even in the absence of any renewable energy targets and coal continues to supply more than 80% of the power. On a gCO2/km basis, two-‐wheelers and subcompact BEVs offer the greatest savings when compared to conventional versions of the same vehicles. Compact sedans and vans too offer substantial emissions savings. These results are for the 15% BEV penetration scenario. However, India has recently announced very ambitious renewable energy targets (175 GW of capacity by 2022) (Abhyankar et al. 2013b). To capture the effects of renewable energy generation on BEV emissions, we model a scenario where renewables make up 20% of the generation. In this scenario, CO2 emissions reduce by a further 22% (for compact cars and vans) to 25% (for 2Ws and subcompacts) over BEVs powered without renewables. In Figure 17, CO2 emissions are reported using the temporally-‐explicit average allocation approach as described by Yang (Yang 2013). In this approach, we calculate BEV emissions based on the hourly grid emissions factor weighted by the share of BEV demand in each hour. This approach estimates the emissions associated with BEVs given various power sector scenarios and policies rather than the marginal emissions impact of an EV promotion policy. We believe that this is the most appropriate approach for India because marginal BEV demand will be swamped by the explosive growth in demand from non-‐BEV sources that, in the end, will dictate power sector planning and dispatch.
3.925 3.922
4.714 4.615
0
1
2
3
4
5 Unmanaged Smart Unmanaged Smart
Rs/kWh
No Renewables 20% Renewables
31
Figure 17. CO2 Emissions from BEVs and Conventional Vehicles, including 20% renewable
energy penetration
In Figure 18 we report the CO2 emissions impact of a BEV promotion policy like the National Mission on Electric Mobility. Here too, BEVs do reduce emissions, although by a lower amount than in the previous case. Qualitatively are conclusions are unchanged and robust: when we explicitly consider travel demand, charging behavior, grid investment planning, dispatch and temporal variations in BEV demand, BEVs lower CO2 emissions relative to conventional vehicles in India.
54
108
131
186
28
56 74
108
21
42 57
82
0
20
40
60
80
100
120
140
160
180
200
2Ws Subcompact Hatchbacks
Compact Sedans Vans/MUVs
g CO
2/km
CO2 Emissions -‐ Power Sector Policies
Conveneonal Vehicles BEVs, No Renewables BEVs, 20% Renewables
32
Figure 18. CO2 Emissions Impact due to BEV Policy
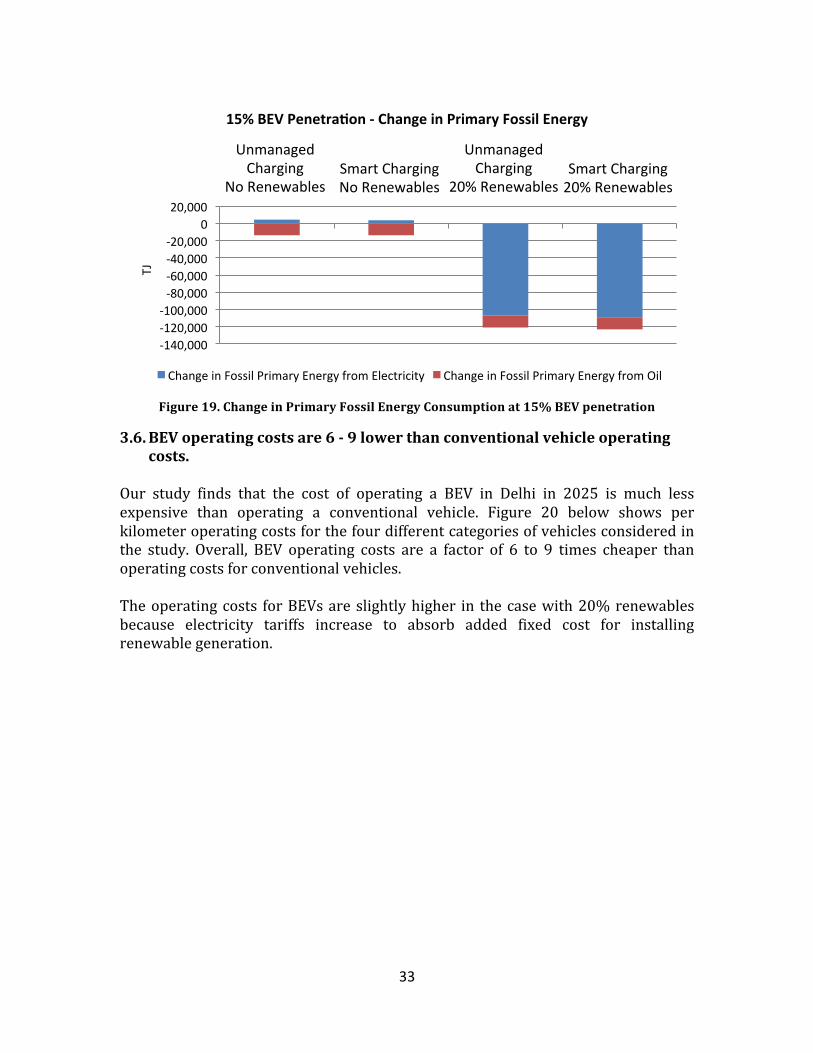
15% penetration of BEVs reduce primary fossil energy consumption by 3.5.16% in Delhi
One of the primary and explicit goals of the National Mission on Electric Mobility is to reduce India’s dependence on fossil fuels, specifically imported oil. We find that switching to BEVs will lower overall fossil energy demand and substantially lower oil demand. Figure 19 shows that even in the absence of any renewables on the grid, primary fossil energy consumption reduces substantially. This is primarily due to the fact that BEVs are much more fuel-‐efficient compared to conventional ICE vehicles. We see dramatic drops in fossil energy demand when BEVs are deployed along with renewable energy where coal, oil and gas demand all drop. Note the positive contribution of smart charging in all cases.
54
108
131
186
33
67
89
129
0
20
40
60
80
100
120
140
160
180
200
2Ws Subcompact Hatchbacks
Compact Sedans Vans/MUVs
g CO
2/km
CO2 Emissions -‐ BEV Policy Impact
Conveneonal Vehicles BEVs
33
Figure 19. Change in Primary Fossil Energy Consumption at 15% BEV penetration
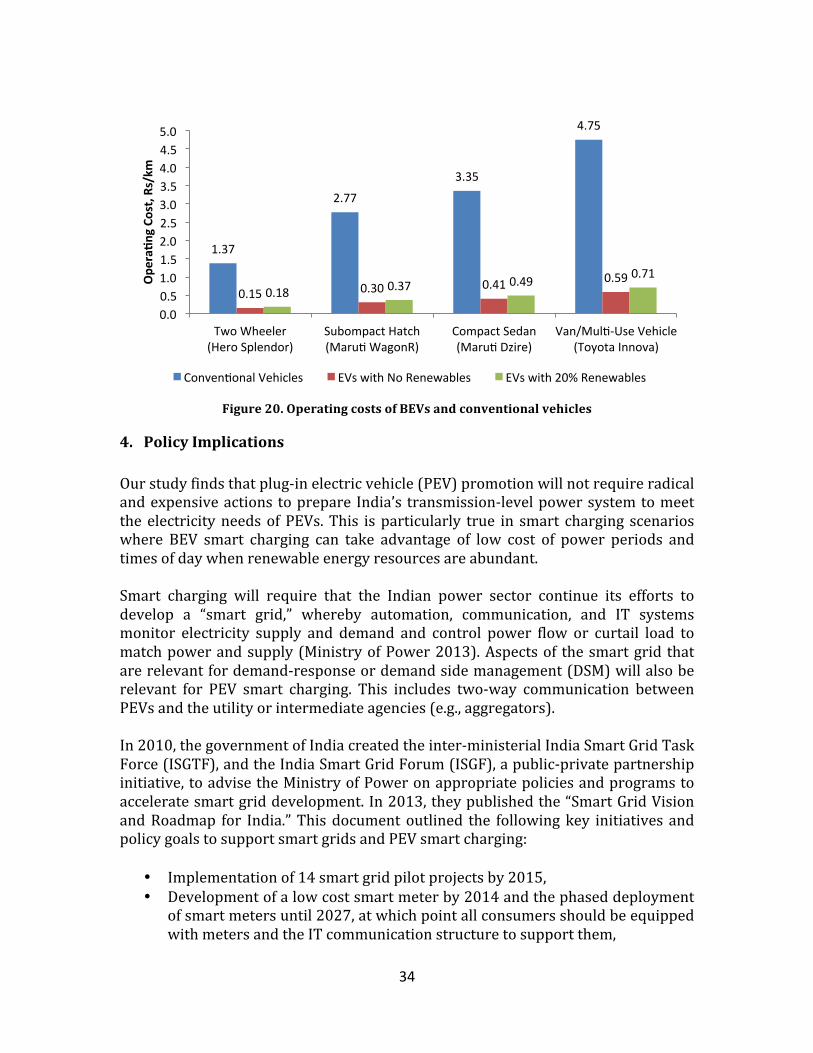
BEV operating costs are 6 -‐ 9 lower than conventional vehicle operating 3.6.costs.
Our study finds that the cost of operating a BEV in Delhi in 2025 is much less expensive than operating a conventional vehicle. Figure 20 below shows per kilometer operating costs for the four different categories of vehicles considered in the study. Overall, BEV operating costs are a factor of 6 to 9 times cheaper than operating costs for conventional vehicles. The operating costs for BEVs are slightly higher in the case with 20% renewables because electricity tariffs increase to absorb added fixed cost for installing renewable generation.
-‐140,000 -‐120,000 -‐100,000 -‐80,000 -‐60,000 -‐40,000 -‐20,000
0 20,000
Unmanaged Charging
No Renewables Smart Charging No Renewables
Unmanaged Charging
20% Renewables Smart Charging 20% Renewables
TJ
15% BEV Penetra^on -‐ Change in Primary Fossil Energy
Change in Fossil Primary Energy from Electricity Change in Fossil Primary Energy from Oil
34
Figure 20. Operating costs of BEVs and conventional vehicles
4. Policy Implications Our study finds that plug-‐in electric vehicle (PEV) promotion will not require radical and expensive actions to prepare India’s transmission-‐level power system to meet the electricity needs of PEVs. This is particularly true in smart charging scenarios where BEV smart charging can take advantage of low cost of power periods and times of day when renewable energy resources are abundant. Smart charging will require that the Indian power sector continue its efforts to develop a “smart grid,” whereby automation, communication, and IT systems monitor electricity supply and demand and control power flow or curtail load to match power and supply (Ministry of Power 2013). Aspects of the smart grid that are relevant for demand-‐response or demand side management (DSM) will also be relevant for PEV smart charging. This includes two-‐way communication between PEVs and the utility or intermediate agencies (e.g., aggregators). In 2010, the government of India created the inter-‐ministerial India Smart Grid Task Force (ISGTF), and the India Smart Grid Forum (ISGF), a public-‐private partnership initiative, to advise the Ministry of Power on appropriate policies and programs to accelerate smart grid development. In 2013, they published the “Smart Grid Vision and Roadmap for India.” This document outlined the following key initiatives and policy goals to support smart grids and PEV smart charging:
• Implementation of 14 smart grid pilot projects by 2015, • Development of a low cost smart meter by 2014 and the phased deployment
of smart meters until 2027, at which point all consumers should be equipped with meters and the IT communication structure to support them,
1.37
2.77
3.35
4.75
0.15 0.30 0.41 0.59 0.18 0.37 0.49 0.71
0.0 0.5 1.0 1.5 2.0 2.5 3.0 3.5 4.0 4.5 5.0
Two Wheeler (Hero Splendor)
Subompact Hatch (Marue WagonR)
Compact Sedan (Marue Dzire)
Van/Mule-‐Use Vehicle (Toyota Innova)
Ope
ra^n
g Co
st, R
s/km
Conveneonal Vehicles EVs with No Renewables EVs with 20% Renewables
35
• Implementation of policies to support improved tariffs such as dynamic tariffs, variable tariffs, including mandatory demand response programs,
• Policies for energy efficiency in public infrastructure including PEV charging facilities by 2015 and for demand response ready appliances by 2017,
• Implementation of tariff mechanisms, new energy products, energy options and programs to encourage customer participation of customers in the energy markets by 2017, and
• Creation of an effective information exchange platform that can be shared by all market participants in real time.
These initiatives and goals have placed India on a trajectory to support smart PEV charging, but barriers and disincentives remain. The following outlines some of these barriers and provides recommendations for ways to overcome them.
Recommendations to Facilitate PEV Smart Charging 4.1. Successful demand-‐side management (DSM) programs require active participation and implementation by utilities. This includes high-‐level technical and financial investment. From the perspective of Indian utilities, however, DSM may not be an attractive investment. This is because DSM programs in India mostly focus on peak load reduction, but utilities earn significant revenue by provisioning power during peak hours (Harish and Kumar 2014). Time-‐of-‐use result in high per unit charges for customers that use electricity during peak hours, so reducing peak load via DSM may actually result in a loss of revenue for utilities in the short-‐term (Abhyankar and Phadke 2012). Thus, incentives may need to be implemented to make DSM investments more attractive to utilities, or a legal framework may need to be developed that requires utilities to implement DSM. Facilitating smart charging in India will also require the establishment of new power sector institutions and actors. First, literature and real-‐world experience shows that successful smart PEV charging requires that individual vehicles be pooled and managed by an “aggregator.” The aggregator is the entity that takes action in the smart charging scheme to cease non-‐essential load when the cost of power provision is high and to resume charging when cost is low. The aggregator receives signals from the electricity market that determine how it will manage the PEVs in its portfolio, and it receives payment from the market for providing ancillary services. Presumably, aggregators would redistribute these monetary benefits to EV owners. This is the main incentive for participation in smart charging at the PEV-‐owner level (Peas Lopes, Soares, and Almeida 2009). Using aggregators to facilitate smart charging makes sense not only because it aggregates very small and distributed individual loads to significant resources size that can participate meaningfully in the electricity market, but also because it reduces transaction costs and improves overall system efficiency (Guille and Gross 2009).
36
In order for aggregators to be able to manage individual PEV loads, however, vehicles will have to be equipped with the proper technology to make real-‐time communication and control possible. This is necessary so that aggregators can gather data on individual vehicles’ state of charge and send signals to non-‐essential loads to curtail them when necessary or when triggered by electricity market price signals. Given this, we recommend that the Indian government encourage or mandate that PEV automakers make these vehicles “DR-‐ready,” much like other smart home appliances that are currently being manufactured world-‐wide. As previously highlighted, India’s Smart Grid Vision and Roadmap includes plans to develop and deploy smart meters capable of supporting two-‐way communication between the grid and grid connected buildings. With this advanced metering infrastructure (AMI) in place, automated home energy management would make it possible for aggregators to use smart meters and demand-‐response enabled vehicles (capable of receiving signals from smart meters) to automatically control PEV charging. Automation allows the aggregator to control vehicle charging without requiring any action by PEV owners, thereby making load shifting more effective and efficient (Sparn, Jin, and Earle 2013). Past studies and experience also indicate optimal PEV smart charging may require the institution of sequential electricity markets. The shortest-‐term electricity markets in India are currently day-‐ahead power exchanges established by the Central Electricity Regulatory Commission in 2007 (IEXL and PXIL). During the period from August 2008 to September 2009, less than 1% of total electricity generation was transacted via these day-‐ahead power exchanges; 91% was transacted via long-‐term power purchase agreements (Shukla and Thampy 2011). While a seemingly small portion of electricity generation is transacted in power exchanges, these will be the primary venue for the PEV smart charging market. Past studies show that PEVs provide their greatest benefit to the smoothing of the load curve (via shifting charging load) when they can participate in within-‐the-‐day markets rather than day-‐ahead markets (Kristoffersen, Capion, and Meibom 2011).
37
References Abhyankar, Nikit, and Amol Phadke. 2012. “Impact of Large-‐Scale Energy Efficiency
Programs on Utility Finances and Consumer Tariffs in India.” Energy Policy 43 (April): 308–26. doi:10.1016/j.enpol.2012.01.008.
Abhyankar, Nikit, Amol Phadke, Jayant Sathaye, Ranjit Bharvirkar, Alissa Johnson, Ranjit Deshmukh, Bob Lieberman, Cathie Murray, and Ajith Rao. 2013a. “Modeling Clean and Secure Energy Scenarios for the Indian Power Sector in 2030”. Lawrence Berkeley National Laboratory.
———. 2013b. “Modeling Clean and Secure Energy Scenarios for the Indian Power Sector in 2030.” Lawrence Berkeley National Laboratory.
Ahn, Sun-‐Joo, and Graczyk, Dagmar. 2012. “Understanding Energy Challenges in India: Policies, Players, and Issues”. International Energy Agency. https://www.iea.org/publications/freepublications/publication/India_study_FINAL_WEB.pdf.
Axsen, Jonn, Kenneth S. Kurani, Ryan McCarthy, and Christopher Yang. 2011. “Plug-‐in Hybrid Vehicle GHG Impacts in California: Integrating Consumer-‐Informed Recharge Profiles with an Electricity-‐Dispatch Model.” Energy Policy 39 (3): 1617–29. doi:10.1016/j.enpol.2010.12.038.
Bose, Ranjan Kumar. 1998. “Automotive Energy Use and Emissions Control: A Simulation Model to Analyse Transport Strategies for Indian Metropolises.” Energy Policy 26 (13): 1001–16. doi:10.1016/S0301-‐4215(98)00045-‐7.
Campanari, Stefano, Giampaolo Manzolini, and Fernando Garcia de la Iglesia. 2009. “Energy Analysis of Electric Vehicles Using Batteries or Fuel Cells through Well-‐to-‐Wheel Driving Cycle Simulations.” Journal of Power Sources 186 (2): 464–77. doi:10.1016/j.jpowsour.2008.09.115.
CEA. 2013. “Report on Eighteenth Electric Power Survey of India”. Central Electricity Authority (Government of India).
———. 2015a. “Monthly Generation of Hydro-‐Electric Stations 2008-‐2015”. New Delhi: Central Electricity Authority (Ministry of Power -‐ Government of India). http://cea.nic.in/reports/hydro/monthly_gen/mwt_13-‐14.pdf.
———. 2015b. “Executive Summary -‐ Power Sector (March-‐15)”. New Delhi: Central Electricity Authority (Ministry of Power -‐ Government of India). http://cea.nic.in/reports/monthly/executive_rep/mar15.pdf.
———. 2015c. “Monthly All-‐India Installed Generation Capacity Report (March-‐15)”. New Delhi: Central Electricity Authority (Ministry of Power -‐ Government of India). http://cea.nic.in/reports/monthly/inst_capacity/mar15.pdf.
———. 2015d. “Monthly Generation Report (March-‐15)”. New Delhi: Central Electricity Authority (Ministry of Power -‐ Government of India). http://cea.nic.in/reports/monthly/executive_rep/mar15.pdf.
CERC. 2014. “Central Electricity Regulatory Commission Regulations 2014.” http://cercind.gov.in/2014/regulation/reg21.pdf.
38
Das, Anjana, and Jyoti Parikh. 2004. “Transport Scenarios in Two Metropolitan Cities in India: Delhi and Mumbai.” Energy Conversion and Management 45 (15–16): 2603–25. doi:10.1016/j.enconman.2003.08.019.
Department of Heavy Industry, Government of India. 2012. “National Electric Mobility Mission Plan (NEMMP) 2020.” http://dhi.nic.in/NEMMP2020.pdf.
Doucette, Reed T., and Malcolm D. McCulloch. 2011. “Modeling the CO2 Emissions from Battery Electric Vehicles given the Power Generation Mixes of Different Countries.” Special Section on Offshore Wind Power Planning, Economics and Environment 39 (2): 803–11. doi:10.1016/j.enpol.2010.10.054.
Ecotality. 2013. “The EV Project: Quarter 2, 2013 Quarterly Report”. U.S. Department of Energy.
EPRI and NRDC. 2007. “Environmental Assessment of Plug-‐In Hybrid Electric Vehicles Volume 1: Nationwide Greenhouse Gas Emissions.” http://www.epri.com/abstracts/pages/ProductAbstract.aspx?productId=000000000001015325.
Gopal, Anand, Samveg Saxena, Maggie Witt, Won Park, Matt Criden, Amol Phadke, Colin Sheppard, Andrew Harris, and Arne Jacobson. 2014. “Assessing and Accelerating Electric Vehicle Deployment in India”. Technical Report for the Electric Vehicles Initiative of the Clean Energy Ministerial. http://www.cleanenergyministerial.org/Portals/2/pdfs/EVI-‐LBNL_India_May2014report.pdf.
Guille, Christophe, and George Gross. 2009. “A Conceptual Framework for the Vehicle-‐to-‐Grid (V2G) Implementation.” Energy Policy 37 (11): 4379–90. doi:10.1016/j.enpol.2009.05.053.
Hadley, Stanton W., and Alexandra A. Tsvetkova. 2009. “Potential Impacts of Plug-‐in Hybrid Electric Vehicles on Regional Power Generation.” The Electricity Journal 22 (10): 56–68. doi:10.1016/j.tej.2009.10.011.
Harish, V. S. K. V., and Arun Kumar. 2014. “Demand Side Management in India: Action Plan, Policies and Regulations.” Renewable and Sustainable Energy Reviews 33 (May): 613–24. doi:10.1016/j.rser.2014.02.021.
Harris, E. C. 2013. “International Construction Costs: A Change of Pace”. EC Harris. Hawkins, Troy R., Ola Moa Gausen, and Anders Hammer Strømman. 2012.
“Environmental Impacts of Hybrid and Electric Vehicles—a Review.” The International Journal of Life Cycle Assessment 17 (8): 997–1014. doi:10.1007/s11367-‐012-‐0440-‐9.
Jansen, Karel H., Tim M. Brown, and G. Scott Samuelsen. 2010. “Emissions Impacts of Plug-‐in Hybrid Electric Vehicle Deployment on the U.S. Western Grid.” Journal of Power Sources 195 (16): 5409–16. doi:10.1016/j.jpowsour.2010.03.013.
Joshua J. Romero. 2012. “Blackouts Illuminate India’s Power Problems.” IEEE Spectrum, September 28.
Kennedy, C. A., N. Ibrahim, and D. Hoornweg. 2014. “Low-‐Carbon Infrastructure Strategies for Cities.” Nature Climate Change 4 (5): 343–46. doi:10.1038/nclimate2160.
39
Kristoffersen, Trine Krogh, Karsten Capion, and Peter Meibom. 2011. “Optimal Charging of Electric Drive Vehicles in a Market Environment.” Applied Energy 88 (5): 1940–48. doi:10.1016/j.apenergy.2010.12.015.
MacPherson, Nathan D., Gregory A. Keoleian, and Jarod C. Kelly. 2012. “Fuel Economy and Greenhouse Gas Emissions Labeling for Plug-‐In Hybrid Vehicles from a Life Cycle Perspective.” Journal of Industrial Ecology 16 (5): 761–73. doi:10.1111/j.1530-‐9290.2012.00526.x.
McCarthy, Ryan, and Christopher Yang. 2010. “Determining Marginal Electricity for near-‐Term Plug-‐in and Fuel Cell Vehicle Demands in California: Impacts on Vehicle Greenhouse Gas Emissions.” Journal of Power Sources 195 (7): 2099–2109. doi:10.1016/j.jpowsour.2009.10.024.
McCleese, David L., and Peter T. LaPuma. 2002. “Using Monte Carlo Simulation in Life Cycle Assessment for Electric and Internal Combustion Vehicles.” The International Journal of Life Cycle Assessment 7 (4): 230–36. doi:10.1007/BF02978878.
Ministry of Power. 2013. “Smart Grid Vision and Roadmap for India.” http://indiasmartgrid.org/en/resource-‐center/Reports/Smart%20Grid%20Vision%20and%20Roadmap%20for%20India.pdf.
Parks, K., P. Denholm, and T. Markel. 2007. “Costs and Emissions Associated with Plug-‐in Hybrid Electric Vehicle Charging in the Xcel Energy Colorado Service Territory”. NREL/TP-‐640-‐41410. National Renewable Energy Laboratory (NREL), Golden, CO. http://www.osti.gov/scitech/biblio/903293.
Peas Lopes, J.A., F.J. Soares, and P.M.R. Almeida. 2009. “Identifying Management Procedures to Deal with Connection of Electric Vehicles in the Grid.” In PowerTech, 2009 IEEE Bucharest, 1–8. doi:10.1109/PTC.2009.5282155.
Phadke, Amol, Nikit Abhyankar, and Poorvi Rao. 2014. “Empirical Analysis of the Variability of Wind Generation in India: Implications for Grid Integration”. Lawrence Berkeley National Laboratory.
Phadke, Amol, Nikit Abhyankar, and Nihar Shah. 2013. “Avoiding 100 New Power Plants by Increasing Efficiency of Room Air Conditioners in India: Opportunities and Challenges.” In Coimbra, Portugal. http://www.superefficient.org/Resources/~/media/Files/EEDAL%20Papers%20-‐%202013/031_Shah_finalpaper_EEDAL13.pdf.
RITES. 2005. “Integrated Multi-‐Modal Public Transport Network for the National Capital Territory of Delhi”. Transport Department, NCT of Delhi.
RITES, (first), and MVA Asia. 2008. “Transport Demand Forecast Study and Development of an Integrated Road Cum Multi-‐Modal Public Transport Network for NCT of Delhi: Traffic Survey Results Report”. Transport Department, NCT of Delhi.
Samaras, Constantine, and Kyle Meisterling. 2008. “Life Cycle Assessment of Greenhouse Gas Emissions from Plug-‐in Hybrid Vehicles: Implications for Policy.” Environmental Science & Technology 42 (9): 3170–76. doi:10.1021/es702178s.
40
Shukla, Umesh Kumar, and Ashok Thampy. 2011. “Analysis of Competition and Market Power in the Wholesale Electricity Market in India.” Energy Policy 39 (5): 2699–2710. doi:10.1016/j.enpol.2011.02.039.
SIAM. 2011. “India Vehicle Sales by Month and Type”. Society of Indian Automobile Manufacturers.
Silva, Carla, Marc Ross, and Tiago Farias. 2009. “Evaluation of Energy Consumption, Emissions and Cost of Plug-‐in Hybrid Vehicles.” Energy Conversion and Management 50 (7): 1635–43. doi:10.1016/j.enconman.2009.03.036.
Sparn, Jin, and Earle. 2013. “Laboratory Testing of Demand-‐Response Enabled Household Appliances”. National Renewable Energy Laboratory. http://www.nrel.gov/docs/fy14osti/60383.pdf.
Yang, Christopher. 2013. “A Framework for Allocating Greenhouse Gas Emissions from Electricity Generation to Plug-‐in Electric Vehicle Charging.” Energy Policy 60 (September): 722–32. doi:10.1016/j.enpol.2013.05.013.