Bathymetric Modeling from Satellite Imagery via Single...
10
Int. J. Environ. Res., 7(4):877-886,Autumn 2013 ISSN: 1735-6865 Received 30 may 2013; Revised 6 July 2013; Accepted 12 July 2013 *Corresponding author E-mail: [email protected] 877 Bathymetric Modeling from Satellite Imagery via Single Band Algorithm (SBA) and Principal Components Analysis (PCA) in Southern Caspian Sea Gholamalifard, M. 1 , Esmaili Sari, A. 1* , Abkar, A. 2 and Naimi, B. 3 1 Department of Environment, Faculty of Natural Resources, Tarbiat Modares University, Noor, Mazandaran, Iran 2 Faculty of Geodesy and Geomatics Eng., K. N. Toosi University of Technology, Tehran, Iran 3 Faculty of Geo-Information Science and Earth Observation (ITC), Enschede, The Netherlands ABSTRACT:Remotely sensed imagery is proving to be a useful tool to estimate water depths in coastal zones. Bathymetric algorithms attempt to isolate water attenuation and hence depth from other factors by using different combinations of spectral bands. In this research, images of absolute bathymetry using two different but related methods in a region in the southern Caspian Sea coasts has been produced. The first method used a Single Band Algorithm (SBA) and assumed a constant water attenuation coefficient throughout the blue band. The second method used Principal Components Analysis (PCA) to adjust for varying water attenuation coefficients without additional ground truth data. PCA method (r=-0.672394) appears to match our control points slightly better than single band algorithm (r=-0.645404). It is clear that both methods can be used as rough estimates of bathymetry for many coastal zone studies in the southern Caspian Sea such as near shore fisheries, coastal erosion, water quality, recreation siting and so forth. The presented methodology can be considered as the first step toward mapping bathymetry in the southern Caspian Sea. Further research must investigate the determination of the nonlinear optimization techniques as well as the assessment of these models’ performance in the study area. Key words: Bathymetry, Satellite Imagery, Single Band Algorithm (SBA), Principal Components Analysis (PCA), Caspian Sea INTRODUCTION Remotely sensed imagery is proving to be a useful tool to estimate water depths in coastal zones around the world. Procedures have been developed that isolate solar reflectance due to water depth from other factors (Kumar and Jayappa, 2009; Ehsani and Quiel, 2010; Zhang et al., 2010; Siddiqui, 2011; Odindi and Mhangara, 2012; Kowkabi et al., 2013; Mahmoodzadeh, 2007). For instance, Lyzenga (1978) proposed a modified exponential depth model for clear shallow waters, ignoring the internal reflection in the water column; Louchard et al. (2003) used radiative transfer calculations to generate a spectral library of remote sensing reflectance to classify obtained reflectance according to bottom type and water depth; Leu and Chang (2005) used two dimensional wave spectrums to estimate water depths based on the principle that while waves propagate toward shoreline, these wave lengths decrease due to decrements in water depth; Fonstad and Marcus (2005) combined remote sensing imagery and open channel flow principals to estimate water depths in clear rivers; Ceyhun and Yalçýn (2010) proposed Artificial Neural Networks (ANN) to estimate water depths in shallow waters. ANNs allows considering nonlinear multi-parameter relationship between reflectance from different spectral bands and water depths. These algorithms attempt to isolate water attenuation and hence depth from other factors by using different combinations of spectral bands. These multiple band techniques depend upon large amounts of ground truth data and a fine enough resolution to discriminate bottom types; they are also limited to the sensitivity to attenuation of the longest wavelengths used. These procedures are invaluable to Iranian coastal zone research because these areas
Transcript of Bathymetric Modeling from Satellite Imagery via Single...
Int. J. Environ. Res., 7(4):877-886,Autumn 2013ISSN: 1735-6865
Received 30 may 2013; Revised 6 July 2013; Accepted 12 July 2013
*Corresponding author E-mail: [email protected]
877
Bathymetric Modeling from Satellite Imagery via Single Band Algorithm (SBA)and Principal Components Analysis (PCA) in Southern Caspian Sea
Gholamalifard, M.1, Esmaili Sari, A.1*, Abkar, A.2 and Naimi, B.3
1Department of Environment, Faculty of Natural Resources, Tarbiat Modares University, Noor,Mazandaran, Iran
2Faculty of Geodesy and Geomatics Eng., K. N. Toosi University of Technology, Tehran, Iran3Faculty of Geo-Information Science and Earth Observation (ITC), Enschede, The Netherlands
ABSTRACT:Remotely sensed imagery is proving to be a useful tool to estimate water depths in coastalzones. Bathymetric algorithms attempt to isolate water attenuation and hence depth from other factors byusing different combinations of spectral bands. In this research, images of absolute bathymetry using twodifferent but related methods in a region in the southern Caspian Sea coasts has been produced. The firstmethod used a Single Band Algorithm (SBA) and assumed a constant water attenuation coefficient throughoutthe blue band. The second method used Principal Components Analysis (PCA) to adjust for varying waterattenuation coefficients without additional ground truth data. PCA method (r=-0.672394) appears to matchour control points slightly better than single band algorithm (r=-0.645404). It is clear that both methods can beused as rough estimates of bathymetry for many coastal zone studies in the southern Caspian Sea such as nearshore fisheries, coastal erosion, water quality, recreation siting and so forth. The presented methodology canbe considered as the first step toward mapping bathymetry in the southern Caspian Sea. Further research mustinvestigate the determination of the nonlinear optimization techniques as well as the assessment of thesemodels’ performance in the study area.
Key words: Bathymetry, Satellite Imagery, Single Band Algorithm (SBA), Principal Components Analysis (PCA), Caspian Sea
INTRODUCTIONRemotely sensed imagery is proving to be a useful
tool to estimate water depths in coastal zones aroundthe world. Procedures have been developed that isolatesolar reflectance due to water depth from other factors(Kumar and Jayappa, 2009; Ehsani and Quiel, 2010;Zhang et al., 2010; Siddiqui, 2011; Odindi andMhangara, 2012; Kowkabi et al., 2013; Mahmoodzadeh,2007). For instance, Lyzenga (1978) proposed a modifiedexponential depth model for clear shallow waters,ignoring the internal reflection in the water column;Louchard et al. (2003) used radiative transfercalculations to generate a spectral library of remotesensing reflectance to classify obtained reflectanceaccording to bottom type and water depth; Leu andChang (2005) used two dimensional wave spectrums toestimate water depths based on the principle that whilewaves propagate toward shoreline, these wave lengths
decrease due to decrements in water depth; Fonstadand Marcus (2005) combined remote sensing imageryand open channel flow principals to estimate waterdepths in clear rivers; Ceyhun and Yalçýn (2010)proposed Artificial Neural Networks (ANN) to estimatewater depths in shallow waters. ANNs allowsconsidering nonlinear multi-parameter relationshipbetween reflectance from different spectral bands andwater depths. These algorithms attempt to isolatewater attenuation and hence depth from other factorsby using different combinations of spectral bands.These multiple band techniques depend upon largeamounts of ground truth data and a fine enoughresolution to discriminate bottom types; they are alsolimited to the sensitivity to attenuation of the longestwavelengths used. These procedures are invaluableto Iranian coastal zone research because these areas
878
Gholamalifard, M. et al.
have not been extensively surveyed and are changingrapidly. In fact, we have a little ground truth knowledgeas to the depth or bottom type in the southern CaspianSea. Also unfortunately, in this research, we had accessonly to those satellite images with a resolution thatmade it difficult to discriminate sea bottom types. Onthe other hand, many coastal zone studies in thesouthern Caspian Sea, such as those examining near-shore fisheries, coastal erosion, water quality, orrecreation siting, are only concerned with areas ofshallow water and would benefit from easily updatedbathymetric estimates. In this research we calculatedbathymetry for a region in the north of Iran along thesouthern coasts of the Sea within MazandaranProvince.
The procedure uses an algorithm for transforminga single band of information into an index of waterdepth that can then be calibrated to known depths.The algorithm (Stoffle and Halmo, 1991) is one of afamily of algorithms that have been used to estimatebathymetry (Lyzenga, 1985; Paredes and Spero, 1983).These algorithms are based on the fact that radianceis, to varying degrees, attenuated by the water column.The degree of attenuation coefficient is a function ofwavelength, sea bottom types, and water columnproperties. However, when there is only one bandavailable, meaning the shortest wavelength in thevisible spectrum (blue), its best to try and take fulladvantage of its water penetrating properties. For thesereasons we use a Single Band Algorithm (SBA) whichassumes a constant attenuation coefficient andrequires the least amount of ancillary information. Thesecond procedure utilizes several bands of imageryand Principal Components Analysis (PCA). Thismethod is analogous to a Multi-Band Algorithm thataccounts for varying attenuation coefficients fordifferent bottom types as it calculates water depth,unlike the Single Band Algorithm (Van Hengel andSpitzer, 1991).
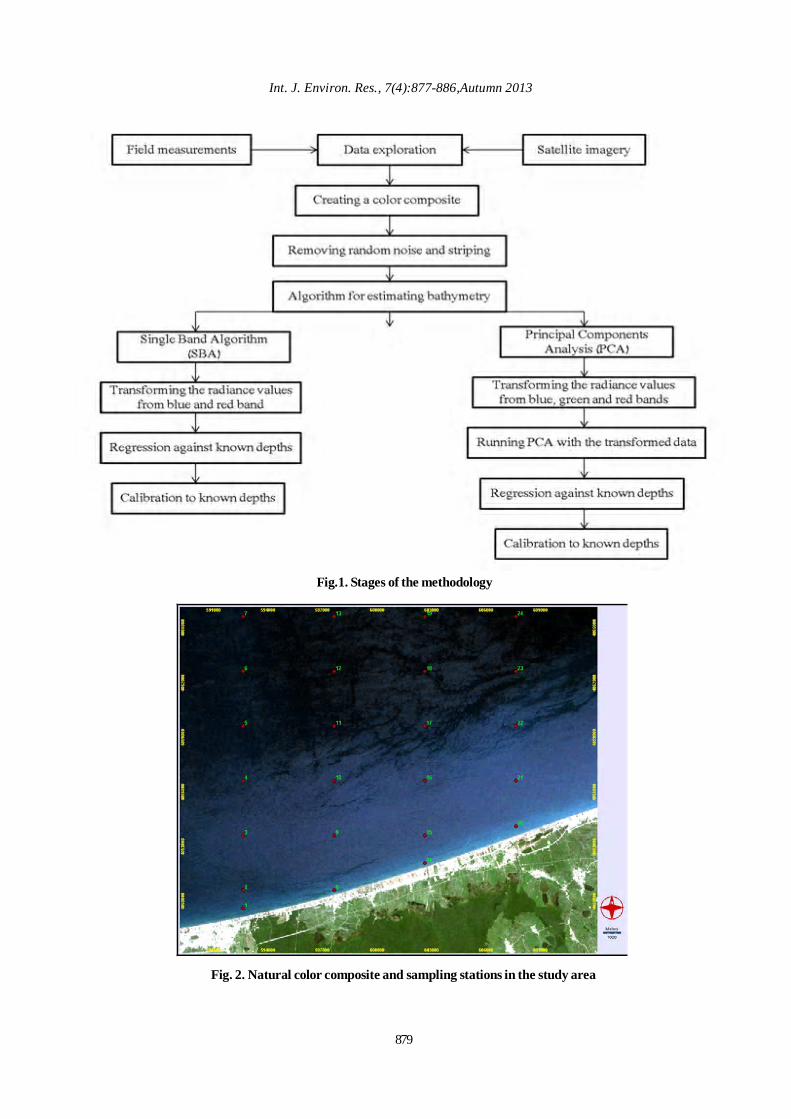
MATERIALS & METHODSThe different stages of methodology have been
shown in Fig. 1. Data provided for this researchinclude: Visible blue, green and red bands of TMLandsat Image (Data: 2010/06/04); A boolean image inwhich water has a value of one; A vector polygon ofthe known deep-water area (greater than 100 m) in theimagery; vector and value point file of the locations ofknown depths. Time and space of the coincident pairsof satellite and in situ data, called matchups, are thebasis for methodology. Therefore, 24 sampling pointswere determined according to stratified randomsampling scheme across imagery (Fig 2.) of which 12points (depth lesser than 40m) were used for
bathymetric algorithms. Stratified random samplingscheme is usually preferred since it combines the bestqualities of the unbiased character of the randomsampling scheme with an even geographic coverageof the systematic scheme.The term stratified in stratifiedrandom means that it is spatially stratified accordingto a systematic division of the area into rectangularregions. The Speedtech SM-5 Depthmate portablesounder used for concurrent sonar depthmeasurements. This unique pocket-sized depthsounder is very accurate and of very high quality andis useful for boating, fishing, scuba diving, coastalsurvey, and scientific work. The position of locationswas recorded using Garmin 62S Global PositioningSystem (GPS) receiver.
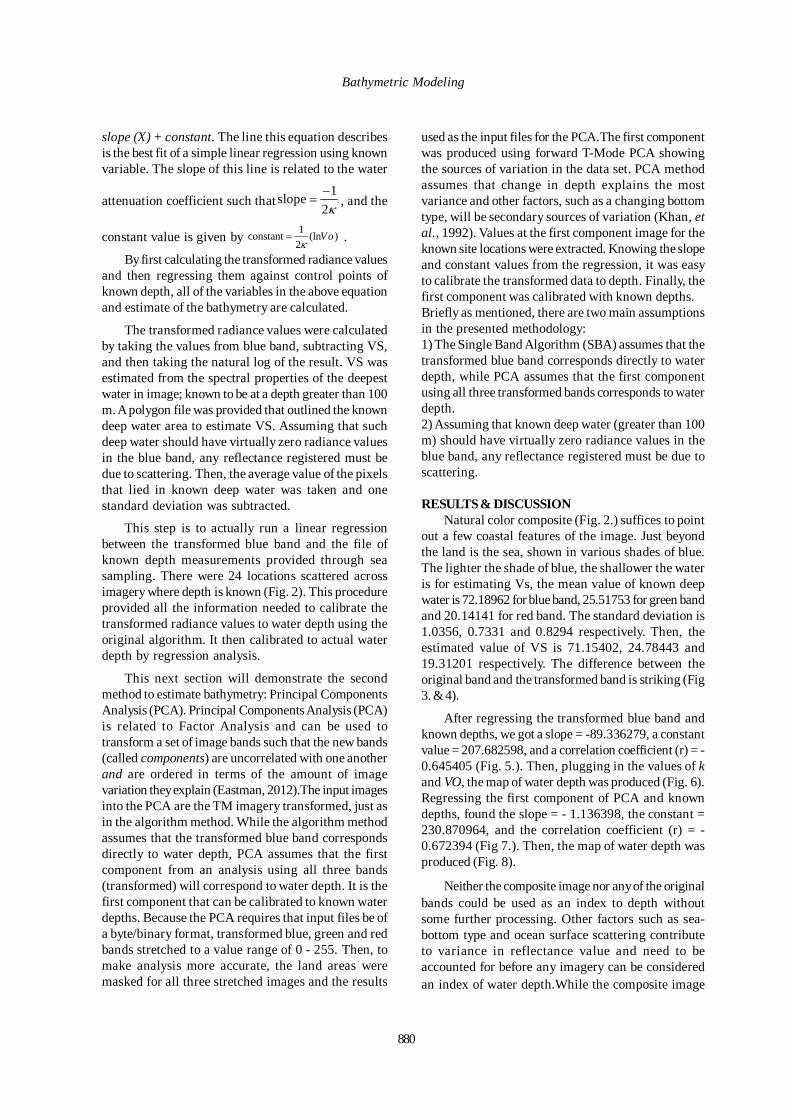
Clearly, without much knowledge of the area, it isdifficult to even separate the water areas from land inthe Landsat imagery. Therefore, to get a better idea ofthe area, we combined information from the blue, greenand red bands to produce a natural color compositeimage with original values and stretched saturationpoints and 2.5 as the percent to be saturated (Fig. 2).
There are two very important procedures that mustbe undertaken prior to bathymetric analysis. First theimage must be geometrically registered so thatcorresponding pixels in the entire image refer to exactlythe same place on the ground. Resampling or rubbersheeting is used with a set of control points to makeimage sets match a base map. The second pre-processing procedure involves the correction of theimagery to remove random noise and stripping. Boththe single band algorithm and the PCA method aresensitive to random noise and striping within the rawimagery. Therefore, the image has been enhanced witha low-pass (mean) filter.The algorithm is as follows (Stoffle and Halmo, 1991):
1 1Z ln( ) (ln )2 2
V Vs Voκ κ−
= − +
Where, Z = depth; V = observed signal radiance; Vs =portion of signal resulting from scattering of radiationin the atmosphere, water column and water surface;κ = water attenuation coefficient; Vo = sensitivity factorconsisting of contributions from solar irradiance at thesurface, the bottom reflectance, atmospherictransmission, and sensor equipment.
It assumes that the actual observed radiance (V)varies exponentially with water depth, after the portionof the signal due to scattering (VS) is removed, radianceis logarithmically transformed to a linear function ofdepth. The result can then be put back into theequation. The equation now takes the form of depth =
Int. J. Environ. Res., 7(4):877-886,Autumn 2013
879
Fig.1. Stages of the methodology
Fig. 2. Natural color composite and sampling stations in the study area
880
Bathymetric Modeling
slope (X) + constant. The line this equation describesis the best fit of a simple linear regression using knownvariable. The slope of this line is related to the water
attenuation coefficient such that1slope
2κ−
= , and the
constant value is given by 1constant (ln )2
Voκ
= .
By first calculating the transformed radiance valuesand then regressing them against control points ofknown depth, all of the variables in the above equationand estimate of the bathymetry are calculated.
The transformed radiance values were calculatedby taking the values from blue band, subtracting VS,and then taking the natural log of the result. VS wasestimated from the spectral properties of the deepestwater in image; known to be at a depth greater than 100m. A polygon file was provided that outlined the knowndeep water area to estimate VS. Assuming that suchdeep water should have virtually zero radiance valuesin the blue band, any reflectance registered must bedue to scattering. Then, the average value of the pixelsthat lied in known deep water was taken and onestandard deviation was subtracted.
This step is to actually run a linear regressionbetween the transformed blue band and the file ofknown depth measurements provided through seasampling. There were 24 locations scattered acrossimagery where depth is known (Fig. 2). This procedureprovided all the information needed to calibrate thetransformed radiance values to water depth using theoriginal algorithm. It then calibrated to actual waterdepth by regression analysis.
This next section will demonstrate the secondmethod to estimate bathymetry: Principal ComponentsAnalysis (PCA). Principal Components Analysis (PCA)is related to Factor Analysis and can be used totransform a set of image bands such that the new bands(called components) are uncorrelated with one anotherand are ordered in terms of the amount of imagevariation they explain (Eastman, 2012).The input imagesinto the PCA are the TM imagery transformed, just asin the algorithm method. While the algorithm methodassumes that the transformed blue band correspondsdirectly to water depth, PCA assumes that the firstcomponent from an analysis using all three bands(transformed) will correspond to water depth. It is thefirst component that can be calibrated to known waterdepths. Because the PCA requires that input files be ofa byte/binary format, transformed blue, green and redbands stretched to a value range of 0 - 255. Then, tomake analysis more accurate, the land areas weremasked for all three stretched images and the results
used as the input files for the PCA.The first componentwas produced using forward T-Mode PCA showingthe sources of variation in the data set. PCA methodassumes that change in depth explains the mostvariance and other factors, such as a changing bottomtype, will be secondary sources of variation (Khan, etal., 1992). Values at the first component image for theknown site locations were extracted. Knowing the slopeand constant values from the regression, it was easyto calibrate the transformed data to depth. Finally, thefirst component was calibrated with known depths.Briefly as mentioned, there are two main assumptionsin the presented methodology:1) The Single Band Algorithm (SBA) assumes that thetransformed blue band corresponds directly to waterdepth, while PCA assumes that the first componentusing all three transformed bands corresponds to waterdepth.2) Assuming that known deep water (greater than 100m) should have virtually zero radiance values in theblue band, any reflectance registered must be due toscattering.
RESULTS & DISCUSSIONNatural color composite (Fig. 2.) suffices to point
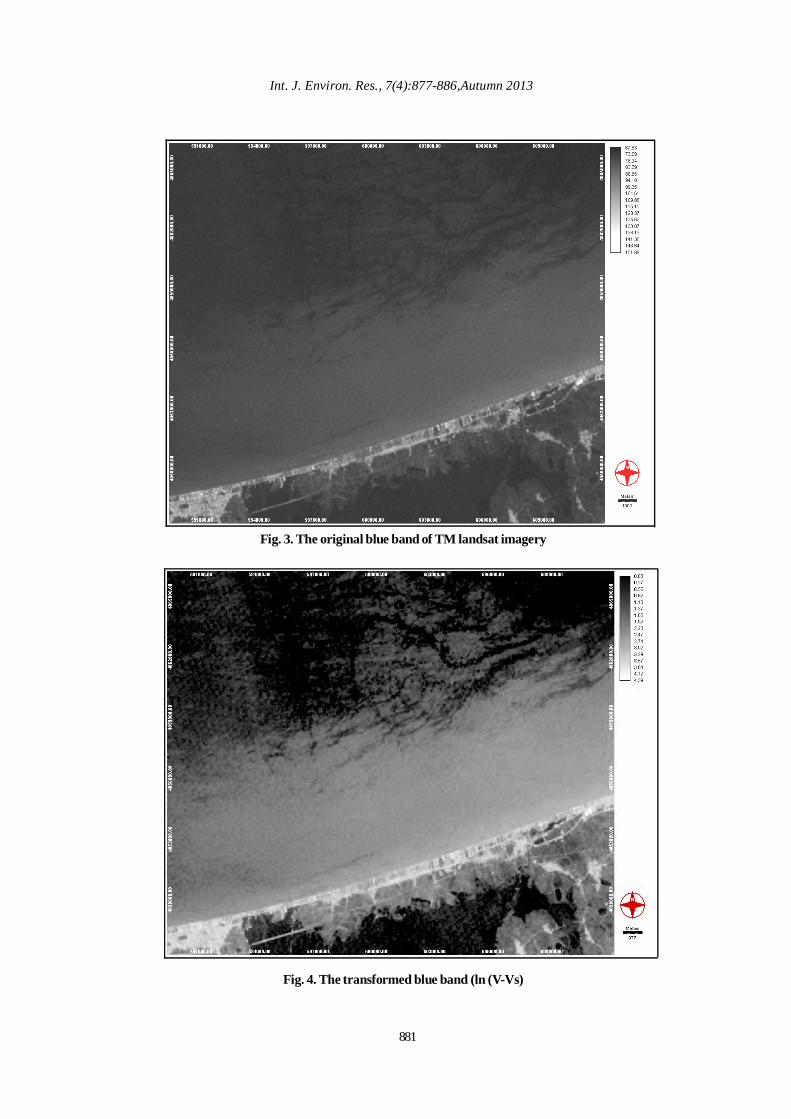
out a few coastal features of the image. Just beyondthe land is the sea, shown in various shades of blue.The lighter the shade of blue, the shallower the wateris for estimating Vs, the mean value of known deepwater is 72.18962 for blue band, 25.51753 for green bandand 20.14141 for red band. The standard deviation is1.0356, 0.7331 and 0.8294 respectively. Then, theestimated value of VS is 71.15402, 24.78443 and19.31201 respectively. The difference between theoriginal band and the transformed band is striking (Fig3. & 4).
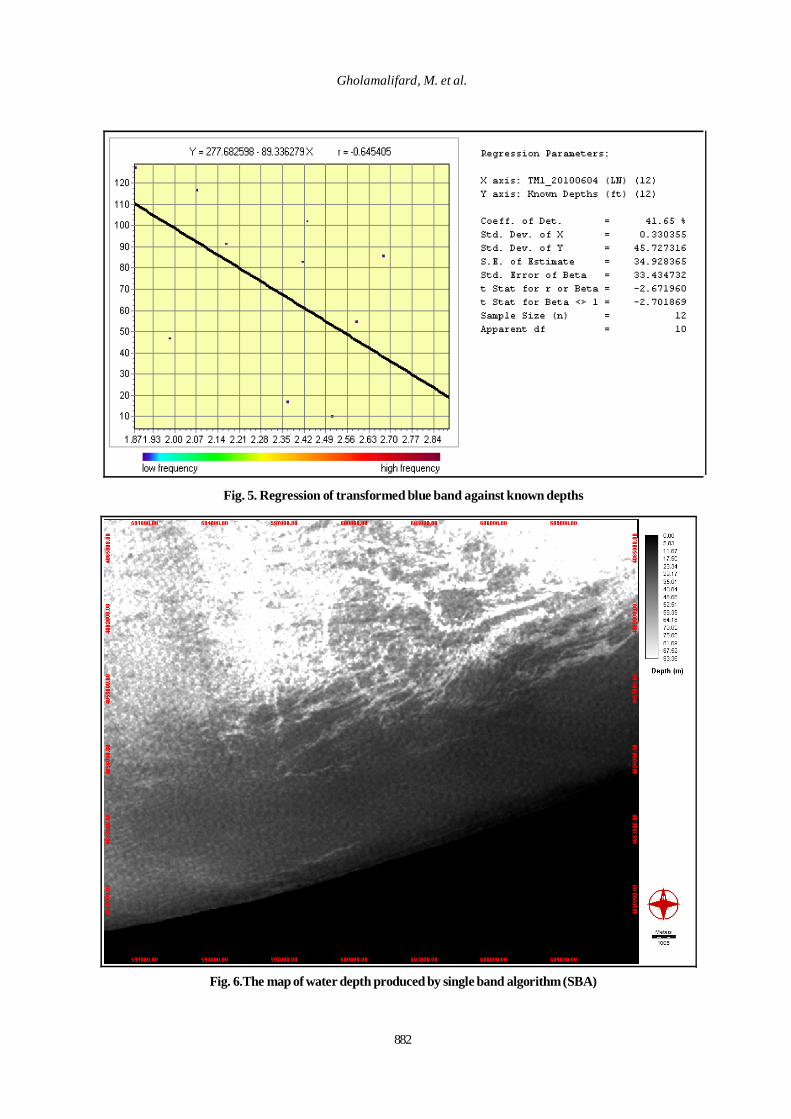
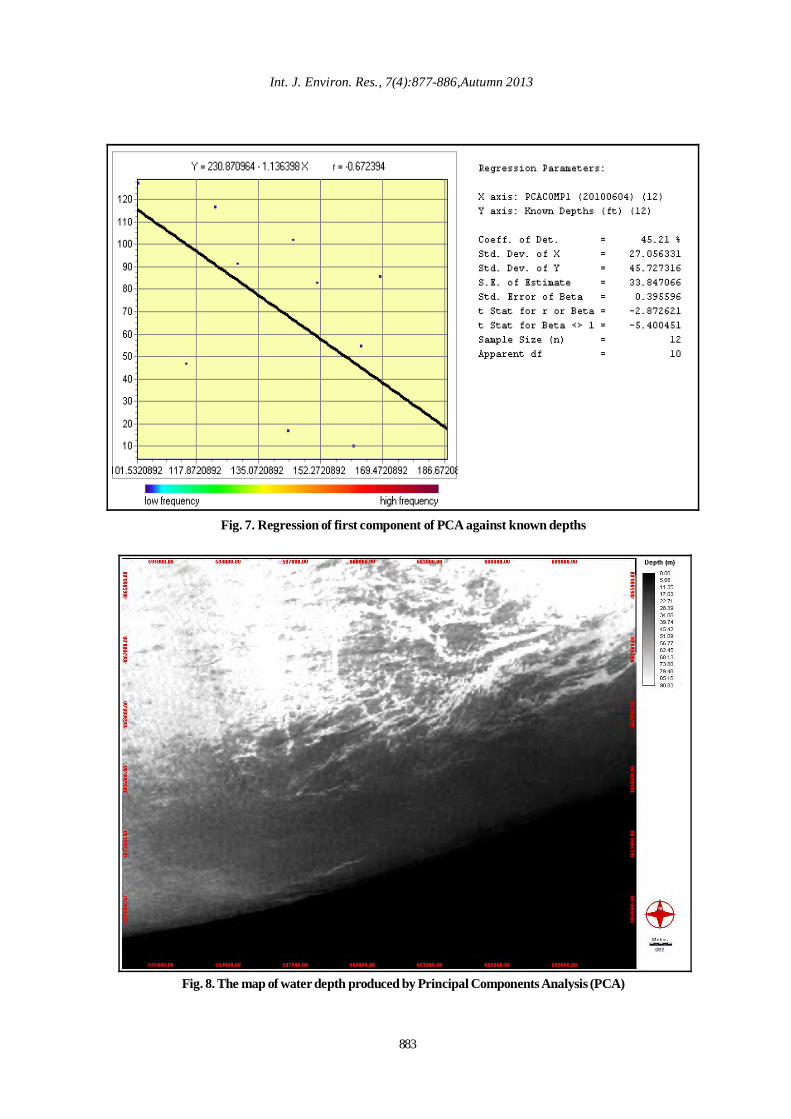
After regressing the transformed blue band andknown depths, we got a slope = -89.336279, a constantvalue = 207.682598, and a correlation coefficient (r) = -0.645405 (Fig. 5.). Then, plugging in the values of kand VO, the map of water depth was produced (Fig. 6).Regressing the first component of PCA and knowndepths, found the slope = - 1.136398, the constant =230.870964, and the correlation coefficient (r) = -0.672394 (Fig 7.). Then, the map of water depth wasproduced (Fig. 8).
Neither the composite image nor any of the originalbands could be used as an index to depth withoutsome further processing. Other factors such as sea-bottom type and ocean surface scattering contributeto variance in reflectance value and need to beaccounted for before any imagery can be consideredan index of water depth.While the composite image
881
Int. J. Environ. Res., 7(4):877-886,Autumn 2013
Fig. 3. The original blue band of TM landsat imagery
Fig. 4. The transformed blue band (ln (V-Vs)
882
Gholamalifard, M. et al.
Fig. 6.The map of water depth produced by single band algorithm (SBA)
Fig. 5. Regression of transformed blue band against known depths
883
Int. J. Environ. Res., 7(4):877-886,Autumn 2013
Fig. 8. The map of water depth produced by Principal Components Analysis (PCA)
Fig. 7. Regression of first component of PCA against known depths
884
Bathymetric Modeling
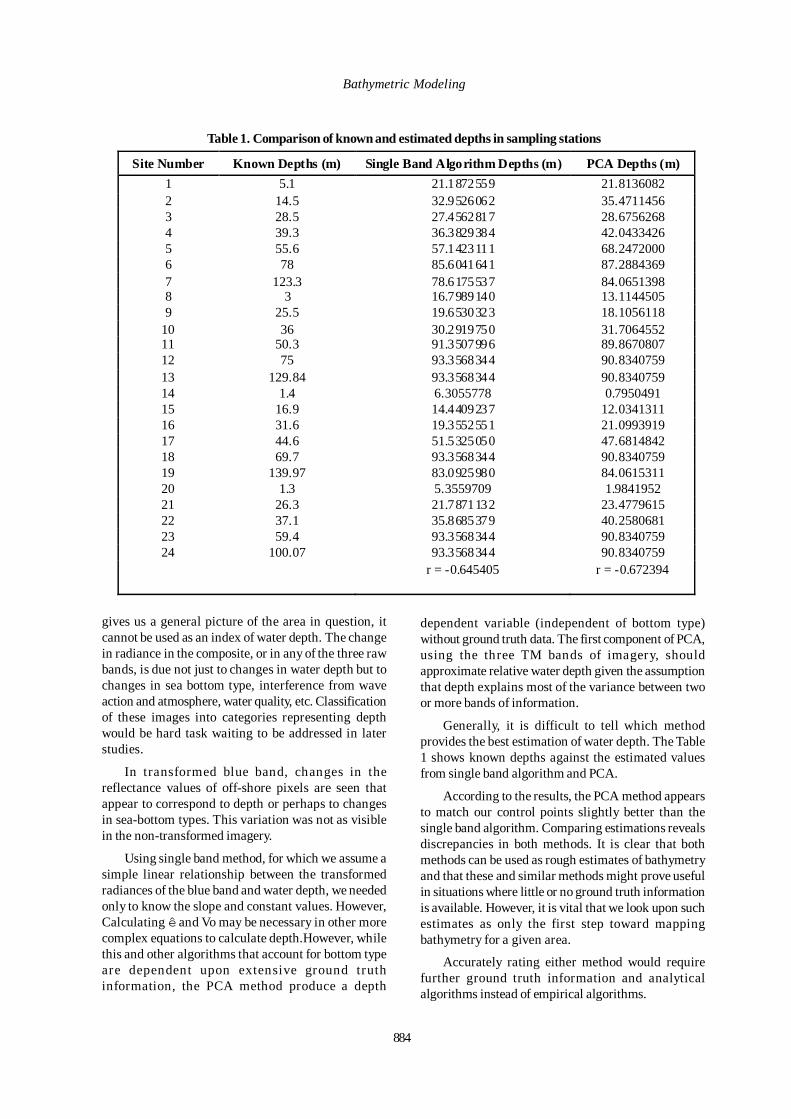
Table 1. Comparison of known and estimated depths in sampling stations
Site Number Known Depths (m) Single Band Algorithm Depths (m) PCA Depths (m) 1 5.1 21.1872559 21.8136082 2 14.5 32.9526062 35.4711456 3 28.5 27.4562817 28.6756268 4 39.3 36.3829384 42.0433426 5 55.6 57.1423111 68.2472000 6 78 85.6041641 87.2884369 7 123.3 78.6175537 84.0651398 8 3 16.7989140 13.1144505 9 25.5 19.6530323 18.1056118
10 36 30.2919750 31.7064552 11 50.3 91.3507996 89.8670807 12 75 93.3568344 90.8340759 13 129.84 93.3568344 90.8340759 14 1.4 6.3055778 0.7950491 15 16.9 14.4409237 12.0341311 16 31.6 19.3552551 21.0993919 17 44.6 51.5325050 47.6814842 18 69.7 93.3568344 90.8340759 19 139.97 83.0925980 84.0615311 20 1.3 5.3559709 1.9841952 21 26.3 21.7871132 23.4779615 22 37.1 35.8685379 40.2580681 23 59.4 93.3568344 90.8340759 24 100.07 93.3568344 90.8340759
r = -0.645405 r = -0.672394
gives us a general picture of the area in question, itcannot be used as an index of water depth. The changein radiance in the composite, or in any of the three rawbands, is due not just to changes in water depth but tochanges in sea bottom type, interference from waveaction and atmosphere, water quality, etc. Classificationof these images into categories representing depthwould be hard task waiting to be addressed in laterstudies.
In transformed blue band, changes in thereflectance values of off-shore pixels are seen thatappear to correspond to depth or perhaps to changesin sea-bottom types. This variation was not as visiblein the non-transformed imagery.
Using single band method, for which we assume asimple linear relationship between the transformedradiances of the blue band and water depth, we neededonly to know the slope and constant values. However,Calculating ê and Vo may be necessary in other morecomplex equations to calculate depth.However, whilethis and other algorithms that account for bottom typeare dependent upon extensive ground truthinformation, the PCA method produce a depth
dependent variable (independent of bottom type)without ground truth data. The first component of PCA,using the three TM bands of imagery, shouldapproximate relative water depth given the assumptionthat depth explains most of the variance between twoor more bands of information.
Generally, it is difficult to tell which methodprovides the best estimation of water depth. The Table1 shows known depths against the estimated valuesfrom single band algorithm and PCA.
According to the results, the PCA method appearsto match our control points slightly better than thesingle band algorithm. Comparing estimations revealsdiscrepancies in both methods. It is clear that bothmethods can be used as rough estimates of bathymetryand that these and similar methods might prove usefulin situations where little or no ground truth informationis available. However, it is vital that we look upon suchestimates as only the first step toward mappingbathymetry for a given area.
Accurately rating either method would requirefurther ground truth information and analyticalalgorithms instead of empirical algorithms.
885
Int. J. Environ. Res., 7(4):877-886,Autumn 2013
CONCLUSIONThe first method used a single band algorithm and
assumed a constant water attenuation coefficientthroughout the blue band. To assume otherwise wouldhave required more ground truth knowledge aboutbottom type than was not available. When such datais available, there are a number of algorithms that mightbe used to effectively isolate changes in depth fromchanges in other factors. When not available, the singleband method works well as a rough estimate ofbathymetry as our analysis has shown. The secondmethod used Principal Components Analysis (PCA) inan attempt to adjust for varying water attenuationcoefficients without additional ground truth data. Thisprocedure is based on the assumption that the firstcomponent result of PCA, which explains most of thevariance in the data set, will be a depth-dependentvariable that is independent of other sources ofvariation such as bottom type. After producing thefirst component image and calibrating it to knowndepths, we compared the results to the algorithmmethod.
Apart from the presented methodology, nonlinearoptimization techniques and other machine learningmethods such as Artificial Neural Networks (ANNs)provide an interesting alternative to examine complexcoastal waters and to handle multivariate data. Modelsbased on these methods determine the output values(e.g., the bathymetric values) from input data (e.g., waterreflectance at various wavelengths) through nonlinearmultidimensional parametr ic functions. Thedetermination of the model parameters, as well as theassessment of the model performance rely on areference data set and are suggested as an applicableresearch topic in the southern Caspian Sea. In anymethod we must be aware of the possibility for error ateach of the steps involved and continually questionour results. While the dynamic nature of the coastmakes precision in bathymetric estimation difficult (e.g.tides, waves, lack of ground truth information), it alsomakes such analyses essential if we are to have recentand/or time series data for the coastal zone.
ACNOWLEDGEMENTThe study presented here is part of the dissertation
in partial fulfillment of the requirements for the degreeof Ph.D. in Tarbiat Modarres University (T.M.U.) ofIran. The authors extend their appreciation for thesupport provided by the authorities of the TarbiatModares University in funding the study andpresenting its results in the IJER.First and foremost, the first author would like to thankDr. Nemat Mahmoudi for continuing encouragementand support in the preparation of the field data. Also,
thanks to Dr. Mahmoud Valizadeh and Mr. Gholizadehfor much help during sampling.
REFERENCESCeyhun, O and Yalçýn, A. (2010). Remote sensing of waterdepths in shallow waters via artificial neural networks.Estuarine, Coastal and Shelf Science, 89, 89-96.
Eastman, R. J. (2012). Guide to GIS and Remote Sensing,IDRISI Selva Manual, Clarklabs 322 Pages.
Ehsani, A . H . and Quiel, F. (2010). Efficiency of LandsatETM+ Thermal Band for Land Cover Classification of theBiosphere Reserve “Eastern Carpathians” (Central Europe)Using SMAP and ML Algorithms. Int. J. Environ. Res., 4(4), 741-750.
Fonstad, M. A. and Marcus, W. A. (2005). Remote sensingof stream depths with hydraulically assisted bathymetry(HAB) models. Geomorphology, 72 (4), 320-339.
Khan, M. A., Fadlallah, Y. H. and Al-Hinai, K. G. (1992).Thematic Mapping of subtidal Coastal Habitats in theWestern Arabian Gulf using Landsat TM data—Abu AliBay, Saudi Arabia. International Journal of Remote Sensing,13 (4), 605-614.
Kowkabi, L., Rahman setayesh, A. R., Badri, A. and Rajaee,A. (2013). The Application of Fuzzy Multi-attribute GroupDecision Making to Prioritize the Landscapes with highEcological value: Khoshk River in Shiraz. Int. J. Environ.Res., 7 (2), 423-434.
Kumar, A. and Jayappa, K. S. (2009). Long and Short-TermShoreline Changes Along Mangalore Coast, India. Int. J.Environ. Res., 3 (2), 177-188.
Leu, L. and Chang, H. (2005). Remotely sensing in detectingthe water depths and bed load of shallow waters and theirchanges. Ocean Engineering, 32, 1174-1198.
Louchard, E. M., Reid, R. P., Stephens, F. C., Davis, C. O.,Leathers, R. A. and Downes, T. V. (2003). Optical remotesensing of benthic habitats and bathymetry in coastalenvironments at Lee stocking Island, Bahamas: a comparativespectral classification approach. Limnology andOceanography, 48 (1, 2), 511-521.
Lyzenga, D. R. (1978). Passive remote sensing techniquesfor mapping water depth and bottom features. AppliedOptics, 17, 379-383.
Lyzenga, D. R. (1985).Shallow-water Bathymetry usingCombined Lidar and passive Multispectral Scanner Data.International Journal of Remote Sensing, 6 (1), 115-125.
Mahmoodzadeh, H. (2007). Digital Change Detection UsingRemotely Sensed Data for Monitoring Green SpaceDestruction in Tabriz. Int. J. Environ. Res., 1 (1), 35-41.
Odindi, J. O. and Mhangara, P. (2012). Green Spaces Trendsin the City of Port Elizabeth from 1990 to 2000 using RemoteSensing. Int. J. Environ. Res., 6 (3), 653-662.
Paredes, J. M. and Spero, R. E. (1983). Water DepthMapping from Passive Remote Sensing Data Under a

886
Gholamalifard, M. et al.
Generalized Ratio Assumption. Applied Optics, 22(8), 1134-1135.
Siddiqui, Z. (2011). Holistic Approach to Mitigate thePollution Impacts in the Coastal Ecosystem of ThailandUsing the Remote Sensing Techniques. Int. J. Environ. Res.,5 (2), 297-306.
Stoffle, R. W. and Halmo, D.B . (1991) SatelliteMonitoring of Coastal Marine Ecosystems: A Case fromthe Dominican Republic. Consortium for Integrated EarthScience Information Network (CIESIN). Saginaw,Michigan.
Van Hengel, W. and Spitzer, D. (1991). Multi-temporal WaterDepth Mapping by Means of Landsat TM.” InternationalJournal of Remote Sensing, 12(4), 703-712.
Zhang, H. H., Zeng, Y. N. and Bian, L. (2010). SimulatingMulti-Objective Spatial Optimization Allocation of LandUse Based on the Integration of Multi-Agent System andGenetic Algorithm. Int. J. Environ. Res., 4 (4), 765-776.