başkent university institute of science and engineering big-data and ...
85
BAŞKENT UNIVERSITY INSTITUTE OF SCIENCE AND ENGINEERING BIG-DATA AND A BIG-DATA APPLICATION LÜTFİ KÖSE MSc. THESIS 2015
Transcript of başkent university institute of science and engineering big-data and ...

BAŞKENT UNIVERSITY
INSTITUTE OF SCIENCE AND ENGINEERING
BIG-DATA AND A BIG-DATA APPLICATION
LÜTFİ KÖSE
MSc. THESIS
2015

BIG-DATA AND A BIG-DATA APPLICATION
BÜYÜK-VERİ VE BİR BÜYÜK-VERİ UYGULAMASI
LÜTFİ KÖSE
Thesis Submitted
in Partial Fulfillment of the Requirements
For the Degree of Master of Science
in Department of Computer Engineering
at Başkent University
2015

This thesis, titled: “BIG-DATA AND A BIG-DATA APPLICATION”, has been
approved in partial fulfillment of the requirements for the degree of MASTER OF
SCIENCE IN COMPUTER ENGINEERING, by our jury, on 27/08/2015.
Chairman :
(Prof. Dr. İbrahim AKMAN)
Member (Supervisor) :
(Prof. Dr. A. Ziya AKTAŞ)
Member :
(Assoc. Prof. Dr. Hasan OĞUL)
APPROVAL
…..../..../........
Prof. Dr. Emin AKATA
Institute of Science and Engineering

ACKNOWLEDGEMENTS
I would like to express my gratitude and appreciation to my supervisor Prof. Dr. A.
Ziya AKTAŞ for his valuable guidance, support, advice and encouragements during
all the stages of my thesis.
I am also very grateful to my family for their endless love and support.
Lütfi KÖSE

i
ABSTRACT
BIG-DATA AND A BIG-DATA APPLICATION
Lütfi KÖSE
Başkent University Institute of Science and Engineering
The Department of Computer Engineering
Recently, data in a Big-Data are gleaned from nontraditional sources such as blogs,
social media, emails, sensors, photographs, video footage, etc. Therefore, they are
typically unstructured and voluminous. Yet, they hold the promise of giving
enterprises deeper insight into their customers, partners, and businesses. Such
data can provide answers to questions that they were not asked earlier. Enterprises
must learn to understand how best to use Big-Data.
This point implies importance of a Big-Data Development Strategy. In the study,
after present definitions of Big-Data, previous studies about Big-Data are given, a
development strategy will be proposed. This strategy used in a Big-Data application
will be given with real-data to collect sentiment analysis of airline customers.
KEYWORDS: Big-Data, Big-Data definitions, Big-Data development model,
Sample Big-Data applications, and Sentiment analysis.
Advisor: Prof. Dr. A. Ziya AKTAŞ, Başkent University, Department of Computer
Engineering.

ii
ÖZ
BÜYÜK-VERİ VE BİR BÜYÜK-VERİ UYGULAMASI
Lütfi KÖSE
Başkent Üniversitesi Fen Bilimleri Enstitüsü
Bilgisayar Mühendisliği Anabilim Dalı
Büyük-Veri ile ilgili veriler bloglar, sosyal medya, elektronik postalar, sensörler,
fotoğraflar veya videolar gibi geleneksel olmayan büyük boyutlarda ve çok çeşitli
kaynaklardan derlenir. Böylelikle, firmalar müşterileri, rakipleri veya ortakları için
daha fazla kestirimde bulunabilirler. Geleneksel olmayan böyle bir veri yığını daha
önce sorulmamış sorulara cevap olabilir. Dahası, firmalar Veri Madenciliği gibi
analiz mekanizmalarını kullanarak bu veri kümelerinden daha iyi yararlanabilirler.
Firmalar Büyük-Veri uygulamalarında en yüksek yarar edinmeyi ve doğru kullanımı
amaç edinmelidirler.
Bu çalışmada Büyük-Veri tanımı, geçmiş uygulamaları, diğer disiplinlere olan
ilişkileri ile ilgili genel bilgiler verildikten sonra, önce Büyük-Veri kavramı
tanımlanmış ardından bu alanda kullanılabilecek bir uygulama geliştirme stratejisi
önerilmiş ve gerçek veriler kullanılarak örnek Büyük-Veri üzerinde uygulamasında
duygu analizi yapılmıştır.
ANAHTAR SÖZCÜKLER: Büyük-Veri, Büyük-Veri tanımları, Büyük-Veri geliştirme
modeli, Büyük-Veri uygulama örnekleri, Duygu analizi.
Danışman: Prof. Dr. A. Ziya AKTAŞ, Başkent Üniversitesi, Bilgisayar Mühendisliği
Bölümü

iii
TABLE OF CONTENTS
Page
ABSTRACT .............................................................................................................. i
ÖZ ........................................................................................................................... ii
TABLE OF CONTENTS .......................................................................................... iii
TABLE OF FIGURES .............................................................................................. v
TABLE OF ABBREVIATIONS ................................................................................. vi
1 INTRODUCTION .............................................................................................. 1
1.1 Scope and Topic ...................................................................................... 1
1.2 Previous Works ....................................................................................... 3
1.3 Objectives of the Thesis and Definition of the Problem ........................... 7
1.4 Organization of the Thesis ....................................................................... 7
2 WHAT IS BIG-DATA? AND A PROPOSED DEFINITION .................................. 9
2.1 Available Definitions of Big-Data ............................................................. 9
2.2 A Proposed Definition of Big-Data ......................................................... 10
2.3 Fundamentals of Big-Data ..................................................................... 10
2.3.1 Key characteristics of Big-Data ..................................................... 11
2.3.2 Additional characteristics of Big-Data ........................................... 13
2.3.3 Types of data in Big-Data ............................................................. 15
2.3.4 Various trends behind Big-Data .................................................... 15
2.3.5 Big-Data views of some companies ............................................. 16
2.3.6 Cloud Computing and Big-Data .................................................... 18
2.3.7 Database, OLAP vs. Big-Data ...................................................... 19
2.3.8 Big-Data and analytics.................................................................. 21
2.3.9 Is Big-Data volume or technology? ............................................... 23
2.3.10 Challenges and opportunities of Big-Data ..................................... 23
3 WHY BIG-DATA IS NEEDED AND SOME EXAMPLES .................................. 25
3.1 Why Big-Data Is Needed? ..................................................................... 25
3.1.1 For creating smarter, leaner organizations ................................... 25
3.1.2 For equipping organization ........................................................... 25
3.1.3 For preparing your organization for the inevitable future .............. 25
3.2.1 Application domains of Big-Data .................................................. 25
3.2.2 Some examples of Big-Data ......................................................... 26
3.2.3 Additional examples of Big-Data .................................................. 27
4 HADOOP ........................................................................................................ 31
4.1 Key Features ......................................................................................... 31
4.2 Hadoop Core Modules ........................................................................... 32
4.3 Hadoop Cluster ...................................................................................... 33
4.4 Hadoop and Big-Data ............................................................................ 34
4.4.1 What Hadoop can't do? ................................................................ 35
4.4.2 What Hadoop can do? .................................................................. 36
4.5 Hortonworks Data Platform .................................................................... 36

iv
5 A STRATEGY PROPOSAL FOR BIG-DATA APPLICATIONS ......................... 38
5.1 General .................................................................................................. 38
5.2 Various Strategy Proposals .................................................................... 38
5.2.1 Strategy proposal 1 ...................................................................... 38
5.2.2 Strategy proposal 2 ...................................................................... 39
5.2.3 Strategy proposal 3 ...................................................................... 41
5.3 Some Hints for Big-Data Applications .................................................... 42
5.4 A New Development Strategy Proposal for Big-Data Applications ......... 44
6 AN APPLICATION........................................................................................... 47
6.1 Introduction ............................................................................................ 47
6.2 Problem Definition ................................................................................. 47
6.3 Big-Data Application Development with Suggested Strategy Proposal .. 47
6.3.1 Start with the business vision ....................................................... 47
6.3.2 Define how the business will need to use the data ....................... 48
6.3.3 Map-out the data .......................................................................... 48
6.3.4 Define your business use case..................................................... 49
6.3.5 Conduct a current state assessment ............................................ 50
6.3.6 Evaluate current state objectively ................................................. 51
6.3.7 Plan your project .......................................................................... 51
6.3.8 Define technical requirements ...................................................... 52
6.3.9 Creating a total business value assessment ................................ 53
6.3.10 Implementation ............................................................................. 53
6.3.11 Ongoing commitment .................................................................... 64
6.4 Discussion of the Results ...................................................................... 64
7 SUMMARY AND CONCLUSIONS .................................................................. 65
7.1 Summary ............................................................................................... 65
7.2 Conclusion ............................................................................................. 65
7.3 Extensions of the Thesis ........................................................................ 66
REFERENCES ..................................................................................................... 67
APPENDICES ...................................................................................................... 71
Appendix A - Hive Script ................................................................................. 71
Block 1 ..................................................................................................... 71
Block 2 ..................................................................................................... 71
Block 3 ..................................................................................................... 72
Block 4 ..................................................................................................... 73
Block 5 ..................................................................................................... 73
Block 6 ..................................................................................................... 74
Appendix B - Dictionary File ........................................................................... 74

v
TABLE OF FIGURES
Figure 2.1 Data Management Solution .............................................................. 11
Figure 4.1 Hadoop Core Modules ..................................................................... 33
Figure 4.2 Hadoop Cluster ................................................................................ 34
Figure 5.1 A Development Strategy Proposal for Big-Data Applications ........... 46
Figure 6.1 Samples of Twitter Data Set ............................................................ 49
Figure 6.2 A Basic Business Use Case Diagram .............................................. 50
Figure 6.3 Application Development Activity Diagram ....................................... 52
Figure 6.4 Oracle Virtual Box Download Screen ............................................... 54
Figure 6.5 HDP 2.0 Download Screen .............................................................. 54
Figure 6.6 Oracle Virtual Box Main Screen ....................................................... 55
Figure 6.7 Oracle Virtual Box Screen after HDP Installation ............................. 55
Figure 6.8 Dataset Download Screen ............................................................... 56
Figure 6.9 Dataset in Upload.zip ....................................................................... 56
Figure 6.10 Hive Script (hiveddl.sql) in Upload.zip ............................................. 57
Figure 6.11 Sentiment Dictionary in Upload.zip .................................................. 57
Figure 6.12 HDP Start Screen ............................................................................ 58
Figure 6.13 HDP Data Upload Screen ................................................................ 58
Figure 6.14 HDP Terminal Screen ...................................................................... 59
Figure 6.15 Hive Script Process ......................................................................... 60
Figure 6.16 Raw Dataset in Hcatalog ................................................................. 61
Figure 6.17 Raw Dataset and Microsoft Excel Power View Link ......................... 61
Figure 6.18 Power View Map Report Link .......................................................... 62
Figure 6.19 Overall Sentiment Analysis Result ................................................... 62
Figure 6.20 Sentiment Analysis of Boston .......................................................... 63
Figure A.1 Code Block 1 ..................................................................................... 71
Figure A.2 Code Block 2 ..................................................................................... 72
Figure A.3 Code Block 3 ..................................................................................... 72
Figure A.4 Code Block 4 ..................................................................................... 73
Figure A.5 Code Block 5 ..................................................................................... 73
Figure A.6 Code Block 6 ..................................................................................... 74
Figure B.1 Sample Data of Sentiment Dictionary ............................................... 75

vi
TABLE OF ABBREVIATIONS
API Application Programming Interface
AWS Amazon Web Service
BI Business Intelligence
CAP Community Activity Prediction
CDR Call Detail Records
CRM Customer Relationship Management
EAI Enterprise Application Integration
ERP Enterprise Resource Planning
ETL Extract, Load and Transform
ETLM Extract, Transform, Load and Management
GPS Global Positioning System
HP Hadoop Platform
HDFS Hadoop Distributed File System
HDP Hortonworks Data Platform
IaaS Infrastructure as a Service (Cloud Computing)
IT Information Technologies
I/O In-Out
MGI Macquarie Global Investments
NBC Naive Bayes Classifier
OLAP On Line Analytical Processing
UN United Nations
PaaS Platform as a Service (Cloud Computing)
POS Point of Sale
RDBMS Relational Database System
RFID Radio Frequency Identification
SAN Storage Area Network
SNA Social Network Analysis
SaaS Software as a Service (Cloud Computing)
SODATO Social Data Analytics Tool
VM Virtual Machine

1
1 INTRODUCTION
In global economy, nearly all big organizations have begun to rely on feedbacks
from their customers, business operations and lastly organization’s interior
processes to unhide new opportunities for sustainable economic growth. In the
process of discovering these insights, massive volume data sets generated that
should be managed and manipulated by highly skilled data professionals and data
scientists.
Jawell et al. [1] states that Big-Data is now a hot-topic and it is used to represent
huge volume of both unstructured and structured data that is hard to handle with
only relational-database and traditional analysis techniques to create Big-Data
analytics. In most common enterprise scenarios the data is too massive. Big-Data
has great potential to help organizations to improve their operations and more
intelligent decisions.
1.1 Scope and Topic
When we consider current patterns on the world, there are over a billion dynamic
clients of online networking system around the world, awesome measure of whom
are often online and they can be joined by method for their cells and tablets.
Without a doubt, online networking has turned into a fundamental communication
flow in the daily lives of individuals. This communication flow gives gigantic
measure of information named Big-Data.
Big-Data can really prompt awesome bits of knowledge; one can have the capacity
to make sense of the main driver of issues and disappointments and additionally
tricky conduct that influences the incomes of ones’ businesses.
Big-Data permits connections to be found as far as deciding business patterns,
nature of exploration, connection legitimate references and control simultaneous
roadway web traffic conditions.

2
In any case, working with Big-Data is having different assets. It differs relying upon
the abilities of the gathering who deal with the set and considering the applications
they utilize. Big-Data may take many terabytes volume before the information size
is considered as huge. Big-Data are gathering of information sets that are hard to
handle with conventional databases. Enormous Data innovation offers critical
commitments yet creates unprecedented difficulties.
Here are some of the advantages of using Big-Data in marketing:
Define root causes of disasters, flaws in near-real time, conceivably sparing
billions of dollars yearly.
Produce campaign at the purpose of offer contingent upon the client's
available and past buys.
Send customized proposals to cell phones while clients are in the right
region to exploit offers.
Recalculate whole hazard portfolios in not more than minutes.
Swiftly discover clients who matter
Reasons to investigate Big-Data with Social Media Analytics:
Reason# 1 Social Media has numerous variables that add to the increment
of data volume to investigate. There are unstructured data gushing and in
addition increment of sensor and machine to machine data being gathered.
Fitting utilization of Social Media Analytics can help make esteem which is
huge to the important data.
Reason# 2 Social Media Analytics and Velocity. It is fascinating to
investigate this component in Social Media analytics as this is one of the
considerable difficulties for some associations.
Reason# 3 Social Media Analytics and Variety. Data in Social Media come in
a wide range of data formats. Organized numeric data in customary
databases, data created from line-of-business applications, unstructured

3
content archives, email, feature, sound, stock ticker data and money related
exchanges all comes in diverse sorts of organizations.
Reason# 4 Social Media Analytics and Variability. Online networking data
streams can be exceptionally capricious with occasional crests. Such data
loads from what's drifting in Social media, stirred up with unstructured data
are significantly all the more difficult to oversee yet intriguing to investigate.
Reason# 5 Social Media Analytics and Complexity. Data in Social Media
originates from various sources. It is an incredible test to experience the
distinctive procedures like connecting, coordinating, uniting, corresponding
connections, chains of importance and different data linkages. This is the
means by which complex data can be and if not oversaw appropriately, they
can winding wild.
1.2 Previous Works
Meaning of Big-Data isn't obviously characterized by just volume, it's all the more
about multifaceted nature. Numerous little datasets that are viewed as Big-Data
don't expend much physical space. In the meantime, large datasets that require
noteworthy physical space may not be sufficiently unpredictable to be viewed as
Big-Data. Variety references the diverse sorts of organized and unstructured data
that associations can gather, for example, exchange level data, feature and sound,
or content and log records. Velocity is a sign of how rapidly the data can be made
accessible for investigation.
In addition to the three V’s, some add a fourth V as Veracity to the Big-Data
definition. Current business model and conditions are pushing traditional data
management principles on their boundaries. Because of this 3 dimensions of Data
must be considered when we manage the data which are Volume, Velocity and
Variety called Three V model defined by Laney [2].
One of the Four V Models of Big-Data defined by Dijks [3] adding with Value

4
attribute in addition to volume, velocity and variety, defined as:
• Volume: Auto-generated data which is from machine, is made in much
bigger than non-customary dataset. Case in point, a solitary plane motor can
produce 10TB of data in 30 minutes. With more than 25,000 aircraft flights
for every day, the day by day volume of simply this single data source keeps
running into the Petabytes.
• Velocity: Social media data streams - while not as huge as
machine-generated data – produce a huge convergence of sentiments and
connections important to client relationship administration. Indeed, even at
140 characters for every tweet, the high speed (or recurrence) of Twitter
data guarantees expansive volumes. (Over 8 TB per day).
• Variety: Conventional data configurations have a tendency to be moderately
all around characterized by a data construction and change gradually.
Interestingly, non-customary data organizations show a bewildering rate of
progress. As new administrations are included, new sensors sent, or new
marketing battles executed, new data sorts are expected to catch the
resultant data.
• Value: The financial estimation of diverse data shifts essentially. Normally
there is great data covered up among a bigger assortment of
non-conventional data; the test is distinguishing what is profitable and
afterward changing and separating that data for investigation.
Another Four V Model is considered which is stated by Zhang et al. [4] with its fast
growing scale, crowd sensing data will soon exhibit the Four V characteristics of
Big-Data, making such datasets intensely different from the traditional datasets.
• Volume: The volume of such a dataset will be big to the point that it can't be
handled by customary data innovation (IT) and programming/equipment
apparatuses inside of a decent time
• Variety: Crowd detecting data have different modalities concerning time,

5
position, and track data.
• Velocity: Thanks to the advancement of mobile phone, data can be created
quickly continuously.
• Veracity: Raw versatile detecting data may incorporate various clamor
signals, and additionally excess and incorrect information.
Srinivas [5] states that Big-Data has different features. When we are discussing
Big-Data, it speaks the truth structured and unstructured data. Much of the time it is
unstructured or semi structured like for instance weblogs, data originating from
machines, plants or vitality censers RFID, social data, call point of interest records,
stargazing, air science, genomics, biogeochemical, natural, medicinal records,
photography or feature files and so forth. There are those sorts of data on which
individuals need to break down and decide. Past definitions are firmly identified with
technical perspectives. There is an alternate definition expressed by Collins [6]. For
customers, Big-Data speaks the truth utilizing expansive data from new or various
sources to give important and significant data about how the world functions. For
instance, an organization can utilize client data to deliver shows custom-made to
their groups of onlookers. For producers, then again, Big-Data speaks the truth the
innovation important to handle these expansive, different datasets. Makers portray
Big-Data as far as volume, assortment, and speed.
Popescu and Strapparava [7] states to explore diachronic phenomena by using
large dataset namely corpora of ordered language so that, could identify formerly
unknown correlations between usage of language.
Rill et al. [8] presented an article which demonstrates a framework intended to find
developing political points in Twitter.
Another study originates from Jung and Segev [9] to proposes techniques to break
down how groups change after some time in the reference system diagram without

6
extra outer data and taking into account hub and connection forecast and group
discovery.
Poria et al. [10] presented a novel paradigm to concept-level sentiment analysis that
merges semantics.
Weichselbraun et al. [11] presented a system for contextualizing and enhancing
huge semantic information bases for feeling mining with an emphasis on Web
insight stages and other high-throughput Big-Data applications.
''Meta-Level Sentiment Models” were expressed how diverse measurements of
suppositions, for example, subjectivity, extremity, force and feeling, supplement one
another in specific situations by Bravo-Marquex et al. [12].
A paper written by Wua and Tsaib [13] illustrated how an ability to think learning
base can be utilized as the establishment to fabricate a bigger dictionary reference
by proliferating sentiment values from ideas with known qualities to exhaust ones.
Justo et al. [14] talk about the undertaking of programmed identification of mockery
or frightfulness in online written discussion.
A methodology for feeling examination in social media situations is reported by
Montejo-Raez et al. [15].
As indicated by Flaounas et al. [16] examination of media substance has been focal
in social sciences, because of the key part that media plays in shaping public
opinion. This sort of investigation ordinarily depends on the preparatory coding of
the content being inspected, a stage that includes perusing and expounding it, and
that restrains the sizes of the corpora that can be analyzed.
Rahnama [17] states that all the more particularly over Social Media, Big-Data
pattern has upheld the data-driven frameworks to have ceaseless quick data

7
streams. As of late, real-time analytics on stream data has shaped into another
exploration field, which means to answer queries about what-is-occurring now with
an unimportant postponement.
According to Mukkamala and Hussain [18] developmental approaches to handle
social media data is limited to graph database approaches such as social network
analysis.
Finally, Liu et al. [19] stated that when the dataset is huge, a few algorithms may not
scale up well. In this paper, authors intend to assess the versatility of Naïve Bayes
classifier (NBC) in substantial datasets rather than utilizing a standard library.
1.3 Objectives of the Thesis and Definition of the Problem
The major objectives of this research may be stated as,
Understand the definitions of Big-Data,
Analyze the previous applications of Big-Data,
Suggest a Big-Data definition,
Suggest a strategy proposal for Big-Data Applications,
Build an application using the proposed strategy with various Big-Data tools.
After an initial investigation in the available literature, it was concluded that there is
not a development strategy clear enough for developing Big-Data application. As
noted above, proper definition and development strategy proposal for developing
Big-Data application is therefore an objective of the study. During the study a real
data set available in open data source is used for a Big-Data application
development using the proposed strategy.
1.4 Organization of the Thesis
Thesis will start with a brief Introduction Chapter that includes Scope, Topic,
Previous works, and Objectives and Organization of the thesis. Second Chapter is

8
about Definition of Big-Data. In that chapter, Definitions of Big-Data, a proposed
definition of Big-Data and Fundamentals of Big-Data are included. Next, this study
will introduce Big-Data requirements and reasons of why Big-Data is needed in
Chapter three. The next chapter, Chapter four, will include a detailed Hadoop and
Big-Data evaluation. Chapter five is devoted to propose a development strategy for
a Big-Data application. The next chapter, Chapter six, is devoted to an application
of Big-Data. The last chapter will be summary and conclusions of the thesis. Finally,
appendices and references chapters will be at the end of thesis.

9
2 WHAT IS BIG-DATA? AND A PROPOSED DEFINITION
2.1 Available Definitions of Big-Data
In spite of the fact that the word “big” infers as volume, Big-Data isn't just
characterized by volume, it has many-sided quality. Numerous little data sets that
are viewed as Big-Data don't devour much physical space yet are especially
unpredictable in nature. In the meantime, vast data sets that require huge physical
space may not be sufficiently mind boggling to be viewed as Big-Data. Other than
volume, the Big-Data incorporates data variety and velocity making up the three V's
of Big-Data - volume, variety and velocity. Variety references the distinctive sorts of
structured and unstructured data, for example, exchange level data, feature and
sound, or content and log documents. Velocity is an evidence of how rapidly the
data can be made accessible for examination. Notwithstanding the three V's, some
add a fourth-V to the Big-Data definition. Veracity is an evidence of data
uprightness and the capacity for an association to believe the data and have the
capacity to unhesitatingly utilize it to settle on urgent decisions. Big-Data will be
data that surpasses the processing limit of ordinary database frameworks. The data
is too big, moves too quick, or doesn't fit the strictures of your database
architectures. Additionally, Big-Data has to be suitable as financially methodologies
have risen to tame the volume, velocity and variability of gigantic data. Inside of this
data lie profitable patterns and data, beforehand concealed due to the measure of
work needed to concentrate them. To driving enterprises, for example, Wal-Mart or
Google, this force has been in scope for quite a while, however at fabulous
expense.
The estimation of Big-Data to an association falls into two classes: systematic
utilize, and empowering new items. Big-Data analytics can uncover bits of
knowledge concealed already by data too excessive to process, for example,
companion impact among clients, uncovered by dissecting customers' exchanges,

10
social and geological data. Having the capacity to handle each thing of data in
sensible time evacuates the troublesome requirement for inspecting and elevates
an investigative way to deal with data, as opposed to the to some degree static
nature of running foreordained reports [3].
Case in point, by consolidating countless from a client's activities and those of their
companions, Facebook has possessed the capacity to specialty an exceedingly
customized client encounter and make another sort of publicizing business [3].
Big-Data can be really undefined, in the same way that the term shadiness
assorted innovations. Information data to Big-Data frameworks could be prattle
from social networks, web server logs, sweeps of government reports, budgetary
business data, the rundown goes on [3].
2.2 A Proposed Definition of Big-Data
The three Vs of volume, velocity and variety are usually used to portray diverse
parts of Big-Data. This current study's Big-Data definition is: Big-Data is a
technique that is utilized when conventional data processing systems can't uncover
the bits of knowledge of the fundamental data. Data that may be both structured
and unstructured (Variety) or time sensitive (Velocity) or simply massive (Volume)
can't be prepared by social database motors. This kind of data obliges an alternate
processing method called Big-Data, which utilizes natural parallelism on promptly
accessible hardware.
2.3 Fundamentals of Big-Data
The term Big-Data is used and defined first by Laney [21]. Quite number of articles
and reports appeared on the subject since then. Some of them are included in the
references.
Laney [2] states that the effect of the e-commerce surge, a rise in merger/securing

11
movement, increased joint effort, and the drive for harnessing data as a competitive
impetus. In 2001, recorded, integrated databases will be leveraged for intended
expository purpose, as well as increasingly for intra-enterprise consistency. Readily
accessible current records of exchanges, affiliates, and business process.
2.3.1 Key characteristics of Big-Data
As noted earlier, Laney [2] defined three information explosion factors such as Data
Volume, Data Velocity and Data Variety (Three Vs) in 3D Data Management in his
paper. (As shown in Figure 2.1) These three factors were later defined as key
characteristics of Big-Data first by Laney [21].
Figure 2.1 Data Management Solution
In the following each of these terms will be defined briefly [2]:
a) Data Volume:
E-commerce channels increase the depth of data available about exchange. The

12
lower expense of e-channels enables an enterprise to offer its products or services
to more people or exchanging partners and up to 10X amount of data around an
individual exchange may be collected:
Storage/hub spoke
Data retention
Sampling
Redundancy elimination
Another definition of volume is given by Dijks [3]. Machine-generated data is
produced in much larger quantities than non-customary data. For example, a single
airplane engine can spread 10TB of data in 30 minutes. Shrewd meters and heavy
mechanical equipment like oil refineries and boring apparatuses generate
comparable data volumes, intensifying the problem.
b) Data Velocity:
E-commerce has additionally increased purpose of-interaction speed and,
consequently, the pace of data used to bolster interactions and generated by
interactions. As purpose of-interaction is increasingly perceived as a competitive
differentiator (Web site response, inventory accessibility examination, exchange
execution, order following update, item delivery) so too is an association's capacity
to manage data velocity. To handle velocity requirement Enterprises are
implementing architectural arrangement, such as,
Data stores,
Caches,
Balance data latency.
According to Dijks [3], Social media data streams are huge flood of relationships
important to customer relationship.
c) Data Variety:
Attempts to resolve data variety issues must be approached as an endeavor

13
encompassing the accompanying techniques:
Inconsistency resolution
XML-related translation
Data access middle-ware and ETLM1
Parallel query management
Meta-data management
Additionally Dijks [3] stated that traditional data configurations tend to be relatively
well defined by a data schema and change gradually. Interestingly, non-customary
data organizations exhibit a bewildering rate of change.
2.3.2 Additional characteristics of Big-Data
After definitions of three Vs such as Volume, Velocity and Variety, there are
additional key characteristics of Big-Data, namely Value, Variability, Veracity,
Complexity.
Dijks [3] added a fourth key characteristic as Value in addition to the initial three Vs.
i. Data Value:
The economic value of different data varies fundamentally. Regularly there is
great data hidden among a larger group of non-traditional data; the challenge is
identifying what is valuable and afterward changing and extracting that data for
examination.
ii. Data Variability:
Srinivas [5] had proposed a new characteristic as Variability instead of Value as
the fourth V. By the time Data is simply developing and the development is
unprecedented. Presently the time has changed where needs of overseeing
data has moved from Terabytes (ten to power 12 bytes) to Petabytes (ten to
power 15 bytes). Big-Data will be data sets whose size is beyond the capacity of
1 ETLM: Extract, Transform, Load and Management.

14
regularly used software instruments to capture, manage and process the data
inside of certain elapsed time. Big-Data is about and around data explosion,
large volumes however it additionally has other facets. When we are discussing
Big-Data, it speaks the truth structured and unstructured data. As a rule it is
unstructured or semi structured like for example web-logs, data originating from
machines, plants, cosmology, atmospheric science, economics,
bio-geo-chemical, organic, medical records, photography or video archives and
etc., there are those types of data on which people need to analyze and make
decisions. There are multiple facets of Big-Data which are regularly called as
Four V's of Big-Data. These commonly characterize Big-Data. (Three V +
Variability) Variability: It's not same as Variety. Numerous Options or variable
interpretations bewilder investigation.
iii. Data Veracity
Another fourth character definition comes from Jawell et al. [1] as Veracity:
(three Vs + Veracity) Big-Data is a phenomenon that is characterized by the
quick expansion of raw data. Veracity is that Big-Data arrangements must
validate the correctness of the large measure of quickly arriving data. As a
result, Big-Data arrangements are characterized by real-time complex
processing and data relationships, advanced explanatory, and search
capabilities.
iv. Data Complexity
A different Four V definition of Big-Data characteristics proposal comes recently
from SAS Community [20], as Variety, Velocity, Variability and Complexity.
Big-Data is a relative term describing a circumstance where the volume, velocity
and variety of data exceed an association's storage or compute limit for
accurate and timely decision making. Some of this data is held in value-based
data stores - the side effect of quickly developing online action.
Machine-to-machine interactions, for example, metering, call detail records,

15
environmental sensing and RFID systems; generate their own tsunamis of data.
Complexity: Difficulties handling with data explosion with the expanding
connection coordinate and change data crosswise over business entities and
systems. Associations need to understand relationships, for example, complex
hierarchies and data linkages, among all data.
Then again some researchers are conservative around three Vs definition. One
of them is Davies [22]. Numerous large factories and office structures generate
endless measures of data. It's a great deal of data, around more than two
million data focuses a minute. What's more, that records for just the
high-volume and high-velocity data collection inside of an enterprise's
arrangement of building assets.
Mukkamala and Hussain [18] also support conventional Three Vs definition and
state that Big-Data ordinarily comprises of large volumes of data in a variety of
data arrangements that come into being at different velocities as verifiable
archives to real-time streaming with differing degrees of data provenance.
2.3.3 Types of data in Big-Data
Big-Data generally related to the following data types according to Dijks [3]:
Traditional enterprise data includes customer information systems,
Machine-generated / sensor data includes web-logs, data mining sensors,
and trading data.
Social data includes customer feedbacks and blog pages.
2.3.4 Various trends behind Big-Data
Collins [6] defined three macro trends behind Big-Data as consumption,
instrumentation and exploration. For consumers, Big-Data speaks the truth
utilizing large data sets from new or diverse sources to provide meaningful and

16
actionable data about how the world functions.For producers, however, Big-Data
speaks the truth the technology necessary to handle these large, diverse data sets.
What amount of data is there, of what types, and how rapidly would you be able to
derive value from it? In spite of the fact that these are great technical descriptions
of Big-Data, they don't completely explain it. Generally as receiving a
service-oriented methodology is the full scale trend behind the cloud, there are
several large scale trends behind Big-Data as summarized below [6]:
a) First trend is consumption.
Data consumption as part of the everyday activities in personal and working lives
which is important to do feeling-driven decisions.
b) Second trend is instrumentation.
Data collection at each step in many of activities, we collect information about
all activities with the intent to measure and analyze them.
c) The third trend is exploration.
Abundance of data means we can use it to build, test, and consume
experiments that were previously not feasible. At long last, related to
exploration is the concept that the data itself has value.
2.3.5 Big-Data views of some companies
There are Big-Data views of some companies, namely IBM, Oracle, Intel and
Microsoft. The correlation between these views is given by Ward and Barker [23].
Among the most cited definitions is that included in a Meta (now Gartner) report
from 2001 [2]. However, the proposed a threefold definition stating the Three Vs:
Volume, Velocity and Variety. This is a definition routed in magnitude. As is basic all
through Big-Data literature, the evidence presented in the Gartner definition is
entirely anecdotal. No numerical evaluation of Big-Data is afforded.
In the following, company views are summarized.
17
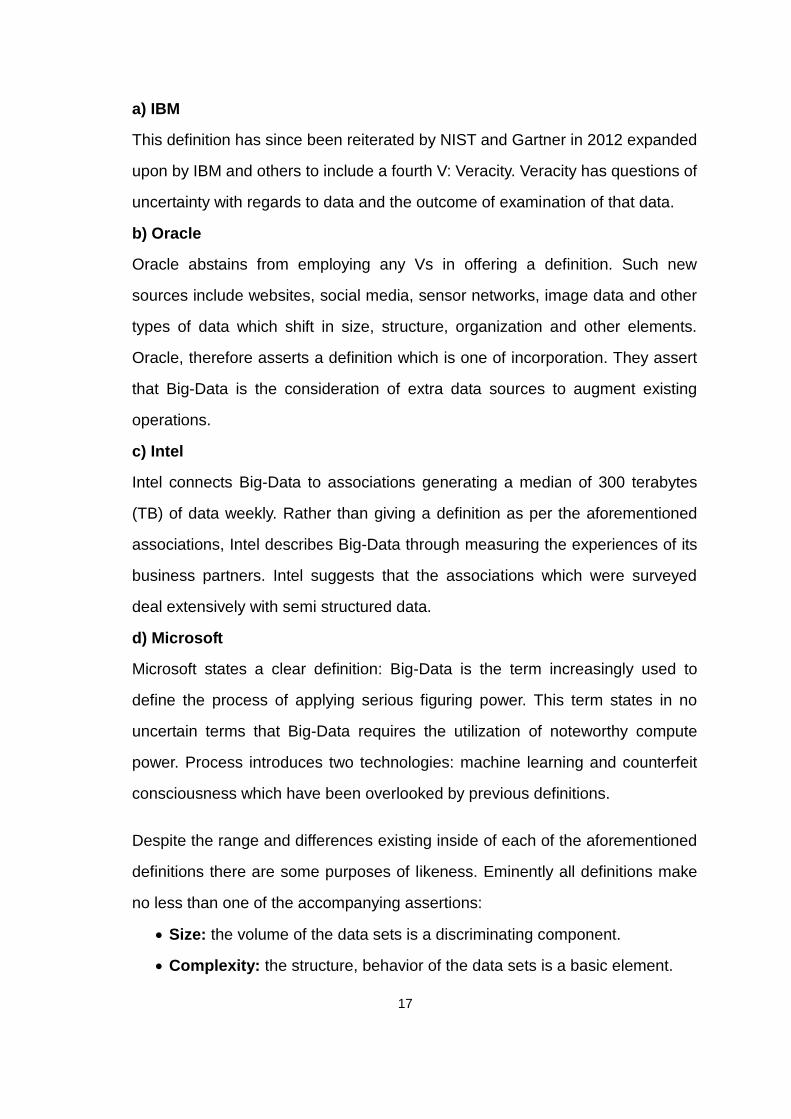
a) IBM
This definition has since been reiterated by NIST and Gartner in 2012 expanded
upon by IBM and others to include a fourth V: Veracity. Veracity has questions of
uncertainty with regards to data and the outcome of examination of that data.
b) Oracle
Oracle abstains from employing any Vs in offering a definition. Such new
sources include websites, social media, sensor networks, image data and other
types of data which shift in size, structure, organization and other elements.
Oracle, therefore asserts a definition which is one of incorporation. They assert
that Big-Data is the consideration of extra data sources to augment existing
operations.
c) Intel
Intel connects Big-Data to associations generating a median of 300 terabytes
(TB) of data weekly. Rather than giving a definition as per the aforementioned
associations, Intel describes Big-Data through measuring the experiences of its
business partners. Intel suggests that the associations which were surveyed
deal extensively with semi structured data.
d) Microsoft
Microsoft states a clear definition: Big-Data is the term increasingly used to
define the process of applying serious figuring power. This term states in no
uncertain terms that Big-Data requires the utilization of noteworthy compute
power. Process introduces two technologies: machine learning and counterfeit
consciousness which have been overlooked by previous definitions.
Despite the range and differences existing inside of each of the aforementioned
definitions there are some purposes of likeness. Eminently all definitions make
no less than one of the accompanying assertions:
Size: the volume of the data sets is a discriminating component.
Complexity: the structure, behavior of the data sets is a basic element.

18
Technologies: the devices and techniques which are used to process a
sizable or complex data set is a basic component.
2.3.6 Cloud Computing and Big-Data
According to Collins [6], when defining the cloud and Big-Data, it is helpful to
evaluate both the consumer and producer sides.
For consumers, In broad daylight mists, the services are keeping running
by an outsider, while in private mists, they are owner-operated on premise.
They can choose to possess or outsource every-thing from the data center
to the storage, processing, networking, and software infrastructure up to the
application.
For producers, the cloud is about the software technology that goes into
giving service offerings at all level. For example, virtual machines are the
infrastructure of clouds; however they may not be used when implementing
an application as an open service. Hardware and package services are from
a supplier on the web (the cloud). Cloud computing contains software as a
service (SaaS), infrastructure as a service (IaaS) and platform as a service
(PaaS), all of that square measure explained below. Cloud permits firms to
consume work out resources as a utility instead of having to make and
maintain computing infrastructures in-house. Cloud computing guarantees
many engaging advantages for businesses and finish users. 3 of the most
advantages of cloud computing includes [6].
Types of Cloud computing services are private, public and hybrid.
Private cloud services are delivered from a business' data center to internal users.
This type of cloud computing gives versatility and convenience, while preserving
management, control and security.
Public cloud model, an outsider provider delivers the cloud service over the

19
Internet. One of the best open cloud providers include Amazon Web Services
(AWS), Microsoft Azure, IBM's SoftLayer and Google Compute Engine.
Hybrid cloud is a mixture of open cloud services. Companies can run important
applications on the private cloud, while as yet maintaining control over critical data.
It has always been divided into three broad service categories:
infrastructure as a service (IaaS),
platform as a service (PaaS),
software as service (SaaS).
IaaS providers, for example, AWS (Amazon Web Services) supply a virtual server
instance and storage.In the PaaS model, providers host development apparatuses
on their infrastructures. Users access those devices over the Internet utilizing APIs,
Web sites. Regular PaaS providers include Salesforce.com's Force.com, Amazon
Elastic Beanstalk and Google App Engine. SaaS is a dissemination model that
delivers software applications over the Internet.
2.3.7 Database, OLAP vs. Big-Data
a) Database vs. Big-Data
Nowadays social world is generating huge data sets. As a result, Big-Data
analytics has become a important device for businesses hoping to leverage
mountains of valuable data for benefit and competitive advantage. While
Big-Data has lived up to a great part of the hype, there are certain situations
where running workloads on a traditional database may be the better
arrangement [3].
Is the data being analyzed structured or unstructured?
Structured Data: Data that dwells inside of the altered limitations a record
or document is known as organized information. Inferable from the way that
organized information – even in extensive volumes – can be entered, put

20
away, questioned, and broke down in a basic and clear way, this sort of
information is best served by a traditional database.
Unstructured Data: Data that comes from a variety of sources, for example,
emails, text documents, videos, photographs etc.
Is a analytics infrastructure needed?
As a cloud-based Big-Data service that offers more flexible scalability by
turning virtual servers up or down inside of minutes to better accommodate
fluctuating workloads.
Will a Big-Data implementation be cost-effective?
Cost-effectiveness is always a concern for companies hoping to adopt new
technologies. When considering a Big-Data implementation, companies
need to get their work done to make sure that the realized benefits of a
Big-Data deployment outweigh the expenses.All things considered,
Big-Data has a number of things pulling out all the stops that make
implementation more financially savvy than companies may realize. For one
thing, Big-Data saves money by joining open source software with ware
servers.
Is fast data analysis critical?
Big-Data was designed for parallel data processing where fast performance
is critical.
b) OLAP vs. Big-Data
By and large, enterprises are utilizing cubes to aggregate data and pre-process
data from multiple data source and/or a data warehouse to provide visualization
capabilities.OLAP cubes provide value in a number of ways, including
abstracting report queries away from the database and giving fast access to
knowledge through techniques that include pre-aggregated, pre-constructed
analytics in the cube. This makes assembling the analytics in the cube based on
requirements and assumptions very troublesome. However, Big-Data architects

21
do need to consider comprehending the traditional BI (Business Intelligence)
problems in a different way.
2.3.8 Big-Data and analytics
Stephenson [24] collects together seven widely used Big-Data analytics
techniques:
a) Association rule learning
b) Classification tree analysis
c) Genetic algorithms
d) Machine learning
e) Regression analysis
f) Sentiment analysis
g) Social network analysis
a) Association Rule Learning
Association rule learning is a analysis type to define relations between variables
in datasets. It was initially used by major supermarket chains to discover
interesting relations between items, utilizing data from supermarket purpose
of-sale (POS) systems.
b) Classification Tree Analysis
Statistical classification is an analytic method of determining sub-categories.
Analysis process needs a training set of correctly determined observations.
Statistical classification is being used to:
Categorize organisms,
Generate profiles of students who take online courses.
c) Genetic Algorithms
Genetic algorithms are inspired by the way evolution lives up to expectations –
that is, through mechanisms, for example, inheritance, mutation and natural
selection.

22
Genetic algorithms are being used to:
Patient Schedule to manage hospital emergency rooms,
Re-organize combinations of engineering practices required to develop
fuel-efficient cars.
d) Machine Learning
Machine learning includes software that can learn from data and software
focused to make predictions based on sets of training data.
Machine learning is being used to help:
detect spam and non-spam email messages,
understand user preferences and make predictions,
determine the suitable content for engaging prospective customers.
e) Regression Analysis
It describes how the value of a dependent value changes when the
in-dependent value is varied. It works best with persistent quantitative data like
weight, speed or age.
f) Sentiment Analysis
Sentiment analysis is involved in scientific research fields: This analysis
process refers to the extraction of information from raw data, often in text
structure. In accordance, in all media types’ different sorts of sentiments exist.
When just sentiment analysis is stated in the remainder of this thesis, sentiment
analysis based on suppositions is meant.
g) Social Network Analysis
Social network analysis is a technique that was initially used in the
telecommunications business, and then immediately adopted by sociologists to
mull over interpersonal relationships. Nodes represent individuals inside of a
network, while ties represent the relationships between the individuals.
We will use Sentiment Analysis in our Big-Data Application in Chapter 6, namely
An Application.

23
2.3.9 Is Big-Data volume or technology?
The term Big-Data, particularly once employed by vendors, could check with the
technology (which includes instruments and processes) that a corporation needs to
handle the massive amounts of knowledge and storage facilities. The term
Big-Data is believed to own originated with net search firms who required
questioning terribly giant distributed aggregations of loosely-structured knowledge
[22].
2.3.10 Challenges and opportunities of Big-Data
For challenges and opportunities of Big-Data one may refer to Agrawal et al. [25].
Challenges:
Incompleteness,
Scale,
Timeliness,
Human Collaboration,
Opportunities:
Data Recording,
Data Aggregation, and Data Representation,
Data Interpretation
According to Schenker [26] one may state the advantages and disadvantages of
Big-Data as follows:
Advantages:
Big,
Timely,
Predictive,
Cheap,
Disadvantages:
Unknown population representation,

24
Issues of data quality,
Basically not very multivariate,
Privacy,
Uncertainty.

25
3 WHY BIG-DATA IS NEEDED AND SOME EXAMPLES
3.1 Why Big-Data Is Needed?
As described by Waddell [27] an organization needs a Big-Data and analytics
strategy now for three reasons:
3.1.1 For creating smarter, leaner organizations
Today, the number of Google queries about lodging and real estate starting with
one quarter then onto the next ends up predicting more accurately.
3.1.2 For equipping organization
As most organizations will agree, it's essentially unrealistic to carry out the
conversations which once had with customers. There's a lot of dialog rolling in from
various sources.
3.1.3 For preparing your organization for the inevitable future
The primary reversal was in the newspaper business that moved from blasting to
near obsolete with the advent of online distributed. This happened inside of a
decade.
3.2 Application Domains of Big-Data and Some Examples
3.2.1 Application domains of Big-Data
There are four application domains for Big-Data according to McGuire et al. [28]:
1. As organizations create more transactional data.
They can collect more detailed performance information on everything from
item inventories to debilitated days and therefore exposes variability and
support performance. In fact, some leading companies are utilizing their ability
to collect and analyze Big-Data to direct controlled experiments to make better
management decisions.
2. Big-Data supports narrower segmentation of customers.

26
3. Big-Data analytics can improve prediction, minimize risks.
For instance, firms are using information obtained from machine-sensors
embedded in products to create innovative maintenance process.
White [29] states that many people view Big-Data as an over-hyped trendy
expression.
3.2.2 Some examples of Big-Data
Sentic Patterns: Dependency-Based Rules
Poria et al. [10] who introduce a novel paradigm to concept-level sentiment
analysis that merges semantics, practical judgment skills registering, and
machine learning for enhancing the accuracy of tasks, for example, polarity
detection. By allowing sentiments to spill out of concept to concept based on
the dependency relation of the info sentence.
Time Corpora: Epochs, Opinions and Changes
Popescu and Strapparava [7] states to explore diachronic phenomena by
utilizing large corpora of chronologically ordered language.
Analyzing Future Communities
Jung and Segev [9] who view the research group as a Social Web where the
communication occurs through academic works.
Meta-Level Sentiment Models
Bravo-Marquex et al. [12] who considered how different dimensions of feelings,
for example, subjectivity, polarity, intensity and emotion, complement each
other in specific scenarios.
PoliTwi: Early Detection of Emerging Political Topics
Rill et al. [8] presents a system designed to detect emerging political points in
Twitter sooner than other standard information channels. Moreover, authors
have checked their determinations via Google Trends to observe that themes
emerged earlier in Twitter..

27
Swarm Explicit Sentiment Analysis
Montejo-Raez et al. [15] stated Sentiment Analysis. This study states a new
approach for sentiment analysis in social media. Similar to explicit semantic
analysis, blog posts are captured by a predefined collection of documents.
The likelihood of Enriching Semantic Knowledge Bases for Opinion
Mining
Weichselbraun et al. [11] who present a novel method for contextualizing and
enriching large semantic knowledge bases for feeling mining with an attention
on Web intelligence platforms and other high-throughput Big-Data applications.
Identify ambiguous sentiment terms,
Ground this contextual information to structured background knowledge.
Utilizing Relation Selection to Improve Value Population
Wu and Tsaib [13] illustrate how an ability to think knowledge base can be used
as the foundation to assemble a larger dictionary. Authors also propose a bias
correction method that guarantees that the average deviation.
Extracting Relevant Knowledge for the Detection of Sarcasm
Justo et al. [14] state about the task of automatic detection of sarcasm in digital
conversation. It requires a system that can manage some sort of knowledge to
interpret that emotional language is being used. Results of paper demonstrate
that the sarcasm detection task benefits from the incorporation of etymological
and semantic information sources.
3.2.3 Additional examples of Big-Data
Prediction of Social Behavior with Big-Data
Bloem et al. [30] states that since 2005, when the 'Big-Data' term was stated by
O'Reilly Media, which had introduced Web 2.0. Big-Data field has undergone
extremely rapid changes. The first of a complete of four analysis papers, this
study offered a solution to questions on what Big-Data really is. the information

28
explosion is happening all around, however a serious a part of the discourse
considerations the extent to that organizations need to currently plunge into
Big-Data. the solution is: simply on the idea of a reasoned approach. This
definitely applies to privacy problems, which can be comprehensively coated in
third analysis report. With four Big-Data reports, with aims to form clarity by
presenting experiences and dreams in perspective: severally, and supplied with
acceptable examples. Yet, not all answers, by a protracted shot, may be given.
In fact: a lot of queries can arise concerning the roadmap that you simply would
like to use for Big-Data, as an example. The new data center is a quest with
many questions at the outset, while new ones will certainly arise amid the
journey. Therefore, this study is just excessively pleased, making it impossible
to exchange ideas and assessments with you: online at
vint.sogeti.com/Big-Data and, of course, in personal talks. In the context of
inspiration, this report also presents seven issues about which this study would
be glad to hear your views.
Big-Data Analysis of News and Social Media Content
Noting, Flaounas et al. [16] reports that the analysis of media content has been
central in social sciences. This process provides opportunities for performing
massive scale investigations, real time observing, and system-level modeling
of the global media system. This study describes how the analysis of Twitter
content can reveal disposition changes in entire populations, how the political
relations among US leaders can be extracted from huge dataset.
Data Mining with Big-Data
Wu et al. [31] states that Big-Data concern large-volume, complex, developing
information sets with multiple, autonomous sources. Big-Data is increasing
altogether science and engineering domains. This method model has data
processing, user demand modeling and privacy topics.

29
Community Activity Prediction (CAP)
Zhang et al. [4] stated that group sensing harnesses the power of the group by
activating a large number of users. In this article, this study designs a novel
group centric framework for group activity prediction based on Big-Data
analysis. The proposed approach comprises of group detection based on
singular value decomposition and clustering, and group activity modeling
based on tensors.
Big-Data analysis using Naïve Bayes Classifier
Liu et al. [19] stated that a typical method to obtain valuable information is to
get the attitude or supposition from a message. Therefore Machine learning
technologies have ability to learn from the training data set to predict or bolster
decision making with relatively high accuracy.
Fuzzy-Set Based Sentiment Analysis
Mukkamala and Hussain [18] stated that computational approaches to social
media. Authors outline a formal model based on fuzzy set theory and defined
the operational semantics of the general model with a real-world social data
example from Twitter. Authors use SODATO to fetch social data from the
Facebook wall of a global brand, H&M and behavior a sentiment classification
of the posts and comments. Authors analyze the sentiment classifications by
developing fresh as well as the fuzzy sets of the artifacts. This study documents
and examines the longitudinal sentiment profiles of artifacts and actors on the
Facebook page.
Distributed Real-Time Sentiment Analysis
According to Rahnama [17], Big-Data trend has enforced the data-centric
systems to have ceaseless fast data streams. In recent years, real-time
analytics on stream data has formed into a new research field, which aims to
answer queries about what-is-happening-now with a negligible delay. The real
challenge with real-time stream data processing is that it is impossible to store

30
instances of data, and therefore online analytical algorithms are utilized. To
perform real-time analytics, pre-processing of data ought to be performed in a
way that just a short summary of stream is stored in main memory. In addition,
due to fast of arrival, average processing time for each instance of data ought to
be in a manner that approaching instances are not lost without being captured.
Lastly, the learner needs to provide high analytical accuracy measures. Sentinel
is a distributed system written in Java that aims to solve this challenge by
enforcing both the processing and learning process to be done in distributed
structure. Sentinel is based on top of Apache Storm, a distributed figuring
platform. Sentinel's learner, Vertical Hoeffding Tree, is a parallel decision
tree-learning algorithm based on ability of enabling parallel classification in
distributed environments. Sentinel also uses Space Saving to keep a summary
of the data stream and stores its summary in a summation data structure.
Application of Sentinel on Twitter Public Stream API is indicated.

31
4 HADOOP
As it will be seen in the Application chapter six, during the application Hadoop
based software tools will be used. It seemed, therefore, would be proper to include
a summary material on Hadoop in the thesis.
Apache Community has developed Hadoop library which is 100% open source and
developed a fundamentally new way of processing data. Hadoop states parallel
processing of great amounts of data inexpensive data and can scale unbounded.
During implementation to be presented in Chapter 6, Hadoop based application is
developed. It is therefore, needed to briefly summarize Hadoop in this Chapter [32].
4.1 Key Features
Key features are stated by as follows [32]:
Open-Source software system
Open source software system differs from industrial software system thanks to
the broad and open network of developers that make and manage the
programs.
Framework
In this case, it suggests that everything you would like to run, install and
develop.
Distributed design
Data is split and keep across multiple computers, and computations will be run
in parallel across multiple connected machines.
Massive Storage
The Hadoop framework will store immense amounts of knowledge by breaking
the info into blocks and storing it on clusters of lower-cost goods hardware.
Faster process
Hadoop processes massive amounts of knowledge in parallel across clusters of
tightly connected inexpensive computers for fast results.

32
Low Cost
The ASCII text file framework is free and uses goods hardware to store massive
quantities of knowledge.
Computing Power
Their distributed computing models will quickly method terribly massive
volumes of knowledge. The additional computing nodes you employ, the
additional process power you've got.
Scalability
One can simply grow his system just by adding additional nodes. Very little
administration is needed.
Storage Flexibility
Unlike old relative databases, you don’t have to be compelled to pre-process
information before storing it. this includes unstructured information like text,
pictures and videos. you'll be able to store the maximum amount information as
you wish and choose a way to use it later.
Protection
Data and application process square measure protected against hardware
failure and it mechanically caches triple copies of all information.
4.2 Hadoop Core Modules
Hadoop library grows as open-source software regarding trustworthy, scalable,
allocated processing. The particular Apache Hadoop software library is a
framework which allows to the allocated running involving huge information
packages all over groups involving computer systems applying uncomplicated
selection versions [32].
Hadoop includes the following modules as shown in Figure 4.1 [32].
a) Hadoop Distributed File System (HDFS): A parallel distributed file system
which provides high-throughput access.

33
b) Hadoop YARN: A framework for task scheduling and system resource
management.
c) Hadoop Map Reduce: A YARN-based natural system for parallel and
distributed processing on large data sets.
d) Hadoop Pig: A high-level data manipulation language and execution
framework for parallel computation.
e) Hadoop Hive: A data warehouse infrastructure that provides data
summarization.
Figure 4.1 Hadoop Core Modules
4.3 Hadoop Cluster
Virtually any number of often linked or securely linked computers in which band
together being a single process is usually known as Bunch. Simply, your working
computer bunch employed for Hadoop is known as Hadoop Cluster. A Hadoop
Cluster is depicted in Figure 4.2 [32].
Hadoop Cluster is usually a specific style of computational bunch intended for

34
saving and also inspecting substantial level of unstructured information inside an
allocated research atmosphere.
Figure 4.2 Hadoop Cluster
4.4 Hadoop and Big-Data
Hadoop is designed for all types associated with files coming from disparate
systems: structured, unstructured, sign data, pics, audio tracks, marketing and
sales communications information, email – almost anything you can consider, no
matter what the indigenous file format. Even when several types of files are actually
stashed with not related systems, you can dispose of all this straight into your
Hadoop bunch without any prior requirement for a new schema. Basically, you
don’t need to find out exactly how you want to question computer data prior to

35
deciding to store the idea; Hadoop lets you choose later as well as after some time
could reveal concerns due to perhaps considered to request. By creating all of your
information useable, not simply what’s in your databases, begin creating additional
choices based on hard information rather than hunches and appearance at
complete information sets, not simply samples [32].
In addition, Hadoop’s price advantages over gift systems redefine the social
science of information. gift systems, whereas fine sure as shooting workloads,
merely weren't designed with the requirements of Big-Data in mind and are so
much too costly to be used for general purpose with today's largest information sets.
One of the price blessings of Hadoop is that as a result of it depends in Associate in
Nursing internally redundant arrangement and is deployed on trade normal servers
instead of costly specialized information storage systems, you'll afford to store
information not antecedently viable. and that we all understand that after
information is on tape, it’s primarily identical as if it had been deleted - accessible
solely in extreme circumstances [32].
With data growing therefore quickly and also the rise of unstructured information
accounting for ninetieth of the info nowadays, the time has come back for
enterprises to re-evaluate their approach to information storage, management and
analytics. Systems can stay necessary for specific high-value, low-volume
workloads. The cost-effectiveness, measurability, and efficient architectures of
Hadoop can build the technology additional and additional engaging [32].
4.4.1 What Hadoop can't do?
It is not proper to say one can use Hadoop for only unstructured data. There are
various remedies in which one may use fairly low cost storage devices.
One should not need to utilize Hadoop intended for is usually transactional info.
Transactional info, by means of it is extremely characteristics, is usually highly

36
complex, being an exchange by using an online store web page can easily create
numerous methods that ought to be put in place easily. None wouldn't it always be
maximum intended for methodized info pieces that require extremely nominal
latency, you rate prerequisite in which Hadoop would certainly poorly assist [29].
4.4.2 What Hadoop can do?
Because of its batch processing, Hadoop ought to be deployed in things like index
building, pattern recognitions, making recommendation engines, and sentiment
analysis all things wherever data is generated at a high volume. Hadoop ought to
be integrated at intervals your existing IT infrastructure so as to maximize the
myriad items of knowledge that flows into your organization [29].
4.5 Hortonworks Data Platform
Hortonworks data Platform (HDP) permits this deployment connected with Open up
Enterprise Hadoop benefiting 100% open supply parts, driving enterprise ability
specifications additionally to strengthening this possession connected with fresh
enhancements within which come back outside the Apache computer code
Foundation additionally to big Apache comes. This specific complete cluster of
options will be aimed on successive purposeful areas: knowledge Operations,
knowledge Accessibility, data Governance additionally to Integration, Protection,
additionally to Operations [33].
Advantages of HDP are:
Open: Hortonworks knowledge Platform is meant for the enterprise,
engineered with open supply and tested for scale. Includes 100% open
supply parts developed by the open community among the governance of
the Apache package Foundation.
Versatile: Hortonworks knowledge Platform is essentially versatile,
providing linear, scalable storage and cipher across a large vary of access

37
ways, from batch and interactive to real time, search and streaming.
Integrated: Hortonworks knowledge Platform is meant to integrate deeply
and augment existing knowledge center technologies whereas being
deployable across a large vary of infrastructures.
Because of of these reasons mentioned on top of it absolutely was set to use HDP
a pair off for the applying development of this thesis.

38
5 A STRATEGY PROPOSAL FOR BIG-DATA APPLICATIONS
5.1 General
Big-Data info gleaned from nontraditional sources, as an example, internet journals,
social media, email, sensors, images, video footage, etc. This information will offer
answers to queries they will not have even thought to raise. However there is no
complete guide to develop Big-Data applications. In this section, already stated
proposals are defined first and then a Big-Data strategy proposal will be stated.
5.2 Various Strategy Proposals
5.2.1 Strategy proposal 1
Infochimps Community states that four key steps are to be followed for the success
implementing your Big-Data project [34]. This model based on business view. While
how one manage his Big-Data project will vary depending on his use case, there
are mainly four steps to successfully build a Big-Data project [34]:
1. Process your business use case, with clearly outlined objectives driving
business worth.
2. Coming up with your project, a well-managed set up and scope can cause
success.
3. Process your technical needs, careful requirements can make sure you
build what you would like to succeed in your objectives.
4. Making a complete Business Assessment, a holistic resolution
comparison can take the politics (and emotion) out of the alternatives.
1. Define Your Business Use Case
As enterprises explore Big-Data, all big companies realize the most important effect
from Big-Data projects when they begin with an inventory of business challenges.
2. Plan Your Project
This is wherever things get specific. As results of your analysis and conferences,

39
you presumably have a nebulous objective, like reducing client churn.
Define measurable business terms.
Detect all business questions.
Define implementation steps.
3. Define Your Technical Requirements
The technical needs part involves taking a more in-depth check out the info on the
market for your Big-Data project. This step can change you to work out the
standard of your knowledge and describe the results of those steps within the
project documentation.
4. Create a Total Business Assessment
Evaluate your choices with a complete Business worth Assessment. This suggests
that you simply perform a minimum of a 3-year total price of possession analysis,
however you furthermore may embrace things like time-to-business worth,
ease-of-use, measurability, standards-based, and enterprise readiness. However,
before you start on evaluating your answer choices, it's vital to grasp your shopping
for team. Shopping for groups usually incorporates stakeholders from multiple
structure levels and typically multiple divisions outside of IT.
5.2.2 Strategy proposal 2
Oates [35] states six essential steps that are:
1. Start with the business vision.
This is a principal step that many organizations appear to skip, delving correct into
the element alternatively than taking an excessive degree view of what they are
looking to obtain with their knowledge. These high degree vision statements differ
throughout corporations and sectors despite the fact that reoccurring issues stand,
equivalent to ‘realizing purchaser’ or ‘developing accelerated client advocacy’. As
soon as this has been agreed focus on the success metrics, consequently
acquiring key stakeholder buy in. Additional down the road, referring again to those

40
can furnish readability as to whether a project is in or out of scope of the
undertaking.
2. Define the business vision
Having in agreement on the fundamentals review what the business must do to
attain them; this is often seemingly to the touch on:
Current information assortment mechanisms and promoting choose ins to
make sure most client contact ability,
Developing inflated client information across demographics and former
interactions with the organization,
Leveraging advanced analytics to extend relevant personalization and
phone methods to absolutely impact client behaviors,
Ensuring all client bit points area unit.
Track impact of changes over business as was common. Wherever potential even
high level estimates of potential returns facilitate grab attention.
3. Map-out the data
Having developed the vision it becomes a lot of easier to review precisely what
knowledge are going to be necessary to underpin the methods. As you're
processing the information then it's helpful to assess whether or not you've got
highlighted things that address each a part of the client journey – the information a
company needs to realize an efficient sales conversion from prospect to vendee is
incredibly completely different than managing associate in progress relationship
with a loyal shopper. Linking back to the general vision ought to permit the business
to assess that data is priority – information things that can't impact any of the
general objectives ought to be forgotten at this stage. This can be necessary as
currently over ever there's associate abundance of knowledge.
4. Conduct a current state assessment
As soon as decided on which elements of information are essential, firms have to
assessment their present information assets. This should cover the following areas:

41
Data coverage where are the gaps in data items coverage.
Data quality checks how clean the current data is.
Data Linkage different sources of data may process on different references,
mail subscriber lists compared to website trans-actors.
Data capture: active processes and usage across different business units.
Documentation: determining the current data.
5. Evaluate current state objectively
Characterize and rate what forms, assets/ability sets and advancements must be
forced to be embraced inside the business to leading get the information into the
predetermined state thus to research, send and live in advancement sways. you'll
in all probability must be forced to embrace an arranged methodology bolstered
Associate in Nursing knowing read of what is going to drive most business benefit.
As a sample, is there any reason acquiring diverted on however best to coordinate
social data in the event that you center customer data or value-based data can't be
trusted?
6. Ongoing ownership
Information should be seen as partner quality in this way any data technique
activity craves abnormal state backing and current responsibility to settle on
beyond any doubt that decisions square measure supported by right data. it's not a
complete venture however should grow after some time on the grounds that the
business targets change or new data gets to be offered – intensive preparation on
the start of the task can allow a clear because of evaluate new necessities.
5.2.3 Strategy proposal 3
Bennett et al. [36] states a business-centric approach, there is still the risk that
example projects. There are the five key areas that you need to tackle:
1. Find a balance between bottom-up (tech-led) and top-down
(business-led) planning.

42
Both methodologies have their benefits, however neither can eventually
succeed in confinement. On the off chance that you find that the dialog in the
middle of business and innovation experts is by all accounts directed in
commonly unimaginable language, concentrate on discovering a typical
dialect.
2. Recognize that there is no single ‘Big-Data’ technology.
3. While Hadoop has San important role.
The careful blend contrasts between associations, contingent upon
prerequisites and in addition existing situations.
4. Big-Data has many different use cases.
While bound subjects keep bubbling to the surface (e.g. up the exactness of
advancing crusades, increasing misrepresentation location, diminishing
downtime), Big-Data methods and advancements may be utilized by any a
piece of the association. Like there's no single Big-Data innovation, there's
no single Big-Data spot to start. You're Big-Data guide needs to duplicate not
singularly what your organization needs to acknowledge, however conjointly
take into thought in advancement activities and existing innovation
speculations.
5. Make sure that your planning is long-term.
What you don't need is another situated of storehouses that are hard to keep
up and unreasonable to coordinate. In any case it ought to be clear however
these will affect the long procedure, and the way any such effect will be dealt
with. This is frequently conjointly why it's important to place in situ Associate
in Nursing agile, flexible Big-Data platform.
5.3 Some Hints for Big-Data Applications
Biesdorf et al. [37] states that each arrange can have to be compelled to address
some common challenges. They need attention from the senior company

43
leadership and are seemingly to sound familiar: establishing investment priorities,
leveling speed and price, and making certain acceptance by the line.
1. Matching investment requirements via business decisions
As firms build up their Big-Data set-up plans, a standard perplexity is an approach
to coordinate their stovepipes of learning over, say, exchanges, operations, and
customer connections. Incorporation the greater part of this information will give
capable bits of knowledge, however the cost of a substitution learning configuration
and of building up the different feasible models and apparatuses is gigantic and
that involves choices. Organizers at one low-valued, high-volume merchandiser
selected models exploitation store-deals learning to foresee stock and work costs
to stay expenses low. Against this, a top of the line, high-benefit merchandiser
chose models obliging bigger ventures and total customer information to grow
reliability projects, push clients to higher-edge stock, and tailor services to them.
2. Balancing speed, cost, and acceptance
A characteristic drive for officials UN organization possess an organization's
information and investigation technique is to move apace enthusiastically mode.
When some venture needs territory unit set up, it's not grave to search out code
and investigation merchants UN office have created applications and recursive
models to manage them. These packages are efficient and easier and quicker to
put in than internally designed, tailored models. However they usually lack the
qualities of a killer app-one that’s designed on real business cases and might
energize managers. That’s why it’s crucial to provide designing a second
dimension that seeks to balance the requirement. To comprehend the costs of
precluding this stride, consider the aptitude of one bank endeavoring to upgrade
the execution of its little business endorsing. Planning to move rapidly, the
investigation group outlined a model on the fly, while not a thinking of strategy
including the key partners United Nations organization totally comprehended the
business powers at play. This model tried well on paper however didn't function

44
admirably in apply, furthermore the organization kept running up misfortunes
exploitation it. The administration resolved to begin over, enlistment specialty unit
heads to help with the second exertion. A patched up model, outlined on an extra
finish data set and with a configuration intelligent varieties among shifted customer
portions, had higher prophetic gifts and eventually lessened the misfortunes.
3. Ensuring a focus on front-line engagement and capabilities
Indeed, even once making a considerable speculation amid another assessment
device, one aircraft found that the efficiency of its income administration examiners
was still beneath desires. The issue? The device was too confounded to be in any
way supportive. An extraordinary drawback emerged at wellbeing back up plan:
specialists dismiss a web application intended to prod them toward less expensive
medications. The specialists previously stated they may utilize it on condition that it
offered, surely infections, treatment decisions they thought-about key for keeping
up the trust of patients.Issues like these emerge once firms disregard a third piece
of Big-Data arranging: sharing the association. The said carrier upgraded the code
interface of its assessment instrument to consolidate singularly ten to fifteen tenet
determined models covering the aggressive and limit use things on significant
courses. Also, at a distributer, a warning alarms stock customers once a
contender's figuring machine expenses stock underneath the retailer's levels and
licenses the shoppers to pick on a reaction. At another distributer, directors as of
now have pill showcases anticipating the amount of store assistants obliged each
hour of the day given verifiable deals data, the guess, and arranged exceptional
special promotions.
5.4 A New Development Strategy Proposal for Big-Data Applications
After evaluating three different strategy proposals for Big-Data development, there
is no complete guide to develop Big-Data application. All proposed strategies have
deficiencies.

45
Because of this reason this thesis suggests a development strategy (As shown in
Figure 5.1) for Big-Data applications. In give strategy, each phase should be
completed fully before the next phase can begin. At the end of each phase, a
review takes place to evaluate if the project is on the right path and whether or not
to continue the process. In this model phases do not overlap.
The main feature of this proposal is that this proposal is combination of proposals
to give complete guide to develop Big-Data applications.
Advantages of the proposed strategy for Big-Data development may be stated as:
One can manage due to the rigidity of the model each phase has specific
deliverables and a review process,
In this model phases are sequential.

46
Figure 5.1 A Development Strategy Proposal for Big-Data Applications

47
6 AN APPLICATION
6.1 Introduction
The goal of this application is to classify short Twitter messages with respect to
their sentiment analysis techniques. Tweets are limited to 140 characters which
make it more difficult for people to show their opinions, the decision of the
sentiment will be more difficult as well.
This application is solely focused on the sentiment of opinions. These opinions can
be divided into three categories: negative, positive and neutral. The tweets are then
classified with an algorithm to one of those three classes. The learned model is
then connected to an examination set to approve the model. The information that's
thought-about during this analysis is predicated on Airline Twitter Sentiment
Dataset that is downloaded from web site of Crowdflower
(http://www.crowdflower.com/data-for-everyone) [38].
6.2 Problem Definition
Nearly all major airlines maintain a customer service twitter feed. The application
looked into approximately 55,000 tweets to uncover not simply whether twitter
users were negative towards their air carriers for delays etc, but exactly what it is
they were grousing about in any case. This application is a sentiment analysis work
about the problems of each major U.S. airline.
6.3 Big-Data Application Development with Suggested Strategy Proposal
In this point we are now able to use the proposed development strategy for
Big-Data in Chapter 5 summarized as Figure 5.1.
6.3.1 Start with the business vision
In data technology, Big-Data may be an assortment of information sets thus giant
and sophisticated that it becomes troublesome to method victimization on-hand

48
management tools or ancient processing applications. In alternative words
Big-Data is any kind and quantity of information that you simply cannot model,
correlate, place in context, method and build helpful with enough speed to get
valuable data to guide your decision-making processes.Our future business vision
is closely associated with prediction of flight delays. This application might become
an application to prepare schedule for users. They will be aware of delays.
6.3.2 Define how the business will need to use the data
The number of jobs associated with Big-Data is growing by the day, as additional
and additional corporations become attentive to the advantages information
assortment and analysis may wear their gain. Big-Data Analytics involves the
power to aware that data has relevancy to the question that one simply hope to
answer, and deciphering the info so as to derive those answers. In our application
we use twitter dataset from crowdflower.com [38], for an obvious reason: an
application needs real data to get real results.
6.3.3 Map-out the data
Twitter dataset was scraped and contributors were asked to first classify positive,
negative, and neutral tweets. The sample data (As shown in Figure 6.1) set has
had the following feature:
Link: http://www.crowdflower.com/data-for-everyone,
~55.000 tweets,
Plain text formatted file can be downloaded.

49
Figure 6.1 Samples of Twitter Data Set
6.3.4 Define your business use case
A basic Business Use Case is given as Figure 6.2. This scenario assumes that one
setups a company use sentiment analysis of major U.S. airline. This company
could sell these analytics results to airline companies, advertisement companies
and etc. defined as Customer in Figure 6.2.

50
Figure 6.2 A Basic Business Use Case Diagram
6.3.5 Conduct a current state assessment
Data coverage: Data has is valid because of its reality guaranteed by
crowdflower.com.
Marketing options: This application initially has no marketing concerns but
in the future, it can be extended for personal use.
Data quality: Data quality is enough which is guaranteed by

51
crowdflower.com.
Data redundancy and governance: Data has no duplication because of
redundancy elimination of crowdflower.com.
Meta data capture: Data will be captured by Hive scripts on following steps.
Data Linkage: One will use one source namely Twitter.
Data capture: Data capturing process may differ but one use
crowdflower.com as Twitter dataset.
Documentation: Dataset, scripts and thesis can be used as documentation.
Besides that whole of application will be delivered in DVD with thesis.
6.3.6 Evaluate current state objectively
Many organizations use sentiment analysis to uncover general public emotions
concerning one thing at a specific moment in time, and conjointly to trace however
those opinions amendment over time. An enterprise may analyze sentiment about:
A product: For instance, does the target understand and appreciate
messaging around a production?
A service: For instance, a restaurant can look into its address with
particularly trusted service.
Competitors: In what sector do people see our company as better than our
competition?
Reputation: Is our reputation among customers positive or negative?
This application will focus on a product launch.
6.3.7 Plan your project
Application will use an Activity Diagram (given as Figure 6.3) as Project Plan. Basic
steps are given as follows:
1. Download and Run Oracle Virtual Box
2. Download Hortonworks Data Platform 2.0(HDP) and Import HDP on Oracle
Virtual Box

52
3. Download the twitter dataset
4. Load Twitter Dataset, Hive Script and Sentiment Dictionary into the HDP
5. Use the Hive script to refine the raw data
6. Access the refined sentiment data with Excel
7. Visualize the sentiment data using Microsoft Excel 2013 Power View
Figure 6.3 Application Development Activity Diagram
6.3.8 Define technical requirements
Technical requirements are summarized as follows:
Oracle Virtual Box, download link [39]:
http://www.oracle.com/technetwork/server-storage/virtualbox/downloads/ind

53
ex.html
Hortonworks Data Platform 2.0, download link [40]:
http://hortonworks.com/wp-content/uploads/unversioned/pdfs/InstallingHort
onworksSandbox2onWindowsusingVB.pdf
Microsoft Office Excel 2013 and Power View Plug-in, download link [41]:
https://www.microsoft.com/tr-tr/download/details.aspx?id=39379
Twitter Dataset download link [38]:
http://www.crowdflower.com/data-for-everyone
The following notes are also proper for the application:
In this application, the screenshots show the Hortonworks Sandbox is
installed on an Oracle Virtual Box virtual machine (VM).
Application will use the Power View feature in Excel 2013 to illustrate the
sentiment result.
6.3.9 Creating a total business value assessment
Our proposal suggest to look at priorities. But don’t forget to include:
Time to Business Value (Application can solve airline data to companies)
Ease of Use (User interface of application is well known Excel)
Enterprise Readiness (Application is already ready to commercial use)
6.3.10 Implementation
Implementation process has seven steps that are given previously in Section 6.3.7
of Chapter 6.
Step 1 Download and Install Oracle Virtual Box
Get Oracle Virtual Box from https://www.virtualbox.org/wiki/Downloads (As shown
in Figure 6.4) and Run with default configuration.

54
Figure 6.4 Oracle Virtual Box Download Screen
Step 2 Download Hortonworks Data Platform (HDP) and Import HDP on
Oracle Virtual Box
Get HDP 2.0 from http://hortonworks.com/products/releases/hdp-2-0-ga/ (As
shown in Figure 6.5) and import HDP on Oracle Virtual Box (As shown in Figure 6.6,
Figure 6.7)
Figure 6.5 HDP 2.0 Download Screen

55
Figure 6.6 Oracle Virtual Box Main Screen
Figure 6.7 Oracle Virtual Box Screen after HDP Installation
Step 3 Download the Twitter Dataset
Get dataset from http://www.crowdflower.com/data-for-everyone (As shown in
Figure 6.8)

56
Figure 6.8 Dataset Download Screen
Step 4 Load Twitter Dataset, Hive Script and Sentiment Dictionary into the
HDP
Note:
See Appendix-A in APPENDICES for detailed information about Hive Script
See Appendix-B in APPENDICES for detailed information about Sentiment
Dictionary
To upload Twitter Dataset, Hive Script and Sentiment Dictionary into the HDP
application will use upload.zip which includes all of them. (As shown in Figure 6.9,
Figure 6.10 and Figure 6.11)
Figure 6.9 Dataset in Upload.zip
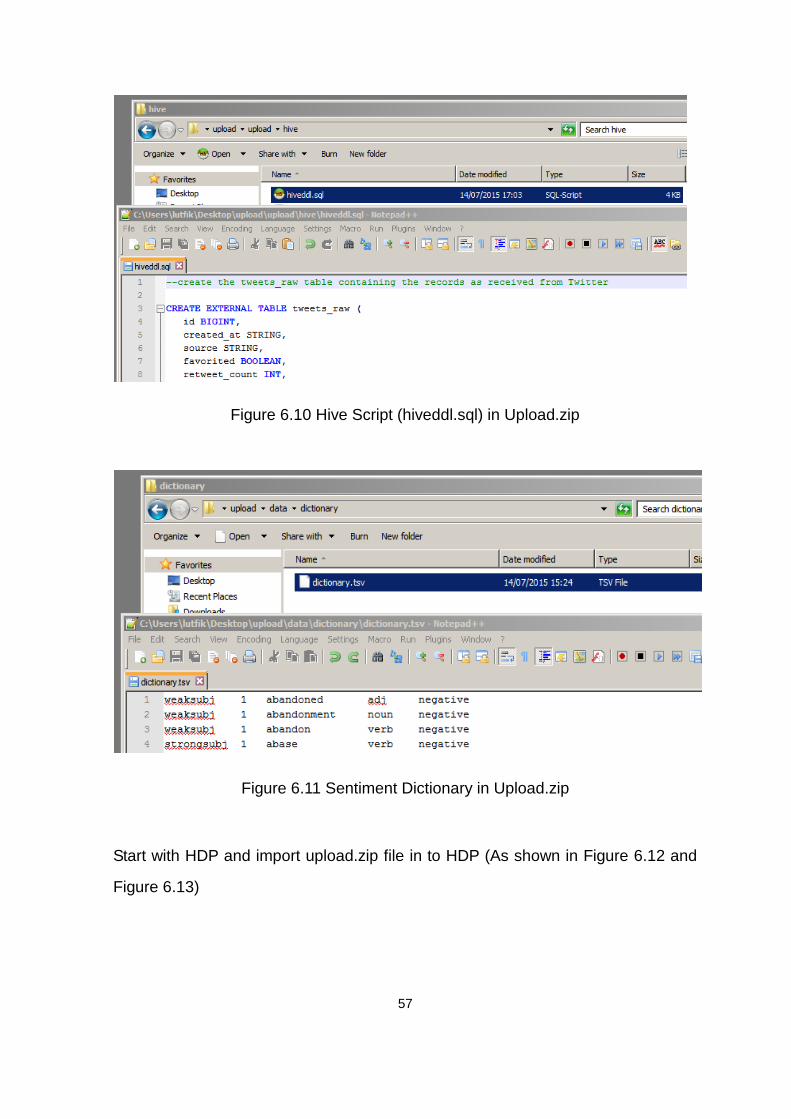
57
Figure 6.10 Hive Script (hiveddl.sql) in Upload.zip
Figure 6.11 Sentiment Dictionary in Upload.zip
Start with HDP and import upload.zip file in to HDP (As shown in Figure 6.12 and
Figure 6.13)

58
Figure 6.12 HDP Start Screen
Open a browser and type http://127.0.0.1:8888/. (As shown in Figure 6.13)
Figure 6.13 HDP Data Upload Screen
Now, load Twitter data into the HDP. One will see a file decision box and navigate
into the Sentiment Files folder. You will see a file called upload.zip. Select that and

59
start the upload.
Step 5 Run the Hive script to refine the raw data
After that, run Hive Script to get refined and analyzed data. Press Alt + F5 key
combination on HDP screen and focus the cursor. (As shown in Figure 6.14) Type
in the following commands with cursor: scp -P 2222 hiveddl.sql [email protected]
Figure 6.14 HDP Terminal Screen
Then Enter key: hive -f hiveddl.sql
The hiveddl.sql script has run the following steps to manipulate the source (As
shown in Figure 6.15):
Changed the raw Twitter data into a tabular format.
Used the dictionary file to calculate final score the sentiment of each Tweet
by the count of positive and negative words comparison.
Created a new tabular that includes the sentiment score for each Tweet.

60
Figure 6.15 Hive Script Process
Step 6 Access the refined sentiment data with Excel
Let’s use HCatalog of HDP (As shown in Figure 6.16) to take a quick look at the
data.
Open the Sandbox HUE program, then click HCatalog within the menu at
the highest of the page. The tweetsbi table is that the table created using
with the Hive script with the sentiment worth for every tweet.

61
Figure 6.16 Raw Dataset in Hcatalog
Export as raw dataset using with HCatalog.
Step 7 Visualize the sentiment data using Microsoft Excel 2013 Power
View
In this section, application will use Excel Professional Plus 2013 to access the
refined sentiment data. (As shown in Figure 6.17)
Figure 6.17 Raw Dataset and Microsoft Excel Power View Link
After adding Power View report, add map feature (As shown in Figure 6.18)

62
Figure 6.18 Power View Map Report Link
In result map, there are too many cities and their sentiment result. (As shown in
Figure 6.19)
Figure 6.19 Overall Sentiment Analysis Result
Now use the map controls to zoom in on Boston. In Boston, 372 of the tweets
expressed positive sentiment (shown in red color), and only 51 were negative
(shown in blue color). 120 tweets from Boston were neutral, as shown in orange.

63
(As shown in Figure 6.20)
Figure 6.20 Sentiment Analysis of Boston
The united states is that the biggest market; therefore let’s inspect sentiment
information there. The dimensions of the US chart indicates that a comparatively
sizable amount of the entire tweets return from the US.

64
6.3.11 Ongoing commitment
Sentiment Data should be seen as an asset so any data strategy initiative needs
ongoing commitment. In this point we will create stream script to get new datasets
from Twitter. Besides that it is not a stand-alone project, one must consider these
points and our application can handle new datasets using with our sentiment
analysis application.
6.4 Discussion of the Results
In the application a visualization of Twitter sentiment data for the problems of each
major U.S. airline are shown. These results will be useful for planning marketing
activities for any future flight and trip selection. Result entities are:
18 Airlines,
92 States,
13 Countries,
~ 55.000 twits.
Besides that this implementation process shows us, our proposal model can be
used step by step and help us to follow Big-Data applications. Another important
point is that this application shows there is no one package solution to build
Big-Data application. One can use various tools to implement Big-Data application
according to their needs.

65
7 SUMMARY AND CONCLUSIONS
7.1 Summary
Main objective of this thesis is to describe, review, and reflect various aspects of
Big-Data. The study first defined what is meant by Big-Data. Various definitions of
Big-Data were given highlighting the fact that volume is only one dimension of
Big-Data. It is stated that other dimensions, such as velocity and variety are equally
important. One may add also Value, Variability, Veracity and Complexity.
Another important focus has been on analytics to gain valid and valuable insights
from Big-Data. This study highlight the purpose that sentiment analysis that deals
largely with structured information. The study has also a tendency to reviewed
analytics techniques for audio, plain-text, video and social media data.
Lastly, another important focus is Big-Data application. Application is created using
with various tools. This process shows that there is a lot of implementation
alternatives to create a Big-Data application.
7.2 Conclusion
The major purpose of this study has been mainly not only on developing application
but also to define Big-Data properly and propose a development strategy. Because
various types of Big-Data applications are created but methodology and definitions
are not clear enough for developing Big-Data application in a proper life-cycle.
Therefore, one contribution of this thesis has been to propose a development
strategy for Big-Data applications. Such a strategy is applied on a case study using
a real dataset of Twitter data on US airlines. Thus another major contribution of the
thesis has been to demonstrate a Big-Data application on sentiment analysis with
combining various Big-Data tools.

66
7.3 Extensions of the Thesis
Limitations in this study are;
Diversity of Big-Data tools,
Ethics concern on real data (Twitter),
Lack of understanding on Big-Data ( “Big” equals to Volume fallacy),
Selection of application domain.
Ethics is the most contradictive topic because of using social media data which is
one of the main source of Big-Data concepts. IT laws and laws guiding
organizations on ethics and privacy. Therefore, new advancements in Big-Data
analytics have widened the gap between what's possible and what's legally allowed,
the balance of efficiency between people and data collectors.

67
REFERENCES
[1] Jawell, D., R.D. Barros, S.Diederichs, L.M. Duijvestijn, M. Hammersley,
Performance and Capacity Implications for Big-Data, Retrieved from:
http://www.redbooks.ibm.com/redpapers/pdfs/redp5070.pdf, 2014.
[2] Laney, D., 3D Data Management, Retrieved from:
http://blogs.gartner.com/doug-laney/files/2012/01/ad949-3D-Data-Managem
ent-Controlling-Data-Volume-Velocity-and-Variety.pdf, 2001.
[3] Dijks, J.P., Oracle: Big-Data for Enterprise, Retrieved from:
http://www.oracle.com/us/products/database/Big-Data-for-enterprise-51913
5.pdf, 2013.
[4] Zhang, Y., M. Chen, S. Mao, L. Hu, V. Leung, CAP: Community Activity
Prediction based on Big-Data Analysis, CAP: Community Activity Prediction
based on Big-Data Analysis, Published in: Network, IEEE (Volume: 28, Issue:
4), 2014.
[5] Srinivas, G.J., Big-Data on Microsoft Platform, Retrieved from:
http://download.microsoft.com/download/A/F/B/AFB1DCA8-7C6F-476B-815
9-214500E7A613/Big_Data_On_Microsoft_Platform.pdf, 2012.
[6] Collins, E., Big-Data in the Public Cloud, Published in: Cloud Computing,
IEEE (Volume: 1, Issue: 2), ISSN: 2325-6095, pp 13-15, 2014.
[7] Popescu, O. and C.Strapparava, Knowledge-Based Systems, Article: Time
corpora: Epochs, opinions and changes, Volume 69,
doi:10.1016/j.knosys.2014.04.029, Pages 3–13, 2014.
[8] Rill, S., D. Reinela, J. Scheidta, R. V. Zicarib, PoliTwi: Early detection of
emerging political topics on twitter and the impact on concept-level
sentiment analysis, doi:10.1016/j.knosys.2014.04.022, Volume 69, Pages
23-34, 2014.
[9] Jung, S. and A. Segev, Knowledge-Based Systems, Article:Analyzing future
communities in growing citation networks, doi:10.1016/j.knosys.2014.04.022,
Volume 69, Pages 34-44, 2014.
[10] Poria, S., E. Cambria, G. Wintersteinc, and G. Huanga, Knowledge-Based
Systems, Article: Sentic patterns: Dependency-based rules for concept-level
sentiment analysis, j.knosys.2014.05.005, Volume 69, Pages 45-63, 2014.

68
[11] Weichselbrauna, A., S. Gindlb, A. Scharlb, Knowledge-Based Systems,
Article: Enriching semantic knowledge bases for opinion mining in Big-Data
applications, doi:10.1016/j.knosys.2014.04.039, Volume 69, Pages 78-85,
2014.
[12] Bravo-Marquez, F., M. Mendozac and B. Pobleted, Knowledge-Based
Systems, Article: Meta-level sentiment models for big social data analysis,
doi:10.1016/j.knosys.2014.05.016, Volume 69, Pages 89-99, 2014.
[13] Wua, C., and R.T. Tsaib, Knowledge-Based Systems, Article: Using relation
selection to improve value propagation in a ConceptNet-based sentiment
dictionary, doi:10.1016/j.knosys.2014.04.043, Volume 69, Pages 100-107,
2014.
[14] Justo, R., T. Corcoran, S. M. Lukin, M. Walker, and M. Inés Torres,
Knowledge-Based Systems, Article: Extracting relevant knowledge for the
detection of sarcasm and nastiness in the social web,
doi:10.1016/j.knosys.2014.05.021, Volume 69, Pages 124-133, 2014.
[15] Montejo-Ráez, A., M.C. Díaz-Galiano, F. Martínez-Santiago and L.A.
Ureña-López, Knowledge-Based Systems, Article: Crowd explicit sentiment
analysis, doi:10.1016/j.knosys.2014.05.007, Volume 69, Pages 134-139,
2014.
[16] Flaounas, I., S. Sudhahar, T. Lansdall-Welfare, E. Hensiger, N. Cristianini,
Big-Data Analysis of News and Social Media Content, Retrieved from:
http://www.see-a-pattern.org/sites/default/files/Big%20Data%20Analysis%2
0of%20News%20and%20Social%20Media%20Content.pdf, 2012.
[17] Rahnama, A. H. A., Distributed Real-Time Sentiment Analysis for Big-Data
Social Streams, Published in: Control, Decision and Information
Technologies (CoDIT), 2014 International Conference, 2014.
[18] Mukkamala, R.R. and A. Hussain, Fuzzy-Set Based Sentiment Analysis of
Big Social Data, Republished in: Enterprise Distributed Object Computing
Conference (EDOC), 2014 IEEE 18th International, Page(s): 71 - 80, ISSN:
1541-7719, INSPEC Accession Number: 14792906, Conference Location:
Ulm, DOI:10.1109/EDOC.2014.19, Publisher: IEEE, 2014.
[19] Liu, B., E. Blasch, Y. Chen, D. Shen and G. Chen, Scalable
sentiment classification for Big-Data analysis using Naïve Bayes Classifier,
Published in: Big-Data, 2013 IEEE International Conference on, Page(s): 99
- 104, INSPEC Accession Number: 13999322, Conference Location: Silicon
Valley, DOI:10.1016/BigData.2013.6691740, Publisher: IEEE, 2013.

69
[20] SAS Community, Big-Data Meets Big-Data Analytics, Retrieved from:
http://www.sas.com/content/dam/SAS/en_us/doc/whitepaper1/Big-Data-me
ets-Big-Data-analytics-105777.pdf, 2012.
[21] Laney, D., The Importance of 'Big-Data': A Definition, Retrieved from:
http://www.gartner.com/resId=2057415, 2012.
[22] Davies, J., Three Big Mhyts about Big-Data, Retrieved from:
http://w3.usa.siemens.com/buildingtechnologies/us/en/energy-efficiency/ad
vantage-navigator/Documents/3_Big_Myths_About_Big_Data.pdf, 2014.
[23] Ward, J. S., A. Barker, Undefined by Data: A Survey of Big-Data Definitions,
Retrieved from: http://www.adambarker.org/papers/bigdata_definition.pdf,
2014.
[24] Stephenson, D., 7 Big-Data Techniques That Create Business Value,
Retrieved from: http://www.firmex.com/ 7-Big-Data-techniques /, 2013.
[25] Agrawal, D., P. Bernstein, E. Bertino, S.Davidson, U. Dayal, M. Franklin, J.
Gehrke, L. Haas, A. Halevy, J. Han, H.V. Jagadish, K. Ross, C. Shahabi, D.
Suciu, S. Vaithyanathan and J. Widom, Challenges and Opportunities with
Big-Data, Retrived from: http://www.purdue.edu/BigDataWhitePaper.pdf,
2013.
[26] Schenker, N., Big-Data: Uses and Limitations, Retrieved from:
http://www.cdc.gov/nchs/data/bsc/bscpres_schenker_091913.pdf, 2013.
[27] Waddell, T., 3 Reasons You Need a Big-Data and Analytics Strategy,
Retrieved from: http://blogs.adobe.com/Big-Data-analytics-strategy/, 2014.
[28] McGuire, T., J. Manyika, M. Chui, Why Big-Data is the new competitive
advantage Retrieved from: http://iveybusinessjournal.com/
competitive-advantage/, 2012.
[29] White, C., What Is Big-Data and Why Do We Need It?, Retrieved from:
http://www.technologytransfer.eu/article/98/2012/1/What_Is_Big_Data_and_
Why_Do_We_Need_It_.html, 2012.
[30] Bloem, J., M. Doorn, S. Duivestein, T. Manen, E. Ommeren, Big Social
Predicting behavior with Big-Data, Retrieved from:
https://us.sogeti.com/wp-content/uploads/2014/04/Big-Social-Predicting-Be
havior-with-Big-Data.pdf, 2014.
[31] Wu, X., X. Zhu, G. Wu, W. Ding, Data Mining, Published in: Knowledge and
Data Engineering, SSN : 1041-4347, pp 97-107, 2014.

70
[32] Apache Community, Welcome to Apache™ Hadoop®! Retrived from:
http://hadoop.apache.org/, 2015.
[33] Hortonworks Community, Open Enterprise Hadoop, Retrieved from:
http://hortonworks.com/, 2015
[34] Infochimps Community, How to Do a Big-Data Project, Retrieved from:
http://www.infochimps.com/resources/how-to-do-a-Big-Data-project-a-templ
ate-for-success/, 2015.
[35] Oates, D., 6 Essential Steps to Define your Big-Data Strategy, Retrieved
from:
http://www.experian.co.uk/marketing-services/article-6-steps-to-define-your-
Big-Data-strategy.html, 2015
[36] Bennett, M., Planning Your Big-Data Strategy: Five Keys to Success,
Retrieved from: http://blogs.forrester.com/five_keys_to_success, 2014
[37] Biesdorf, S., D. Court and P. Willmott, Big-Data: What’s your plan?,
Retrieved from: http://www.mckinsey.com//business_technology/big_data,
2013.
[38] Crowdflower Community, Airline Twitter Sentiment, Retrieved from:
http://www.crowdflower.com/data-for-everyone, 2015
[39] Oracle, Oracle Virtual Box, Retrieved from: https://www.virtualbox.org/
Downloads, 2015
[40] Hortonworks Community, HDP 2.0 Download, Retrieved from:
http://hortonworks.com/products/releases/hdp-2-0-ga/, 2015
[41] Microsoft, Microsoft Office Excel 2013 and Power View Plug-in, Retrieved
from: https://www.microsoft.com/tr-tr/download/details.aspx?id=39379, 2015

71
APPENDICES
Appendix A - Hive Script
Hive Script is written in six code blocks as following:
Block 1
In this Code block creates the tweets_raw table containing the records as received
from Twitter (As shown in Figure A.1)
Figure A.1 Code Block 1
Block 2
In this Code block creates sentiment dictionary using with dictionary file. (As shown
in Figure A.2)

72
Figure A.2 Code Block 2
Block 3
In this Code block cleans up with date tweets and reduce additional columns. (As
shown in Figure A.3)
Figure A.3 Code Block 3

73
Block 4
In this Code block computes sentiment result using with dictionary file. (As shown
in Figure A.4)
Figure A.4 Code Block 4
Block 5
In this Code block puts everything back together and re-number sentiment. (As
shown in Figure A.5)
Figure A.5 Code Block 5

74
Block 6
In this Code block creates for Tableau for Excel (As shown in Figure A.6) using with
following formula:
Sentiscore = sum(sentiment)*50 / count(sentiment)
Figure A.6 Code Block 6
Appendix B - Dictionary File
A dictionary file (As shown in Figure B.1) is used to calculate overall sentiment
score the compared to the amount of tweets.

75
Figure B.1 Sample Data of Sentiment Dictionary