Basis for Section 3116 Determination for the Idaho Nuclear ...
130
DOE/NE-ID-11226 Revision 0 Basis for Section 3116 Determination for the Idaho Nuclear Technology and Engineering Center Tank Farm Facility November 2006
Transcript of Basis for Section 3116 Determination for the Idaho Nuclear ...

DOE/NE-ID-11226Revision 0
Basis for Section 3116 Determination for the Idaho Nuclear Technology and Engineering Center Tank Farm Facility November 2006

DOE/NE-ID-11226Revision 0
Basis for Section 3116 Determination for the
Idaho Nuclear Technology and Engineering Center Tank Farm Facility
November 2006

ii
CONTENTS
ACRONYMS..............................................................................................................................................vii
1. INTRODUCTION AND PURPOSE.................................................................................................. 1
2. BACKGROUND................................................................................................................................ 5
2.1 Tank Farm Facility Description............................................................................................. 9
2.2 Origin and Management of TFF Wastes ............................................................................. 15
2.3 Tank Farm Facility Closure Activities and Status............................................................... 23
2.3.1 Cleaning Approach for Stainless Steel Tanks and Vaults ................................. 25 2.3.2 Results of Tank and Ancillary Equipment Cleaning from 2002 to 2005 .......... 28
2.4 Residual Inventory in Tank Farm Facility Structures, Systems, and Components ............. 30
2.4.1 Models and Calculations Used to Develop Residual Inventory at Closure....... 31 2.4.2 Residual Inventory at Closure in 300,000-gal Tanks ........................................ 33 2.4.3 Residual Inventory at Closure for 30,000-gal Tanks ........................................ 36 2.4.4 Residual Inventory at Closure for Sandpads ..................................................... 37 2.4.5 Residual Inventory at Closure for Contaminated Piping, Encasements, and
Valve Boxes ...................................................................................................... 41
3. SECTION 3116 OF THE RONALD W. REAGAN NATIONAL DEFENSE AUTHORIZATION ACT FOR FISCAL YEAR 2005...................................................................................................... 43
4. WASTE DOES NOT REQUIRE PERMANENT ISOLATION IN A DEEP GEOLOGIC REPOSITORY FOR SPENT FUEL OR HIGH-LEVEL RADIOACTIVE WASTE ...................... 45
5. WASTE HAS HAD HIGHLY RADIOACTIVE RADIONUCLIDES REMOVED TO THE MAXIMUM EXTENT PRACTICAL.............................................................................................. 47
5.1 Highly Radioactive Radionuclides ...................................................................................... 47
5.1.1 Approach ........................................................................................................... 47 5.1.2 Radionuclides from Performance Assessment .................................................. 48
5.2 Removal to the Maximum Extent Practical......................................................................... 50
5.2.1 Percentage of Radionuclides Removed............................................................. 54 5.2.2 Cost of Developing a More Efficient Cleaning Technology............................. 56 5.2.3 Conclusions ....................................................................................................... 57
6. RADIONUCLIDE CONCENTRATIONS OF STABILIZED WASTE.......................................... 59
6.1 300,000-gal Tanks ............................................................................................................... 61
6.1.1 300,000-gal Tank Waste Concentration............................................................ 63

iii
6.1.2 Summary and Conclusions................................................................................ 65
6.2 300,000-gal Tank Vaults ..................................................................................................... 65
6.2.1 Summary and Conclusions................................................................................ 69
6.3 30,000-gal Tanks ................................................................................................................. 69
6.3.1 Summary and Conclusions................................................................................ 71
6.4 Grouted Piping, Encasements, and Valve Boxes ................................................................ 71
6.4.1 Summary and Conclusions................................................................................ 73
6.5 Sensitivity Analyses ............................................................................................................ 73
6.6 Conclusions ......................................................................................................................... 73
7. WASTE WILL BE DISPOSED OF IN ACCORDANCE WITH PERFORMANCE OBJECTIVES IN 10 CFR 61, SUBPART C ................................................................................... 74
7.1 Analysis of Performance ..................................................................................................... 76
7.1.1 Institutional Control Period............................................................................... 77 7.1.2 Post-Institutional Control Period....................................................................... 77 7.1.3 Exposure Pathways ........................................................................................... 77
7.2 Models and Assumptions .................................................................................................... 78
7.2.1 Source Term Model........................................................................................... 78 7.2.2 Groundwater Flow and Transport Modeling..................................................... 79 7.2.3 Chronic Intruder Exposure Scenarios ............................................................... 82
7.3 Acute Intruder-Drilling Scenario Definition ....................................................................... 82
7.4 Acute Intruder-Construction Scenario................................................................................. 84
7.5 Chronic Intruder Post-Drilling Scenario Definition ............................................................ 84
7.6 Chronic Intruder Post-Construction Scenario Definition .................................................... 85
7.7 Estimated Radiation Dose Using the Current Estimate of the Residual Inventory at Closure................................................................................................................................. 86
7.8 10 CFR 61.40, “General Requirement”............................................................................... 87
7.9 10 CFR 61.41, “Protection of the General Population from Releases of Radioactivity” .... 88
7.10 10 CFR 61.42, “Protection of Individuals from Inadvertent Intrusion” .............................. 90
7.11 10 CFR 61.43, “Protection of Individuals during Operations” ........................................... 94

iv
7.11.1 Air Emissions Limit for Individual Member of the Public [10 CFR 20.1101(d)] ......................................................................................... 95
7.11.2 Total Effective Dose Equivalent Limit for Adult Workers [10 CFR 20.1201(a)(1)(i)]................................................................................. 96
7.11.3 Any Individual Organ or Tissue Dose Limit for Adult Workers [10 CFR 20.1201(a)(1)(ii)]................................................................................ 96
7.11.4 Annual Dose Limit to the Lens of the Eye for Adult Workers [10 CFR 20.1201(a)(2)(i)]................................................................................. 97
7.11.5 Annual Dose Limit to the Skin of the Whole Body and to the Skin of the Extremities for Adult Workers [10 CFR 20.1201(a)(2)(ii)].............................. 97
7.11.6 Limit on Soluble Uranium Intake [10 CFR 20.1201(e)] ................................... 98 7.11.7 Dose Equivalent to an Embryo/Fetus [10 CFR 20.1208(a)] ............................. 98 7.11.8 Dose Limits for Individual Members of the Public [10 CFR 20.1301(a)(1)] ... 98 7.11.9 Dose Limits for Individual Members of the Public [10 CFR 20.1301(a)(2)] ... 99 7.11.10 Dose Limits for Individual Members of the Public [10 CFR 20.1301(b)] ........ 99 7.11.11 As Low As Reasonably Achievable (10 CFR 20.1003).................................... 99 7.11.12 Reasonable Assurance..................................................................................... 100
7.12 10 CFR 61.44, “Long-Term Stability of Disposal Site”.................................................... 102
7.12.1 Siting ............................................................................................................... 102 7.12.2 Design ............................................................................................................. 103 7.12.3 Use/Operation ................................................................................................. 104 7.12.4 Closure ............................................................................................................ 104
7.13 Conclusions ....................................................................................................................... 105
8. STATE-APPROVED CLOSURE PLANS .................................................................................... 106
9. CONCLUSION .............................................................................................................................. 110
10. REFERENCES............................................................................................................................... 111
11. DRAWING..................................................................................................................................... 121
Appendix A—INTEC Tank Farm Facility Closure Supporting Tables and Photographs ........................A-1
Appendix B—Summary of Analysis for Selecting Tank Cleaning Technologies.................................... B-1
Appendix C—TFF Grout Design Mix and Quality Assurance/Quality Control Testing ......................... C-1
Appendix D—Sensitivity Evaluations ......................................................................................................D-1
Appendix E—Residual Inventory and Grout Volume used in Final 300,000-gal Tank Concentration Calculations .................................................................................................................................... E-1
Appendix F—Tables for Sum of the Fractions Calculations Discussed in Sensitivity Evaluations..........F-1
Appendix G—Comparison of Final Waste Form Calculation Methodology to Fundamental Principles on Concentration Averaging in the NRC Draft Interim Guidance ................................G-1

v
Appendix H—Past NRC Review Recommendations ...............................................................................H-1
Appendix I—Management Control Systems ..............................................................................................I-1
FIGURES
1. Idaho National Laboratory site map ................................................................................................... 7
2. Tank Farm Facility location at INTEC............................................................................................... 8
3. Plan view of the Tank Farm Facility .................................................................................................. 9
4. Cross-sectional view of a typical tank with cooling coils ................................................................ 11
5. Vault designs used at the INTEC TFF.............................................................................................. 12
6. Photograph showing the internal structure and cooling coils of Tank WM-185 during construction ...................................................................................................................................... 13
7. Artist’s depiction of tanks to be included in the INTEC TFF closure.............................................. 14
8. Spent fuel reprocessing at INTEC.................................................................................................... 16
9. Volumes in TFF 300,000-gal tanks as of April 30, 2005 ................................................................. 22
10. Typical tank cleaning system ........................................................................................................... 26
11. Photographs of the interior of TFF Tank WM-183 before tank cleaning......................................... 29
12. Photograph of the interior of TFF Tank WM-183 after tank cleaning ............................................. 30
13. Radioactivity (counts per minute per gallon) measured during cleaning operations........................ 53
14. Schematic of the grout placement sequence..................................................................................... 63
15. The DUST-MS conceptual model for release from the TFF vaults and tanks ................................. 79
16. Illustration of the two-dimensional modeling slice used in PORFLOW.......................................... 80
17. Graphical representation of the acute intruder-drilling scenario ...................................................... 83
18. Chronic intruder post-drilling scenario............................................................................................. 85
TABLES
1. Residual inventory at closure for Tank WM-182............................................................................. 34
2. Residual inventory at closure for Tank WM-106............................................................................. 37
3. Sandpad residual inventory at closure (Ci per sandpad) .................................................................. 40

vi
4. Residual inventory at closure for piping........................................................................................... 42
5. List of highly radioactive radionuclides ........................................................................................... 49
6. Percentage of highly radioactive radionuclides removed from all tanks and ancillary equipment .. 55
7. Cost estimate of TFF cleaning system.............................................................................................. 56
8. All-pathways dose reduction and cost per mrem.............................................................................. 57
9. Radionuclide concentrations in the final Tank WM-182 grouted waste form (Table 1 of 10 CFR 61.55) .................................................................................................................................. 64
10. Radionuclide concentrations in the final Tank WM-182 grouted waste form (Table 2 of 10 CFR 61.55) .................................................................................................................................. 64
11. Radionuclide concentrations in the grouted vaults (Table 1 of 10 CFR 61.55) ............................... 67
12. Radionuclide concentrations in the (Table 2 of 10 CFR 61.55) grouted vaults. .............................. 67
13. Sum of the fractions for 32.5 m3 of grout in the tank vault (Table 1 of 10 CFR 61.55)................... 68
14. Radionuclide concentrations in a final 30,000-gal tank grouted waste form (Table 1 of 10 CFR 61.55) .................................................................................................................................. 70
15. Radionuclide concentrations in a final 30,000-gal tank grouted waste form (Table 2 of 10 CFR 61.55) .................................................................................................................................. 70
16. Sum of the fractions for 30,000-gal tanks using only the mass of steel (Table 1 of 10 CFR 61.55) .................................................................................................................................. 71
17. Radionuclide concentrations in the piping (with grout) (Table 1 of 10 CFR 61.55)........................ 72
18. Radionuclide concentrations in the piping (with grout) (Table 2 of 10 CFR 61.55)........................ 73
19. Comparison of performance assessment results to predicted dose at closure .................................. 86
20. Groundwater all-pathways dose (less than 25 mrem/yr) .................................................................. 89
21. Acute intruder-construction dose (less than 500 mrem)................................................................... 91
22. Acute intruder-drilling dose (less than 500 mrem)........................................................................... 92
23. Chronic intruder-construction dose .................................................................................................. 93
24. Chronic intruder-drilling dose comparison....................................................................................... 93

vii
ACRONYMS
ALARA as low as reasonably achievable
ASME American Society of Mechanical Engineers
ASTM ASTM International (formerly American Society for Testing and Materials)
CERCLA Comprehensive Environmental Response, Compensation, and Liability Act
CFR Code of Federal Regulations
CWI CH2M-WG Idaho, LLC
DCF dose conversion factor
DEQ State of Idaho Department of Environmental Quality
DOE U.S. Department of Energy
DOE Idaho U.S. Department of Energy Idaho Operations Office
DQA data quality assessment
DQO data quality objective
DUST-MS Disposal Unit Source Term-Multiple Species
EIS Environmental Impact Statement
EPA U.S. Environmental Protection Agency
ESRP Eastern Snake River Plain
FR Federal Register
HLW high-level waste
HWMA Hazardous Waste Management Act
ICRP International Commission on Radiological Protection
IDAPA Idaho Administrative Procedures Act
INEEL Idaho National Engineering and Environmental Laboratory
INEL Idaho National Engineering Laboratory
INL Idaho National Laboratory
INTEC Idaho Nuclear Technology and Engineering Center

viii
LLW low-level waste
MCP management control procedure
M&O management and operating
NA not applicable
ND not detected
NDAA National Defense Authorization Act
NRC Nuclear Regulatory Commission
PA performance assessment
PEWE Process Equipment Waste Evaporator
QA quality assurance
RAI request for additional information
RCRA Resource Conservation and Recovery Act
ROD Record of Decision
RPP radiation protection program
SAP sampling and analysis plan
SBW sodium-bearing waste
SNF spent nuclear fuel
TEDE total effective dose equivalent
TER technical evaluation report
TFA Tanks Focus Area
TFF Tank Farm Facility
USC United States Code
WAC waste acceptance criteria

1
Basis for Section 3116 Determination for the
Idaho Nuclear Technology and Engineering Center Tank Farm Facility
1. INTRODUCTION AND PURPOSE
Key Points
• This 3116 Basis Document addresses the disposal of stabilized residuals in the TFF, and the TFF tank system, and disposal of the tanks, vaults, and associated piping and ancillary equipment at INTEC. The TFF tank system comprises the eleven 300,000-gal tanks, four 30,000-gal tanks, and the vaults, piping, structures, and ancillary equipment associated with these tanks.
• The scope of this 3116 Basis Document does not include any other facilities or systems at INTEC or the INL Site such as the evaporators, the New Waste Calcining Facility, the calcine storage bin sets, the 900,000 gal of stored sodium-bearing waste, contaminated soils, or the treated sodium-bearing waste for off-Site disposal.
• The planned TFF closure date of 2012 is assumed throughout this 3116 Basis Document.a
• The TFF tank system closure process includes cleaning activities and stabilization activities. After the sodium-bearing waste is removed, the tanks, vaults, piping, structures, and ancillary equipment will be cleaned. Then the system will be stabilized by filling the components with grout. This distinction between cleaning activities and stabilization activities (grouting) applies throughout this 3116 Basis Document. The term “final closure” is used to describe the completion of both cleaning and stabilization activities.
• Stabilization of individual tanks, vaults, and other TFF components may take place once cleaning of those individual components is completed and need not be delayed until the cleaning of all tanks, vaults, and other TFF components is completed.
• This 3116 Basis Document addresses only radioactive constituents of the TFF residuals; hazardous constituents of this waste are addressed in State-approved closure plans.
The Secretary of Energy is making a 3116 Determination pursuant to Section 3116 of the Ronald
W. Reagan National Defense Authorization Act for Fiscal Year 2005 (NDAA) (Public Law 108-375, 2004). The Secretary of Energy’s 3116 Determination and this 3116 Basis Document concern the disposal of grouted residual waste in the tank systems at the Idaho Nuclear Technology and Engineering Center (INTEC) Tank Farm Facility (TFF) that are being closed in accordance with U.S. Department of Energy (DOE) requirements for managing a radioactive waste storage facility (DOE O 435.1, 2001) and Hazardous Waste Management Act (HWMA) (State of Idaho 1983)/Resource Conservation and Recovery Act (RCRA) (42 United States Code [USC] 6901 et seq. 1976) requirements for an interim status tank system. The DOE is closing the TFF tank system in response to a January 1990 Notice of Noncompliance and subsequent Consent Order (State of Idaho et al. 1992). The TFF consists of eleven 300,000-gal a. The numbers and percentages in this 3116 Basis Document are either rounded numbers and percentages and/or are DOE’s best estimates at this time. The numbers, percentages, and dates in this 3116 Basis Document should be viewed as approximate numbers, percentages, and dates.
2
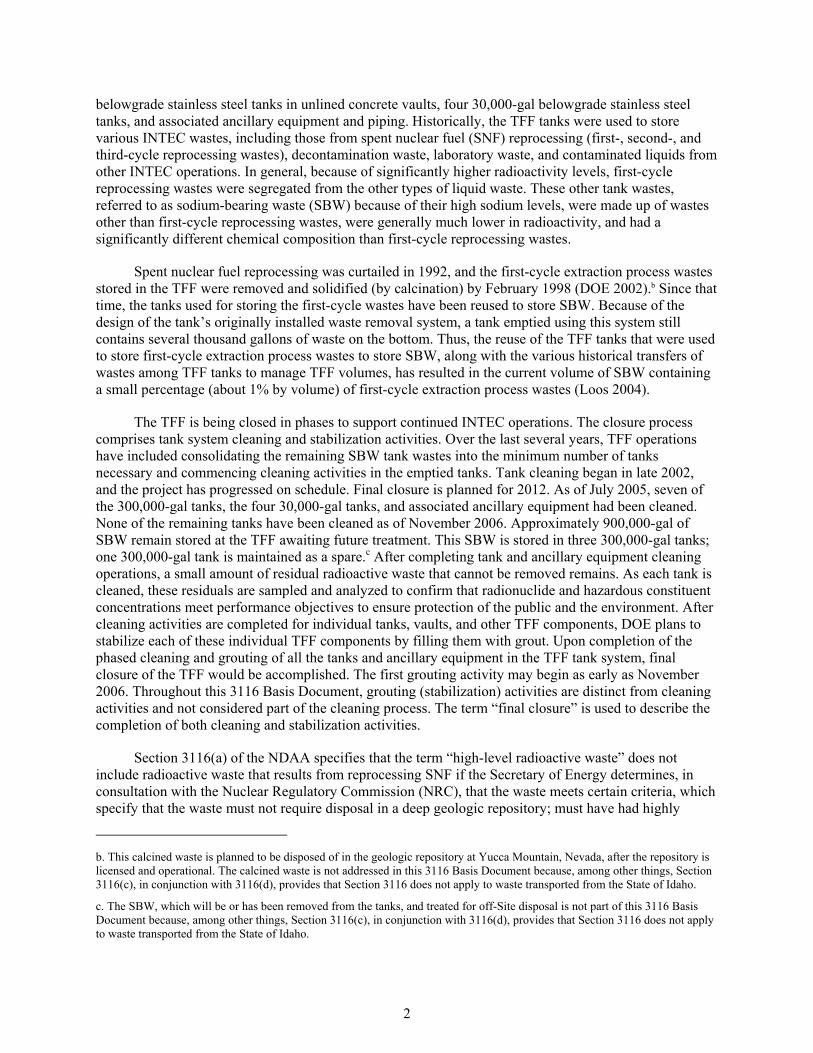
belowgrade stainless steel tanks in unlined concrete vaults, four 30,000-gal belowgrade stainless steel tanks, and associated ancillary equipment and piping. Historically, the TFF tanks were used to store various INTEC wastes, including those from spent nuclear fuel (SNF) reprocessing (first-, second-, and third-cycle reprocessing wastes), decontamination waste, laboratory waste, and contaminated liquids from other INTEC operations. In general, because of significantly higher radioactivity levels, first-cycle reprocessing wastes were segregated from the other types of liquid waste. These other tank wastes, referred to as sodium-bearing waste (SBW) because of their high sodium levels, were made up of wastes other than first-cycle reprocessing wastes, were generally much lower in radioactivity, and had a significantly different chemical composition than first-cycle reprocessing wastes.
Spent nuclear fuel reprocessing was curtailed in 1992, and the first-cycle extraction process wastes stored in the TFF were removed and solidified (by calcination) by February 1998 (DOE 2002).b Since that time, the tanks used for storing the first-cycle wastes have been reused to store SBW. Because of the design of the tank’s originally installed waste removal system, a tank emptied using this system still contains several thousand gallons of waste on the bottom. Thus, the reuse of the TFF tanks that were used to store first-cycle extraction process wastes to store SBW, along with the various historical transfers of wastes among TFF tanks to manage TFF volumes, has resulted in the current volume of SBW containing a small percentage (about 1% by volume) of first-cycle extraction process wastes (Loos 2004).
The TFF is being closed in phases to support continued INTEC operations. The closure process comprises tank system cleaning and stabilization activities. Over the last several years, TFF operations have included consolidating the remaining SBW tank wastes into the minimum number of tanks necessary and commencing cleaning activities in the emptied tanks. Tank cleaning began in late 2002, and the project has progressed on schedule. Final closure is planned for 2012. As of July 2005, seven of the 300,000-gal tanks, the four 30,000-gal tanks, and associated ancillary equipment had been cleaned. None of the remaining tanks have been cleaned as of November 2006. Approximately 900,000-gal of SBW remain stored at the TFF awaiting future treatment. This SBW is stored in three 300,000-gal tanks; one 300,000-gal tank is maintained as a spare.c After completing tank and ancillary equipment cleaning operations, a small amount of residual radioactive waste that cannot be removed remains. As each tank is cleaned, these residuals are sampled and analyzed to confirm that radionuclide and hazardous constituent concentrations meet performance objectives to ensure protection of the public and the environment. After cleaning activities are completed for individual tanks, vaults, and other TFF components, DOE plans to stabilize each of these individual TFF components by filling them with grout. Upon completion of the phased cleaning and grouting of all the tanks and ancillary equipment in the TFF tank system, final closure of the TFF would be accomplished. The first grouting activity may begin as early as November 2006. Throughout this 3116 Basis Document, grouting (stabilization) activities are distinct from cleaning activities and not considered part of the cleaning process. The term “final closure” is used to describe the completion of both cleaning and stabilization activities.
Section 3116(a) of the NDAA specifies that the term “high-level radioactive waste” does not include radioactive waste that results from reprocessing SNF if the Secretary of Energy determines, in consultation with the Nuclear Regulatory Commission (NRC), that the waste meets certain criteria, which specify that the waste must not require disposal in a deep geologic repository; must have had highly
b. This calcined waste is planned to be disposed of in the geologic repository at Yucca Mountain, Nevada, after the repository is licensed and operational. The calcined waste is not addressed in this 3116 Basis Document because, among other things, Section 3116(c), in conjunction with 3116(d), provides that Section 3116 does not apply to waste transported from the State of Idaho.
c. The SBW, which will be or has been removed from the tanks, and treated for off-Site disposal is not part of this 3116 Basis Document because, among other things, Section 3116(c), in conjunction with 3116(d), provides that Section 3116 does not apply to waste transported from the State of Idaho.

3
radioactive radionuclides removed to the maximum extent practical; must meet performance objectives for low-level waste (LLW) and either meet certain concentration limits or consult with the NRC regarding the disposal plan; and must be disposed of pursuant to a State-approved closure plan or State-issued permit. This 3116 Basis Document provides the basis for the Secretary of Energy’s determination that the stabilized residuals in the TFF, and in the TFF tank system, after final closure activities are completed will meet all of these criteria. Accordingly, these wastes are not high-level waste (HLW) and may be grouted and disposed of in place. For the purposes of this 3116 Basis Document, the TFF tank system comprises the eleven 300,000-gal tanks, four 30,000-gal tanks, and the vaults, piping, structures, and ancillary equipment associated with these tanks. The scope of this 3116 Basis Document does not include any other facilities or systems at INTEC or the Idaho National Laboratory (INL) Site such as the evaporators or the New Waste Calcining Facility.
To demonstrate that the stabilized residuals in the TFF, and in the TFF tank system, at final closure will meet the Section 3116 criteria, historical waste management information, performance assessment (PA) results, and sampling and analysis results from the recent tank cleaning activities were reviewed and analyzed.d In addition, the residual inventory at closure was updated to reflect the results of TFF cleaning activities. Prior to cleaning and receiving sampling and analysis results of the first tank cleaning, planning documents such as the first HWMA/RCRA closure plan (DOE-ID 2003a) and the TFF PA (DOE-ID 2003b) were prepared. These planning documents determined the baseline inventory and consequently established the goals for the cleaning activities to meet or exceed. The total post-decontamination inventory for each of the cleaned TFF tanks is significantly less than the total conservative post-decontamination inventory of a single tank estimated in the PA (24,103 Ci), indicating that the tank cleaning operations performed since this baseline inventory was established performed better than planned, as presented in Appendix A. The greatest inventory for a cleaned tank is Tank WM-182, which contains 2,393 Ci.
The purpose of this 3116 Basis Document is to demonstrate and document that the stabilized residuals in the TFF, and TFF tank system, meet the 3116 criteria, and therefore by law, are not HLW and may be disposed of at INTEC in accordance with Section 3116(a) of the NDAA (Public Law 108-375, 2004). This 3116 Basis Document addresses only radioactive constituents in the INTEC TFF after final closure. Characterization of the hazardous constituents of the TFF residuals in accordance with RCRA is not addressed in this 3116 Basis Document. The State of Idaho, which has primacy for RCRA compliance but does not have regulatory oversight of the radioactive materials contained in the TFF tanks and ancillary equipment, approves the HWMA/RCRA closure plans.e
Pursuant to Section 3116(a) of the NDAA, DOE has consulted with the NRC. To facilitate the consultative process, DOE provided NRC with a draft 3116 Determination on September 7, 2005. During its review of the draft 3116 Determination, NRC requested additional information from DOE (NRC 2006a). The DOE responded to the NRC request for additional information (RAI) in three separate submittals (DOE 2006a, 2006b, 2006c). The DOE also provided other additional information as requested
d. DOE also took into account the results of its consultations with NRC in 2002. Appendix H discusses the NRC conclusions and recommendations from these consultations.
e. Section 3116 is not dependent on the independent process under the Comprehensive Environmental Response, Compensation, and Liability Act (CERCLA) (42 USC 9601 et seq. 1980) and does not provide a basis for any new authority, responsibility, or obligation for DOE or any other entity with respect to the CERCLA process or otherwise affect the CERCLA process. Decisions regarding past releases of contaminants and the impacts of contaminated soils associated with the TFF will be addressed under the CERCLA process as specified in the Federal Facility Agreement and Consent Order among DOE, the State of Idaho, and the U.S. Environmental Protection Agency (EPA) (State of Idaho et al. 1991).

4
by the NRC, and DOE and NRC held public consultation meetings as well as several consultation telephone calls.
On October 20, 2006, the NRC issued its “Technical Evaluation Report for the U.S. Department of Energy Idaho National Laboratory Site Draft Section 3116 Waste Determination for Idaho Nuclear Technology and Engineering Center Tank Farm Facility” (NRC 2006b). The TER presents NRC’s views and conclusions with respect to whether the stabilized residuals under DOE’s disposal and closure approach can meet the applicable requirements of Section 3116(a) of the NDAA such that the Secretary may determine that the waste is not HLW. As noted in the NRC’s executive summary (page x), “Based on the information provided by DOE, NRC staff has concluded in this TER that there is reasonable assurance that the applicable criteria of the NDAA can be met for residual waste associated with the TFF.”
As discussed in the TER, the NRC staff concluded that the NDAA criteria in Section 3116(a)(1), (a)(2), and (a)(3)(B) can be met for the stabilized residuals in the TFF, and the TFF tank system, to be disposed of at the TFF (see TER Section 5, Overall Conclusions). Although NRC identified certain uncertainties or concerns, and in some instances adopted alternative approaches or differing analyses or rationale than DOE, NRC similarly concluded that the applicable criteria of the NDAA would be met by DOE’s disposal strategy. DOE has considered the NRC observations in preparing this 3116 Basis Document, and has addressed the NRC observations as appropriate throughout this document.
Section 3116(b) requires that the NRC, in coordination with the State of Idaho, monitor disposal actions taken by DOE for the purposes of assessing compliance with the performance objectives of 10 CFR 61, Subpart C. In Subsection 4.4 of its TER, NRC staff identified five “key monitoring areas”, and stated that NRC will coordinate with the State of Idaho to develop a monitoring plan/approach to address those areas. DOE will work with the NRC and the State of Idaho to facilitate their efforts to fulfill their independent responsibilities.f
Although not required by Section 3116, the DOE also made available the draft 3116 Determination for a 30-day public review and comment period in September 2005 (70 Federal Register [FR] 54374). No public comments were received during the comment period; however, comments were subsequently received after the comment period from the State of Idaho and the INL Site Environmental Management Citizens Advisory Board (Hardesty 2006; Kipping 2006; Trever 2006). These comments were considered in preparing this 3116 Basis Document (Provencher 2006; Van Camp 2006a, 2006b).
Although not part of the Secretary’s 3116 Determination or this 3116 Basis Document, DOE is also issuing an Amended Record of Decision for the Idaho High-Level Waste and Facilities Disposition Final Environmental Impact Statement concerning closure of the TFF in conjunction with the issuance of the 3116 Determination.
f. DOE also notes that Appendix A (page 115) of the NRC’s TER (NRC 2006b) contained nine recommendations for DOE’s consideration, “The purpose of the recommendations is to communicate actions that DOE might consider to further enhance its approach for management of the TFF waste at INL, as well as the approach for future waste determinations. As stated in this Technical Evaluation Report (TER), the NRC staff has concluded that DOE has adequately demonstrated that it can meet applicable criteria of the Ronald W. Reagan National Defense Authorization Act for Fiscal Year 2005 (NDAA). Thus, it is the NRC staff’s view that implementation of these recommendations is not necessary to meet the criteria in the NDAA.” Although most of the recommendations are outside the scope of Section 3116, the DOE, nevertheless, intends to consider these recommendations in its disposal of the TFF residuals and development of future 3116 Determinations, as appropriate and consistent with law.

5
2. BACKGROUND
Key Points
• The residual inventory at closure is an estimate of the amount of radioactivity remaining in the residual in the TFF at closure in 2012, the planned closure date. All radionuclide concentrations are decayed to 2012.
• The residual inventory for the eleven 300,000-gal tanks is based on analytical data from samples obtained after cleaning operations from the seven tanks that have been cleaned.
- The inventory for the 300,000-gal tanks assumes (for the reasons explained in Subsection 2.4.2) that the same degree of radionuclide removal will be achieved in the four tanks remaining to be cleaned as that achieved in the seven tanks that have been cleaned.
- Residual solids are estimated from a sample of solids collected from Tank WM-183. Concentrations for radionuclides not detected in this sample are estimated using the ORIGEN2 numerical model and 137Cs concentrations in Tank WM-188 samples collected prior to cleaning.
- The inventory is not reduced by the amount of additional residual that may be removed from the cleaned tanks during grouting operations.
• A 5-mil (0.005-in.) thick film of residual solids is assumed for the 30,000-gal tank inventory, for the reasons described in Subsection 2.4.3. Radionuclide concentrations are assumed (for the reasons described in this 3116 Basis Document) to be that found in the Tank WM-183 solid samples.
• The residual inventory for the sandpads underlying Tanks WM-185 and WM-187 is a conservative inventory representing the sandpad under these tanks in the PA inventory. The inventory is based on the concentrations of radionuclides in liquid residuals that were siphoned into the Tank WM-185 vault in 1962.
• The piping residual inventory is based on analytical results from sampling pipe sections removed from the Tank WM-182 process waste lines after cleaning. The inventory for valves is included with the piping inventory. No inventory is calculated for valve boxes, pipe encasements, and off-gas piping because these components did not normally contain process solutions.
• This 3116 Basis Document addresses disposal of the stabilized residuals in the TFF, and the TFF tank system, at closure when the entire TFF has been cleaned and grouted as described in this 3116 Basis Document. The closure is expected to be completed by 2012 and decay is calculated based on that date. But, as described in more detail in this 3116 Basis Document, differences in decay between the present time and 2012 are not significant (and do not affect compliance with the performance objectives of 10 CFR 61, Subpart C as considered in this 3116 Basis Document).
• Modeling is used to estimate concentrations for radionuclides for which analytical data are not available or for which radionuclides were not detected in samples. Modeling and calculations are based on the planned 2012 closure date.
• The sandpads are structural components of the TFF and are located inside the vault and under the 300,000-gal tanks. The vaults of Tanks WM-182 through WM-190 contain sandpads.

6
The INTEC TFF is located on the INL Site. The INL is an approximately 2,305-km2 (890-mi2) reservation owned by the United States government and located in southeastern Idaho (see Figure 1). Established over 50 years ago as the National Reactor Testing Station, INL’s initial mission was to develop civilian and defense nuclear reactor technologies. Over the years, the INL mission evolved beyond the original reactor technology focus. The INL is now involved in various defense, energy supply, industrial technology, and environmental programs. In recognition of this evolution to a multi-program installation, the site was designated the Idaho National Engineering Laboratory (INEL) in 1974. In January 1997, the name was changed to the Idaho National Engineering and Environmental Laboratory (INEEL) to reflect greater emphasis on the laboratory’s environmental missions. In February 2005, the INEEL became two separate organizations: INL, which performs its continuing research mission, and Idaho Cleanup Project, which carries out the site’s cleanup responsibilities.
In 1953, the Idaho Chemical Processing Plant, now INTEC, was chartered to recover fissile uranium by reprocessing SNF. In 1992, the DOE officially discontinued reprocessing SNF at INTEC. This decision changed INTEC’s mission to managing, storing, and treating reprocessing wastes generated from past and current operations and activities. The INTEC facility is located approximately 29 km (18 mi) from the closest eastern boundary, approximately 23 km (14 mi) from the closest western boundary, approximately 16 km (10 mi) from the closest southern boundary, and approximately 29 km (18 mi) from the closest northern boundary. The TFF, located within the northern portion of INTEC (see Figures 2 and 3), comprises eleven 300,000-gal belowgrade stainless steel tanksg in unlined concrete vaults of various construction, four inactive 30,000-gal stainless steel tanks, interconnecting waste transfer lines, and associated support instrumentation and valves. Structures located above ground level in the TFF include the TFF Control House, the Computer Interface Building, and the tank and vault sump riser covers. A perimeter fence encloses the TFF. Subsection 2.1 provides a detailed description of the TFF. Subsection 2.2 presents a discussion of the wastes stored in the TFF and waste management practices.
Recent tank cleaning operations have resulted in the removal of the remaining SBW and tank heels from seven 300,000-gal tanks and four 30,000-gal tanks to the maximum extent practical for the cleaned tanks. Four 300,000-gal tanks remain to be cleaned, and these four tanks are anticipated to be cleaned as efficiently as the other 300,000-gal tanks that have been cleaned. Sampling and analysis of tank and ancillary equipment residuals indicate that the residual inventory at closure is less than that established in the 2003 PA (DOE-ID 2003b). The residual inventories in the stabilized residuals in the TFF, and the TFF tank system at final closure will meet Section 3116 criteria. Subsection 2.3 describes the TFF closure activities and status, including the tank cleaning equipment. (A summary of the tank cleaning technology evaluation is presented in Appendix B.) The residual inventory at closure and the characterization of the TFF residuals after tank cleaning are presented in Subsection 2.4.
g. Tanks WM-180 and WM-181 are actually 318,000-gal tanks; however, for ease of reference, all 11 tanks will be referred to as 300,000-gal tanks.

7
Figure 1. Idaho National Laboratory site map.

8
Figure 2. Tank Farm Facility location at INTEC.

9
Figure 3. Plan view of the Tank Farm Facility.
2.1 Tank Farm Facility Description
Placed into service between 1953 and 1966, the eleven 300,000-gal tanks (WM-180 through WM-190) are approximately 15.2 m (50 ft) in diameter and 6.4–7.0 m (21–23 ft) in height. Nine of the eleven 300,000-gal tanks are constructed of Type 304L stainless steel; two tanks (WM-180 and WM-181) use Type 347 stainless steel. Each tank has four or five 30-cm (12-in.) diameter risers to provide access to the tank. Tanks WM-184 through WM-190 also have one or two 46-cm (18-in.) diameter risers. Most risers have installed equipment and instrumentation, including radio frequency probes for level measurement, corrosion coupons,h and steam jets and airlifts for waste transfer operations. Two steam jets are located inside each tank, except for Tanks WM-189 and WM-190, which have one steam jet and one
h. A corrosion coupon is a piece of material, in this case metal, of known weight used to monitor corrosion in a specific environment. The coupon weight before and after exposure is measured to determine loss from corrosion. The condition of the coupon may also be observed.

10
airlift pump. High-pressure steam is forced through a steam jet to create a suction pumping action to move liquid from the tank to Tank WM-187 until final treatment and disposition are identified.
A single steam-jet pump can transfer waste out of a tank at approximately 50 gpm. The original design of the suction pumps restricts the ability of the pumps to clear the tanks of liquid completely. Using original steam jet placement and prior to any tank cleaning activities, an 8–30-cm (3–12-in.) deep residual containing both liquids and solids remains on the floor of the tanks. Therefore, steam-jet pumps are lowered to the bottom of the tank for final tank cleaning. Figure 4 presents the dimensions and structure of a typical 300,000-gal tank. The 300,000-gal tanks are housed in concrete vaults approximately 13.7 m (45 ft) below grade level. The vaults have one of three different designs: (1) octagonal pillar-and-panel vaults (five tanks), (2) cast-in-place square vaults (four tanks), and (3) cast-in-place octagonal vaults (two tanks). Figure 5 depicts the different vault designs. Cooling coils on the floor and walls of eight of the tanks (WM-180, WM-182, WM-183, WM-185, and WM-187 through WM-190) provide heat transfer capabilities. Figure 6 is a photograph showing the cooling coils in Tank WM-185 during construction. The 30,000-gal tanks and 15-cm (6-in.) thick concrete vault roofs are covered with approximately 3 m (10 ft) of soil to provide radiological protection to workers and the public.
When the TFF was constructed, the 300,000-gal tanks were designed with flat bottoms. The concrete floors of the tank vaults were designed with sloped floors to promote drainage of any liquids toward the perimeter of the vaults for efficient removal. In order for the tank to rest on the sloped floor without causing unacceptable stresses in the tank, a leveling pad of sand was installed to support the tanks. The sandpad is 15 cm (6 in.) thick at the perimeter and 5 cm (2 in.) thick at the center. The exterior of the sandpad extends 15 cm (6 in.) beyond the outer edge of the tanks and is confined by a curb measuring 15 by 15 cm (6 by 6 in.). The volume of the sandpad is 23.39 m3.
Constructed in 1954, the four inactive 30,000-gal stainless steel belowgrade storage tanks (WM-103 through WM-106) sit on reinforced concrete pads. The tanks are horizontal cylinders approximately 3.5 m (11.5 ft) in diameter and 11.6 m (38 ft) in length. The 30,000-gal tanks do not have vaults. All four tanks contain stainless steel cooling coils to provide heat transfer capabilities. Three 15-cm (6-in.) diameter risers and one 8-cm (3-in.) diameter riser that reach to grade level provide tank access. Tank steam jets are provided for liquid waste removal (nominal flow rate of 50 gpm). These tanks were removed from service in February 1983.
Figure 7 is an artist’s representation of the eleven 300,000-gal tanks (WM-180 through WM-190) and the four 30,000-gal tanks (WM-103 through WM-106) to be included in the INTEC TFF closure. Liquid waste transfers to, from, and among the tanks are managed through a system of lines, valves, and diversion boxes. Waste transfer lines are contained within one of the following types of secondary encasements: split tile, carbon steel, stainless steel-lined concrete troughs, double-walled stainless steel pipes, or buried directly in concrete. Because of upgrades over the years, the pipe sections encased with the carbon steel and split tile have either been replaced or abandoned in place, except for two small (about 1.5-m [5-ft]) sections that are no longer used. The majority of the upgraded piping is contained in stainless steel-lined concrete trenches with the remainder in double-walled stainless steel piping. Double-walled stainless steel piping was used primarily in areas where single pipe runs were upgraded or where access did not allow lined trench installation. Liquid waste is routed through waste transfer valves located in belowgrade, stainless steel-lined concrete boxes (referred to as valve boxes). The waste transfer valves are operated manually using reach rods. The valve boxes are designed to provide access to the valves for inspection and maintenance.

11
Figure 4. Cross-sectional view of a typical tank with cooling coils.i
i. This schematic is labeled as typical because it shows a configuration for the 300,000-gal tanks in the TFF. Not all features of each type of tank are shown but features such as the cooling coils, risers, and sandpad are shown in this schematic.

12
OCTAGONAL VAULTPLAN VIEW
WM-180 & WM-181
PILLAR AND PANEL VAULTPLAN VIEW
WM-182 THROUGH WM-186
SQUARE VAULTPLAN VIEW
WM-187 THROUGH WM-190
SECTION A-ASECTION B-B SECTION C-C
Figure 5. Vault designs used at the INTEC TFF.

13
Figure 6. Photograph showing the internal structure and cooling coils of Tank WM-185 during construction.

14
INTEC TANK FARM CLOSUREINTEC TANK FARM CLOSURE
VES-WM-103
VES-WM-104 VES-WM-105
VES-WM-106
182 183185 186
187 189190
188
184181
180
Tank Farm Facility
Octagon Vaults: WM-180, WM-181Pillar and Panel Vaults: WM-182, WM-183, WM-184, WM-185, WM-186Square Vaults: WM-187, WM-188, WM-189, WM-190
GV99 0008
Figure 7. Artist’s depiction of tanks to be included in the INTEC TFF closure.

15
2.2 Origin and Management of TFF Wastes
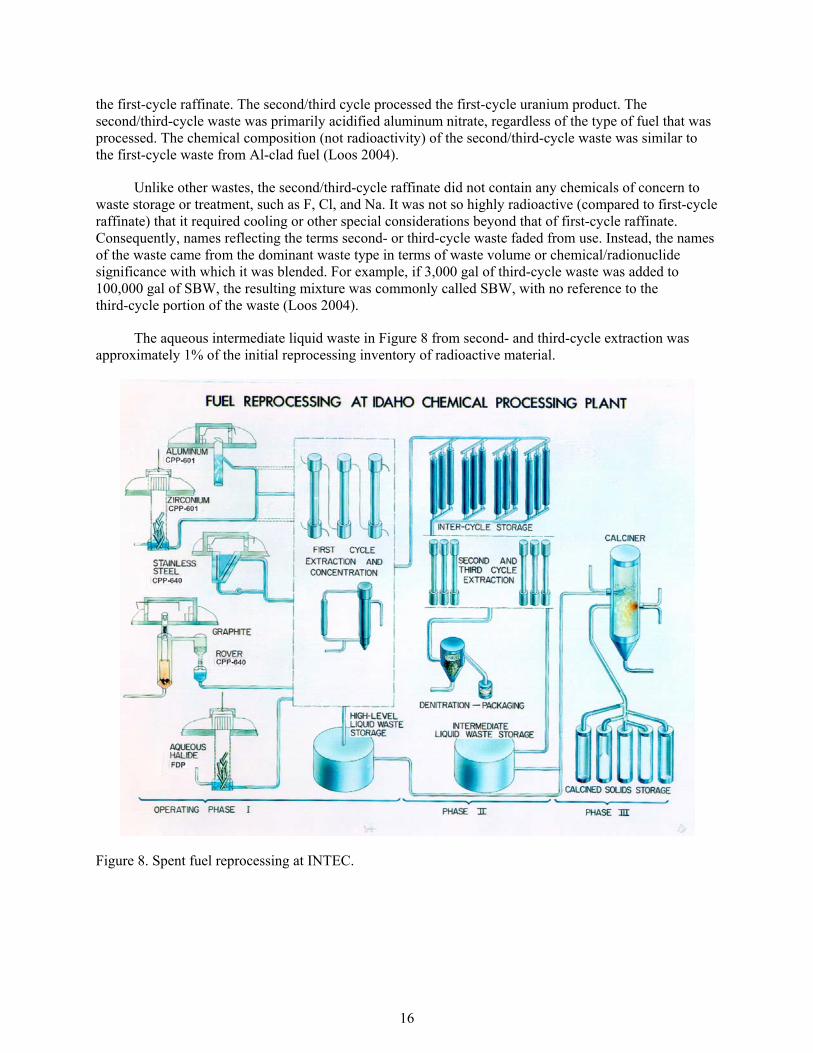
During reprocessing operations between 1953 and 1992, spent fuel was dissolved at INTEC using various processes, depending on the fuel type (see Figure 8).j Each dissolution process produced an acidic aqueous solution (any caustic dissolution processes were adjusted to be acidic before further treatment). The aqueous solution was processed through the first-cycle extraction system (Phase I in Figure 8) with an organic solvent (usually tributyl phosphate in kerosene). The extraction system used several contactors, including pulsed-plate columns and packed columns. The uranium was partitioned from the bulk of the fission products and placed in intercycle storage to await purification. The aqueous waste phase that contained greater than 99% of the radioactive material was the first-cycle extraction waste (Loos 2004), which was generally stored in the TFF in the belowgrade tanks equipped with cooling coils because of significant heat generation from the high radioactivity levels in the waste.
Typical of liquid-liquid extractions, the separated uranium contained some carryover radioactive material. After sufficient product accumulated in the intercycle storage, the uranium was processed through the second- and third-cycle extractions (Phase II in Figure 8), where the excess radioactive material was removed to produce a clean uranium product.k
The second and third fuel reprocessing steps (called the second and third cycles) generated the smallest volumes of waste of the five major waste sources. The second- and third-cycle processes were uranium purification steps and were very similar to each other. The second- and third-cycle processes operated together (in series) and were closely coupled. The second cycle purified the uranium product from the first-cycle process in a liquid extraction system. The second-cycle process produced a purified aqueous uranium product and a waste stream (second-cycle raffinate) containing radioactive contamination. The third cycle was an additional purification step that provided further purification of the second-cycle uranium product in a liquid extraction system, similar to that of the second cycle. The third-cycle process produced a further purified uranium product and a waste stream (third-cycle raffinate) containing radioactive contamination. Originally, the purified aqueous uranium product from the third-cycle process was shipped to Oak Ridge National Laboratory. Later, a plant modification provided a solidification process, the denitrator, to convert the aqueous uranium product into a solid granular form for shipment to Oak Ridge National Laboratory (Loos 2004).
The original SNF reprocessing system combined the second- and third-cycle wastes into a single waste stream for storage in the TFF, due to their similarity in chemical and radionuclide content. The combined second/third-cycle raffinate was stored separately from first-cycle waste in the TFF. The activity of the second/third-cycle waste was low enough that it did not require cooling. Consequently, second/third-cycle waste was originally stored in tanks without cooling capability (Loos 2004).
Unlike the first-cycle waste, the composition of the second/third-cycle waste varied little with the type of fuel being processed. Chemicals unique to various first-cycle wastes that came from the fuel dissolution process, such as Zr, F, Cd, and Hg, were separated from the uranium product and went with
j. Four fuel types were reprocessed during INTEC operations: Al-clad fuel, Zr-clad fuel, stainless steel-clad fuel, and graphite matrix fuel. The dissolution processes varied by fuel type: nitric acid was used for Al-clad fuel, hydrofluoric acid was used for Zr-clad fuel, sulfuric acid/nitric acid and electrolytic/nitric acid were used for stainless steel-clad fuel, and graphite matrix fuel was burned and the ash dissolved in hydrofluoric acid (Loos 2004).
k. The second- and third-cycle extractions were liquid extraction systems that operated in series to provide uranium purification of the first-cycle extraction uranium product. Because they operated on concentrated feed, solutions compared to first-, second-, and third-cycle extractions produced less waste per gallon of feed. The radioactivity level of the second- and third-cycle waste stream was approximately 1,000 times less than that of the first-cycle waste (Loos 2004).
16
the first-cycle raffinate. The second/third cycle processed the first-cycle uranium product. The second/third-cycle waste was primarily acidified aluminum nitrate, regardless of the type of fuel that was processed. The chemical composition (not radioactivity) of the second/third-cycle waste was similar to the first-cycle waste from Al-clad fuel (Loos 2004).
Unlike other wastes, the second/third-cycle raffinate did not contain any chemicals of concern to waste storage or treatment, such as F, Cl, and Na. It was not so highly radioactive (compared to first-cycle raffinate) that it required cooling or other special considerations beyond that of first-cycle raffinate. Consequently, names reflecting the terms second- or third-cycle waste faded from use. Instead, the names of the waste came from the dominant waste type in terms of waste volume or chemical/radionuclide significance with which it was blended. For example, if 3,000 gal of third-cycle waste was added to 100,000 gal of SBW, the resulting mixture was commonly called SBW, with no reference to the third-cycle portion of the waste (Loos 2004).
The aqueous intermediate liquid waste in Figure 8 from second- and third-cycle extraction was approximately 1% of the initial reprocessing inventory of radioactive material.
Figure 8. Spent fuel reprocessing at INTEC.

17
Much of the INTEC reprocessing equipment was designed for contact maintenance rather than remote maintenance. Because INTEC personnel had to access equipment for maintenance purposes frequently, efforts to decontaminate plant areas and equipment to lower radiation fields and allow safe working conditions generated large amounts of decontamination wastes, which were concentrated by evaporation and sent to the TFF. As of November 2003, the remaining TFF inventory contained (by volume) 1% first-cycle waste, 2% second-cycle waste, and 4% third-cycle waste. The remaining waste is composed of decontamination wastes and bottoms from the evaporatorl (Loos 2004).
In general, TFF wastes were managed by segregating the first-cycle solvent extraction waste from other reprocessing wastes because of significantly higher radioactivity levels in the first-cycle waste. The DOE decided not to neutralize waste or combine the first-cycle extraction wastes with other reprocessing wastes, as was the standard practice at other DOE facilities (Knecht et al. 1997). Instead, INTEC maintained the waste in its original acidic form using the 300,000- and 30,000-gal stainless steel storage tanks and physically segregated first-cycle extraction wastes. This decision reduced the volume of liquid waste requiring storage.
Waste volume was reduced further by stabilizing the first-cycle solvent extraction waste and most of the second- and third-cycle extraction wastes through calcination. Calcine results from heating a substance to a high temperature that is below its melting or fusing point. At the INL Site, calcination was carried out in the calciner in the New Waste Calcining Facility where liquid HLW and mixed transuranic waste/SBW are converted into the granular solid known as calcine. The liquid waste is drawn from TFF and sprayed into a vessel containing an air-fluidized bed of granular solids. The bed is heated by combustion of a mixture of kerosene and oxygen. All of the liquid evaporates, while radioactive fission products adhere to the granular bed material in the vessel. The gases from the reaction vessel (called off-gases) are processed in the off-gas cleanup system before they are released to the environment. Calcination reduces the volume of the radioactive liquid waste (usually two to ten times), so less storage space is needed. The final waste form is a dense powder similar in consistency to powdered detergent. These calcined solids are transferred to the Calcined Solids Storage Facilities, commonly referred to as bin sets. The bin sets are a series of concrete vaults, each containing three to seven stainless steel storage bins (DOE 2002).
Calcined waste is not part of this 3116 Basis Document. The New Waste Calcining Facility, the evaporators, the reprocessing facility, or other nearby facilities are also not included in this 3116 Basis Document.
By evaporating and calcining, and not neutralizing, the liquid radioactive waste, INTEC avoided the construction of up to 195 additional 300,000-gal storage tanks (Knecht et al. 1997). The solidified (calcined) reprocessing waste was transferred to stainless steel bins for storage. By February 1998, the liquid first-cycle extraction waste was removed from the TFF. Only small (1,000–15,000 gal) heels in eight of the eleven 300,000-gal storage tanks remained, which could not be removed with existing equipment. Reuse of the first-cycle waste storage tanks to store SBW has resulted in the mingling of the first-cycle waste heels with SBW.
l. Evaporators have been used at INTEC to reduce the volumes of radioactive waste. Bottoms are the concentrated material remaining after the liquid portion of the waste is evaporated.

18
Between 2002 and 2005, TFF tank contents were evaporated to less than one million gallons and consolidated into three 300,000-gal tanks. This SBW remains in storage in Tanks WM-187, WM-188, and WM-189. The current SBW inventory is a mixture of wastes from various sources, including:
• Decontamination solutions from past spent fuel reprocessing maintenance activitiesm
• Solids and liquids from the bottom of the TFF tanks, which include some first-cycle wasten
• Liquid wastes from ongoing maintenance and closure activities at INTEC
• Second- and third-cycle spent fuel reprocessing extraction wastes.
The DOE is pursuing methods for treating and disposing the remaining SBW, and the three tanks storing SBW will be emptied during the treatment process. Tank heels will be removed as part of closure activities, and they will be treated with the bulk SBW. It is planned to have the treatment of the SBW completed by 2012. As explained previously, the treated SBW is not part of this 3116 Determination.
Each of the eleven 300,000-gal tanks in the INTEC TFF has a slightly different configuration, waste storage, and processing history (INEEL 1999a, 2000a). The following is a history of the TFF tanks, including the sources of the solid and liquid residuals in the tank heel, and a description of the tank contents and level as of April 30, 2005. Liquid levels in the cleaned tanks (WM-180 through WM-186) are not the levels that will remain at closure. The liquid after sampling is left at a depth of approximately 13 cm (5 in.) to avoid the tank drying prior to grouting and creating potential airborne contamination problems during the grouting operations. The liquid will be removed to approximately 3 cm (1 in.) prior to the addition of grout during stabilization operations. The liquid that will be removed will be sent to the SBW treatment system or to operational tanks.
The steam jets have been lowered to 0.97 cm (0.38 in.); therefore, based on steam jet performance, it is conservative to assume that the tank liquid will be lowered to a 3-cm (1-in.) depth (Portage 2005a, 2005b, 2005c, 2005d, 2005e, 2005f, 2006a). The levels shown in the tank descriptions below are the tank levels at the time the samples were collected after tank cleaning. After the liquid level is reduced using the steam jets, additional liquid will be removed by the grout placements. No credit is taken in the PA and in this 3116 Basis Document for liquid removed during grout placements,o which constitutes approximately 3 Ci (per tank), as identified in Table 1. Details of the grout composition are shown in m. Typical decontamination cycles from reprocessing fuels consisted of a strong caustic solution to break down the resistant oxide layer, followed by corrosive and/or chelating agents to expose base metal and contaminants. The cycle was completed with a 6-M nitric acid flush to restore the oxide layer (INEEL 2002a).
n. Particle size distribution analysis and settling rate testing of the WM-182 and WM-183 TFF heel slurry samples (samples were collected prior to tank cleaning) were performed. The conclusions and recommendations based on the results of this work follow that provide insight into the properties of the solid residual, which include the following (INEEL 2000b):
• The overall results for the standards testing were satisfactory and demonstrated excellent repeatability and acceptable accuracy during the actual TFF sample testing.
• Particle size distribution analysis showed that for both the WM-182 and WM-183 samples, the particles range approximately from a minimum of 0.5 μm to a maximum of 230 μm, with about 90% volume between approximately 2 and 133 μm. The results of the particle size determination for samples from WM-182 and WM-183 are quite similar considering the minute quantities used from the two separate vessels to obtain these results.
• Settling rate testing results were fairly consistent in that it appears that most of the mass of solids settle to an easily redispersed layer.
o. As discussed later in this 3116 Basis Document, DOE has considered the NRC and State of Idaho’s observations in this regard.

19
Appendix C. Information about the grout sequence and the engineering grout pour are included in Section 6. The solid residuals exist as fine particles. (All tanks contain cooling coils unless otherwise noted.) Figure 9 summarizes the tanks’ volumes as of April 30, 2005.
• Tank WM-180—This tank was placed into service in 1954 and was used to store Al fuel reprocessing wastes. The majority of the first-cycle extraction process waste was calcined in 1966–1967. Since 1972, the tank has been used solely to store SBW. The tank is housed in an octagonal, poured-in-place reinforced concrete vault. This tank does not have an underlying sandpad. On November 30, 2003, WM-180 was in service and contained 276,000 gal of waste. The waste was primarily Process Equipment Waste Evaporator (PEWE) bottoms with small amounts of second- and third-cycle raffinate. The tank was emptied to its heel in 2004 and the waste transferred to the evaporator or to WM-187 (Loos 2004). Tank cleaning operations were completed in October 2004. As of April 30, 2005, Tank WM-180 contains 7,600 gal of liquid after tank cleaning operations and an estimated 540 kg of solid residual (Portage 2005a). The remaining liquid is water from tank cleaning. Prior to grouting, the remaining liquid volume will be removed to a 3-cm (1-in.) depth or approximately 1,300 gal. The estimated inventory at closure for Tank WM-180 is approximately 1,047 Ci (Portage 2005a).
• Tank WM-181—This tank was placed into service in 1953 and was used only to store SBW. The tank is housed in an octagonal, poured-in-place reinforced concrete vault. This tank does not contain cooling coils or have an underlying sandpad. Tank WM-181 was “emptied” of waste (the volume in the tank was reduced to its heel, using the installed waste transfer equipment) in November 2001. On November 30, 2003, Tank WM-181 contained 22,800 gal of waste. The waste was primarily PEWE bottoms from Tank WL-101 and “other” waste with a small amount of third-cycle raffinate. The tank was never used for storage of first-cycle raffinate (Loos 2004). Tank cleaning operations were completed in May 2004. As of April 30, 2005, Tank WM-181 contains 7,300 gal of liquid after tank cleaning operations and an estimated 250 kg of solid residual (Portage 2006a). The remaining liquid is water from tank cleaning. Prior to grouting, the remaining liquid volume will be removed to a 3-cm (1-in.) depth or approximately 1,300 gal. The estimated inventory at closure for Tank WM-181 is approximately 475 Ci (Portage 2006a).
• Tank WM-182—This tank was placed into service in 1956 and was used to store Al and Zr fuel reprocessing wastes. The tank was emptied to heel level in 1993 and has since been flushed with small quantities (about 10,000 gal) of SBW. The tank is housed in an octagonal, pillar-and-panel concrete vault. Between December 1996 and June 1999, two transfers of waste were made (15,100 gal total) out of the tank. These transfers removed the liquid to heel level. Tank inspection began in 1999. Tank cleaning was completed in September 2002. As of April 30, 2005, Tank WM-182 contains 6,500 gal of liquid after tank cleaning operations and an estimated 1,240 kg of solid residual (Portage 2005b). The remaining liquid is water from tank cleaning. Prior to grouting, the remaining liquid volume will be removed to a 3-cm (1-in.) depth or approximately 1,300 gal. The estimated inventory at closure for Tank WM-182 is approximately 2,393 Ci (Portage 2005b).
• Tank WM-183—This tank was placed into service in 1958 and was used to store Al and stainless steel fuel reprocessing wastes. The first-cycle extraction process waste was transferred from the tank in 1981, and the tank was refilled with various types of SBW. The tank is housed in an octagonal, pillar-and-panel concrete vault. Between February 1997 and June 1999, 16,000 gal of low-activity waste was sent to WM-183. The accumulated waste in WM-183 was transferred to WM-187 in December 1999, leaving a heel of about 13,000 gal. Tank cleaning was completed in March 2003. As of April 30, 2005, Tank WM-183 contains 8,000 gal of liquid after tank cleaning operations and an estimated 700 kg of solid residual (Portage 2005c). The remaining liquid is water from tank cleaning. Prior to grouting, the remaining liquid volume will be removed to a 3-cm

20
(1-in.) depth or approximately 1,300 gal. The estimated inventory at closure for Tank WM-183 is approximately 1,360 Ci (Portage 2005c).
In 2004, while consolidating SBW to Tank WM-187 from Tank WM-180, it was noticed that the liquid level of Tank WM-183 had increased. Upon further investigation it was determined that approximately 200 gal of SBW and water had leaked into the tank during transfers of WM-180 waste to the evaporator tank system, then to WM-187 during the period between July and October 2004. The leakage was determined to have been through an improper valve setting. The isolation of the tank has been confirmed. The tank has been re-cleaned and sampled. Visual inspection of the tank indicates that the 200 gal of waste that leaked into the tank has been removed and no additional solids are present in the tank. Data collected were consistent with prior sampling of this tank (ICP 2006a). These new data did not change the results or conclusions presented in this 3116 Basis Document.
• Tank WM-184—This tank was placed into service in 1958 and was used only to store SBW. The tank is housed in an octagonal, pillar-and-panel concrete vault. This tank does not contain cooling coils. Between May and December 2001, WM-184 was emptied to a heel volume of 5,100 gal. After this time, no new wastes were added to the tank. Tank cleaning was completed in December 2003. As of April 30, 2005, Tank WM-184 contains 3,100 gal of liquid after tank cleaning operations and an estimated 560 kg of solid residual (Portage 2005d). The remaining liquid is water from tank cleaning. Prior to grouting, the remaining liquid volume will be removed to a 3-cm (1-in.) depth or approximately 1,300 gal. The estimated inventory at closure for Tank WM-184 is approximately 1,077 Ci (Portage 2005d).
• Tank WM-185—This tank was placed into service in 1959 and was used to store Al and Zr fuel reprocessing wastes. The first-cycle extraction process waste was calcined in 1983, and the tank was refilled with SBW. The tank is housed in an octagonal, pillar-and-panel concrete vault. The waste was removed from WM-185 in January 2002, leaving a heel of about 13,000 gal of waste in the tank. Tank cleaning operations were completed in October 2003. As of April 30, 2005, Tank WM-185 contains 5,800 gal of liquid after tank cleaning operations and an estimated 720 kg of solid residual (Portage 2005e). The remaining liquid is water from tank cleaning. Prior to grouting, the remaining liquid volume will be removed to a 3-cm (1-in.) depth or approximately 1,300 gal. The estimated inventory at closure for Tank WM-185 is approximately 1,391 Ci (Portage 2005e).
• Tank WM-186—This tank was placed into service in 1962 and was used to store Al fuel reprocessing waste. The first-cycle extraction process waste was transferred from the tank in 1967, after which the tank was used solely to store SBW. The tank is housed in an octagonal, pillar-and-panel concrete vault. This tank does not contain cooling coils. In May 2001, the tank was emptied to a heel of 20,300 gal. Tank cleaning operations were completed in November 2003. As of April 30, 2005, Tank WM-186 contains 6,600 gal of liquid after tank cleaning operations and an estimated 340 kg of solid residual (Portage 2005f). The remaining liquid is water from tank cleaning. Prior to grouting, the remaining liquid volume will be removed to a 3-cm (1-in.) depth or approximately 1,300 gal. The estimated inventory at closure for Tank WM-186 is approximately 646 Ci (Portage 2005f).
• Tank WM-187—Placed into service in 1959, Tank WM-187 was used to store Al and Zr fuel reprocessing wastes. The first-cycle extraction process waste was calcined between 1990 and 1993, and then SBW was added to the heel. The tank is housed in a square, reinforced-concrete vault. This tank is being used to collect SBW solutions from other TFF tanks undergoing cleaning activities prior to final closure (Loos 2004). As of April 30, 2005, Tank WM-187 contains 271,500 gal of liquid, which was transferred from cleaned tanks (ICP 2005a). This tank will be

21
cleaned to remove highly radioactive radionuclides to the maximum extent practical and is expected to meet the other criteria in Section 3116(a) of the NDAA.
• Tank WM-188—This tank was placed into service in 1959 and was used to store Al and Zr fuel reprocessing wastes. The tank was emptied to heel level when the waste was calcined in 1998. The tank is housed in a square, reinforced-concrete vault (Loos 2004). As of April 30, 2005, Tank WM-188 contains 282,600 gal of liquid that is primarily SBW (ICP 2005a). This tank will be cleaned to remove highly radioactive radionuclides to the maximum extent practical and is expected to meet the other criteria in Section 3116(a) of the NDAA.
• Tank WM-189—Placed into service in 1966, Tank WM-189 was used to store Zr fuel reprocessing wastes. The first-cycle extraction process waste was emptied to heel level in 1996. Since then, the tank has been used to store a variety of SBW solutions from continuing operations (high-fluoride decontamination wastes, bottoms from the evaporator tank system, and other SBW). The tank is housed in a square reinforced concrete vault (Loos 2004). As of April 30, 2005, Tank WM-189 contains 282,300 gal of liquid that is primarily SBW (ICP 2005a). This tank will be cleaned to remove highly radioactive radionuclides to the maximum extent practical and is expected to meet the other criteria in Section 3116(a) of the NDAA.
• Tank WM-190—Tank WM-190 was designated as a spare tank for use in emergencies and was never placed into service. This tank was never used to store any waste, including first-cycle extraction process waste, although the tank has been contaminated with this waste. By 1980, approximately 7,000 gal of liquid had accumulated in the tank from two sources: (1) rainwater that collected in the vault sump was jetted into the tank and (2) a small quantity (less than 50 gal total) of first-cycle extraction process waste was passed inadvertently through the transfer valve. The transfer valve was opened slightly and closed (to confirm valve closure) prior to starting waste transfers to tanks that shared a common transfer line (Loos 2004). (Waste from the last transfer would collect above the valve.) In 1982, the tank contents were transferred using a specially designed sump pump, which left approximately 500 gal of liquid in the tank as of April 30, 2005 (ICP 2005a). This tank will be cleaned to remove highly radioactive radionuclides to the maximum extent practical and is expected to meet the other criteria in Section 3116(a) of the NDAA.

22
Figure 9. Volumes in TFF 300,000-gal tanks as of April 30, 2005 (ICP 2005a).p
The four 30,000-gal tanks (WM-103 through WM-106) were placed into service in 1956 and were used primarily (the tanks held injection well waste and process evaporator condensate for a short period in 1983 and all of the 30,000-gal tanks held steam valve condensate after 1990) for first-cycle extraction process waste from stainless steel and Zr fuel reprocessing. Each of the tanks were emptied to heel level (8–13 cm [3–5 in.] in the tank bottom, approximately 1,000 gal per tank)q in 1974 and flushed with water. They remained at heel level until 1982, when they were used to store condensate liquid (not first-cycle process wastes) from the PEWE for 5 months, after which they were emptied again to heel level and taken out of service in February 1983.r The waste inlets to these tanks were subsequently cut and capped;
p. Tanks WM-187, WM-188, and WM-189 continue to be used for interim storage of INTEC wastes. As such, these volumes fluctuate over time as wastes are transferred into or out of these tanks.
q. Jacobson, V. L., INEEL, Memo to File: “Discussion on WM-103 through -106 with Frank Ward, BBWI Operations Engineering,” September 26, 2001.
r. The PEWE treats diluted, low-activity waste by boiling the waste, and condensing and collecting the vapors. The PEWE splits the waste into two streams. One stream is a small volume of concentrated liquid that contains most of the chemical and radioactive constituents that are originally in the PEWE feed. The concentrated waste stream is called the “bottoms.” Typically, the PEWE generates 1–2 gal of bottoms from every 100 gal of feed, concentrating the waste feed by a factor of 50–100. The second waste stream is the condensed vapor that left the PEWE. This stream is called “process condensate,” which is a large volume of waste that contained 98–99 gal of every 100 gal of PEWE feed solution. Most of the chemical and radioactive constituents in the PEWE feed (such as Al, Zr, 137Cs, and 90Sr) are nonvolatile and concentrated in the evaporator bottoms. As a result, the PEWE condensate is relatively clean water, containing only trace quantities of most chemicals and radionuclides (Loos 2004).

23
however, the outlets remained operational to permit tank decontamination activities to occur. In 1990, the 30,000-gal tank heels were sampled and analyzed. The results indicated a small amount of radioactivity (the 137Cs concentrations ranged from 1.20E–07 to 1.10E–05 Ci/L) (DOE-ID 2003b). Then the tanks were each flushed with 12,000 gal of water and emptied to their heels (DOE Idaho 2004a).
In April 2004, the 30,000-gal tanks were cleaned by flushing each tank with 3,000–5,000 gal of water and flushing the piping three times. (The length of pipe being cleaned is flushed with three volumes of water. The volume of water used is equal to the volume of the length of pipe.) The tanks were inspected after flushing and the samples were analyzed to determine the concentrations of residual radionuclides. A conservative estimate of the solid residual was made based on the presence of a film layer in the lower half of the tank. Approximately 19 kg of waste residual remain in each tank is estimated based on video inspection and sampling and analysis (Portage 2006b). Each 30,000-gal tank has an estimated inventory at closure of approximately 36 Ci.
2.3 Tank Farm Facility Closure Activities and Status
The DOE is closing the TFF tanks in response to a January 1990 Notice of Noncompliance and subsequent Consent Order (State of Idaho et al. 1992). The Idaho Department of Health and Welfares and EPA issued the Notice of Noncompliance to the DOE because the tanks in the TFF did not meet the secondary containment requirements as set forth by Idaho Administrative Procedures Act (IDAPA) 58.01.05.009 (40 CFR 265.193). The resulting 1992 Consent Order (and subsequent modifications) (State of Idaho et al. 1992, 1994, 1998, 1999) required the DOE to permanently cease uset of the five 300,000-gal tanks that are contained in five pillar-and-panel vaults by June 30, 2003. The Consent Order also required the DOE to permanently cease use of the remaining 300,000-gal tanks by December 31, 2012, or bring the tanks into compliance with secondary containment requirements. The DOE decided to close the TFF tanks because radiation fields would make compliance with secondary containment requirements impractical, and because the DOE did not anticipate a need for such storage after 2012. (Compliance is impractical because the radiation fields in the tank vault would prevent practical entrance by personnel to add equipment or upgrades to the vaults to meet the secondary containment requirements [DOE 2002].)
In addition, in October 1995, the State of Idaho, the Department of the Navy, and the DOE settled the cases of Public Service Co. of Colorado v. Batt, No. CV 91-0035-S-EJL (D.Id.) and United States v. Batt, No. CV-91-0065-S-EJL (D.Id.) (State of Idaho et al. 1995). Among other things, the resultant settlement agreement required the DOE to complete the process of calcining all remaining non-sodium-bearing liquid HLW by June 30, 1998, and to remove SBW from the INTEC TFF tanks by December 31, 2012. In accordance with this settlement agreement, the DOE completed the removal of first-cycle extraction waste from the TFF tanks to heelu level in February 1998. The tanks were then used to store additional SBW. The DOE has evaluated options for waste treatment and INTEC facility disposition. This evaluation is discussed in the Idaho High-Level Waste and Facilities Disposition Final Environmental Impact Statement (EIS) (DOE 2002). DOE issued the Record of Decision for the Idaho High-Level Waste s. On July 1, 2000, the Division of Environmental Quality, a division within the Idaho Department of Health and Welfare, was elevated to the State of Idaho Department of Environmental Quality (DEQ). This department now oversees the implementation of the Consent Order.
t. “Cease use” means to empty the tanks down to their heels (i.e., the liquid level remaining in each tank after lowering to the greatest extent possible by use of existing transfer equipment). Closure plans developed for these tanks will address the remaining heel and vaults and the use of these tanks and equipment for closure, including any flushing or other cleaning of the tanks (State of Idaho 1998).
u. “Tank heel” means the liquid level remaining in each tank after lowering the level to the greatest extent possible by using existing transfer equipment, such as steam jets.

24
and Facilities Disposition Final Environmental Impact Statement on December 19, 2005 (70 FR 75165), in which DOE decided, among other things, to select steam reforming as a treatment technology for the SBW and pursue a phased decision-making process by issuing an amended Record of Decision (ROD) in 2006. The initial 2005 ROD stated that this amended ROD would specifically address closure of the TFF in coordination with the Secretary of Energy’s Determination pursuant to Section 3116. Therefore, in a separate decision document, the DOE is amending its initial ROD and is addressing closure of the TFF in coordination with the Secretary’s Determination under Section 3116.
The TFF is being closed in accordance with DOE requirements as a radioactive waste storage facility, and with HWMA/RCRA requirements for closure of an interim status HWMA/RCRA tank system. These requirements include preparing several documents. The documents describe DOE’s actions to close tanks and meet closure objectives. The DOE requires closure plans, a PA, and a composite analysis to address radioactive constituents. To meet HWMA/RCRA requirements, closure plans and sampling and analysis plans (SAPs) addressing the hazardous waste constituents are required.
The following major documents have been prepared for the TFF closurev,w:
• Deactivated HLW facility DOE Tier 1 closure plan (DOE-ID 2006a)—Developed in accordance with DOE Order 435.1 (2001) requirements and guidance, this plan defines the approach and plans for TFF closure and includes a PA (DOE-ID 2003b) and a composite analysis (DOE-ID 2006b). The PA documents the projected radiological dose impacts associated with TFF closure to meet the requirements of 10 CFR 61, Subpart C, “Performance Objectives.” The composite analysis is a planning tool that provides a reasonable expectation that the proposed closure activities will not result in the need for future corrective or remedial actions to ensure protection of the public and environment. This analysis shows that radiation doses to members of the public through the groundwater pathway at the INL Site boundary are protective of human health. Prior to grouting activities, DOE plans to finalize the Tier I plan in accordance with DOE Order 435.1.
• HWMA/RCRA closure plans (DOE-ID 2003a, 2003c, 2003d, 2004a; DOE Idaho 2004a, 2004b) and associated SAPs (ICP 2004a, 2004b; INEEL 2001, 2002b, 2003). Section 8 addresses the approval status of these HWMA/RCRA closure plans.
In general, the closure process includes removing the SBW for treatment then closing the tanks to meet RCRA and Section 3116 criteria. The TFF tank system’s closure process includes waste removal; cleaning of the tanks, piping, and ancillary equipment (to remove waste to the maximum extent practical);
v. Following closure to these HWMA/RCRA requirements and DOE Orders, decisions and actions regarding final capping (including capping of the TFF tanks), monitoring, and long-term maintenance of the site will be conducted as part of the CERCLA program. Although not part of this document or affected by Section 3116, DOE’s Proposed Plan for Tank Farm Soil and Groundwater at the Idaho Nuclear Technology and Engineering Center, Operable Unit 3-14 (ICP 2006k), which includes capping the surface of the TFF, has been issued for public comment pursuant to CERCLA. The CERCLA ROD and decision is planned for 2007. Capping will reduce water infiltration and provide worker protection where appropriate.
w. In December 2002, the DOE prepared a draft waste determination for the TFF (“Idaho Nuclear Technology and Engineering Center Tank Farm Facility Residuals–Waste-Incidental-to-Reprocessing Determination Report,” DOE-ID-10777, Draft Rev. B, December 2002) to demonstrate that the residuals in the TFF tanks met the DOE’s requirements (DOE M 435.1-1, 2001) for managing the waste as LLW and submitted the draft document and the PA (DOE-ID 2003b) to the NRC for review. In general, the NRC found that the DOE demonstrated that the waste meets DOE’s and NRC’s waste determination guidance to manage the waste as LLW. The NRC also concluded that the DOE’s determination that the residuals from tank closure activities can be managed as LLW “has sound technical assumptions, analysis, and conclusions with regard to protecting public health and safety, and the environment” (NRC 2003a). However, with the enactment of Section 3116 of the NDAA, the DOE did not issue a final waste incidental to reprocessing determination.

25
and stabilizationx of the tank configuration and ancillary equipment. To complete SBW removal, remaining liquid and solid waste residue will be removed to the maximum extent practical from the tanks and ancillary equipment. Following waste removal from the tanks and TFF cleaning activities, confirmatory sampling and analysis will be performed to assess the decontamination effectiveness and for waste characterization. (As discussed below, this sampling and analysis has already been performed for the tanks and ancillary equipment that have been cleaned as of May 2005.)
Some residuals that cannot be removed by the cleaning process or other technically practical means will remain. The residuals will be sampled and analyzed to determine the concentrations of radionuclide and hazardous constituents remaining in the tanks. As each TFF component is cleaned and analytical data show that performance objectives are expected to be met, the DOE plans to stabilize each of the applicable TFF components by filling them with grout. Process lines will be decontaminated and capped, and all lines (including process lines) that provide a pathway to the tanks will be grouted and capped (Appendix C; DOE-ID 2006a).
This 3116 Basis Document includes the evaluation of all TFF equipment and structures that are potentially contaminated with reprocessing wastes as a result of past INTEC reprocessing operations. These structures, systems, and components will be isolated and grouted as a part of the INTEC TFF final closure and include the stainless steel tanks, concrete vaults, sandpads, piping, encasements, valve boxes, and instrumentation lines. The TFF tank cleaning operations began in 2002 for those tanks emptied of SBW. Closure of the INTEC TFF is being conducted in phases to support continued INTEC operations.y As of May 2005, Tanks WM-180 through WM-186 and WM-103 through WM-106 have been cleaned along with the ancillary equipment of each tank. No additional cleaning has been performed since that time. Samples have been collected from the tanks and ancillary equipment, and the results have been reported in data quality assessment (DQA) reports (ICP 2006b, 2006c, 2006d, 2006e, 2006f, 2006g, 2006h, 2006i 2006j; INEEL 2006a, 2006b). Waste liquids and solids removed and generated during tank closure activities are being collected for final treatment and disposal.
2.3.1 Cleaning Approach for Stainless Steel Tanks and Vaults
A tank cleaning system comprising a washball, directional nozzle, and modified steam-jet pumping system has been developed and used successfully thus far in the TFF tank cleaning operations. Figure 10 illustrates this cleaning system. During washball and directional nozzle operations, the steam-jet ejectors are operated to remove the waste-containing slurry from the tank. The goal of tank cleaning is to remove as much waste as practical. During this operation, radiation levels are monitored on the steam-jet transport line as an indication of cleaning effectiveness. Monitoring the radiation levels near the transport line provides the cleaning system operators and project manager an indication of when continued tank cleaning ceases to be effective. When radiation levels decrease to the lowest value and remain constant, cleaning is stopped and the tanks are inspected. If visual inspection via a remote-controlled camera confirms that the tank has been cleaned to the extent practical, then samples are collected and analyzed to x. Waste stabilization is intended to minimize radiation exposures to the public caused by leaching of radionuclides and chemicals out of the waste form and by intrusion into the waste. Stability limits exposures to an inadvertent intruder by providing greater assurance that the waste form will remain recognizable and nondispersible.
y. INTEC operations include management of SBW and newly generated liquid waste. Also included are the evaporator tank system and the PEWE (the PEWE is not part of this 3116 Basis Document). Some of the newly generated liquid waste is the water from tank cleaning operations. This liquid is sent to Tank WM-187 through existing process piping and valve boxes. Additionally, these lines and valve boxes are used to transfer the liquid to the PEWE. A phased approach to cleaning was used at TFF because the transfer of liquid waste was necessary, closure of tanks and associated piping had to be scheduled to allow liquids to be transferred from a tank being cleaned yet not restrict operations such that another tank cannot be cleaned, or valves and piping that allow waste to be transferred to the PEWE are not closed prematurely.

26
verify performance objectives are met. During the visual inspection, residual solid waste depths are estimated by comparing the solids depths to benchmarks within the tanks such as cooling coil support brackets and associated welds. For example, in tanks with cooling coils, the bottom weld and stainless steel bracket thickness measures 0.97 cm (0.38 in.). Knowing this thickness, the depth of waste next to these brackets can be estimated. A reflection from the stainless steel at the tank bottom indicates that no solids are present (Portage 2005a, 2005b, 2005c, 2005d, 2005e, 2005f, 2006a). The radiation monitor allows tank cleaning to proceed without repeated visual inspection or sample collection and aids in ensuring that as much waste as practical is removed from the tanks (Kimmitt 2002). Samples of the residual are collected with small positive-displacement pumps. Submersible pumps are lowered into the bottom of tanks or vaults through risers. The pump is activated and liquid and solids are pumped to sample containers on the surface. The submersible pump can only reach the residual directly beneath the riser through which it is lowered. However, because the residual will be agitated before sampling, it is reasonable to assume that the liquid in the tank is homogeneous and the flocculent solids may be in suspension.
Figure 10. Typical tank cleaning system.
Prior to its implementation, the TFF tank cleaning system was tested in a full-scale mockup tank (INEEL 1999b) using simulated waste (EDF-015722-041, 2000). The system demonstrated effectiveness in subsequent tank cleaning. The washball/directional nozzle tank cleaning system and the modified steam-jet pumping system were used to slurry the solid and liquid wastes and remove them from the tanks. Steam jets were modified by cutting the steam supply and discharge lines and installing a new steam jet lower in the tank. During cleaning system development, the INL Site and the Tanks Focus Area (TFA) performed a review of tank cleaning technologies. The DOE formed the TFA to address all aspects of remediating radioactive wastes from underground storage tanks DOE-wide, including tank cleaning technology. The TFA review is described in a report prepared by the Pacific Northwest National Laboratory (PNNL 2001). This review focused not only on the technical feasibility and appropriateness of the approach selected by the INL Site but also on technology gaps that could be addressed by using technologies or performance data available at other DOE sites and in the private sector. The review supported the design and implementation of the INL Site cleaning system. As a result of this development and testing work, the cleaning system (washball, directional nozzle, and modified steam-jet pumping

27
system) has performed beyond expectations as demonstrated by a comparison of the total post-decontamination inventories estimated in the PA and calculated for WM-182, as presented in Appendix A.
The tank vaults are cleaned by iterative flushing with water. The water is removed using the existing steam jets. Access to the vaults is limited and initial radionuclide inventories are considerably less than the tanks (DOE-ID 2003b); therefore, flushing is a practical and effective cleaning method. Process piping in the TFF is cleaned by triple flushing, which consists of flushing three piping system volumes through the system with a pressure equal to previous waste transfers to ensure that the pipe area contacted by waste has been contacted by water and rinsed during the flushing operations; this method has been shown to be effective based on analytical data.z The acidic nature of the waste and the procedures that required flushing with water after waste transfers during operations limited accumulation of residual in piping that needed to be removed.
The vaults provide secondary containment for tank leakage. The tanks have not leaked during the life of the TFF. The contamination in the vaults for Tanks WM-185 and WM-187 (which resulted from back-siphoning events as discussed in Subsection 2.4.4) is considered in the PA. In all tank vaults, rainwater/snowmelt in-leakage through the vault roof has been pumped periodically from the vault sumps to waste tanks.
Tank residuals remaining after cleaning and before grouting consist of a relatively small amount of solids (see Subsection 2.2) and contaminated flush water. Extensive mockup testing shows that most of the remaining flush water and some solids will be removed during the grouting process for stabilizing the residuals. This action will be accomplished by using the grout to push and corral the residuals toward the removal equipment (jet pumps). Any remaining residual liquid will be stabilized with a grout material. z. Analysis of residual metal contamination in process waste piping was performed in 2002. The estimate of residual radionuclide inventory in piping is based on this sampling and analysis. The Sampling and Analysis Plan for the Post-Decontamination Characterization of the Process Waste Lines from INTEC Tank Farm Facility Tanks WM-182 and WM-183 (INEEL 2001) was prepared to define the steps to collect data that represent residual in piping. The process waste lines in the WM-182 and WM-183 tank systems have carried acidic waste in solution and have routinely been flushed after waste transfer with either acid or an acid and water flush. During closure of the tank systems, the piping was triple rinsed with water to remove loose residuals. Sections of horizontal and vertical process waste line have been removed from Tank WM-182. Samples from the decontaminated process waste lines will be collected and the data will be used to represent the effectiveness of triple rinsing all of the lines remaining in the WM-182 and WM-183 tank systems. The pipe to be sampled was removed from the system. The piping was filled with water, allowed to equilibrate for a minimum of 30 minutes, and sampled and analyzed for total metals.
The concentration of metals in liquid (mg/L) SBW is proportional to the concentrations of radionuclides (mg/L). Therefore, the residual metal concentrations in piping can be used to calculate the residual radionuclide concentrations. The maximum concentration of each metal result in rinsate samples of piping was summed with the other 23 metals analyses. This yielded a concentration of 2.9 mg/L. The rinsate was collected from 46-cm (18-in.) lengths of the 6-cm (2-in.) diameter pipe. It is not assumed that the chemical properties of radionuclides and metals are the same. Therefore, the conservative assumptions shown below were used to ensure the decontamination factor for metals was not overstated, the fixed radioactive contamination would be included in the estimate, and to provide for the possibility of greater concentrations being found in other piping. This estimate of radionuclide concentrations in the piping was reviewed previously by the NRC and found to be acceptable (NRC 2003a), and was also found to be reasonable in the NRC TER (NRC 2006b). Several conservative assumptions were made to ensure this estimate is conservative:
• The mass of metals equals the mass contained in 0.3 m (1 ft) of piping. Therefore, the starting value was one-third greater than indicated by the analysis.
• The sample volumes were less than 1 L. The data were not adjusted downward to correspond with the actual sample volumes.
• A safety factor of 500 was applied to the data to ensure a reasonably conservative estimate.
The use of these data results in a mass of 15.5 kg of solids remaining in the piping (DOE-ID 2003b).

28
Prior to grouting, the small amount of liquid waste in the vault sumps will be emptied using the existing steam-jet pumps. The lines connecting the vault sumps to the tanks will be grouted, followed by grouting of the vaults.
2.3.2 Results of Tank and Ancillary Equipment Cleaning from 2002 to 2005
The results of visual inspection and sampling and analysis performed after tank cleaning operations were completed provide evidence that the cleaning technology used for the 300,000-gal tanks, 30,000-gal tanks, and ancillary equipment effectively removes the majority of highly radioactive radionuclides from the tanks while keeping occupational exposure to radiation as low as reasonably achievable (ALARA).
For the seven 300,000-gal tanks that have been cleaned as of May 2005 (Tanks WM-180 through WM-186), the washball and directional nozzle tank cleaning system was used to wash the tank walls and ceiling. The high-pressure water from the washball and directional nozzle also agitated the tank heel to suspend the solids and facilitate heel removal. The washball and directional nozzle were lowered into the tank through one of the tank risers. The water from the washball and nozzles hit the tank walls, roof, and heel, and dislodged the bulk of the contamination on the walls and ceiling of the tank to allow subsequent removal using the steam jets. A camera and lighting system was used to monitor the decontamination and heel removal effectiveness. Existing tank equipment and new equipment used for waste removal and decontamination operations were left inside that tank after these operations were completed for permanent disposal when practical. However, the washball and directional nozzle were decontaminated when moved to a new tank. The four remaining 300,000-gal tanks (WM-187 through WM-190) will be cleaned using the same methods after the SBW is removed for future treatment.
Visual examination indicated that the water spray removed solids from the tank walls easily. After tank cleaning operations were completed, post-decontamination samples of the residuals were obtained from the tanks and ancillary equipment. Samples from Tanks WM-180 through WM-186 were collected. A minimum of five samples were collected from each tank. The remaining tank contents were agitated between sample collections to ensure random selection of the samples. Because few solids remained on the tank bottoms, only a few grams of solids from one tank (WM-183) were retrieved during the sampling activities. Attempts to sample solid material in other tanks failed because of a lack of solid material available to collect. Figures 11 and 12 are photographs of the interior of WM-183 before tank cleaning and after tank cleaning, respectively. Figure 11 shows the side of the tank and the cooling coil on the tank wall, which is approximately 20 cm (8 in.) above the tank floor. Figure 12 shows the cleaned tank floor and cooling coils, which are obscured by waste in Figure 11. After cleaning, the tank floor has only isolated areas of solid residual as shown in the photograph (see Figure 12). The cooling coil support brackets and welds on the floor and on the cooling coil base plate (0.97 cm [0.38 in.]) are clearly visible. Similar results were achieved for the other cleaned tanks. Post-decontamination photographs of the cleaned tanks are presented in Appendix A.
The four 30,000-gal tanks (WM-103 through WM-106) were flushed with water to remove any residual waste. A tank cleaning system was not used for these tanks because of the low radionuclide concentrations remaining after previous tank flushing (see Subsection 2.2). Post-decontamination samples (at least five from each tank) from Tanks WM-103 through WM-106 were also collected (Portage 2006b).

29
Figure 11. Photographs of the interior of TFF Tank WM-183 before tank cleaning.

30
Figure 12. Photograph of the interior of TFF Tank WM-183 after tank cleaning.
Sampling and analysis were performed in accordance with SAPs (ICP 2004a, 2004b; INEEL 2001, 2002b, 2003) prepared in conjunction with the tank and ancillary equipment closure plans. Each SAP used the data quality objective (DQO) process to determine the sampling strategy, number of samples, and analytical methods to be used. Issues such as the representativeness of the samples obtained and the homogeneity of the population sampled are also addressed. The DQO process is a planning approach developed by the EPA for use in preparing sampling designs for data collection activities that support decision-making. The process is used to ensure that the type, quantity, and quality of data used in decision-making are appropriate for the intended application (EPA 2006a). The analytical results have been reported in a series of DQA reports (ICP 2006b, 2006c, 2006d, 2006e, 2006f, 2006g, 2006h, 2006i, 2006j; INEEL 2006a, 2006b). A DQA is a scientific and statistical evaluation of the quality of the collected characterization data to determine whether the data can be used to meet the DQOs that were established (EPA 2006b).
In this case, the results of post-decontamination sampling and analysis were used to determine the concentrations of the radioactive and hazardous constituents remaining in the tanks and ancillary equipment. Analysis results were used to confirm that the radionuclide concentrations met the closure requirements, and that they were bounded by the concentrations assumed in the conservative inventory in the 2003 PA (DOE-ID 2003b). The results were also used to estimate the residual TFF radionuclide inventories. Results of sampling and analysis of the residuals indicate that the radionuclide inventory in the tanks after cleaning is an order of magnitude lower than that estimated in the 2003 PA. A comparison of the PA conservative inventory and the Tank-WM-182 inventory at closure is presented in Appendix A.
2.4 Residual Inventory in Tank Farm Facility Structures, Systems, and Components
Although the tank and ancillary equipment cleaning activities have been shown to be successful, some residuals will remain in the TFF. These residuals contain radionuclides that will potentially create a radiation dose to members of the public. The residual inventory at closure, an estimate of the amount of

31
residuals remaining after the TFF tank system is closed, is used in this 3116 Basis Document to evaluate this potential radiation dose and to support demonstration of compliance with Section 3116 criteria.
The residual inventory at closure is based on validated analytical data from tanks sampled between 2002 and 2005, after cleaning operations. (See Subsection 2.3.2 for a description of and references to the SAPs and DQA reports.) This inventory describes the radionuclide concentrations in the TFF tank system residuals, assuming that the residuals in the four 300,000-gal tanks and ancillary equipment remaining to be cleaned have a radionuclide inventory similar to that of the residuals in the seven tanks and ancillary equipment that have already been cleaned.aa Radionuclide concentrations are decayed to 2012, the year of final TFF closure. This date is used because performance objectives will not be met until all tanks and ancillary equipment are cleaned and stabilized with grout. (However, this inventory does not include the grout, nor is the inventory reduced by the amount of residuals that may be further removed by grouting operations.) The following subsections describe the residual inventory at closure for the 300,000-gal tanks, 30,000-gal tanks, sandpads, and piping; how each inventory was developed; and how the inventory will be used to support the demonstration of compliance with Section 3116 criteria.
2.4.1 Models and Calculations Used to Develop Residual Inventory at Closure
Historically, the INTEC uses 137Cs analytical data to aid in process control and estimate radionuclide inventories. This radionuclide is a major component in INTEC waste streams and is a strong gamma-emitting radionuclide, which makes it easy to detect with confidence in radioactive waste streams. Because no or limited analytical data are available for many other radionuclides, 137Cs data are also used to estimate values for other radionuclides. Radionuclide inventories for all tanks are presented in Appendix A. The 137Cs sample data and ORIGEN2 (Croff 1980) and analytical ratios, as explained below, are used to estimate radionuclide inventories when analytical data for specific radionuclides are not available.
The gamma-emitting radionuclide 137Ba contributes heavily to the overall activity in the inventory. This activity level has a tendency to “overshadow” the activity of lower energy or lower activity radionuclides (e.g., 14C). This occurs because the intensity and high concentration of the gamma-emitting radionuclides create overlap, scatter, and other interferences during analysis, which in effect, result in a loss in instrument sensitivity. Depending on the levels, this results in either difficulty or the inability of the laboratory to measure low-energy/low-activity nuclides.
The ORIGEN2 model is used to predict radionuclide inventories based on nuclear fuel types (e.g., Al, Zr, and stainless steel) that have been processed at INTEC. Input parameters to the model are adjusted to allow the model to predict SBW radionuclide inventories based on weighted averages of the different fuel types that have been processed. The INL Site uses radionuclide and 137Cs values from the ORIGEN2 model to calculate a radionuclide-to-137Cs ratio called the ORIGEN2 ratio for each radionuclide. Analytical results from SBW samples that contain reliable data for a specific radionuclide and 137Cs are used to calculate an analytical ratio. All reliable analytical data are used to generate average analytical ratios for radionuclides in SBW. These two ratios, the ORIGEN2 and analytical ratios, have been modeled and published and are informally called the Wenzel Tables (EDF-FDO-006, 1997). These tables have been integrated into a FORTRAN program, which is used to calculate radionuclide data (when analytical data are lacking) for SBW based on 137Cs sample results (see the following example).
aa. As explained previously in this 3116 Basis Document, DOE will sample the remaining tanks after cleaning pursuant to DOE’s Atomic Energy Act (42 USC 2011 et seq. 1954) responsibilities and will share this information with the NRC, as a matter of policy, to facilitate NRC monitoring, in coordination with the State of Idaho, pursuant to Section 3116(b).

32
Example of using ORIGEN2 and analytical ratios to calculate radionuclide data for SBW:
• Data from Wenzel tables
- The concentration of 238U is 2.20E–08 Ci/L (radioactive decay to 2012) as calculated by the ORIGEN2 model for SBW
- The 137Cs concentration in 2012 for SBW is 2.80E−02 Ci/L (based on analytical results from historical analysis of SBW)
• ORIGEN2 and analytical ratios
- The ratio for 238U is calculated by dividing the concentration of 238U by the concentration of 137Cs or 2.20E−08/2.80E−02, yielding an analytical ratio = 8.20E−07 for 238U since it was based on ORIGEN2 results
• Concentrations based on 137Cs analytical results and ORIGEN2 and analytical ratios:
- Based on the analytical data gained from gamma spectroscopy, the concentration of 137Cs detected in Tank WM-182 is 2.20E−04 Ci/L (radioactive decay to 2012). Therefore, the estimated concentration in 2012 for 238U based on the 137Cs analytical data and the analytical ratio would be 2.20E−04 Ci/L x 8.20E−07 = 1.80E−10 Ci/L.
(Note: The values used in the calculations have been rounded.)
The analytical ratio is used preferentially over the ORIGEN2 ratio to calculate TFF inventories when available, because the analytical ratio is modified to the measured 137Cs concentrations (DOE-ID 2003b). These analytical ratios are used to provide an inventory that has a basis in analytical data. The ORIGEN2 and analytical ratios are also used to validate analytical results of difficult-to-measure isotopes when they are found in waste streams with moderate to high radionuclide concentrations. The results of laboratory analyses are used to modify the ORIGEN2 results to better reflect the concentrations of radionuclides in the inventory.
Expensive and time-consuming separation techniques are available that increase the likelihood of obtaining more reliable laboratory results. However, even when these techniques are applied, a detection of a radionuclide may not be made or may be at concentrations that have a high degree of uncertainty. In lieu of these techniques, the industry has developed and adopted the use of tools such as the ORIGEN2 model to obtain reasonable estimates of low-energy/low-activity components when evaluating large inventories of radionuclides. This practice is widely recognized throughout the industry as a means to obtain reasonable estimates of radionuclides that are difficult or impossible to measure in the presence of high-energy/high-activity components (DOE-ID 2003b).bb
bb. During consultation, NRC expressed concerns with DOE’s use of ORIGEN2 ratios to estimate the concentrations of radionuclides not detected in the post-cleaning sampling. On pages 31–32 of its TER (NRC 2006b), the NRC noted that DOE had addressed NRC’s concerns regarding the use of the ORIGEN2 model (see DOE’s response to NRC RAI Comment 2 [ICP 2006l]), and the NRC concluded that the methodology used to calculate the post-cleaning inventories is reasonable.

33
2.4.2 Residual Inventory at Closure in 300,000-gal Tanks
The residual inventory at closure for the 300,000-gal tanks is based on analytical data from samples collected after tank cleaning from 2002 through early 2005. Of the 300,000-gal tanks, Tanks WM-180, WM-181, WM-182, WM-183, WM-184, WM-185, and WM-186, and the associated ancillary equipment have been cleaned. Analytical data from the cleaned tanks are the primary source of information for creating the residual inventory at closure. The radionuclide concentrations used to calculate inventories for each tank are based on analytical data decayed to 2012. Concentrations for radionuclides for which samples were not analyzed or for which radionuclides were not detected are replaced with the estimates calculated from the ORIGEN2 and analytical ratios, and analytical results for 137Cs as described in Subsection 2.4.1. Samples were analyzed for all radionuclides that were important dose contributors. Due to the nature of the SBW, some radionuclides were hard to detect without specialized analyses or the development of new analytical methods. These radionuclides were not analyzed if they were not considered to be significant dose contributors. Therefore, these radionuclide concentrations were estimated as described in Subsection 2.4.1.
The residual solids data are based on a sample of solids collected from Tank WM-183. Although seven 300,000-gal tanks have been cleaned, only one sample of solid material was able to be collected because of the lack of residual solids in the cleaned tanks.
The residual solids inventory for those radionuclides modeled using the ORIGEN2 analytical ratios is based on the mean of the 137Cs concentrations from Tank WM-188 collected prior to cleaning (decayed to 2012). Tank WM-188 137Cs data are used because this tank had the highest measured 137Cs concentration of any TFF tank before or after cleaning and because only one solid sample could be collected from the tanks after cleaning operations. Therefore, using the higher concentration data from Tank WM-188 is conservative. Concentrations estimated from the analytical ratios are used for radionuclides not able to be detected.
The single solid sample from Tank WM-183 introduces uncertainty to the radionuclide inventory for the TFF tanks. While it is difficult to quantify the uncertainty, a qualitative uncertainty discussion is included in the following paragraphs to show that the inventory for the entire TFF is reasonably conservative. The inventory that is shown in this 3116 Basis Document is based on the data collected from the cleaned tanks. The PA inventory is compared to the residual inventory in Appendix A, Table A-12.
In all of the cleaned 300,000-gal tanks, five liquid samples were collected from three locations, with two of the locations sampled twice. Limited access to the tank through existing risers requires this type of sample collection effort. While all tanks were sampled, only a few grams of solids were collected from Tank WM-183. Many factors contribute to the overall reasonably conservative inventory based on a single sample of solids, which are:
• Tank WM-190 has never been used and has been only slightly contaminated. The solid sample is conservative for this tank. To ensure a conservative estimate, residual mass from Tank WM-182 was used for tanks that have not yet been decontaminated, including WM-190. The estimated mass of solid residuals by tank are as follows: Tank WM-180 (542 kg), Tank WM-181 (246 kg), Tank WM-182 (1,238 kg), Tank WM-183 (702 kg), Tank WM-184 (558 kg), Tank WM-185 (720 kg), and Tank WM-186 (334 kg).
• Analytical data are the primary source used to develop the radionuclide tank inventory. When these analytical data are not available, the ORIGEN2 model is used to predict the inventories.

34
• A 137Cs ratio of 1.8 was established for solids. This value is the mean of all solid samples collected from Tank WM-188. These samples were collected in 1999, prior to tank cleaning. Use of this ratio increases the total radioactivity of all the radionuclides that were not detected.
• Although additional tank residuals may be removed during the grouting process (as discussed in Subsection 2.3.1), the residual inventory does not take credit for this additional residual removal.
• Actual analytical values from each tank were used for the 137Cs ratio for liquids.
• Based on mass, WM-182 has the highest activity of any tank cleaned to date.
• An estimated density of 1.4 g/mL was applied for tank solids (EDF-TST-001, 2000).
Table 1 presents an example of the residual inventory at closure for a 300,000-gal tank. The inventory for Tank WM-182 is shown because this inventory contains the largest amount of residual radioactivity of the cleaned tanks. Inventories at closure for all tanks are presented in Appendix A. The analytical data indicate the decontamination efficiency is greater than planned, as shown in Subsection A-2 of Appendix A. The residual inventory at closure indicates that approximately 2,400 Ci remain in Tank WM-182. The total amount of radioactivity is associated almost entirely with residual solids. Approximately 2 Ci remain in the liquid in Tank WM-182.
Table 1. Residual inventory at closure for Tank WM-182.
Radionuclide Residual Liquids
(Ci)a,b Residual Solids
(Ci)a,b Total Residuals
(Ci)c 241Am 5.30E−04 5.43E+00 5.43E+00 137mBad 1.11E+00 1.14E+03 1.14E+03 242Cm 6.58E−07 1.32E−03 1.32E−03 137Cs 1.11E+00 1.14E+03 1.14E+03 14C 5.39E−08 4.90E−06 4.96E−06 129I 1.12E−06 7.73E−04 7.74E−04 3H 1.66E−05 7.17E−01 7.17E−01 94Nb 4.03E−05 2.06E−01 2.06E−01 59Ni 1.25E−05 2.51E−02 2.51E−02 63Ni 1.43E−03 2.86E+00 2.86E+00 237Np 2.71E−07 4.70E−02 4.70E−02 238Pu 2.47E−03 1.14E+01 1.14E+01 239Pu 2.44E−04 3.40E+00 3.40E+00 240Pu 6.74E−04 1.35E+00 1.35E+00 241Pu 5.89E−04 1.95E+01 1.95E+01 242Pu 4.93E−07 9.87E−04 9.88E−04 90Sr 2.41E−01 2.32E+01 2.34E+01 99Tc 4.54E−05 7.64E−01 7.64E−01

Table 1. (continued).
35
Radionuclide Residual Liquids
(Ci)a,b Residual Solids
(Ci)a,b Total Residuals
(Ci)c 90Y 2.41E−01 2.32E+01 2.34E+01 Totale Ci all radionuclides 3 2,391 2,394
a. Radionuclide inventories are based on (1) heel residuals that are estimated using remote video inspection of cleaned tank internals to map out estimates of depth of remaining residual solids and liquids across tank bottoms using tank internal reference points of known height, (2) best estimated radionuclide concentrations from past and recent samples as calculated in the associated engineering design file (Portage 2005b), and (3) radioactive decay to 2012. b. Analytical results for Tank WM-182 were used to calculate the liquids inventory at closure for 241Am, 14C, 137Cs, 154Eu, 3H, 129I, 237Np, 238Pu, 239Pu, 241Pu, 125Sb, 90Sr, 99Tc, 234U, and 90Y. Analytical results for Tank WM-183 were used to calculate the solids inventory at closure for 241Am, 137mBa, 60Co, 137Cs, 129I, 94Nb, 238Pu, 239Pu, 125Sb, 90Sr, 99Tc, 234U, and 90Y. Inventories at closure for all remaining nuclides were calculated using the methodology presented in Subsection 2.4.1. c. Radionuclides decayed to 2012. d. A 1:1 ratio is assumed for 137Cs to 137mBa as a conservative estimate of radionuclide inventory; based on decay probability, 137mBa is approximately 95% of the 137Cs inventory. e. Radionuclides shown are contributors in PA dose calculations or regulated by concentration limits in 10 CFR 61.55. The totals are based on the entire inventory of radionuclides. This inventory is based on the 95% upper confidence limit of the radionuclide concentrations from liquid samples and an average of the estimate of remaining mass. Since only one sample of solid residual was able to be obtained, that concentration was used with the estimated remaining mass to determine the total solid residual.
Tank volume estimates in the 300,000-gal tanks for solid residual and interstitial water used in the residual inventory at closure are based on viewing videotapes of the tanks taken before, during, and after the final cleaning and sampling events. From the videotapes, residual solid depths were estimated by comparing the solids depths to the cooling coil support brackets and associated welds. Depth assumptions were based on the bottom weld and stainless steel bracket thickness measuring 0.97 cm (0.38 in.). Close-ups from the video were critical in determining the depths of residuals next to the brackets and areas where no apparent solid residuals were observed. Depths of solid residuals ranged from 0 to 0.97 cm (0 to 0.38 in.). Areas where no solids were present on the bottom of the tank were apparent by the reflection from the stainless steel bottom. The volume of solids and the density of the solid material were used to determine the mass of residual in each tank (Portage 2005a, 2005b, 2005c, 2005d, 2005e, 2005f, 2006a). Videos and photographs of the tank walls show staining and discoloration, and no discernible buildup of residuals. Therefore, no source term for the tank walls was included in the tank inventory. Inventories at closure for all tanks are provided in Appendix A.
Residual solids depth measurements were recorded and entered into an AutoCAD 2004 drawing in association with the cooling coil support locations. Cartesian coordinates (x and y) were determined for each cooling coil support and associated residual depth measurement. The residual solids depth data and associated Cartesian coordinates for the cooling coil supports were then exported to Surfer 8. The residual solids volume was estimated using Kreiging methods in Surfer 8, with point-Kreiging being the preferred gridding method. A simple variogram model was used with linear interpretation using a slope equal to 1.0 and anisotropy equal to 1.cc
Contour, post, and surface plot maps are provided for the residual solids volume estimates in the engineering design files prepared for each tank volume (Portage 2005a, 2005b, 2005c, 2005d, 2005e, 2005f, 2006a). Residual solid volume estimates were determined using Surfer 8 with 0 cm (0 in.) as a cc. Kreiging is an interpolation technique that uses variograms as weighting functions. Variograms are measures of the continuity of spatial phenomena expressed as an average squared difference between measured quantities at different locations. Anisotropy is a state in which a physical characteristic varies when measured in different directions.

36
lower surface boundary and the Trapezoid Ruledd as the preferred volume estimate method. The depth of liquid above the interstitial waste was estimated to be approximately 3 cm (1 in.) by comparison to the height of the steam-jet lines in the post-decontamination video.
The residual inventory at closure assumes that the same degree of radionuclide removal will be achieved in the tanks remaining to be cleaned (WM-187, WM-188, WM-189, and WM-190) as was achieved in the tanks that have been cleaned. As described in Subsection 2.2, Tank WM-190 is an emergency spare tank and has never been used to store waste. However, this tank was contaminated with a small volume of first-cycle extraction process waste when the waste passed inadvertently through a transfer valve. As noted previously, Tank WM-182 contains the largest amount of residual radioactivity of the cleaned tanks.
Although there may be variability between the tank inventories, as the NRC noted in its TER, for the reasons explained below, these assumptions are conservative. Solids and liquids from the cleaned tanks have been transferred to Tank WM-187 via existing piping. The decontamination fluids in Tank WM-187 were evaporated to provide space for additional decontamination fluids as additional tanks were decontaminated and emptied. This tank will contain all of the solids removed from the cleaned tanks and some of the liquid. Most of the liquid has been evaporated using the evaporator tank system. Although combining all of the solids in one tank may make cleaning this tank slightly more difficult, the solids in the tanks have been found to be made up of small particles that are removed easily using the tank cleaning system. Particle size distribution studies performed on samples collected from Tanks WM-182 and WM-183 conclude the particles that comprise the solids are small and easily redispersed after settling (INEEL 2000b). The basic findings of the particle size study were substantiated during the course of tank cleaning. The solids were dispersed easily using high-pressure water sprays, and the particles remained suspended in the liquid for a significant period of time before they settled to the bottom. The characteristics of the solid particles are not known to have been altered by transferring to Tank WM-187.
2.4.3 Residual Inventory at Closure for 30,000-gal Tanks
The residual inventory at closure for the 30,000-gal tanks is based on analytical data from post-cleaning sampling. Solid residual samples were not collected because an adequate volume of material was not present in the tanks (Portage 2006b). A film layer was observed on the lower half of all four tanks that appeared to be algae or another form of biological growth. This film layer was clearly not residual solids as found in the 300,000-gal tanks and is not likely to contain any significant radioactivity. However, to establish a conservative estimate, the film is assumed to be 5 mil (0.005 in.) thick and contains the concentrations of radionuclides found in Tank WM-183 solid samples (Portage 2006b). The inventories for each 30,000-gal tank vary from 36.2 to 36.7 Ci. Table 2 presents the inventory for Tank WM-106, which has the highest remaining Ci content of the 30,000-gal tanks.
dd. The Trapezoid Rule is a way to approximate definite integrals.

37
Table 2. Residual inventory at closure for Tank WM-106 (Portage 2006b).
Radionuclidea Residual Liquids
(Ci)b Residual Solids
(Ci)b Total Residual
(Ci)c
241Am 1.85E–06 6.36E–03 6.36E–03 137mBa 2.96E–02 1.72E+01 1.72E+01 242Cm 1.75E–08 1.99E–05 1.99E–05 137Cs 2.96E–02 1.72E+01 1.72E+01 14C 5.28E–10 7.41E–08 7.46E–08 129I 2.98E–08 1.17E–05 1.17E–05 3H 3.90E–06 1.08E–02 1.08E–02 94Nb 1.87E–05 3.10E–03 3.12E–03 59Ni 3.34E–07 3.79E–04 3.80E–04 63Ni 8.75E–06 4.32E–02 4.32E–02 237Np 3.51E–08 7.10E–04 7.10E–04 238Pu 1.65E–05 1.73E–01 1.73E–01 239Pu 2.66E–06 5.14E–02 5.14E–02 240Pu 1.80E–05 2.04E–02 2.04E–02 241Pu 1.22E–05 2.95E–01 2.95E–01 242Pu 1.31E–08 1.49E–05 1.49E–05 90Sr 2.84E–01 3.50E–01 6.33E–01 99Tc 8.32E–05 1.15E–02 1.16E–02 90Y 2.63E–02 3.50E–01 3.76E–01 Totald Ci all radionuclides 0.6 36.1 36.7
a. Radionuclides based on results from the 2003 TFF PA (DOE-ID 2003b). b. Analytical results from sampling of Tank WM-106 were used to calculate the liquids inventory at closure for 241Am, 14C, 244Cm, 60Co, 137Cs, 154Eu, 3H, 129I, 94Nb, 63Ni, 237Np, 238Pu, 239Pu, 241Pu, 90Sr, 99Tc, 234U, and 235U. Analytical results for Tank WM-183 were used to calculate the solids inventory at closure for 241Am, 137mBa, 60Co, 137Cs, 129I, 94Nb, 238Pu, 239Pu, 125Sb, 90Sr, 99Tc, 234U, and 90Y. Inventories at closure for all remaining nuclides were calculated using the methodology presented in Subsection 2.4.1. c. Radioactive decay to 2012. d. Radionuclides shown are contributors in PA dose calculations or regulated by concentration limits in 10 CFR 61.55. The totals are based on the entire inventory of radionuclides.
2.4.4 Residual Inventory at Closure for Sandpads
Tanks WM-182 through WM-190 rest on a 15-cm (6-in.) layer of commercial-grade sand overlaying a concrete slab approximately 0.76 m (2.5 ft) thick. A 15- by 15-cm (6- by 6-in.) concrete curb encloses the sandpad area. The commercial-grade sand occupies approximately 23.39 m3 per tank and provides a cushion for the stainless steel tanks to prevent shifting. A drain-sump system removes liquid (the liquid that accumulates is mostly rainwater; a small amount of liquid from secondary containments does enter vault sumps if a valve leaks or during some maintenance activities) that accumulates in the vaults. Typically, the vault area receives an accumulation of rainwater and snowmelt in the spring each year.

38
The sandpads at the TFF are between the tanks and vault floors. The sandpad at the bottom of the concrete vault was designed to cushion the tank bottom. Additionally, the curb has drain holes to allow liquid to drain from the sandpad beneath the tanks to the sumps outside the curb. The sumps were periodically used to remove liquid that had accumulated in the vaults. Liquid was present in the vault from sources such as precipitation and irrigation activities. The sandpads beneath Tanks WM-185 and WM-187 are contaminated due to accidental releases into the vaults in March 1962. These are the only tanks where such an incident occurred. A description of the back-siphoning event into the tanks is available in Latchum et al. (1962). Before and after these releases, water from precipitation, spring runoff, and irrigation was pumped out of the tank vaults at least semiannually. The residual inventory predicted for 2012 is based on 38 “flushing” eventsee when water infiltrated to the vault from leaks in the tank/vault roof and was then jetted out of tank vaults. The amount of water collected in the vaults is documented in the INEL internal memorandum, “HLLW Tank Sump Transfer History.”ff The report documents over 100 transfers from tank vaults associated with WM-185 and WM-187. Reports are not available before 1962 but water transfers from the vaults are known to have occurred. Water transfers continue from vault sumps. Thirty-eight events correspond with each year from the back-siphoning events in 1962–2000. Water was jetted from the tank vault sumps at least twice yearly and will continue until each tank is closed. The actual number of water transfers from the tank vaults and associated leaching of radionuclides from the sandpad likely exceeds 130 for each vault to date.
The results from the analysis are provided for each radionuclide in the year 2012, which is the expected closure date. These activities have been estimated by modeling diffusion of radionuclides from the liquid into the sandpad for the contaminating event in 1962.
The approach uses diffusion of radionuclides to the sand. The sandpad was subsequently flushed by precipitation infiltration through the roof of the tank and radionuclides were decayed to 2012. The approach assumes radionuclides enter the sandpad through diffusion at the curb/sandpad interface. This assumption is reasonable since the contaminated liquid, which entered the vault in 1962, appears to have filled the concrete vault from the bottom toward the vault top (i.e., there was no horizontal pressure gradient driving the liquid through the sandpad). The radionuclides entered the sandpad by diffusion. Once contained in the sandpad, radioactive decay and periodic (annual) flushing are modeled to determine the present-day activities. Flushing is assumed to have occurred through 2000 (38 flushings) and then the inventory is decayed over 12 years to estimate 2012 activities of all radionuclides. The diffusion model is used because before the vault partially filled, the vault was filled with water from a spring runoff event. The sandpad was saturated with water because water had filled a portion of the vault recently and in the past. The back-siphoning event that caused the waste to enter the vault was a result of jetting the water to the tank.
After the accident, the mass of each radionuclide in the sandpad is assumed to be impacted by radioactive decay and flushing. These processes are modeled by assuming the mass of radionuclides in the sandpad undergoes radioactive decay for a period of time representing the length of time between flushing events. Then the system is flushed. During flushing, the sandpad is assumed to be saturated and the radionuclides are partitioned at equilibrium between the liquid and solid phases according to their sorption coefficients (Kd values). The flushing is assumed to remove all liquid and radionuclides that have partitioned into the liquid phase from the sandpad except for the residual liquid. Thus, the radionuclides remaining in the sandpad are contained in the residual liquid and sorbed onto the sand. The mass of radionuclides in the sandpad is again calculated assuming radioactive decay occurs over a period of time
ee. The number and impacts of these events are further explained in DOE’s response to NRC RAI Comment 3 (ICP 2006l).
ff. Rebish, K. J., INEL, to J. M. Roberts and B. H. O’Brien, INEL, October 15, 1993, “HLLW Tank Sump History,” KJR-10-93.

39
that represents the time between flushing events. The cycle of modeling radioactive decay and flushing is repeated until 2000. In the absence of data, it was assumed that the flushing events occurred once a year for 38 years (i.e., once a year the seasonal effects of precipitation and irrigation are purged from the vaults). After activities in 2000 are computed, the results are decayed over 12 years to 2012, which corresponds to the time of TFF closure.
To determine the mass of radionuclides in the sandpad following the initial event in 1962, the radioactive decay and flushing of the sandpad is modeled. A FORTRAN computer code was developed to model radioactive decay and then flushing of the sandpad based on partition coefficients and the volume of sand, void space, and residual saturation. The mathematical formulation of this approach is provided below; the FORTRAN source code is presented in Appendix A of the PA (DOE-ID 2003b).
The accidental spill in 1962 is modeled assuming the liquid is present in the vault for 24 hours. The 24-hour time is consistent with the estimated time from the beginning of the spill to the time when the spilled liquid was removed by pumping the vault (Latchum et al. 1962). The area of the flux surface (i.e., the liquid/sandpad interface) is assumed to be an annular region having a radius equal to the tank radius and a thickness equal to the maximum sandpad height. That is, this area is approximately equal to the area of a rectangle with a length of 2 πr, where r is the radius of the tank (7.6 m [25 ft]), and a width of 15 cm (6 in.) (i.e., the maximum estimated height of the sandpad).
The initial amount of each radionuclide in the tanks at the time of the accidental spills was evaluated with limited sampling of Tanks WM-185 and WM-187 on February 14, 1962. Due to the limited number of radionuclides provided by this sampling analysis, an alternative method using information from a leak from Tank WM-181 was used to determine the inventory (EDF-CPP-058, 1997). Using a pseudo Al-clad fuel with an initial 235U enrichment of 93% and a burnup of the processed fuel of 18%, EDF-CPP-058 evaluated the expected radionuclide content of the tank. The fuel from MTR Cycle No. 198 (Dykes 1963) was taken as typical for the fuel processed. The reactor contained 4,842 g of 235U and had 684 MWd of operation over a 417-day period. For calculation purposes, inventories were normalized to the activity in a typical 200-g element. The ORIGEN2 data were corrected to the concentration of 137Cs in Tank WM-185 one month before the incident. Data for Tanks WM-185 and WM-187 were shown in the record of the incident (Latchum et al. 1962). Tank WM-185 was used because of the slightly higher 137Cs concentration of 1.71 Ci/L.
These assumptions and the data used in the analysis are considered reasonably conservative. That is, available data that represent the modeled system are used. When data are not available, conservative assumptions are made. For example, the surface available for diffusive transport in this analysis is assumed to remove all radionuclides that reach the surface instantaneously (i.e., the liquid/sandpad interface). Thus, mass transfer is greater under these conditions than if a concentration gradient is assumed to exist in the sandpad. With this and other assumptions and the available data, the analysis is expected to provide a reasonable and conservative estimate of the mass of each radionuclide contained in the sandpad. That is, the actual sandpad inventories are not expected to be larger than these estimates.
The amount of radionuclides that have been flushed from the sand has not been measured directly and cannot be determined from the analysis of the liquid in the vaults because other sources (such as vault sumps) contribute to vault contamination. However, because of the numerous flushing events that have occurred, any additional cleaning by flushing would not provide a significant benefit.

40
Table 3 presents a conservative residual inventory at closure for the sandpadsgg based on the analysis of the two contaminated sandpads. This inventory represents the sandpad assumed under Tanks WM-185 and WM-187 in the PA. The residual inventory at closure was established using various numerical models to predict the initial radionuclide concentrations, the subsequent removal by the periodic flushing of the sandpads, and radioactive decay to estimate concentrations in 2012 (DOE-ID 2003b; Portage 2005a, 2005b, 2005c, 2005d, 2005e, 2005f, 2006a).
gg. Although the NRC noted uncertainties in the sandpad inventory due, in part, to the inability to directly sample the sandpads under the tanks, on page 36 of its TER (NRC 2006b) the NRC concluded, “… DOE Idaho made a good faith effort to evaluate the uncertainty in the sand pad inventory through additional sensitivity and uncertainty analysis, modeling, and analysis of indirect sampling data. The sand pad inventory is adequate for the purpose of assessing DOE Idaho’s demonstration of compliance with NDAA Criteria 2 and 3.”
Table 3. Sandpad residual inventory at closure (Ci per sandpad).
Radionuclides Sandpad Inventory
(Ci)a 241Amb 1.89E+00 137mBa 1.65E+03 242Cm 1.38E–05 137Csb 1.65E+03 14Cb 3.90E–07 129Ib 1.08E–06 3H 3.10E–22 94Nb 2.29E–02 63Ni 1.69E–10 237Np 3.72E–04 238Pub 2.06E+00 239Pub 1.57E+00 240Pub 3.54E–01 241Pu 2.28E+00 242Pu 5.69E–05 90Srb 2.49E+02 99Tcb 2.02E–12 90Y 2.49E+02 Totalc Ci all radionuclides 3,850
a. Radioactive decay to 2012. b. Radionuclides based on results from the 2003 TFF PA (DOE-ID 2003b). c. Radionuclides shown are contributors in PA dose calculations or regulated by concentration limits in 10 CFR 61.55. The total is based on the entire inventory of radionuclides, not just the key radionuclides presented in this table.

41
2.4.5 Residual Inventory at Closure for Contaminated Piping, Encasements, and Valve Boxes
Liquid waste transfers to, from, and between the tanks are managed through a series of lines, valves, and diversion boxes. Piping that penetrates tanks, vaults, or valve boxes is part of this 3116 Determination. For each phase of the TFF closure, contaminated piping, encasements,hh and valve boxes will be isolated and decontaminated. In general, pipelines entering or leaving the INTEC TFF will be isolated at the first valve box or manhole inside the TFF fence. Lines that begin and end within the TFF will be closed entirely; however, they may be closed in stages, depending on the TFF waste handling needs. Lines that enter the TFF boundary from outside will be closed at a convenient junction, such as a valve box. The remaining line section will be closed with the tank or facility from which it originates. Waste transfer piping will be decontaminated by rinsing each line with three volumes of water.
Valve boxes are underground, stainless steel-lined concrete boxes that house waste transfer valves through which liquid waste is routed. During each TFF closure phase, the inside surfaces of each valve box will be washed, and the valve box will be decontaminated with demineralized water. Based on past maintenance decontamination practices, this protocol will be adequate to clean the interior pipe surfaces that have contacted process solutions. Piping that penetrates tanks and encasements that penetrate vaults will be filled with grout to the extent practical (INEEL 2000c).
Valve boxes and piping encasements that penetrate tanks or vaults will be drained of liquids resulting from decontamination efforts or leakage (DOE-ID 2003a) and then grouted along with their drain lines. A residual inventory at closure is not calculated for valve boxes because they do not normally contain process solutions; they are designed so that any leakage into the valve box would drain to sumps, which is then jetted to tanks; and the surface area of the valve boxes is small compared with the piping and tanks. Valve boxes have been (or will be) decontaminated and samples collected of the remaining water in the sump, but an inventory was not prepared. The valve box sumps are approximately 0.3 m (1 ft) square and have an outlet that is approximately 5–8 cm (2–3 in.) above the bottom of the sump. The liquid that is sampled is taken from the 5–8 cm (2–3 in.) of volume in the sump bottom. Almost all of the liquid is removed by sampling.
The TFF process lines are stainless steel pipe with secondary containment or encasements (see Subsection 2.1). Process waste lines and associated encasements are covered with 1.5–4.6 m (5–15 ft) of soil with about 30% being within 3 m (10 ft) of the surface (INEEL 2000c). During TFF closure, the active encasements will be decontaminated using a pressure-washing system. Most pipe encasements open into the associated valve boxes or vaults or have drains that drain into the associated vault. Each encasement is sloped to allow drainage and is flushed during tank isolation activities. The grout will be pumped into an encasement and will run or be pushed to the end of the encasement (INEEL 2000c). A residual inventory at closure is not calculated for pipe encasements. The pipe encasements are similar to valve boxes in that they do not normally contain process solutions; they are designed so that any leakage into the pipe encasements would drain to sumps, which is then jetted to tanks; and the contamination in the secondary containment is addressed by using the safety factor of 500 established for the piping inventory. The safety factor of 500 is described in Subsection 2.3.1.
Tank vessel off-gas piping will not be flushed because the piping did not transport process solutions (INEEL 2000c). The vessel off-gas lines will be grouted and permanently capped. A residual
hh. Piping encasements are enclosures (secondary containment) surrounding the waste transfer piping to prevent escape of radioactive waste. Any fluid that leaked from a process line drained into an encasement and then into a valve box or vault sump.

42
inventory at closure is not calculated for tank vessel off-gas piping because the piping has never contained process solutions.
The residual inventory at closure for TFF piping is based on analytical results from sampling pipe sections that had been removed from the Tank WM-182 process waste lines after decontamination. The samples were obtained and analyzed as described in the associated SAP (INEEL 2001). From these results, the amount of residuals remaining in 3,231 linear m (10,600 linear ft) of process waste piping is calculated to be 15.5 kg of SBW solid residuals in the piping. The radionuclide concentration from the tank residual inventory is then apportioned to the mass to estimate a conservative residual inventory at closure for the piping. Table 4 shows the total radioactivity by radionuclide for the piping.
Table 4. Residual inventory at closure for piping.
Radionuclides Piping Inventory (Ci)a,b
241Amc 5.28E−03 137mBa 1.43E+01 242Cm 1.65E−05 137Csc 1.43E+01 14Cc 6.21E−08 129Ic 9.70E−06 3H 1.08E–02 94Nb 2.58E−03 59Ni 3.15E−04 63Ni 3.58E−02 237Np 5.89E−04 238Puc 1.43E−01 239Puc 4.27E−02 240Puc 1.69E−02 241Pu 2.44E−01 242Pu 1.24E−05 90Src 2.93E−01 99Tcc 9.57E−03 90Y 2.93E−01 Totald Ci all radionuclides 30
a. Radionuclide inventories are based on (1) residual solids in piping at 0.305 g/m and 3,231 linear m (10,600 linear ft) of piping, (2) WM-182 radionuclide concentrations in the SBW solids, and (3) radioactive decay to 2012. b. Analytical results for Tank WM-183 were used to calculate the solids inventory at closure for 241Am, 137mBa, 60Co, 137Cs, 129I, 94Nb, 238Pu, 239Pu, 125Sb, 90Sr, 99Tc, 234U, and 90Y. Inventories at closure for all remaining nuclides were calculated using the methodology presented in Subsection 2.4.1. c. Radionuclides based on the 2003 TFF PA (DOE-ID 2003b). d. Radionuclides shown are contributors in PA dose calculations or regulated by concentration limits in 10 CFR 61.55. The totals are based on the entire inventory of radionuclides.

43
3. SECTION 3116 OF THE RONALD W. REAGAN NATIONAL DEFENSE AUTHORIZATION ACT FOR FISCAL YEAR 2005
Section 3116(a) of the NDAA provides that radioactive waste that results from reprocessing SNF is not “high-level radioactive waste” if the Secretary of Energy determines, in consultation with the NRC, that the waste meets certain specified criteria.
Section 3116(a) of the NDAA states:
In General—Notwithstanding the provisions of the Nuclear Waste Policy Act of 1982, the requirements of section 202 of the Energy Reorganization Act of 1974, and other laws that define classes of radioactive waste, with respect to material stored at a Department of Energy site at which activities are regulated by a covered State pursuant to approved closure plans or permits issued by the State, the term “high-level radioactive waste” does not include radioactive waste resulting from the reprocessing of spent nuclear fuel that the Secretary of Energy (in this section referred to as the “Secretary”), in consultation with the Nuclear Regulatory Commission (in this section referred to as the “Commission”), determines—
(1) does not require permanent isolation in a deep geologic repository for spent fuel or high-level radioactive waste; (2) has had highly radioactive radionuclides removed to the maximum extent practical; and (3) (A) does not exceed concentration limits for Class C low-level waste as set out in Section 61.55 of title 10, Code of Federal Regulations, and will be disposed of—
(i) in compliance with the performance objectives set out in subpart C of part 61 of title 10, Code of Federal Regulations; and (ii) pursuant to a State-approved closure plan or State-issued permit, authority for the approval or issuance of which is conferred on the State outside of this section; or
(B) exceeds concentration limits for Class C low-level waste as set out in section 61.55 of title 10, Code of Federal Regulations, but will be disposed of—
(i) in compliance with the performance objectives set out in subpart C of part 61 of title 10, Code of Federal Regulations, and
(ii) pursuant to a State-approved closure plan or State-issued permit, authority for the approval or issuance of which is conferred on the State outside of this section; and

44
(iii) pursuant to plans developed by the Secretary in consultation with the Commission.

45
4. WASTE DOES NOT REQUIRE PERMANENT ISOLATION IN A DEEP GEOLOGIC REPOSITORY FOR SPENT FUEL OR
HIGH-LEVEL RADIOACTIVE WASTE
Section 3116(a) of the NDAA provides in pertinent part:
[T]he term “high-level radioactive waste” does not include radioactive waste resulting from the reprocessing of spent nuclear fuel that the Secretary of Energy …, in consultation with the Nuclear Regulatory Commission …, determines—
(1) does not require permanent isolation in a deep geologic repository for spent fuel or high-level radioactive waste.
Under Section 3116(a), certain wastes from reprocessing are not “high-level radioactive waste” if
the Secretary, in consultation with the NRC, determines that certain criteria are met. Section 3116(a) sets out two specific criteria in Clauses (2) and (3). Clause (2) requires the DOE to remove highly radioactive radionuclides to the maximum extent practical. Clause (3) generally mirrors the criteria that the NRC has established for determining whether waste qualifies for land disposal as LLW (see 10 CFR 61.55 and 61.58). This clause provides that disposal of the waste must meet the NRC performance objectives of 10 CFR 61, Subpart C, and that the waste must not exceed the concentration levels for Class C waste in 10 CFR 61.55 or the Secretary must consult with NRC concerning DOE’s disposal plans.
Clause (1), noted above, is a broader criterion for the Secretary, in consultation with the NRC, to consider whether, notwithstanding that waste from reprocessing meets the other two criteria, there are other considerations that, in the Secretary’s judgment, require its disposal in a deep geologic repository. Generally, such considerations would be an unusual case because waste that meets the third criterion would be waste that will be disposed of in a manner that meets the 10 CFR 61, Subpart C performance objectives and either falls within one of the classes set out in 10 CFR 61.55 that the NRC has specified are considered “generally acceptable for near-surface disposal” or for which the Secretary has consulted with NRC concerning DOE’s disposal plans. As the NRC explained in In the Matter of Louisiana Energy Services, L.P. (National Enrichment Services) (CLI-05-05, 2005), the 10 CFR Part 61, Subpart C performance objectives in turn “set forth the ultimate standards and radiation limits for (1) protection of the general population from releases of radioactivity; (2) protection of individuals from inadvertent intrusion; (3) protection of individuals during operations; and (4) stability of the disposal site after closure.” It follows that if disposal of a waste stream in a facility that is not a deep geologic repository will meet these objectives, in the ordinary case that waste stream does not “require disposal in a deep geologic repository” because non-repository disposal will be protective of public health and safety.
It is possible that in rare circumstances a waste stream that meets the third criterion might have some other unique radiological characteristic or may raise unique policy considerations that warrant its disposal in a deep geologic repository. Clause (1) is an acknowledgement by Congress of that possibility. For example, the waste stream could contain material that, while not presenting a health and safety danger if disposed of at near- or intermediate-surface, nevertheless presents non-proliferation risks that the Secretary concludes cannot be adequately guarded against absent deep geologic disposal. Clause (1) gives the Secretary, in consultation with NRC, the authority to consider such factors in determining whether waste that meets the other two criteria needs disposal in a deep geologic repository in light of such considerations.

46
That is not the case here. As is demonstrated later in this 3116 Basis Document, disposal of the stabilized residuals in the TFF, and the TFF tank system, at closure will meet the performance objectives of 10 CFR 61, Subpart C so as to provide for the protection of the public health and the environment. Accordingly, the waste does not require disposal in a deep geologic repository due to risk to public health and safety. Furthermore, disposal of the stabilized residuals in the TFF, and the TFF tank system, does not raise any unique considerations that, notwithstanding these demonstrations, require its permanent isolation in a deep geologic repository. Accordingly, the stabilized residuals in the TFF, and the TFF tank system, meet the criterion of Clause (1) of Section 3116(a).ii
ii. On page 21 of its TER (NRC 2006b), the NRC also concluded that this criterion can be met.

47
5. WASTE HAS HAD HIGHLY RADIOACTIVE RADIONUCLIDES REMOVED TO THE MAXIMUM EXTENT PRACTICAL
Key Points
• The list of highly radioactive radionuclides for the stabilized residuals in the TFF, and the TFF tank system, describes the radionuclides that could reasonably be expected to exist in the waste and that, using a risk-informed approach, contribute significantly to the radiological risk to workers, the public, and the environment, taking into account scientific and health physics principles, knowledge, and expertise.
• In demonstrating that radionuclides will be removed to the maximum extent practical as required by Section 3116, the same degree of radionuclide removal is expected for the four 300,000-gal tanks remaining to be cleaned as that achieved in the seven tanks that have been cleaned, as described in Subsection 5.2.
• The demonstration that radionuclides will be removed to the maximum extent practical does not include the amount of additional residuals that may be removed from the cleaned 300,000-gal tanks during grouting operations.
Section 3116(a) of the NDAA provides in pertinent part:
[T]he term “high-level radioactive waste” does not include radioactive waste resulting from the reprocessing of spent nuclear fuel that the Secretary of Energy …, in consultation with the Nuclear Regulatory Commission …, determines— …
(2) has had highly radioactive radionuclides removed to the maximum extent practical.
5.1 Highly Radioactive Radionuclides
5.1.1 Approach
Based on consultations with NRC, DOE views “highly radioactive radionuclides” to be those radionuclides that, using a risk-informed approach, contribute most significantly to radiological risk to workers, the public, and the environment. Table 5 lists the radionuclides for the grouted (stabilized) TFF residual waste and TFF tank system at closure and disposal that DOE has determined, on the basis of a risk-informed approach, contribute significantly to radiological risk to workers, the public, and the environment, taking into account scientific and health physics principles, knowledge, and expertise.

48
The list of highly radioactive radionuclides was developed, beginning with the entire inventory of 145 radionuclides stored at the TFF at INTEC (ICP 2005b). The DOE reviewed this inventory of radionuclides and identified those radionuclides in Tables 1 and 2 of 10 CFR 61.55,jj as well as any additional radionuclides that may be important to meeting the performance objectives in 10 CFR 61, Subpart C because they contribute to the dose to workers, the public, and/or the inadvertent intruder (for one or more reasonable intruder scenarios) in the expected and degraded cases, using sensitivity analyses. In DOE’s view, this approach results in a risk-informed list of highly radioactive radionuclides that includes: those short-lived radionuclides that may present risk because they produce radiation emissions that, without shielding or controls, may harm humans simply by proximity to humans without inhalation or ingestion; and those long-lived radionuclides that persist well into the future, may be mobile in the environment, or may pose a risk to humans if inhaled or ingested. This list includes the short-lived fission products 137Cs and 90Sr and their equilibrium daughters, 137mBa and 90Y, that are responsible for the bulk of activity in the TFF tank system inventory. Based on process knowledge, 137Cs and 90Sr and their equilibrium daughters, 137mBa and 90Y, account for approximately 99% of the activity in the TFF tank waste (ICP 2005b). This list also includes the long-lived actinides (241Am, 242Cm, 237Np, and the plutonium isotopes) that are responsible for approximately 0.08% of the activity. The other radionuclides included in the list are 14C, 3H, 129I, 94Nb, 59Ni, 63Ni, and 99Tc, which contribute approximately 0.05% of the activity. The list of highly radioactive radionuclides (shown in Table 5) account for approximately 99% (see Appendix A) of the radioactivity in the TFF tank waste as of April 2005, based on process and sampling knowledge.
5.1.2 Radionuclides from Performance Assessment
As explained above, DOE has included in the list of highly radioactive radionuclides (shown in Table 5) those radionuclides that may be important to meeting the performance objectives of 10 CFR 61, Subpart C because they contribute to the dose to workers, the public, and/or the inadvertent intruder based on the TFF PA, which includes sensitivity and uncertainty analyses (DOE-ID 2003b). The DOE used the following approach in the PA to focus on those radionuclides that contribute to the dose for various pathways. The results of the PA show that 137mBa and 90Y should also be included in the list of highly radioactive radionuclides shown in Table 5.
5.1.2.1 Groundwater Radionuclide Screening. Screening of radionuclides and numerical modeling and dose assessment was performed to form the list of highly radioactive radionuclides. The TFF inventory includes several radionuclides that are significant in terms of projected receptor doses from the groundwater pathway. Therefore, screening analysis methods were investigated for use in the TFF PA to focus the groundwater analysis on highly radioactive radionuclides. The groundwater screening analysis considered that active institutional control will be maintained over the disposal site for 100 years after facility closure and, furthermore, that the performance of the facility will be monitored to detect and/or prevent significant releases of radionuclides to the environment throughout the period of active institutional control. This consideration eliminates from concern any radionuclide with a half-life of less than 5 years because the inventory in the waste at 100 years after facility closure will be reduced to innocuous levels by radioactive decay. However, radionuclides with half-lives of less than 5 years cannot
jj. Although Tables 1 and 2 in 10 CFR 61.55 specify concentration limits for certain radionuclides in the form of activated metal, DOE has included such radionuclides, if present in the waste, in the list of “highly radioactive radionuclides” as it exists in the waste, without regard to whether such radionuclides are in the form of activated metal. Consistent with Table 1, DOE has excluded alpha-emitting transuranic nuclides with half-lives of 5 years or less from the list of highly radioactive radionuclides. Some of the radionuclides listed as highly radioactive radionuclides in this 3116 Basis Document may not be listed in other 3116 Determinations if such radionuclides are not present in the waste or do not contribute to dose to the worker, the public, or the inadvertent intruder.

49
be neglected if the radionuclide appears in a decay chain. This is because its activity may increase with time due to decay of a parent radionuclide, unless the parent is also short-lived.
Table 5. List of highly radioactive radionuclides.
Radionuclide
Radionuclide Half-Life
(yr) Long-Term
Radiation Hazards Short-Term
Radiation Hazards 241Ama,b 4.30E+02 X 14Ca,b 5.70E+03 X 242Cmb,c 4.50E–01 X 60Cod 5.30E+00 X 137Csa,d 3.00E+01 X 137mBaa 4.90E–06 X 3Ha,d 1.20E+01 X 129Ia,b 1.60E+07 X 94Nbb 2.00E+04 X 59Nib 7.50E+04 X 63Nib 1.00E+02 X 237Npa,b 2.10E+06 X 238Pua,b 8.80E+01 X 239Pua,b 2.40E+04 X 240Pua,b 6.60E+03 X 241Pub,c 1.40E+01 X 242Pub 3.80E+05 X 90Sra,d 2.90E+01 X 90Ya 7.30E–03 X 99Tca,b 2.10E+05 X
a. Highly radioactive radionuclides based on dose assessment results from the 2003 PA (DOE-ID 2003b). b. Taken from Table 1 of 10 CFR 61.55. c. Daughter product of long-lived radionuclide. d. Taken from Table 2 of 10 CFR 61.55.
The use of the 5-year half-life screening criteria results in the elimination of the following
radionuclides from further consideration: 102Rh, 119mSn, 134Cs, 150Eu, 153Gd, 155Eu, 55Fe, and 171Tm. In addition, the following radionuclides in short decay chains were eliminated from further analysis since the parent and progeny each have half-lives of less than 5 years: 106Ru/106Rh, 109Cd/109mAg, 110mAg/110Ag, 125Sb/125mTe, and 144Ce/144mPr/144Pr. Additional radionuclides were screened from further consideration since their half-lives indicate that they are either stable or have such long half-lives that their specific activity, and thus contribution, to dose would be insignificant. These radionuclides include 142Ce (5.00E+16 yr), 149Sm (1.00E+15 yr), 144Nd (2.40E+15 yr), and 148Sm (2.00E+14 yr).
The screening procedure used for the TFF inventory was based first on the concentrations of radionuclides in the waste pore water that would give an annual effective dose equivalent of 4 mrem/yr from consumption of 70 oz/d (i.e., 200 gal/yr) of contaminated water. The 4-mrem/yr standard was used

50
for screening each nuclide because this portion of the screening process does not consider transport from the waste form to the groundwater. A total of 29 radionuclides were retained after screening using the pore water concentrations.
The next step in the screening process involved evaluation of the release of radionuclides from the waste form and the resulting groundwater concentrations. Releases and groundwater concentrations were previously analyzed by numerical modeling. The results are presented in Appendix F of the PA (DOE-ID 2003b). Based on these analyses, only 129I, 99Tc, and 90Sr were found to result in concentrations in groundwater that contribute significantly to doses (at least 99% of the all-pathways dose is attributable to these radionuclides).
The HLW and Facilities Disposition Final EIS (DOE 2002) also conducted screening and groundwater transport analyses for the TFF. Their screening and analyses found that only 99Tc and 129I resulted in significant doses from the groundwater pathway. Therefore, based on previous modeling of the TFF presented in Appendix F of the PA, radionuclides (i.e., 129I, 99Tc and 90Sr) were determined to result in appreciable groundwater concentrations and doses. Therefore, the groundwater analysis was focused on the three radionuclides and they were included in the list of highly radioactive radionuclides.
5.1.2.2 Intruder Pathway Radionuclide Screening. The intruder analysis considers that active institutional control will be maintained over the disposal site for at least 100 years after facility closure. This consideration eliminates from concern any radionuclide with a half-life of less than 5 years.
Using the 5-year half-life screening criteria results in the elimination of the following radionuclides from further consideration: 102Rh, 119mSn, 134Cs, 150Eu, 153Gd, 155Eu, 55Fe, and 171Tm. In addition, the following radionuclides in short decay chains were eliminated from further analysis since the parent and progeny each have half-lives of less than 5 years: 106Ru/106Rh, 109Cd/109mAg, 110mAg/110Ag, 125Sb/125mTe, and 144Ce/144mPr/144Pr. Additional radionuclides were screened from further consideration because their half-lives indicate that they are either stable or have such long half-lives that their specific activity and thus, contribution to dose, would be insignificant. These radionuclides include 142Ce (5.00E+16 yr), 149Sm (1.00E+15 yr), 144Nd (2.40E+15 yr), and 148Sm (2.00E+14 yr).
Dose assessment was then used to define the radionuclides that would be included in the intruder scenarios. The inclusion of radionuclides is explained in Section 5 of the PA (DOE-ID 2003b). A review of the PA shows the dose contribution by highly radioactive radionuclides was a factor of ten greater than the dose from the radionuclides excluded from further intruder scenario analysis. The air pathway analysis included 3H and 14C because these radionuclides are volatile or gaseous.
5.2 Removal to the Maximum Extent Practical
Section 3116(a) of the NDAA provides that certain waste resulting from reprocessing is not HLW if the Secretary, in consultation with the NRC, determines, among other things, that the waste has had highly radioactive radionuclides removed “to the maximum extent practical.”kk This subsection discusses the basis for the Secretary to conclude that DOE’s approach for removing the highly radioactive radionuclides listed above meets this criterion.
kk. Section 3116 does not specify “remedial goals” or other numerical objectives and does not require DOE to develop any such removal goals or objectives. Nevertheless, DOE notes, as discussed previously in this 3116 Basis Document, that the radioactive waste removal expectations (which were used in the TFF PA [DOE-ID 2003b]) were exceeded for each of the tanks cleaned to date.

51
Removal to the maximum extent “practical” is not removal to the extent “practical” or theoretically “possible.” Rather, a “practical” approach to removal is one that is “adapted to actual conditions” (Fowler 1930); “adapted or designed for actual use” (Random House 1997); “useful” (Random House 1997); selected “mindful of the results, usefulness, advantages or disadvantages, etc., of [the] action or procedure” (Random House 1997); fitted to “the needs of a particular situation in a helpful way” (Cambridge 2004); “effective or suitable” (Cambridge 2004). Therefore, the determination as to whether a particular highly radioactive radionuclide will be removed to the maximum extent practical will vary from situation to situation, based not only on the available technologies but also on the overall costs and benefitsll of deploying a technology with respect to a particular waste stream. The “maximum extent practical” standard contemplates room for exercising expert judgment in weighing several factors. Such factors may include environmental, health, timing, or other exigencies; the risks and benefits to public health, safety, and the environment arising from further radionuclide removal as compared with countervailing considerations that may ensue from not removing or delaying removal; the reasonable availability of proven technologies; the usefulness of such technologies; and the sensibleness of using such technologies. What may be removal to the maximum extent practical in a particular situation or at one point in time may not be that which, on balance, is practical, feasible, or sensible in another situation or at a prior or later point in time.
Although not an issue here, DOE notes that that it may not be practical to undertake any further removal of certain radionuclides because further removal is not sensible or useful in light of the overall benefit to human health or the environment. As a general matter, such a situation may arise if certain radionuclides are present in such extremely low quantities that they make an insignificant contribution to potential doses to workers, the public, and the hypothetical human intruder.mm
Highly radioactive radionuclides have been removed from the TFF tank system to the maximum extent practical by removing liquid waste from the TFF tanks for calcining operations (described in Subsection 2.2) and by SBW removal and tank cleaning activities. The same degree of radionuclide removal is expected for the four 300,000-gal tanks and ancillary equipment remaining to be cleaned.nn To demonstrate compliance with Section 3116(a)(2), the list of highly radioactive radionuclides identified in Subsection 5.1, the total inventory of radionuclides in the TFF waste stream, and the residual inventory at closure and disposal are used to determine the effectiveness of radionuclide removal. These radionuclides in the list of highly radioactive radionuclides in Table 5 are listed or referred to in 10 CFR 61.55, “Waste ll. While prior NRC and DOE requirements for waste determinations called for removal “to the maximum extent technically and economically practical” (Bernero 1993; DOE M 435.1-1, 2001), Section 3116 omits these adverbs, thereby suggesting that a broad range of considerations, including but not limited to technical and economic practicalities, may appropriately be taken into account in determining the extent of removal that is practical.
mm. The DOE normally would view radionuclides as making an insignificant contribution if the contribution to dose from those radionuclides, in both the expected case and fully degraded case using sensitivity analysis, does not exceed any of the following: (1) 10% of the 25-mrem/yr all-pathways annual dose to the public, (2) 10% of the DOE 100-mrem annual dose limit to the intruder (under all reasonable intruder scenarios), (3) 10% of the DOE 500-mrem acute dose limit to the intruder (under all intruder scenarios), and (4) 10% of the annual worker dose in the relevant provisions of 10 CFR 20. For perspective, DOE may also consider the extent to which such radionuclides contribute to an annual dose of 4 mrem to the receptor from the groundwater pathway. This methodology is based on NRC consultation and is intended to be consistent with the guidance and general approach in Volume 2 of NUREG-1757, Consolidated NMSS Decommissioning Guidance (NRC 2003b), which explains that “NRC staff considers radionuclides and exposure pathways that contribute no greater than 10% of the dose criteria to be insignificant contributors.” The above-reference NUREG, which applies to NRC licensees, is being used only as general guidance, and DOE’s use of this NUREG as guidance should not be construed to suggest that it is a requirement under Section 3116 of the NDAA or that either the NUREG or 10 CFR 20, Subpart E is applicable in the 3116 context.
nn. The same degree of removal is expected because the waste has not been and will not be radically altered. The particle size and density of the solids are not affected by tank-to-tank transfers during cleaning. Moreover, transfers between tanks have been a common practice in the past.

52
Classification,” are significant contributors to the PA dose calculations and contribute to the radionuclide inventory (DOE-ID 2006a). Further removal of the residual inventory is not practical, as discussed below.
The TFF tank system cleaning activities result in removal of radionuclides to the maximum extent practical. During tank cleaning activities for the 300,000-gal tanks, waste is removed from each tank in two phases, as described in Subsection 2.3.1.oo First, waste is removed using existing waste transfer equipment. Then, additional waste is removed using the tank cleaning system and modified waste transfer equipment. This second phase of waste removal continues until radiation levels near the steam-jet transport line decrease to the lowest constant value, indicating that the cleaning and waste transfer operations are no longer effective. Any remaining tank waste is regarded as waste residual. The inventory in the piping is insignificant (30 Ci) when compared to that of other system components (DOE-ID 2003b). The sandpad inventory is conservative, and no practical means exist to remove additional Ci from the sandpads that are located under the 300,000-gal tanks. A review of the tank construction and design, which includes access risers and the dimensions of the tank and sandpad, do not allow for removal of sand. The amount of radionuclides that have been flushed from the sand has not been measured directly and cannot be determined from the analysis of the liquid in the vaults because other sources (such as vault sumps) contribute to vault contamination. However, because of the numerous flushing events that have occurred, any additional cleaning by flushing would not provide a significant benefit. Therefore, tank cleaning is the only practical source for inventory reduction. Approximately 57% of the total system residual waste inventory at closure is expected to be contained in the fine layer of solids that is distributed unevenly over the bottom of the 300,000-gal tanks (see photographs in Figures 11 and 12) (Portage 2005a, 2005b, 2005c, 2005d, 2005e, 2005f, 2006a). The remaining 43% is attributed to the conservative estimated inventory (as discussed below) for the contaminated sandpads (WM-185 and WM-187).
The tank cleaning process is thorough, and the process is reviewed during cleaning to maximize effectiveness. Videotapes are reviewed by observing benchmarks in the bottom of the tanks. The support brackets for cooling coils (0.97 cm [0.38 in.]) or the welds in the bottom (0.32 cm [0.13 in.]) of the tank are compared to the depth (if any) of solid residual. Operators and supervisors work together to review videos of cleaning and to view real-time cleaning on cameras to maximize performance of the operators during the cleaning cycle. Cleaning activities are monitored using cameras and video recording. In addition, radiation levels are monitored on the steam-jet transport line to ascertain cleaning effectiveness. Monitoring the radiation levels near the transport line provides the cleaning system operators an indication of when tank cleaning should cease. As cleaning operations progress, the level of radiation observed near the transport line decreases asymptotically over time to a minimum radiation level that cannot be significantly reduced further with continued cleaning operations. When radiation levels decrease to this lowest constant value, cleaning is stopped, and the tanks are visually examined using remote video inspection. Use of the radiation monitor allows tank cleaning to proceed without repeated visual inspection or sample collection and aids in ensuring that as much waste as practical is removed from the tanks (Kimmitt 2002). Personnel review videotape of cleaning activities and compare the visual results to the radiation monitoring results to optimize solid residual removal in each tank. Based on observations made during tank cleaning activities performed to date, tank agitation by the directional nozzles is most effective when directional nozzles are used with approximately 5,000–7,000 gal of water in the tank for a short time (100–140 minutes). This technique ensures that solid particles are suspended in the liquid for a period comparable to the time required to remove the liquid and suspended solids by pumping (EDF-TST-001, 2000).
oo. As noted previously, removal of radionuclides occurs from a number of processes, including bulk removal of wastes and tank cleaning activities.
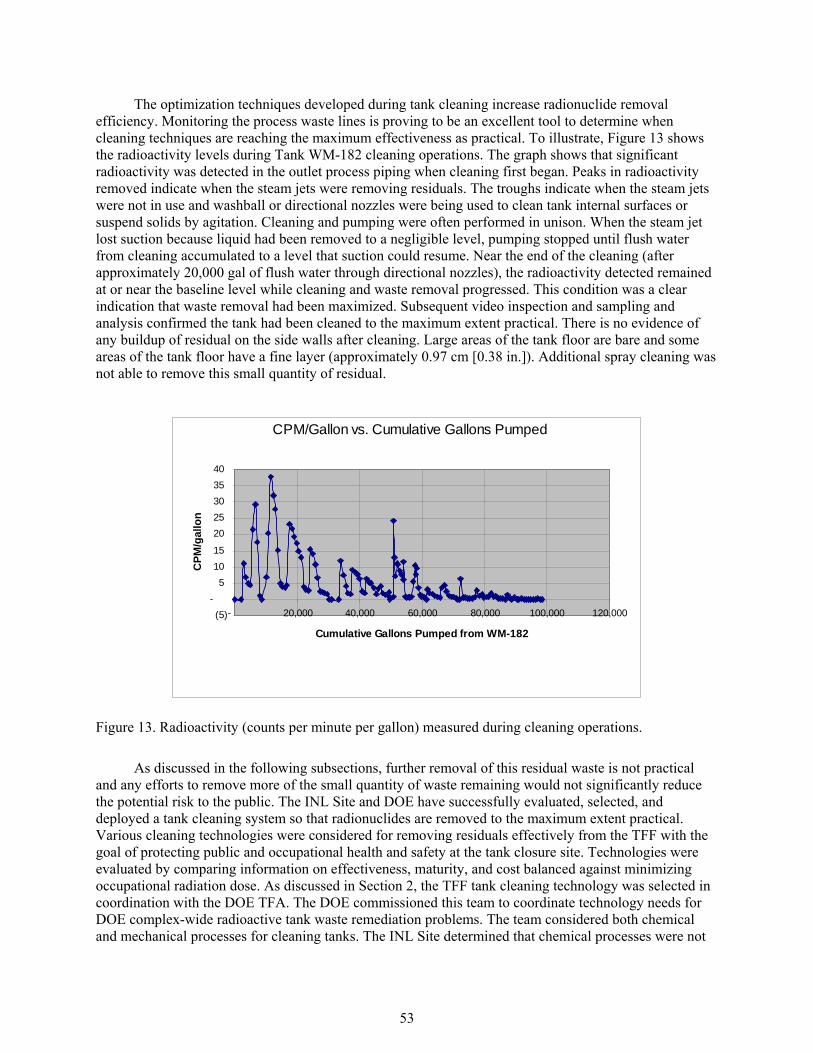
53
The optimization techniques developed during tank cleaning increase radionuclide removal efficiency. Monitoring the process waste lines is proving to be an excellent tool to determine when cleaning techniques are reaching the maximum effectiveness as practical. To illustrate, Figure 13 shows the radioactivity levels during Tank WM-182 cleaning operations. The graph shows that significant radioactivity was detected in the outlet process piping when cleaning first began. Peaks in radioactivity removed indicate when the steam jets were removing residuals. The troughs indicate when the steam jets were not in use and washball or directional nozzles were being used to clean tank internal surfaces or suspend solids by agitation. Cleaning and pumping were often performed in unison. When the steam jet lost suction because liquid had been removed to a negligible level, pumping stopped until flush water from cleaning accumulated to a level that suction could resume. Near the end of the cleaning (after approximately 20,000 gal of flush water through directional nozzles), the radioactivity detected remained at or near the baseline level while cleaning and waste removal progressed. This condition was a clear indication that waste removal had been maximized. Subsequent video inspection and sampling and analysis confirmed the tank had been cleaned to the maximum extent practical. There is no evidence of any buildup of residual on the side walls after cleaning. Large areas of the tank floor are bare and some areas of the tank floor have a fine layer (approximately 0.97 cm [0.38 in.]). Additional spray cleaning was not able to remove this small quantity of residual.
CPM/Gallon vs. Cumulative Gallons Pumped
(5)-
51015
2025303540
- 20,000 40,000 60,000 80,000 100,000 120,000
Cumulative Gallons Pumped from WM-182
CPM
/gal
lon
Figure 13. Radioactivity (counts per minute per gallon) measured during cleaning operations.
As discussed in the following subsections, further removal of this residual waste is not practical and any efforts to remove more of the small quantity of waste remaining would not significantly reduce the potential risk to the public. The INL Site and DOE have successfully evaluated, selected, and deployed a tank cleaning system so that radionuclides are removed to the maximum extent practical. Various cleaning technologies were considered for removing residuals effectively from the TFF with the goal of protecting public and occupational health and safety at the tank closure site. Technologies were evaluated by comparing information on effectiveness, maturity, and cost balanced against minimizing occupational radiation dose. As discussed in Section 2, the TFF tank cleaning technology was selected in coordination with the DOE TFA. The DOE commissioned this team to coordinate technology needs for DOE complex-wide radioactive tank waste remediation problems. The team considered both chemical and mechanical processes for cleaning tanks. The INL Site determined that chemical processes were not

54
practical because the TFF waste is acidic and adding other chemicals would be unlikely to increase waste removal efficiency. Some mechanical cleaning systems were found to be applicable, and high-pressure water systems (which slurry the solids) and mechanical arms would perform well in the TFF tanks. The washball and directional spray nozzle high-pressure water systems were determined practical for removing the small quantity of solids from the tank walls and for slurrying the solids on the tank bottoms. (See Appendix B for a discussion of the tank cleaning technology selection.)
5.2.1 Percentage of Radionuclides Removed
To quantitatively address how effective the waste removal techniques have been, a mass balance approach has been developed. Historically, radionuclides were removed from the total TFF waste stream by removing the liquid waste for the calcination process. The total inventory of radionuclides in the TFF waste stream has been identified and is provided in Generation, Disposition, and Current Inventory of Radionuclides in the INTEC Tank Farm (ICP 2005b). This inventory was identified by preparing a mass balance of radionuclides received from SNF reprocessing and sent to the TFF for storage and disposition. The mass balance relied on analytical data, numerical modeling, and data extrapolation to arrive at the total radioactivity present at INTEC from SNF reprocessing. The mass balance, which also considered nuclear material shipped to other DOE facilities for further processing, was used to determine the total radioactivity of waste generated from spent fuel reprocessing, which was 36 million Ci.
Table 6 shows the initial inventory of all waste at INTEC (decayed to 2012) from reprocessing by radionuclide; the estimated residual waste in the 300,000-gal tanks, 30,000-gal tanks, the two contaminated sandpads, and piping after cleaning at closure; and the percentage of radioactivity removed by treatment (calcination and tank cleaning), shipment of nuclear material, and radioactive decay to the date of tank closure (2012). This percentage is determined by comparing the initial INTEC inventory of the radioactivity (Ci) that has been sent to the TFF with the estimated residual inventory at closure. As discussed in Section 2, the residual inventory at closure relies on analytical data from samples obtained during recent tank cleaning operations. Cleaning in the remaining 300,000-gal tanks is assumed to be as effective as in those that have been cleaned already for the reasons explained earlier in this 3116 Basis Document. The physical properties (INEEL 2000b) of the solid residual are well known. Solids were effectively cleaned from the tanks. There is not any information that indicates the potential for the tank cleaning system to be ineffective in the remaining tanks (Portage 2005a, 2005b, 2005c, 2005d, 2005e, 2005f, 2006a, 2006b). More volume of water or a longer cleaning time may be necessary because of the amount of solids now stored in remaining tanks (with the exception of Tank WM-190). The residual inventory for the four tanks that have not been cleaned is represented by the estimated inventory in Tank WM-182 since it contains the highest residual inventory of any tank cleaned to date. Individual estimated tank inventories at closure are presented in Appendix A. Removal of residuals during tank cleaning activities has been demonstrated to be technically practical and efficient. The tank cleaning system has performed as designed and has achieved higher removal efficiencies than initially projected in the PA, as presented in Section A-2 of Appendix A.

55
Table 6. Percentage of highly radioactive radionuclides removed from all tanks and ancillary equipment.
Radionuclides Total Ci Generated
at INTEC Residual Ci in
Tanks at Closurea Percent Removed at
Closure 241Amb 9.28E+03 6.97E+00 99.92% 137mBab 8.95E+06 1.19E+04 99.87% 14C 2.91E–02 3.85E–05 99.87% 242Cm 1.51E+01 1.00E–02 99.93% 60Co 1.67E+03 4.79E–01 99.97% 137Csb 9.46E+06 1.19E+04 99.87% 129Ib 6.01E+00 5.87E–03 99.90% 3H 7.13E+03 5.43E+00 99.92% 94Nb 1.54E+03 1.60E+00 99.90% 59Ni 3.71E+03 1.90E–01 99.99% 63Ni 4.36E+05 2.17E+01 99.99% 237Npb 7.53E+01 3.57E–01 99.53% 238Pub 1.07E+05 9.08E+01 99.92% 239Pub 2.83E+03 2.90E+01 98.98% 240Pu 1.46E+03 1.09E+01 99.25% 241Pu 4.73E+04 1.52E+02 99.68% 242Pu 3.94E+00 7.60E–03 99.81% 90Srb 8.42E+06 6.78E+02 99.99% 99Tcb 3.67E+03 5.79E+00 99.84% 90Yb 8.42E+06 6.75E+02 99.99% Total (Ci)c 3.59E+07 2.58E+04 99.93%
a. Total Ci at closure includes 137mBa and 90Y and radionuclide decay to 2012. Based on: (1) heel residuals that are estimated using remote video inspection of cleaned tank internals to map out estimates of depth of remaining residual solids and liquids across tank bottoms using tank internal reference points of known height, (2) best estimated radionuclide concentrations from past and recent samples as calculated in the associated engineering design files (Portage 2005a, 2005b, 2005c, 2005d, 2005e, 2005f, 2006a, 2006b), and (3) radioactive decay to 2012. b. Radionuclides that are significant contributors to dose calculations in the 2003 TFF PA (DOE-ID 2003b). c. Radionuclides shown are contributors to the dose calculations or regulated by concentration limits in 10 CFR 61.55. The totals are based on the entire inventory of radionuclides.
Of the approximately 36 million Ci in 9.4 million gal of waste generated during spent fuel reprocessing operations, approximately 25,800 Ci are estimated to remain in the tank system following closure, representing about 0.07% of the initial spent fuel waste inventory. Approximately 92% of the total tank waste residual inventory at closure is represented by 137Cs/137mBa. The half-life of 137Cs is 30.17 years.
As discussed above, these values have been calculated by decaying the radionuclides to 2012, which is the projected end of closure activities. However, for perspective, if the inventory were to be calculated by decaying the radionuclides to the present, the total Ci remaining at closure would be somewhat higher, on the order of 30,000 Ci. The change is caused by 137Cs and 90S and their daughter products since these radionuclides account for the majority of the radioactivity, and they decay relatively quickly. Calculating these values assuming a decay date to the present results in a slightly higher estimate of total Ci remaining. However, if a table similar to Table 6 was constructed to show percent removed

56
values for current decay dates, the percent removed values would remain the same, because the relatively short-lived radionuclides would also increase in the INTEC inventory at the same rate as the TFF inventory based on the half-life of each radionuclide.
5.2.2 Cost of Developing a More Efficient Cleaning Technology
In an effort to analyze the cost and benefits to remove the relatively small amount of residual, a cost estimate is provided below. While cleaning began in 2002, development of technology and preparing supporting analysis began earlier. In 1998, a report was prepared that estimated the costs of various options for closure of the TFF (INEEL 1998). The estimate to develop a tank cleaning system without deployment was $46M (not escalated). The estimate was based on a tank cleaning system similar to the system deployed at the TFF. This estimate included the following items and associated costs shown in Table 7.
The expenditure for TFF closure activities from 1999 to 2005 is $35M. The $46M in expenditures to develop a new technology is presented for comparison to the $35M used in this analysis. Seven 300,000-gal tanks and four 30,000-gal tanks have been cleaned from 2002 to 2005.
Table 7. Cost estimate of TFF cleaning system (INEEL 1998).
Activity Estimate Cost
($M) Design of System 19.0 Proof of Process 5.8 Site Preparation 9.7 Characterization of Waste 4.6 Tank Isolation 7.0 Total 46.1
Development and deployment of a new technology is estimated to cost slightly more than
development and deployment of the existing tank cleaning system. The estimated cost is projected by simply using an escalation rate of 10%. Therefore, the estimate for development and deployment of a new technology is $38.5M. The cost would likely be much higher because the tank cleaning system that has been deployed at the TFF has used much of the existing equipment in the TFF, including the transfer piping (underground shielded piping and valve boxes), the transfer system (steam jets and steam lines), tank access (used existing risers), monitoring system (level detection, alarms, and radiation measurement meters), and the vessel off-gas system. A new system may not use all of the existing equipment. Modification to the TFF, if made for a new technology, would increase costs to deploy the system.
The access to tanks through existing risers is a limiting factor for deployment of a new technology. The risers are a maximum of 46 cm (18 in.) in diameter, with a maximum of five risers on any tank. Existing equipment currently in the risers decreases the available space in risers. The equipment includes instrumentation that cannot be readily removed. If new access must be designed that penetrates the soils, vault roof, and tank it would increase the cost considerably. Additional worker exposure from installation of new risers from tank contents and soils, plus contamination control, would add to costs. Additionally, excavation of soils was not necessary for the tanks already cleaned and it is not anticipated for the remaining four tanks. Weight restrictions on the surface of the TFF are also a concern. Multiple pieces of large equipment cannot be placed on the TFF if necessary to deploy a new cleaning technology.

57
The cleaning technology for the TFF has been designed to use existing systems and commercially available systems or parts. During the review of technologies for cleaning, all known general categories of cleaning technologies were examined. Some types of specific technologies have been designed for tanks at other DOE facilities. Technologies such as a robotic crawler are not viable because of the cooling coils on the bottom of many of the TFF tanks. Therefore, a new technology or a refinement of an existing technology would be developed, designed, tested (found to be more effective), and deployed to the TFF.
Deploying other tank cleaning technologies may delay closure of the TFF past 2012 with associated additional maintenance costs (this is not included in the estimated cost of $38.5M). A factor that also must be considered is that approximately 43% of the inventory in the TFF is not in the tanks but in the sandpads. Therefore, use of a new tank cleaning system can only potentially decrease the total TFF tank system inventory by approximately 57%.
Table 8 shows example efficiencies of a hypothetical tank cleaning technology up to a maximum of 60%. Also shown are the projected dose in mrem/yr of the all-pathways assessment, and the associated reduction in dose in mrem/yr. Table 8 also shows the cost per mrem of deploying a new technology.pp Even using the most efficient system (which cleans the tanks completely), the dose reduction for a 50-year period (50 years of exposure) is approximately 0.27 mrem/yr, and the cost per mrem reduction is approximately $2.8M.
Table 8. All-pathways dose reduction and cost per mrem. Efficiency of Technology
(%)
20 40 50 60 Dose (mrem/yr) 0.368 0.276 0.23 0.184 Dose reduction (mrem/yr) 0.092 0.184 0.23 0.276 Cost/mrem reduction $8,369,565.22 $4,184,782.61 $3,347,826.09 $2,789,855.07
Note: See Table 20, which presents the scaled groundwater all-pathways dose (0.46 mrem/yr).
The system design and testing that was used in this comparison was estimated at $38.5M. Based on other estimates (INEEL 1998), the cost could be approximately $50M if a 10% escalation was added.
5.2.3 Conclusions
Based on specific conditions, the INL Site determined that a limited number of technologies would effectively remove residuals from the tanks. The benefits of developing additional technologies, as well as complete tank removal, were evaluated for reducing residuals in the TFF. It is likely a system could be developed and deployed to remove the remaining residual by other remote means (INEEL 1998). However, initiating a long-term development project to develop other technologies would take many years to complete, and the project would be very costly (INEEL 1998). Although the cleaning to date has been successful, the small volume of residual certainly poses a direct radiation concern for anyone who would be in close proximity to the residual. No “hands-on” cleaning is practical and any new technology may require workers to contact the residual waste so worker exposure would increase while the projected
pp. On pages 51–53 of its TER (NRC 2006b), NRC noted that there were uncertainties in the metric that DOE used to quantify the cost of additional radionuclide removal in the tanks. However, the NRC agreed with DOE that additional radionuclide removal appears to have minimal benefit.

58
dose to the public from the residual waste, which is already low, would be lowered only slightly by using the new technology. In practice, during tank cleaning operations, even when the radiation monitor indicates that radioactivity levels are no longer decreasing and the videotape shows that the tank is clean, tank washing is continued for another day by flushing with several thousand gallons of water. Any appreciable decrease in the projected radiation dose to the public would be gained only if the TFF tank system is removed entirely.
Tank cleaning worker exposure is estimated to total approximately 650 mrem per tank for 23 workers (30 mrem per worker), which results in a total exposure of about 7.15 rem for eleven 300,000-gal tanks (Appendix B-5; Jacobson 2002). Tank removal worker doses are significant because the action would require a large project to excavate the tanks, cut them up, and package them for disposal. Worker exposure is estimated to be 1,070 mrem/yr/worker for an average of 326 workers/yr for an estimated 26 years for a total exposure of over 9,000 rem (Appendix B-5; INEEL 1998). Therefore, this option would be several billion dollars (INEEL 1998), cause more exposure, and result in radioactive waste for which disposal would be difficult or not possible.
As shown in Section 7, the remaining residuals, if left in place, pose a potential radiation dose to a member of the public on the order of 0.5 mrem/yr, and approximately half of this radiation dose is due to residuals in the tanks. Therefore, any new tank cleaning system could only achieve a reduction of approximately 0.25 mrem/yr, regardless of cost. With typical average doses to the public from natural sources and medical treatment in the range of 300–400 mrem/yr, it is not judged practical or cost effective to reduce the estimated dose from TFF by such a small amount.
Thus, for the reasons discussed previously, DOE has determined that highly radioactive radionuclides have been or will be removed from the TFF tank system to the maximum extent practical.qq
qq. On page 55 of its TER (NRC 2006b) NRC concluded, “There is reasonable assurance that Criterion Two of the NDAA can be met because:
• The estimated inventory developed for the tanks and sand pad in the performance assessment and validated through sampling for the tanks in the waste determination is reasonable for the purpose of evaluating compliance with NDAA criteria.
• NRC staff has confidence that HRRs [highly radioactive radionuclides] have been or will be removed to the maximum extent practical based on the evaluation of DOE’s selection of HRRs; DOE’s selection, implementation, and effectiveness demonstration for its preferred cleaning technology; and NRC staff’s evaluation of the costs and benefits of additional removal.”

59
6. RADIONUCLIDE CONCENTRATIONS OF STABILIZED WASTE
Key Points
• Concentrations of waste stabilized in grout were calculated for the closed tanks, vaults, and piping, and compared to the Class C concentration limits in 10 CFR 61.55.rr
• While DOE believes there is a reasonable basis to determine that none of the stabilized waste at the TFF will exceed the Class C concentration limits in 10 CFR 61.55, DOE, nevertheless, has consulted with NRC on its disposal plans in light of the calculated concentrations set forth in the draft 3116 Determination.
Section 3116(a) of the NDAA provides in pertinent part:
[T]he term “high-level radioactive waste” does not include radioactive waste resulting from the reprocessing of spent nuclear fuel that the Secretary of Energy …, in consultation with the Nuclear Regulatory Commission …, determines— …
(3)(A) does not exceed concentration limits for Class C low-level waste as set out in section 61.55 of title 10, Code of Federal Regulations, and will be disposed of—
(i) in compliance with the performance objectives set out in subpart C of part 61 of title 10, Code of Federal Regulations; and (ii) pursuant to a State-approved closure plan or State-issued permit, authority for the approval or issuance of which is conferred on the State outside of this section; or
(3)(B) exceeds concentration limits for Class C low-level waste as set out in section 61.55 of title 10, Code of Federal Regulations, but will be disposed of—
(i) in compliance with the performance objectives set out in subpart C of part 61 of title 10, Code of Federal Regulations, and (ii) pursuant to a State-approved closure plan or State-issued permit, authority for the approval or issuance of which is conferred on the State outside of this section; and (iii) pursuant to plans developed by the Secretary in consultation with the Commission.
Section 3116(a)(3) provides that, regardless of whether the waste exceeds or does not exceed the concentration limits for Class C LLW as set out in 10 CFR 61.55, the Secretary must determine that the waste will be disposed of in compliance with the performance objectives of 10 CFR 61, Subpart C and rr. The third criterion in Section 3116(a) references the Class C concentration limits in 10 CFR 61.55. Since the NRC regulations specifically allow averaging of the radionuclide inventory over the volume or weight of the waste [see 10 CFR 61.55(a)(8)], it is appropriate to consider average concentrations in the 3116 context. NRC agreed in its TER that concentration averaging is appropriate (see TER page 58) and this concept was also reflected in the State of Idaho comments.

60
that the waste will be disposed of in accordance with State-approved closure plans. In Section 7 of this 3116 Basis Document, information is presented that demonstrates that the waste will be disposed of in compliance with the performance objectives of 10 CFR 61, Subpart C. In Section 8 of this 3116 Basis Document, information is presented that demonstrates that the waste will be disposed of in accordance with State-approved closure plans. In situations where the waste is determined to exceed the concentration limits for Class C LLW, Section 3116(a)(3)(B)(iii) provides for consultation with NRC about the disposal plans for the waste.
As discussed in this section, the DOE has determined that under DOE’s disposal strategy the stabilized residuals in the TFF, and the TFF tank system, will not exceed the concentration limits for Class C LLW. Nevertheless, DOE has also completed the consultation process established by Section 3116(a)(3)(B)(iii) to take full advantage of the consultation process established by Section 3116. In this regard, DOE specifically requested in its draft 3116 Determination that NRC identify what changes, if any, NRC would recommend to DOE’s disposal plans (i.e., the actions DOE intends to undertake as described in the draft 3116 Determination and this 3116 Basis Document). In its TER, NRC explained that the extensive consultation process and review of DOE’s disposal plans satisfied Section 3116 (a)(3)(B)(iii) and that consequently no additional NRC consultation is needed. Therefore, this 3116 Basis Document demonstrates NDAA criteria in Section 3116 (a)(3)(A) and (a)(3)(B) will be met for the stabilized residuals in the TFF, and the TFF tank system. NRC and the State of Idaho have also stated their views that DOE’s extensive consultation with NRC meets the additional requirements for waste that could be greater than Class C waste.ss
Following submittal of the draft 3116 Determination to NRC in September 2005, the NRC released an FR notice, “Draft Interim Concentration Averaging Guidance for Waste Determinations” (70 FR 74846), for public comment.
The draft interim guidance introduces a concept of ratios of unstabilized-to-stabilized waste. The factor of ten is an approximation derived from a consideration that most stabilization techniques commonly envision use of cementitious materials, and most cementitious waste forms can readily achieve a 10% waste loading. For illustrative purposes, an analysis was performed using a ten-to-one ratio of unstabilized-to-stabilized waste mass. Such an analysis results in each of the 300,000-gal tanks exceeding Class C concentration limits. However, the ten-to-one ratio is a general goal that should take into account other considerations. Moreover, DOE notes that NRC found that it would be reasonable for DOE to determine that the residual waste would not exceed Class C concentration limits on the basis of a number of factors, including consideration of a less conservative inventory and consideration of additional volume or mass from the tank floors and walls, interstitial liquids, and liquid wastes.tt For other components of the ss. On page 62 of its TER (NRC 2006b) NRC concluded, “Based on this analysis NRC staff concludes that it is reasonable for DOE to find that the residual waste in the tanks, sand pads, and piping that is the subject of this waste determination does not exceed Class C concentration limits. However, NRC cannot confirm that all large tanks contain waste that is within Class C limits due to the uncertainty in the residual waste inventory. Section 3116(a)(3)(B)(iii) requires DOE to consult with the NRC in its development of disposal plans in cases where the waste exceed Class C concentration limits. In the draft waste determination for the INL TFF, DOE stated its intent to ‘take full advantage of the consultation process established by Section 3116’ and requested NRC to ‘identify what changes, if any, it would recommend to DOE’s disposal plans’ as described in the draft waste determination. NRC has reviewed DOE’s disposal plans for TFF waste as part of the extensive consultation process that is documented in this TER, thereby satisfying the requirements of Section 3116(a)(3)(B)(iii). Consequently, no additional DOE consultation with the NRC is required for tanks containing residual waste that could exceed Class C concentrations. Idaho DEQ has also stated its view that DOE’s extensive consultation with NRC meets the additional requirements for waste that could be greater than Class C [Trever 2006].”
tt. On page 59 of its TER (NRC 2006b) the NRC noted, “DOE Idaho did not exhaust all acceptable methods provided in the draft guidance for averaging the waste inventory over a large volume of grout…” Specifically, NRC noted that DOE Idaho did not take credit for the volume of liquid residuals that may remain in the tanks, for portions of the tank walls and floor, or for the

61
TFF tank system, using examples or extrapolation of examples from the guidance yields concentrations that are within Class C concentration limits as discussed in Subsections 6.2 through 6.5. (See Section D-1.2.2 in Appendix D for further discussion. See Appendix G for a comparison of the TFF final waste form calculation methodology to fundamental principles presented in the NRC draft interim guidance on concentration averaging.)
The rest of this section demonstrates that, by using assumptions and scenarios as appropriate and reasonable for the particular characteristics of the TFF, calculations of the sum of the fractions show that the TFF is within Class C concentration limits at closure and disposal.uu This demonstration takes into account consultations with NRC, including a revised evaluation of final waste form concentrations developed in response to an NRC RAI.
Several sensitivity evaluations are included in Appendix D to assess the impacts of variability of various parameters on concentration results. The sensitivity analyses vary grout volumes, inventories, and averaging methodologies to provide additional insight into these calculations and support the conclusion of a Class C waste determination.
6.1 300,000-gal Tanks
In calculating the radionuclide concentration, 10 CFR 61.55(a)(8) states that the radioactivity in the waste may be divided by the volume of the final waste form. Therefore, to calculate a waste concentration in these tanks, the estimate of final residual inventory discussed in Section 2 is divided by the volume of the final waste form. Videos and photographs of the tank walls show staining and discoloration, and no discernible buildup of residuals. Therefore, no source term for the tank walls was included in the tank inventory discussed in Section 2.
After cleaning is completed on each tank, the radionuclide inventory in the 300,000-gal tanks is in a dispersed layer across the tank bottom. The layer varies from 0.32 cm (0.13 in.) in thickness to near zero and is not concentrated in one specific location in the tank. The addition of grout for final closure is not expected to significantly mix with the residual waste or concentrate the radionuclide inventory. Mockup testing of grout placements (INEEL 1999b) in the tanks has shown that the resulting waste form will not be completely homogeneous; rather, the waste form will be a grouted monolith with some of the remaining residuals mixed in with the grout, some trapped between grout layers, and some encapsulated between the tank structure and the grout.vv
volume of interstitial liquids within the solid residuals. Although NRC noted uncertainties, NRC concluded that the waste from all of the 300,000-gal tanks could reasonably be found to not exceed Class C concentration limits (as noted on page 62 of the TER).
uu. The nature of the acidic waste and stainless steel tanks are unique to the DOE complex. Because the waste remained acidic, significant amounts of stiff, recalcitrant sludge do not remain in cleaned tanks. Methods used in this document to evaluate waste concentrations are not likely to be used in the same manner by other DOE sites because the characteristics of the waste and tanks, and the general characteristics of individual DOE sites, are different, which may lead to a variety of approaches for determination of waste concentrations within the concepts of the NRC draft interim guidance.
vv. Nevertheless, the resulting waste form may be considered “reasonably homogeneous,” as discussed in the Branch Technical Position on Concentration Averaging and Encapsulation (NRC 1995). The Branch Technical Position describes a reasonably homogeneous waste type as “one in which the radionuclide concentrations are likely to approach uniformity in the context of the intruder scenarios.” The TFF PA intruder scenarios include activities such as excavation into TFF piping and drilling into grouted tanks. The remaining residuals in the closed tanks would not be concentrated in any specific location in the tank. If such activities were to occur, they would, by their nature, result in a significant amount of additional mixing of grout, surrounding soils, and a relatively small volume of residuals. Therefore, the resulting inventory and dose would be similar regardless of where the drilling or excavations occurred within a specific tank. In this context, the TFF tanks will meet this definition of reasonably homogeneous
62
As described below, the engineered grout placement sequence to move remaining solids and liquids toward the removal pumps is estimated to use 85 m3 of grout. The function of the engineered grout placements is to provide additional assurance that the waste is being removed. The engineered grout placements also aid in the mixing of residuals with the grout. The engineered grout placements also provide a reducing environment. A final encapsulation pour of 140 m3 of grout is planned to level the engineering grout placement. A portion of the 140 m3 (33 m3) is used to stabilize the residual waste on the grout surface. The total volume of grout for this operation is 225 m3, which results in a layer of grout about 1.2 m (4 ft) thick from the tank floor; however, the total volume used for calculating whether the waste will exceed Class C concentration limits through concentration averaging is 118 m3 (see discussion in Section E-2 in Appendix E).ww The engineered grout placement sequence is described below.
The grout will be introduced through two available risers with specially designed grout masts. The first two placements go in directly below the available risers to a height of 0.9–1.2 m (3–4 ft). The purpose of the first two placements is to begin moving residuals toward the steam jet for removal and to provide troughs to direct placements 3 through 5 to the other areas of the tank. In the grout mockup (INEEL 1999b), these placements were successful in moving solid and liquid surrogate materials.
Placements 3 and 4 use the same riser access as placements 1 and 2, and displace the residuals between the tank wall and the steam jet. The purpose of placement 5 is to displace the residuals on the opposite side of the tank from the steam jet. These placements flow through the trough to sweep residuals toward the steam jet. Placement 5 may be replaced with two separate placements to allow better residual removal, but the purpose of the placement is the same. Figure 14 shows a schematic of the grout placements.
Based upon mockup results, some portion of remaining residuals is likely to be pushed to the steam jet and removed during grouting. Some of the residuals will likely remain trapped between the tank surfaces and the grout, some will be mixed within the grout, and some will remain on top of the engineered grout placements. A final encapsulation pour will then be used to ensure adequate immobilization of any remaining residuals.
To calculate a waste concentration in these tanks, the estimate of final residual inventory at closure is divided by the volume or mass of the final waste form.xx
when the residuals are stabilized with grout and the radionuclide concentrations of such a mixture would likely approach “uniformity.”
ww. On page 59 of the TER (NRC 2006b) the NRC stated, “…the estimated 85 m3 of grout for the engineered pour is just slightly higher than the volume of grout needed to meet Class C concentrations…” and that the NRC staff was “…concerned that DOE Idaho used an approach that can support the use of an excessive amount of grout for the purpose of waste classification without sufficient justification.” As discussed in detail in Appendix E of this document, the volume of grout necessary for the engineered pour was determined by extensive mockup demonstrations in 1999, prior to development of final tank inventory estimates in 2005 or possible final waste form concentrations. The quantity of grout was not designed to meet Class C concentrations, but to provide for effective tank closures.
xx. This approach is consistent with 10 CFR 61.55(a)(8), which states that the radioactivity in the waste may be divided by the volume or mass of the final waste form, and was not developed to justify Class C waste concentrations.

63
Figure 14. Schematic of the grout placement sequence.
6.1.1 300,000-gal Tank Waste Concentration
To determine the radionuclide concentration of the final waste form in the 300,000-gal tanks, a residual inventory of 2,394 Ci and a grout volume of 118 m3 were used as described in Appendix E. Tables 9 and 10 show the calculations of the residual inventory at closure for Tank WM-182 averaged over 118 m3 of grout.yy The mass of grout is equal to 2.48E+08 g (density of 2.1 g/cc). The Class C concentration limits for long- and short-lived radionuclides (Tables 1 and 2 of 10 CFR 61.55) are shown in Tables 9 and 10. To ensure conservatism in the analysis, the mass of tank steel is not used in these calculations.zz The sum of the fractions is shown for the Tank WM-182 grouted waste form. The other 300,000-gal tanks that have been cleaned have a lower residual waste inventory at closure than Tank WM-182 and are, therefore, bounded by these calculations. The residual inventory at closure for the 300,000-gal tanks does not take credit for any additional residuals that may be removed during grouting operations.
Long-lived radionuclides shown in Table 1 of 10 CFR 61.55 are the significant concentration limits for the TFF tanks (as described in Sections 3–5) and ancillary equipment. Concentrations of 238Pu and yy. On page 61 of its TER (NRC 2006b), the NRC noted that DOE did not list 244Cm in the tables of this section, although other alpha-emitting TRU isotopes with half-lives greater than 5 years are addressed. DOE did not list 244Cm since this isotope was not detected during analysis of the cleaned tanks and is not a significant contributor to risk (as NRC acknowledged on page 39 of its TER).
zz. For perspective, the results of calculations that include the mass of the tank steel are shown in Table D-3 (Appendix D) as part of a sensitivity evaluation.

64
239Pu contribute significantly to the sum of the fractions. A review of Table 10 shows that short-lived radionuclides do not affect the analysis for Class C waste concentration limits as the sum of the fractions is two orders of magnitude lower than the sum of the fractions for long-lived radionuclides.
The sum of the fractions for short-lived radionuclides (Table 2 of 10 CFR 61.55) in the vault is also two orders of magnitude lower than the sum of the fractions for long-lived radionuclides and the sum of the fractions for 30,000-gal tanks and piping are three to four orders of magnitude lower. Tables for short-lived radionuclides are shown in Appendix F.
Table 9. Radionuclide concentrations in the final Tank WM-182 grouted waste form (Table 1 of 10 CFR 61.55).
Tank Inventory Class C
Concentration Limit
Radionuclidea Half-Life
(yr) (Ci)b Ci/m3 nCi/g (Ci/m3 or nCi/g)
Fraction of Class C
Concentration Limit
241Am 4.30E+02 4.20E–01 1.70E+00 100 0.0170 14C 5.70E+03 5.00E–06 4.20E–08 8 0.0000000053 242Cm 4.50E–01 1.30E–03 5.30E-03 20,000 0.00000027 129I 1.60E+07 7.70E–04 6.60E–06 0.08 0.000082 59Ni 7.50E+04 2.50E–02 2.10E–04 220 0.00000097 94Nb 2.00E+04 2.10E–01 1.70E–03 0.2 0.0087 237Np 2.10E+06 4.70E–02 1.90E–01 100 0.00190 238Pu 8.80E+01 1.10E+01 4.60E+01 100 0.46 239Pu 2.40E+04 3.40E+00 1.40E+01 100 0.137 240Pu 7.00E+03 1.40E+00 5.50E+00 100 0.055 241Pu 1.40E+01 1.90E+01 7.90E+01 3,500 0.022 242Pu 3.80E+05 9.90E–04 4.00E–03 100 0.000040 99Tc 2.10E+05 7.60E–01 6.50E–03 3 0.0022 Sum of the Fractions 0.71
a. Radionuclides shown in italics are compared to Class C concentration limits in units of Ci/m3 ; remaining nuclides are compared to limits in units of nCi/g. b. Radioactive decay to 2012; the sum of the fractions will not significantly change if decayed to the present.
Table 10. Radionuclide concentrations in the final Tank WM-182 grouted waste form (Table 2 of 10 CFR 61.55).
Half-Life Tank Inventory Class C Concentration Limit Radionuclide (yr) (Ci)a Ci/m3 (Ci/m3)
Fraction of Class C Concentration Limit
137Cs 3.00E+01 1.10E+03 9.70E+00 4,600 0.0021 63Ni 1.00E+02 2.90E+00 2.40E–02 700 0.000035 90Sr 2.90E+01 2.30E+01 2.00E–01 7,000 0.000028 Sum of the Fractions 0.0022
a. Radioactive decay to 2012; the sum of the fractions will not significantly change if decayed to the present.
The sum of the fractions from Tables 9 and 10 is 0.71 and 0.0022, respectively. Based on the results of these tables and a review of the data and assumptions, the residuals in the 300,000-gal tanks would not exceed Class C concentration limits.

65
6.1.2 Summary and Conclusions
At closure and disposal, the stabilized residuals in the 300,000-gal tanks would not exceed Class C concentration limits. The basis for this is the completion of waste concentration tables as described in 10 CFR 61.55.
Additional sensitivity evaluations and operational constraints described in Appendix D provide reasonable scenarios for waste concentration calculations. For perspective, an analysis was also performed using a ten-to-one ratio of unstabilized-to-stabilized waste mass, which showed that each of the 300,000-gal tanks exceeds Class C concentration limits. However, as discussed in Section D-2.1.2 of Appendix D, such an approach is not appropriate or reasonable for calculating final waste concentrations at the TFF. The scenarios that have been developed, as appropriate and reasonable for the particular characteristics of the TFF tank system, all have a sum of the fractions of less than 1.
6.2 300,000-gal Tank Vaults
The tank secondary containment system consists of the tank vaults and sandpads, and is discussed together in this subsection. An inventory has not been developed for the tank vaults because solids are not present in the vaults and liquid is confined to the volume of the sump. Generally, the sumps are 0.3- by 0.3-m (1- by 1-ft) concrete enclosures in the vault bottom. Some of the sumps are slightly larger. Any residual inventory at closure for the vaults is considered negligible when compared to the sandpad inventory.
For the vaults around the 300,000-gal tanks, contamination of the vault surfaces is from liquid releases from valves boxes or directly from the tanks. As discussed in Section 2, the tanks have never leaked into the vaults. Waste entered the vaults directly from the tanks only twice from Tanks WM-185 and WM-187 during back-siphoning events. Typically, vaults have contained contaminants from only two sources, secondary containment of process piping and valve boxes. Process piping and valve leaks are infrequent occurrences. In the event of a leak, the system of liquid level indicators and radiation detection instruments would alert operators of a leak and the contamination would be removed well before the volume of the vault sump (volume is approximately 0.3 m3) was exceeded. Therefore, such sources contributed only minor amounts of contamination. Additionally, vaults collected water from precipitation events or snowmelt. This water entered the vault from the vault top, which is made of pre-stressed concrete slabs that were never designed to prevent water inflow. Vaults associated with the cleaned tanks have been flushed and sampled. Solids were not expected in the tank vaults and solid samples were not collected. Solids were not expected because waste was not contained in any vault for a long period of time. Vaults for Tanks WM-185 and WM-187 did hold several thousand gallons of waste from a back-siphoning event in each vault in 1962. The waste was removed from each vault within 24 hours after each event began.
During recent cleaning operations, the tank vaults were flushed with water during the cleaning process, but access to the vaults did not allow for the aggressive cleaning and agitation that was performed in the tanks. Sampling from the vault sumps may have contributed to elevated radionuclide concentrations in liquid samples, as discussed below. The vault sumps are the low points in the vaults designed to capture leaks from valve boxes and to allow removal of infiltration from precipitation and waste as necessary. The vault sumps were never emptied completely because the steam jets are approximately 5 cm (2 in.) from the sump floor. Therefore, residual contamination in the sump may have biased the sample concentrations. No solids have been observed in the tank vaults other than debris. Liquids do not collect in the vault because the floors are sloped toward vault sumps. After cleaning, the water used to flush the vaults was pumped out using the steam jets in vault sumps. The sumps are generally 0.3 m (1 ft) square (some vaults have larger sumps). Review of the sampling data shows that the

66
concentrations of radionuclides in liquid vault samples do not exceed the liquid concentration of the cleaned tanks.
A realistically conservative engineering analysis is used to estimate the contamination remaining in the sandpads because sampling the sandpads is not technically feasible and no sandpad sampling data exist. Since the sandpads are located directly beneath the tanks, any useful sampling would require a task equal to complete tank removal given the limited access.aaa The engineering analysis indicates radionuclides from the early contamination events remain absorbed to the sand despite multiple washings (DOE-ID 2003b). Cleaning the sandpad is not practical given the limited access and location of this sand. The commercial-grade sand in the sandpads is in solid physical form and will be surrounded by the vault, the grout, and the tank (filled with grout).bbb
The vault will be filled completely with grout. Incremental steps in the grout fill will accomplish covering the sandpad by making grout pours through the two available risers, filling to level the initial grout pour, and finally filling the entire vault. A minimum grout height of 1 m (3 ft) is necessary to allow the grout to flow around the vault and rise to a level of at least 46 cm (18 in.) above the grout floor. The 46-cm (18-in.) height is desirable because the sandpad and associated dike are 15 cm (6 in.) above the floor and approximately 46 cm (18 in.) level, which will ensure encapsulation of the sandpad. Grout poured into the vault will fill the area surrounding the sandpads, leaving no voids and providing structural integrity to the sandpads. Liquid entering the vault system will be drained from the vault sump prior to closure. Grouting of the vault area surrounding the sandpad will incorporate any remaining liquids. The inventories of the vaults are insignificant when compared to the sandpad because very little liquid remains in the vault sumps and no solid residual is present.
The residual inventory at closure for the sandpads was presented in Section 2. The calculations in Tables 11 and 12 are based on a total sandpad volume of 23.39 m3 (Staiger 1999) and the mass of the sandpad and vault grout (65 m3 or 1 m [3 ft] high in a typical vault) of 136,500 g. Tables 11 and 12 show the radionuclide concentrations in the grouted vaults. For reference, the Class C concentration limits for long- and short-lived radionuclides (Tables 1 and 2 of 10 CFR 61.55) are also shown.
The radionuclide 59Ni is not included in the sandpad inventory. The initial amount of each radionuclide in the tanks that was back-siphoned to the vault and contacted the sandpad at the time of the accidental spills was evaluated using limited analytical data and ORIGEN2. The ORIGEN2 data were corrected to the 137Cs concentration in Tank WM-185 1 month before the incident. Tank WM-185 was used because of its slightly higher 137Cs concentration than in Tank WM-187. However, this ORIGEN2 modeling did not include the activation product 59Ni. The concentration of 59Ni in the sandpads will not affect the comparisons made in Tables 11 and 12 because 59Ni is typically found in very low concentrations as evidenced by the concentrations in the tanks and piping.
aaa. In DOE’s response to NRC’s RAI Comment 1 (ICP 2006l), the difficulty in direct sampling of the sandpads was discussed. On page 36 of its TER (NRC 2006b), NRC concluded, “…DOE Idaho made a good faith effort to evaluate the uncertainty in the sand pad inventory through additional sensitivity and uncertainty analysis, modeling, and analysis of indirect sampling data.”
bbb. The sandpads are part of the tank ancillary equipment and are not considered to be contaminated media outside of the tank system.

67
Table 11. Radionuclide concentrations in the grouted vaults (Table 1 of 10 CFR 61.55).
Radionuclidea Half-Life
(yr)
Sandpad Inventory
(Ci)b
Sandpad Inventory in Ci/m3
Sandpad Inventory in nCi/g
Class C Concentration
Limit (Ci/m3 or nCi/g)c
Fraction of Class C Concentration
Limit 241Am 4.30E+02 1.90E+00 1.40E+01 100 0.14 14C 5.70E+03 3.90E–07 6.00E–09 8 0.00000000075 242Cm 4.50E–01 1.40E–05 1.00E–04 20,000 0.0000000051 129I 1.60E+07 1.10E–06 1.70E–08 0.08 0.00000021 94Nb 2.00E+04 2.30E–02 3.50E–04 0.2 0.0018 237Np 2.10E+06 3.70E–04 2.70E–03 100 0.000027 238Pu 8.80E+01 2.10E+00 1.50E+01 100 0.15 239Pu 2.40E+04 1.60E+00 1.20E+01 100 0.12 240Pu 7.00E+03 3.50E–01 2.60E+00 100 0.026 241Pu 1.40E+01 2.30E+00 1.70E+01 3,500 0.0048 242Pu 3.80E+05 5.70E–05 4.20E–04 100 0.0000042 99Tc 2.10E+05 2.00E–12 2.10E–15 3 0.00000000000000071 Sum of the Fractions 0.44
a. Radionuclides shown in bold italics are concentration limits in units of Ci/m3; remaining nuclides are concentration limits in units of nCi/g. b. Radioactive decay to 2012; the sum of the fractions will not significantly change if decayed to the present. c. Table 1 of 10 CFR 61.55.
Table 12. Radionuclide concentrations in the (Table 2 of 10 CFR 61.55) grouted vaults (DOE-ID 2003b).
Radionuclide Half-Life
(yr) Sandpad Inventory
(Ci)a
Sandpad Inventory in
Ci/m3
Class C Concentration Limit
(Ci/m3)b
Fraction of Class C
Concentration Limit
137Cs 3.00E+01 1.60E+03 2.50E+01 4,600 0.00543 63Ni 1.00E+02 1.70E–10 2.60E–12 700 3.71E–15 90Sr 2.90E+01 2.50E+02 3.80E+00 7,000 0.000543 Sum of the Fractions 0.00597
a. Radioactive decay to 2012; the sum of the fractions will not significantly change if decayed to the present. b. Table 2 of 10 CFR 61.55.
Further uncertainty analysis of the sandpad inventory is provided in DOE’s responses to NRC RAI
Comments 1, 3, and 4 (ICP 2006l). The sandpad and small amount of residuals in the vault will be stabilized using grout, which can be introduced into the vault in only two places, the risers over the north and south vault sumps. Sufficient grout must be added to fill the vault floor and contain the sandpad.ccc
ccc. The data or assumptions used in the calculations include the following:
1. The volume of grout equals 32.5 m3 (INEEL 2000a).
2. The volume of the sandpad equals 23.6 m3 (DOE-ID 2003b).
3. The mass of grout equals 6.83E+07 g (DOE-ID 2003b).

68
The calculations for the sum of the fractions shown above assumed a 1-m grout pour and an inventory of 3,850 Ci. The ratio of long- to short-lived radionuclides in the sandpad inventory is different than in the tank inventory. That scenario assumed the vault has been leveled to a 1-m (3-ft) depth. For purposes of vault waste concentration calculations, an alternative is to use a 1-m (3-ft) deep pour to ensure the grout has been able to flow around the vault and achieve a minimum depth of 0.5 m (1.5 ft) at the opposite side of the vault. The volume of grout in this scenario has been calculated to be 32.5 m3.
The sum of the fractions for this scenario is 0.51 as shown in Table 13. This alternative scenario reduces the amount of grout used in encapsulation and provides an alternative to a 1-m (3-ft) deep grout pour in the vault. This alternative reflects the fact that grout is not self-leveling in the tank vaults, which have a circumference of 48 m (157 ft). Additional alternatives to describe the performance of grout in smaller quantities are not shown because 32.5 m3 is the lowest volume of grout that can be used to ensure the sandpad is encapsulated. Because only two risers are available and the access through these risers is limited, video confirmation of sandpad encapsulation is not possible. Calculated volumes of grout with expected flow characteristics are used rather than video confirmation.
Table 13. Sum of the fractions for 32.5 m3 of grout in the tank vault (Table 1 of 10 CFR 61.55). Conservative Tank
Inventory Class C
Concentration Limit Radionuclidea
Half-Life (yr) (Ci)b Ci/m3 nCi/g (Ci/m3 or nCi/g)
Fraction of Class C Concentration Limit
241Am 4.30E+02 1.90E+00 1.60E+01 1.00E+02 1.60E–01 14C 5.70E+03 3.90E–07 6.96E–09 8.00E+00 8.70E–10 242Cm 4.50E–01 1.40E–05 1.17E–04 2.00E+04 5.87E–09 129I 1.60E+07 1.10E–06 1.93E–08 8.00E–02 2.41E–07 94Nb 2.00E+04 2.30E–02 4.09E–04 2.00E–01 2.04E–03 237Np 2.10E+06 3.70E–04 3.15E–03 1.00E+02 3.15E–05 238Pu 8.80E+01 2.10E+00 1.75E+01 1.00E+02 1.75E–01 239Pu 2.40E+04 1.60E+00 1.33E+01 1.00E+02 1.33E–01 240Pu 7.00E+03 3.50E–01 3.00E+00 1.00E+02 3.00E–02 241Pu 1.40E+01 2.30E+00 1.93E+01 3.50E+03 5.53E–03 242Pu 3.80E+05 5.70E–05 4.82E–04 1.00E+02 4.82E–06 99Tc 2.10E+05 2.00E–12 3.60E–14 3.00E+00 1.20E–14 Sum of the Fractions 0.51
a. Radionuclides shown in italics are compared to Class C concentration limits in units of Ci/m3 ; remaining nuclides are compared to limits in units of nCi/g. b. Radioactive decay to 2012; the sum of the fractions will not significantly change if decayed to the present.
4. The mass of the sandpad equals 4.14E+07 g (DOE-ID 2003b).
5. The inventory was estimated using the ORIGEN2 numerical model. A total of 3,850 Ci is in the WM-185 sandpad inventory (DOE-ID 2003b).
6. The 137Cs data collected from Tank WM-185 just prior to the back-siphoning events were used in the ORIGEN2/Wenzel ratios. A 137Cs concentration of 1.7 Ci/L was measured in 1962 (Latchum et al. 1962).
7. A grout with a density of 2.1 g/cc was used in the calculation (INEEL 2000a).

69
6.2.1 Summary and Conclusions
At closure and disposal, the 300,000-gal tank vaults would not exceed Class C concentration limits. The basis for this is the completion of the waste concentration tables as described in 10 CFR 61.55.
Encapsulation of the sandpad material and any other vault contamination can be performed only by making grout pours in two available risers. The access and operational constraints allow for grout to be introduced, mound in the location directly under the access risers, and flow in the annular space until a level of 0.3–0.46 m (0.9–1.5 ft) is reached in all locations of the vault. This ensures encapsulation of the sandpad contamination. This volume of grout is necessary because video inspection to ensure the grout has reached a minimum depth is not practical because of operational and physical limitations. A calculated volume must be used to ensure the sandpad is encapsulated. Additional grout (not used in the sum of the fractions calculations) will be used to continue to fill the vaults until the level is approximately 1 m deep, and ultimately, completely filled.
6.3 30,000-gal Tanks
The residuals remaining in each 30,000-gal tank contains approximately 36 Ci, which is approximately 1.5% of the residual inventory in a typical 300,000-gal tank. As discussed in Section 2, the residual inventory at closure for the 30,000-gal tanks assumes that each tank has a 5-mil (0.005-in.) thick film on the lower half of the tanks. The 5-mil (0.005-in.) thickness was used as a conservative estimate since solid samples were not collected because of a lack of material to sample. The tanks had not contained acidic waste for at least 20 years, and the heat from the steam valve condensate allowed the development of what appeared to be a biological film on the tanks. However, this film could not be sampled to determine the radionuclide concentrations. Therefore, conservative thickness and radionuclide concentrations assumptions are used. For the radionuclide concentrations in this film layer, the analytical results from the solid samples from Tank WM-183 in Ci/kg are applied to this mass of solid material. The liquid residuals were sampled and analyzed as discussed in Section 2. Liquid sampling results averaged are approximately 0.23 Ci in liquids with 36.1 Ci of solid residual.
During grouting operations, the tanks will be filled to the midway point initially because the thin film observed in the tanks does not extend beyond the bottom half of the tank. This grout pour will be performed to contain the residual on the tank wall. These tanks will be filled completely with grout prior to closure. Since the bottom area of a horizontal, cylindrical tank is relatively small compared to a flat-bottomed tank, and minimal residuals remain in the tank bottom, the multi-point grout placement technique planned for the 300,000-gal tanks will not be necessary for these tanks.
The volume of grout needed to fill the tanks to the half of the volume is 58 m3 with a density of 2.1 g/cm3. Since the tank is considered to be part of the final waste form, the mass of the stainless steel tank is included in the concentration averaging calculation. Only stainless steel mass that encloses the engineering grout pour (half of the tank) is applied to the calculation. Tables 14 and 15 show the calculations of the residual inventory at closure for a 30,000-gal tank averaged over 58 m3 of grout (with a density of 2.1 g/cm3). For reference, the Class C concentration limits for long- and short-lived radionuclides (Tables 1 and 2 of 10 CFR 61.55, respectively) are also shown.

70
Table 14. Radionuclide concentrations in a final 30,000-gal tank grouted waste form (Table 1 of 10 CFR 61.55).
Radionuclidea Half-Life
(yr)
Average 30,000-gal
Tank Inventory (Ci)b
Average 30,000-gal
Tank Inventory in
Ci/m3
Average 30,000-gal
Tank Inventory in
nCi/g
Class C Concentration
Limit (Ci/m3 or nCi/g)c
Fraction of Class C
Concentration Limit
241Am 4.30E+02 6.40E–03 4.90E–02 100 0.00049 14C 5.70E+03 1.10E–07 1.90E–09 8 0.00000000024 242Cm 4.50E–01 2.00E–05 1.50E–04 20,000 0.0000000077 129I 1.60E+07 1.20E–05 2.00E–07 0.08 0.0000025 94Nb 2.00E+04 3.10E–03 5.30E–05 0.2 0.00027 59Ni 7.50E+04 3.80E–04 6.50E–06 220 0.000000030 237Np 2.10E+06 7.10E–04 5.50E–03 100 0.000055 238Pu 8.80E+01 1.70E–01 1.30E+00 100 0.013 239Pu 2.40E+04 5.10E–02 4.00E–01 100 0.0040 240Pu 7.00E+03 2.00E–02 1.60E–01 100 0.0016 241Pu 1.40E+01 2.90E–01 2.30E+00 3,500 0.00065 242Pu 3.80E+05 1.50E–05 1.10E–04 100 0.0000011 99Tc 2.10E+05 1.20E–02 2.00E–04 3 0.000066 Sum of the Fractions 0.020
a. Radionuclides in bold italics are concentration limits in units of Ci/m3; remaining nuclides are concentration limits in units of nCi/g. b. Radioactive decay to 2012; the sum of the fractions will not significantly change if decayed to the present. c. Table 1 of 10 CFR 61.55.
Table 15. Radionuclide concentrations in a final 30,000-gal tank grouted waste form (Table 2 of 10 CFR 61.55).
Radionuclidea Half-Life
(yr)
Average 30,000-gal Tank Inventory
(Ci)a
Average 30,000-gal
Tank Inventory in Ci/m3
Class C Concentration
Limit (Ci/m3)b
Fraction of Class C
Concentration Limit
137Cs 3.00E+01 1.70E+01c 3.00E–01 4,600 0.00006 63Ni 1.00E+02 4.30E–02 7.40E–04 700 0.0000011 90Sr 2.90E+01 4.50E–01c 7.80E–03 7,000 0.0000009 Sum of the Fractions 0.00007
a. Radioactive decay to 2012; the sum of the fractions will not significantly change if decayed to the present. b. Table 2 of 10 CFR 61.55. c. Radioactivity for 137Cs (137Ba) and 90Sr (90Y) daughters are not shown in this table.
An alternative to this is evaluated that would simply use the mass of steel for half of the tank. Since
the residual contamination is almost entirely associated with the film on the lower half of the tank wall, the mass of steel for half of the tank is the appropriate mass and volume of steel. The stainless steel walls are 11/16 in. thick and the mass of this amount of steel is 2.07E+07 g. Using the mass of steel and no added grout, the sum of the fractions is well below unity. Table 16 shows the sum of the fractions for long-lived radionuclides using the mass of steel for half of a 30,000-gal tank.

71
No analysis was performed for the 30,000-gal tanks using a ten-to-one ratio of unstabilized-to-stabilized waste mass, since the calculations of final waste form concentrations did not use any stabilizing material. Only the mass of the tank steel was used in these calculations.
Table 16. Sum of the fractions for 30,000-gal tanks using only the mass of steel (Table 1 of 10 CFR 61.55).
Conservative Vault Inventory
Class C Concentration Limit
Radionuclidea Half-Life
(yr) (Ci)b Ci/m3 nCi/g (Ci/m3 or nCi/g)
Fraction of Class C
Concentration Limit
241Am 4.30E+02 6.40E–03 3.07E–01 1.00E+02 3.07E–03 14C 5.70E+03 1.10E–07 4.27E–08 8.00E+00 5.34E–09 242Cm 4.50E–01 2.00E–05 9.62E–04 2.00E+04 4.81E–08 129I 1.60E+07 1.20E–05 4.54E–06 8.00E–02 5.68E–05 59Ni 7.50E+04 3.80E–04 1.47E–04 2.20E+02 6.68E–07 94Nb 2.00E+04 3.10E–03 1.21E–03 2.00E–01 6.03E–03 237Np 2.10E+06 7.10E–04 3.43E–02 1.00E+02 3.43E–04 238Pu 8.80E+01 1.70E–01 8.34E+00 1.00E+02 8.34E–02 239Pu 2.40E+04 5.10E–02 2.49E+00 1.00E+02 2.49E–02 240Pu 7.00E+03 2.00E–02 9.86E–01 1.00E+02 9.86E–03 241Pu 1.40E+01 2.90E–01 1.42E+01 3.50E+03 4.07E–03 242Pu 3.80E+05 1.50E–05 7.21E–04 1.00E+02 7.21E–06 99Tc 2.10E+05 1.20E–02 4.48E–03 3.00E+00 1.49E–03 Sum of the Fractions 0.13
a. Radionuclides shown in italics are compared to Class C concentration limits in units of Ci/m3; remaining nuclides are compared to limits in units of nCi/g. b. Radioactive decay to 2012; the sum of the fractions will not significantly change if decayed to the present.
6.3.1 Summary and Conclusions
At closure and disposal, the radioactive waste concentration for the 30,000-gal tank waste meets Class C concentration limits.ddd The basis for this is the completion of waste concentration tables as described in 10 CFR 61.55. As shown in the alternative concentration for the 30,000-gal tanks, the tank steel alone provides adequate mass and volume to produce concentrations of radionuclides that are well below the Class C concentration limits. Encapsulation grout to fill half of the tank is desirable to contain the residual waste that remains.
6.4 Grouted Piping, Encasements, and Valve Boxes
Like the other TFF system components, the TFF ancillary components and equipment (e.g., piping, encasements, valves, and valve boxes) will be grouted at final closure (i.e., disposal). The grout will provide a solid physical form to incorporate any residuals and to prevent their dispersal into the surrounding environment. The piping and ancillary equipment grout must necessarily be able to flow more easily during grouting operations, and consequently, this grout will have a higher water content than the grout mixture used for other TFF system components. However, the grout will still be able to harden into a solid physical form to provide waste stability. The pour process will be adjusted so that effective ddd. On page 62 of its TER (NRC 2006b), NRC concluded that the waste in the smaller (30,000-gal) tanks, sandpads, and piping would not exceed the Class C concentration limits.

72
grout distribution through the piping, encasements, and other equipment is achieved. Characteristics of the grout are presented in Appendix C, along with the required QA tests and results from grout testing.
To develop waste concentrations in the grouted piping, the residual inventory at closure for the piping presented in Section 2 (15.5 kg of SBW solids) is averaged over the 3,231 linear m (10,600 linear ft) of 5-cm (2-in.) piping (EDF-2973, 2001). Tables 17 and 18 show the radionuclide concentrations of the grouted piping. For reference, the Class C concentration limits for the long- and short-lived radionuclides are also shown. For perspective, Tables A-13 and A-14 in Appendix A show the radionuclide concentrations of the piping without adding grout to the pipe. In this case, the waste form is assumed to be Schedule 40 stainless steel pipe and the associated radioactive contamination. Tables 17 and 18 include the mass and volume of the stainless steel piping and the mass and volume of the grout in the calculations while Tables A-13 and A-14 include only the mass and volume of the piping. The entire mass of stainless steel piping is included in the calculations.
The valve boxes and encasements contain significantly less contamination after cleaning than the process piping (as described in Subsection 2.4.5). Therefore, the radionuclide concentrations in the valve boxes and encasements after closure would be less than those shown for the piping.
Table 17. Radionuclide concentrations in the piping (with grout) (Table 1 of 10 CFR 61.55).
Radionuclidea Half-Life
(yr)
Piping Inventory
(Ci)b
Piping Inventory in Ci/m3
Piping Inventory in nCi/g
Class C Concentration
Limit (Ci/m3 or nCi/g)c
Fraction of Class C
Concentration Limit
241Am 4.30E+02 5.30E–03 1.70E–01 100 0.0017 14C 5.70E+03 6.20E–08 7.10E–09 8 0.00000000089 242Cm 4.50E–01 1.70E–05 5.30E–04 20,000 0.000000026 129I 1.60E+07 9.70E–06 1.10E–06 0.08 0.000014 94Nb 2.00E+04 2.60E–03 2.90E–04 0.2 0.0015 59Ni 7.50E+04 3.10E–04 3.60E–05 220 0.00000016 237Np 2.10E+06 5.90E–04 1.90E–02 100 0.00019 238Pu 8.80E+01 1.40E–01 4.60E+00 100 0.046 239Pu 2.40E+04 4.30E–02 1.40E+00 100 0.014 240Pu 7.00E+03 1.70E–02 5.40E–01 100 0.0054 241Pu 1.40E+01 2.40E–01 7.80E+00 3,500 0.0022 244Pu 3.80E+05 1.20E–05 4.00E–04 100 0.0000040 99Tc 2.10E+05 9.60E–03 1.10E–03 3 0.00036 Sum of the Fractions 0.071
a. Radionuclides shown in bold italics are concentration limits in units of Ci/m3; remaining nuclides are concentration limits in units of nCi/g. b. Radioactive decay to 2012; the sum of the fractions will not significantly change if decayed to the present. c. Table 1 of 10 CFR 61.55.

73
Table 18. Radionuclide concentrations in the piping (with grout) (Table 2 of 10 CFR 61.55).
Radionuclide Half-Life
(yr) Piping Inventory
(Ci)a
Piping Inventory in Ci/m3
Class C Concentration Limit
(Ci/m3)b
Fraction of Class C
Concentration Limit
137Cs 3.00E+01 1.40E+01 1.60E+00 4,600 0.00036 63Ni 1.00E+02 3.60E–02 4.10E–03 700 0.0000059 90Sr 2.90E+01 2.90E–01 3.40E–02 7,000 0.0000048 Sum of the Fractions 0.00037
a. Radioactive decay to 2012; the sum of the fractions will not significantly change if decayed to the present. b. Table 2 of 10 CFR 61.55.
No analysis was performed for the TFF piping using a ten-to-one ratio of unstabilized-to-stabilized
waste mass. As described above, final waste form concentration calculations were performed with and without considerations for stabilizing material.
6.4.1 Summary and Conclusions
At closure and disposal, the radioactive waste concentrations for the piping, encasements, and valve boxes meet Class C concentration limits.eee The basis is the completion of waste concentration tables as described in 10 CFR 61.55.
6.5 Sensitivity Analyses
In addition to the above analyses, several additional evaluations have been performed to aid in understanding the sensitivity of residual inventory estimates, grout volumes, waste density, and other parameters. These additional evaluations are included in Appendix D and support the conclusion that the TFF tanks, vaults (including sandpads), and piping will meet Class C concentration limits at closure and disposal.
6.6 Conclusions
DOE has concluded that the radioactive waste concentrations for the TFF at closure and disposal would not exceed Class C concentration limits. In addition, DOE has extensively consulted with NRC on its disposal plans for TFF waste during the NRC’s review of the draft 3116 Determination. This extensive consultation would satisfy the requirements of Section 3116(a)(3)(B)(iii) if they were applicable. Therefore, DOE concludes that NDAA criteria can be met under either Section 3116(a)(3)(A) or (a)(3)(B).
eee. On page 62 of its TER (NRC 2006b), NRC concluded that the waste in the smaller (30,000-gal) tanks, sandpads, and piping would not exceed the Class C concentration limits.

74
7. WASTE WILL BE DISPOSED OF IN ACCORDANCE WITH PERFORMANCE OBJECTIVES IN 10 CFR 61, SUBPART C
Key Points
• The TFF PA (DOE-ID 2003b) was prepared in accordance with DOE guidance. Moreover, the information in the PA demonstrates that the performance objectives in 10 CFR 61, Subpart C are met. The PA is used to demonstrate that the TFF residual waste will be disposed of in accordance with these performance objectives as required by Section 3116 of the NDAA.
• Grout in the tanks and tank vaults provides structural stability to the waste form and prevents collapse.
• The institutional control period is 100 years following closure (2012–2112). The post-institutional control period is 2112–3012.
• Members of the public are assumed to reside 100 m (328 ft) from the TFF during the post-institutional control period. The all-pathways dose assessment used the well location where the highest concentration of radionuclides was predicted in the aquifer (600 m [1,969 ft] from TFF).
• Grouted tanks and piping are assumed to fail (release contaminants) at 500 years post-closure. Grouted vaults are assumed to fail (release contaminants) at 100 years post-closure.
• Inadvertent intruder scenario assumptions:
- Institutional controls are effective for at least 100 years following closure.
- Only the intruder-drilling and post-drilling scenarios are applicable for the tank and sandpad contamination as discussed in Subsection 7.2. The intruder-construction and intruder post-construction scenarios are considered for the piping inventory located less than 3 m (10 ft) below the surface.
Section 3116(a) of the NDAA provides in pertinent part:
[T]he term “high-level radioactive waste” does not include radioactive waste resulting from the reprocessing of spent nuclear fuel that the Secretary of Energy …, in consultation with the Nuclear Regulatory Commission …, determines— …
(3)(A)(i) [will be disposed of] in compliance with the performance objectives set out in subpart C of part 61 of title 10, Code of Federal Regulations.
Title 10 CFR 61, Subpart C, Sections 61.40 through 61.44, detail performance objectives the NRC
established for land disposal of radioactive waste. For LLW disposal, 10 CFR 61.40, “General Requirement,” states “land disposal facilities must be sited, designed, operated, closed, and controlled after closure so that reasonable assurance exists that exposures to humans are within the limits established in the performance objectives §§61.41 through 61.44.” These sections address protection of the general population from radioactivity releases, protection of individuals from inadvertent intrusion onto the disposal site, protection of individuals during disposal facility operations, and disposal site stability after closure. Compliance with requirements in 10 CFR 61.40–61.44 is discussed in Subsections 7.8–7.12, respectively.

75
This section documents that the TFF PA shows that disposal of the residuals and TFF tank system will meet 10 CFR 61, Subpart C performance objectives. The PA was developed originally as part of a DOE Tier 1 closure plan (DOE-ID 2006a) and as the support for a DOE draft waste determination prior to enactment of Section 3116 of the NDAA. As such, the PA was prepared in accordance with DOE guidance. However, the information in the PA similarly demonstrates that the LLW land disposal performance objectives of 10 CFR 61, Subpart C are met.
The site-specific Performance Assessment for the Tank Farm Facility at the Idaho National Engineering and Environmental Laboratory (DOE-ID 2003b) considers all the sources of radioactive waste that may remain in the closed TFF, including the tank residuals, tanks, vaults, sandpads, piping, and other ancillary components for the eleven 300,000-gal tanks and vaults and the four 30,000-gal stainless steel tanks. The assessment calculates potential releases to the public, including those that result from inadvertent intrusion, to provide a reasonable expectation that the performance objectives are not exceeded for a 1,000-year period after closure, which is planned to be in 2012. The PA uses the current or planned land use as a basis for scenario development. The receptor is placed in all scenarios where the estimated radiation dose from the TFF is greatest. Therefore, the exposure date and location are placed at the predicted maximum radiation dose. Assumptions in the PA include grouting all voids such that the tanks and tank vaults (for the 300,000-gal tanks) are filled with grout to provide structural stability to the waste form and prevent collapse. The PA process uses conceptual models that link radionuclide inventory, release (or source term), environmental transfer, and impact assessment. The final step is determining radiological doses to receptors. These analyses are used in this 3116 Basis Document to demonstrate the TFF closure (i.e., disposal) is in compliance with Section 3116 criteria.
The potential dose posed by the TFF closure (i.e., disposal) is assessed by conservatively estimating the release and transport of radionuclides from (1) the release of radionuclides from the tanks, sandpads, and piping, and subsequent transport through the environment; and (2) exposures to members of the public via air, groundwater, and food chain pathways. Two receptor types are assessed: a member of the public and an intruder. During the operational and institutional control periods, a member of the public is assumed to reside at the INL Site boundary. During the post-institutional control period (100 years after closure), a member of the public is assumed to reside at the INTEC facility boundary. This receptor is used to evaluate the drinking water pathway, all-pathways (including food chains), and air pathway doses for comparison to the performance objectives. The hypothetical intruder receptor type is assumed to intrude inadvertently onto the TFF during the post-institutional control period under four scenarios.
Calculations in sensitivity and uncertainty analyses for all analyses other than the inadvertent intruder analysis were carried out beyond 1,000 years to determine the maximum impact regardless of the time at which the maximum occurs. Thus, the timeframe for the analysis should be long enough to capture the maximum impact even if the maximum does not occur for several thousand years. For the inadvertent intruder analysis, the sensitivity and uncertainty analysis is limited to qualitative arguments. These analyses, together with the sensitivity and uncertainty analyses discussed below, were used in this 3116 Basis Document and provide significant information on the reasonably expected performance up to 10,000 years and beyond.
The NRC’s LLW PA guidance suggests a two-part approach to establishing the time of analysis (NRC 2000). The first part is a 10,000-year analysis period and the second part is a qualitative evaluation of the analysis beyond 10,000 years to identify any significant deficiencies in disposal system performance. In the TFF PA, groundwater contaminant transport simulations (i.e., the dominant dose pathway) are conducted for three radionuclides (90Sr, 99Tc, and 129I) that provide the majority of the groundwater pathway doses during the 1,000-year analysis period.

76
The PA’s performance period of 1,000 years after INTEC TFF closure includes an institutional control period and a post-institutional control period, while the sensitivity analysis for the groundwater pathway provides simulations out past 10,000 years. The use of the groundwater modeling past 10,000 years, coupled with the intruder scenarios, which peak immediately after the institutional control period (100 years following TFF closure).fff
The PA assumes an institutional control period at the INL Site of 100 years following TFF closure. Developing an assumption for institutional controls in performance assessments includes consideration of site-specific land use planning and planning for engineered controls such as active barriers (e.g., caps, fences, and security) and passive barriers (e.g., signs, monuments, and markers). The INEEL Comprehensive Facility and Land Use Plan (DOE-ID 1997) describes government control of the site for at least the next 100 years. The INL has not prepared specific plans or designs for active or passive controls following this timeframe. Consistent with guidance in NRC’s LLW PA (NRC 2000), a 100-year post-closure institutional control period has been selected.
During this institutional control period, periodic maintenance and monitoring activities are assumed to be conducted, and active controls such as guards and fences are expected to be used. During the institutional control period, members of the public are assumed to reside at the INL Site boundary and intruders are assumed to be restricted from entering the site (DOE-ID 1995). During the post-institutional control period (2112–3012), the INL Site will not be maintaining the facility, so the facility could be accessed by the public. During this period, members of the public are assumed to reside as close as 100 m (328 ft) from the TFF. The PA evaluates the degradation of the various barriers (e.g., grout, tanks, vaults, and piping) to radionuclide release. Although models predict that these barriers will last 40,000 years, the TFF PA assumes a tank and tank grout life of only 500 years (NRC 2000), and a life of only 100 years for the vaults and grout system between the tank and the vault outer walls. The groundwater model analysis shows that the contamination plume center (where the highest concentrations enter the regional aquifer) would be 600 m (1,969 ft) southward in the downgradient direction from the center of the southernmost TFF tank. The contamination plume center is taken as the source of drinking water after the institutional control period of 100 years has expired. This center is the distance from the TFF for the highest calculated radiation dose. The intruder scenario considers contamination spread from two activities: a 3-m (10-ft) excavation for a basement and a well drilled through the top of the tank. The maximum dose would occur immediately after institutional control ended at 100 years after closure (2112).
The dose posed by the residual inventory at closure, the general requirements for disposal in a near surface facility described in 10 CFR 61.40, and the performance objectives for LLW disposal described in 10 CFR 61.41–61.44 are discussed in the following subsections.
7.1 Analysis of Performance
The conceptual models developed and the computational approach used to assess the performance of the TFF are also described fully in the PA. The conceptual models are derived from technical information presented in Section 2 of the PA (DOE-ID 2003b). These models embody a number of simplifying assumptions to facilitate the computational analysis required to assess the long-term performance of the TFF. The dose calculations are presented in Subsection 3.3.5 of the PA.
fff. The contaminant transport simulations are evaluated out to 1 million years for these radionuclides. Prior modeling simulations for the TFF assessed the remaining radionuclides for a period of 1 million years. The results of this prior modeling indicate that the remaining radionuclides are not of concern for the TFF PA (DOE-ID 2003b).

77
7.1.1 Institutional Control Period
The institutional control period is the 100-year time interval specified in the INEEL Comprehensive Facility and Land Use Plan (DOE-ID 1997) following closure of the TFF. The assumed closure date of the TFF is currently 2012. Periodic maintenance and monitoring activities are conducted during the institutional control period. The TFF site is assumed to be stabilized and no longer operational during this period but will remain part of the INL, and therefore, fenced and patrolled to eliminate the possibility of inadvertent intruders.
7.1.2 Post-Institutional Control Period
The final time period of concern is when the facility is no longer maintained by the INL Site and could be accessed by the public. The total duration of this period is 1,000 years from the time of closure; however, to determine groundwater dose, which may peak at a later time, simulations were carried out to 1 million years. Therefore, the 10,000-year period of performance is addressed by the PA. Projections of conditions and activities after 1,000 years are uncertain and difficult to assess. In addition, peak doses may not occur from TFF releases until several thousand years after closure because of the presence of long-lived radionuclides. The potential peak doses from these long-lived radionuclides are in the sensitivity analysis.
7.1.3 Exposure Pathways
Numerous exposure pathways were analyzed in the TFF PA to demonstrate conformance with a variety of performance objectives. These exposure pathways include: (1) drinking water dose from groundwater,ggg (2) all-pathways dose from groundwater, and (3) air dispersion pathways.hhh In addition, the intruder pathway and radon flux analyses were also considered and are described in Subsections 3.3.4 and 5 of the TFF PA (DOE-ID 2003b). Only the all-pathways dose assessment and intruder analysis are applicable to demonstrate compliance with the NDAA criteria and will be further discussed in this 3116 Basis Document. Intruder scenarios are discussed in later in Section 7.
The TFF PA includes a comprehensive all-pathways exposure scenario. The primary mechanism for transport of radionuclides from the TFF is expected to be leaching to the groundwater and subsequent human consumption. Thus, in the all-pathways dose analysis, an off-Site member of the public is assumed to use water from a well for domestic purposes. The well is assumed to be located where the maximum concentrations of radionuclides in groundwater are predicted to occur.
ggg. The groundwater protection standard chosen for evaluation in the PA is a drinking water dose of 4 mrem/yr. The nearest location from the disposal site for off-Site members of the public depends on the time period after disposal. During the period of active institutional control for the first 100 years after facility closure, off-Site members of the public are assumed to be located no closer to the disposal site than the present boundary of the INL. However, after active institutional control ceases, off-Site members of the public could be located as close as 100 m (328 ft) from the TFF. However, for the groundwater pathway, the member of the public is assumed to have a well located in the groundwater at the point of maximum concentration, which for the analyses presented in the PA is located 600 m (1,969 ft) from the TFF.
The primary mechanism for transport of radionuclides from the TFF is expected to be leaching of radionuclides to the groundwater and subsequent human consumption. Thus, in the dose analysis for groundwater protection, an off-Site member of the public is assumed to use water from a well for domestic purposes. The well is assumed to be located where the maximum concentrations of radionuclides in groundwater are predicted to occur.
hhh. Volatile radionuclides 3H and 14C were evaluated in the air dispersion scenario. The depth to the waste and the waste physical characteristics (i.e., grouted waste) limits the analysis to volatile radionuclides in the waste form. Additional details on the air dispersion scenario are provided in Subsection 3.3.5 of the PA (DOE-ID 2003b).

78
The following exposure pathways involving the use of contaminated well water are assumed to occur:
• Direct ingestion of contaminated water
• Ingestion of milk and meat from dairy and beef cattle that drink contaminated water
• Ingestion of vegetables grown in garden soil irrigated with contaminated water
• Ingestion of milk and meat from dairy and beef cattle that eat fodder from pasture irrigated with contaminated water.
Additional exposure pathways for off-Site members of the public could involve releases of radionuclides into the air (i.e., volatile radionuclides). Exposures from the air pathway also are considered in the PA.
7.2 Models and Assumptionsiii
7.2.1 Source Term Model
For the TFF concrete vaults, release rates of radionuclides were estimated using the Disposal Unit Source Term-Multiple Species (DUST-MS) computer code (Sullivan 1993, 2001). One-dimensional DUST-MS transport simulations were conducted for radionuclide sources in the grouted tank, piping, and the sandpad beneath the tank.
7.2.1.1 DUST-MS Model Description. DUST-MS considers four major processes: fluid flow, container degradation, waste form leaching, and contaminant transport. The DUST-MS model permits selection of a unique failure time and waste form type for each container. To simulate different waste forms, DUST-MS has four different models to estimate release rates: rinse with partitioning, diffusion, uniform degradation, and solubility-limited release. For these four processes, DUST-MS computes release rates with an analytical model or a finite difference model. After calculating waste form releases, the movement of the contaminants through subsurface system materials is determined using a one-dimensional finite difference procedure with material- and contaminant-specific distribution coefficients, diffusion coefficients, dispersion coefficients, and bulk densities. The governing transport equation simulates the distribution and movement of contaminants from advection, dispersion, diffusion, radioactive production and decay, sorption, and sources and sinks external to the containers. The DUST-MS code has received extensive testing and verification. The DUST-MS code predictions compare favorably to known analytical solutions as well as other code predictions (DOE-ID 2003b).
7.2.1.2 Conceptual Model. The conceptual model for computing release rates of radionuclides out of the TFF vault is illustrated in Figure 15. Infiltrating water from the ground surface contacts the waste inside the vaults.
iii. Although NRC expressed several concerns in its TER (NRC 2006b) regarding the DOE’s conceptual model with respect to hydrology, NRC concluded for a number of reasons that “NRC has confidence that overall system performance of both the engineered and natural barriers will be sufficient to meet performance objectives” (as noted on page 101 of the TER). DOE acknowledges differences in professional opinion regarding scientifically complex modeling, including approaches to account for uncertainties. For the reasons explained in the ensuing subsections and in DOE’s PA (DOE-ID 2003b), DOE has confidence in its modeling approach. Importantly, despite certain differences in professional opinion and approach, both NRC and DOE reached the same conclusion, that is, that the performance objectives in 10 CFR 61, Subpart C will be met.

79
Figure 15. The DUST-MS conceptual model for release from the TFF vaults and tanks (DOE-ID 2003b).
In Figure 15, radionuclides are assumed to be located in the grouted tank heel and in the sandpad beneath the tank. The release of radionuclides from the grouted tank heel and from the sandpad is modeled in DUST-MS assuming surface rinsing. The vault is assumed to remain intact for 100 years. The tanks are assumed to remain intact for 500 years. Upon vault and tank failure, radionuclides are released from the two sources.
The DUST-MS code calculates release rates out of the vault and tanks into the unsaturated zone. Release rates are computed for transport through the grout inside the tank (15 cm [6 in.]), the sandpad (15 cm [6 in.]), and the degraded concrete (0.76 m [2.5 ft]). Retardation is assumed to occur in the waste release model (surface rinsing), in the grout inside the tank, in the sandpad, and in the degraded concrete.
7.2.2 Groundwater Flow and Transport Modeling
A two-dimensional unsaturated/saturated PORFLOW model was used to simulate water and contaminant transport in the subsurface at the INTEC facility (see Figure 16) (ACRi 2000). This approach allowed a detailed approximation of the complex geology underlying the facility. The two-dimension problem domain represented a vertical slice in a north-south direction beginning at the Big Lost River, through the center of two tank vaults, and southward in the downgradient direction for a total distance of 2,500 m (8,202 ft). The top of the model is located at land surface and extends to a depth of 200 m (656 ft)—well below the top of the water table located at 134–139 m (440–456 ft) below ground surface. By default, the unit thickness of the two-dimensional model in an east-west direction is 1 m (3 ft).

80
Figure 16. Illustration of the two-dimensional modeling slice used in PORFLOW (DOE-ID 2003b).
As noted earlier, DUST-MS was used to predict the release rates from the various waste forms. Radionuclide releases coincided with degradation rates of the waste forms discussed in Subsection 3.1.2.2 of the PA (DOE-ID 2003b). Release rates calculated by DUST-MS were incorporated as input in PORFLOW, with the initial radionuclide releases beginning at the time of degradation. For example, the outer vault began to release radionuclides after 100 years and the tanks/piping after 500 years. These assumptions are conservative, based on the best estimates provided from the degradation analysis.
An important component of the conceptual model for the transport of contaminants is the relationship of dispersion in the two-dimensional model. Since the model uses a unit thickness of 1 m (3 ft), there is no lateral dispersion of contaminants beyond this thickness. It is assumed that contaminants disperse or diffuse out of the lateral boundary at the same rate as contaminants move into the unit thickness of the model domain. Essentially, all dispersion of contaminants occurs in the longitudinal direction, with zero transverse dispersion. This is a conservative approach to predicting downgradient contaminant concentrations.
Since the model domain is located in the center of the tanks, the highest contaminant concentrations are located in the source area of the model. Although it is assumed that the same amount of contaminants disperse in a transverse direction out of, as into the model domain, in reality there would be the same loss of contaminants, albeit small, in the transverse direction. Consequently, downgradient contaminant concentrations will be slightly higher for the two-dimensional simulation compared to a fully three-dimensional simulation.

81
Radionuclide concentrations were observed downgradient in the regional aquifer at the location where the highest concentrations occur. During unsaturated flow simulations, it was observed that the perched water zones deflected the contamination. Consequently, the usual 100-m (328-ft) downgradient location was inappropriate to quantify the maximum impacts of radionuclide releases from the tanks and vaults. Based on the radionuclide concentrations distribution, the maximum observed concentrations occur approximately 600 m (1,969 ft) downgradient from the tanks.
The intruder scenarios were screened based on the physical aspects of the facility (i.e., depth to the waste). Intruder scenarios considered for use in the PA were those previously described for low-level radioactive waste PAs (Kennedy and Peloquin 1988; NRC 1982).jjj These intruder scenarios include both acute and chronic exposure scenarios. Acute exposure scenarios involve exposures of short duration, and include an intruder-construction scenario, a discovery scenario, and a drilling scenario.
7.2.2.1 Intruder-Construction Scenario. The intruder-construction scenario involves an inadvertent intruder who chooses to excavate or construct a building on the disposal site. In this scenario, the intruder is assumed to dig a basement excavation to a depth of approximately 3 m (10 ft) (Oztunali and Roles 1986). It is assumed that the intruder does not recognize the hazardous nature of the material excavated. He or she is exposed to radioactive constituents in the waste during the excavation of the basement. The intruder also is exposed to the exhumed waste by inhalation of resuspended contaminated soil and external irradiation from contaminated soil.
The depth to the residual waste at the bottom of the tanks and/or sandpads (i.e., 3 m [10 ft] of soil plus 9 m [30 ft] of concrete) would preclude direct contact with the waste from the 3-m (10-ft) excavation. However, approximately 30% of the contaminated piping associated with the tanks is located within 3 m (10 ft) of the surface.
Due to the disposal depth of the waste in the tanks at the TFF (i.e., greater than 10 m [33 ft]) and the depth of the sandpad contamination, the intruder-construction scenario was not considered applicable to these waste. However, the intruder-construction scenario was considered for the radionuclide inventory located in the associated piping less than 3 m (10 ft) from the surface.
7.2.2.2 Intruder-Drilling Scenario. The intruder-drilling scenario assumes the short-term exposure of a hypothetical intruder to drill cuttings from a borehole penetrating the waste disposal site. This scenario involves wastes buried below the depth of typical construction excavations.
Oztunali and Roles (1986) indicate that for waste below 10 m (33 ft), the only applicable intrusion scenario is the intruder-drilling scenario. They also note that for grouted waste or waste disposed of in reinforced concrete structures, a time period of 500 years after site closure is assumed as the effectiveness limit for this waste form. Therefore, this scenario is not considered applicable for drilling through reinforced concrete until 500 years post-closure. However, they also note that the scenario is assumed to be fully applicable for grouted waste at any time. Because the waste could be contacted and moved to the surface, thereby exposing the intruder, the intruder-drilling scenario was retained for analysis in the TFF PA (DOE-ID 2003b).
jjj. The Idaho High-Level Waste and Facilities Disposition Final Environmental Impact Statement (DOE 2002) considered similar intruder scenarios. While not part of this 3116 Basis Document, DOE believes the analysis in the environmental impact statement is consistent with the analysis of intruder scenarios in this document.

82
7.2.3 Chronic Intruder Exposure Scenarios
These scenarios are described below. Those scenarios not considered applicable to the TFF were screened out from further consideration.
7.2.3.1 Intruder Post-Construction Scenario. The chronic intruder post-construction (i.e., agriculture) scenario is an extension of the acute intruder-construction scenario. It is assumed in this scenario that an intruder lives in the building constructed as part of the intruder-construction scenario and engages in agricultural activities on the contaminated site. The intruder is exposed to contamination by inhalation of resuspended contaminated soil, inhalation of gaseous radionuclides released from the waste, external irradiation, ingestion of contaminated soil, ingestion of contaminated beef and milk, and ingestion of contaminated vegetables.
As stated earlier, the intruder-construction scenario was only considered applicable to the piping associated with the TFF that is less than 3 m (10 ft) from the surface. The depth of the residual waste in the tanks and the sandpads prevents its excavation to the surface. Therefore, the intruder-agriculture scenario was retained for the piping inventory.
7.2.3.2 Post-Drilling Scenario. The chronic post-drilling scenario is an extension of the acute drilling scenario. It assumes that the intruder occupies the site after drilling a water well and grows crops on a mixture of clean soil and contaminated drill cuttings. After exhumation of the waste, the exposure pathways are the same as for the intruder-agriculture scenario. This intruder scenario was retained for further analysis.
7.3 Acute Intruder-Drilling Scenario Definition
The acute intruder-drilling scenario assumes that an inadvertent intruder drills a well into the contents of the tank and vault system. The intruder is exposed to contaminated drill cuttings spread over the ground and contaminated airborne dust. In the standard drilling scenario used in many PAs, the intruder is assumed to be exposed to contaminated drill cuttings in a mud pit. However, site-specific information developed through interviews with local well drilling contractors in the Idaho Falls area indicates that drillers spread the cuttings over the ground and do not use mud pits (Seitz 1991). The authors of the Radioactive Waste Management Complex PA (Maheras et al. 1997) used this site-specific deviation of the standard drilling scenario; it also was incorporated into the TFF intruder-drilling scenario. The assumption that the drill cuttings are spread over the ground will result in higher dose estimates than if the cuttings were assumed to be in a mud pit because of the decrease in the shielding factor.
The drill cuttings are assumed to be spread over a 2,200-m2 (23,681-ft2) lot, which corresponds to about 0.5 acre. Typical lot sizes located outside of the Idaho Falls city limits are typically 1–3 acres. Therefore, a 2,200-m2 (23,681-ft2) lot size was considered conservative for use in the Radioactive Waste Management Complex PA (Maheras et al. 1997), and also was incorporated into the TFF intruder-drilling scenario.
Well drilling contractors in the Idaho Falls area have reported that two types of wells are typically drilled: small-diameter residential wells and large irrigation wells. The small residential wells are typically 15–20 cm (6–8 in.) in diameter, serve a single residence, and may provide enough water for a family garden and small quantities of livestock. The large-diameter irrigation wells are drilled to serve systems that irrigate hundreds of acres; the wells are located in the middle of farm fields, not near the farmer’s residence. Therefore, a farmer would not drill an irrigation well to acquire water for his residence. Large-diameter irrigation wells are currently drilled in 46-cm (18-in.) diameters but drilling contractors indicated that 56-cm (22-in.) diameter irrigation wells would be drilled in the future

83
(Seitz 1991). An acute drilling exposure could result from either drilling a 15-cm (6-in.) diameter residential well or a 56-cm (22-in.) diameter irrigation well. The larger 56-cm (22-in.) diameter irrigation well was assessed for the acute intruder-drilling scenario.
The intruder is assumed to reside by the contaminated cuttings for 160 hours, the time local Idaho Falls well drilling contractors say it would take to drill and develop a 56-cm (22-in.) diameter irrigation well (Seitz 1991). The exposure pathways for this acute drilling scenario include inhalation of resuspended drill cuttings, external exposure to the ground source, and inadvertent soil ingestion. Figure 17 illustrates the acute intruder-drilling scenario.
The TFF concrete vaults are reinforced concrete but the grout between the tank and vault and also inside of the tank is not reinforced concrete. However, considering that the depth to the waste in the tank is 10 m (33 ft), that the waste is contained within a stainless steel tank, and that the overlying concrete vault roof is reinforced, credit beyond 100 years could be taken for a barrier to intrusion. However, the intruder-drilling scenario was assumed to begin 100 years after closure.
Vault
Water well 22-in. diameter
2,200 m contaminated
area
2
Figure 17. Graphical representation of the acute intruder-drilling scenario (DOE-ID 2003b).

84
7.4 Acute Intruder-Construction Scenario
The acute intruder-construction scenario assumes that an inadvertent intruder moves onto the TFF and excavates a 20- by 10- by 3-m (66- by 33- by 10-ft) excavation for a basement (Oztunali and Roles 1986).
The intruder is assumed to spend 160 hours working on the excavation of the basement. The exposure pathways for this acute scenario include inhalation of resuspended soil, external exposure to the ground surface, and inadvertent soil ingestion.
The determination of the unit concentration dose factors for each exposure pathway was determined using the equations in Subsection 5.2 of the PA (DOE-ID 2003b) for the acute intruder-drilling scenario with the exception that the external dose factors for contaminated soil were based on infinite thickness and infinite lateral extent from Federal Guidance Report 12 (EPA 1993).
The activity concentration of radionuclides in the excavation were determined by assuming that the radionuclide inventory in the 30% of the piping located within 3 m (10 ft) of the surface was located over the 5-acre (20,234-m2 [217,797-ft2]) area of the TFF.
The results of the intruder-construction analyses are given in Subsection 5.6 of the PA (DOE-ID 2003b).
7.5 Chronic Intruder Post-Drilling Scenario Definition
The chronic intruder post-drilling scenario assumes that an inadvertent intruder moves onto the TFF and drills a residential well into the waste. The drilling portion of the scenario evaluates a 15-cm (6-in.) diameter residential well. This type of well serves a single residence and provides sufficient water for a family garden and small quantities of livestock. As described in the acute intruder-drilling scenario, large-diameter wells are drilled to serve irrigation systems (i.e., hundreds of acres) that are located in the middle of farm fields, not near a farmer’s residence. Therefore, in the chronic post-drilling scenario, the residence/home garden is evaluated using the traditional drinking water well diameter of 15 cm (6 in.).
The drill cuttings that are brought to the surface are assumed to be spread over 2,200 m2 (23,681-ft2) (approximately 0.5 acre) of land surface. The waste is assumed to be mixed to a depth of 0.6 m (2 ft). The mixing depth of 0.6 m (2 ft) is based on using a deep tilling plow to increase the depth of the root zone and to break up soil compaction. To minimize erosion these plows are used in areas of southeastern Idaho with highly erodible soils. Deep tilling plows have shanks that till to a depth of 0.6 m (2 ft) and are sold at Idaho Falls implement dealers (Maheras et al. 1997).
The chronic post-drilling scenario assumes that the intruder is exposed to the drill cuttings during plowing and cultivation (i.e., dust inhalation). In addition, the intruder is assumed to ingest contaminated food products from the garden and from beef and milk cattle consuming contaminated forage. The intake of contaminated forage by cattle was adjusted according to the fraction of feed grown on contaminated cuttings and the necessary remaining feed obtained from uncontaminated ground. Figure 18 illustrates the chronic intruder post-drilling scenario.

85
Figure 18. Chronic intruder post-drilling scenario (DOE-ID 2003b).
7.6 Chronic Intruder Post-Construction Scenario Definition
The chronic intruder post-construction scenario assumes that an inadvertent intruder moves onto the TFF, excavates a basement, spreads the excavated material over the land, and subsequently farms the area.
The excavation soil is assumed to be spread over 2,200 m2 (23,681 ft2) (approximately 0.5 acre) of land surface. The waste is assumed to be mixed to a depth of 0.6 m (2 ft), which is based on using a deep tilling plow to increase the depth of the root zone and to break up soil compaction. These plows are used in areas of southeastern Idaho with highly erodible soils to minimize erosion. Deep tilling plows have shanks that till to a depth of 0.6 m (2 ft) and are sold at Idaho Falls implement dealers (Maheras et al. 1997).
The chronic intruder post-construction scenario assumes that the intruder is exposed to the excavated soil during plowing and cultivation (i.e., dust inhalation). In addition, the intruder is assumed to ingest contaminated food products from the garden and from beef and milk cattle that consume contaminated forage. The intake of contaminated forage by cattle was adjusted according to the fraction of feed grown on contaminated cuttings and the necessary remaining feed obtained from uncontaminated ground.

86
7.7 Estimated Radiation Dose Using the Current Estimate of the Residual Inventory at Closure
Performance objectives for radioactive waste land disposal are provided in 10 CFR 61, Subpart C. Table 19 compares the dose based on the conservative residual inventory used in the PA and the dose posed by the current estimate of the residual inventory at closure (described in Section 2) with the listed performance objectives. Results of the PA analyses indicate compliance with the performance objectives shown in Table 19. The dose for the current estimate of the residual inventory at closure for the TFF tank system is less than the dose calculated for the inventory used in the PA. The doses by radionuclide for the groundwater all-pathways, acute intruder-drilling scenario, and chronic intruder-drilling scenario are less than the doses predicted in the PA. The dose comparison shows a decline in dose to various receptors.kkk
Table 19. Comparison of performance assessment results to predicted dose at closure (DOE-ID 2003b).
Performance Objectives PA Results Current Estimate of Residual at Closure
All-pathways dose to the public (not exceeding 25 mrem/yr) 1.86 mrem/yr 0.46 mrem/yr Acute-drilling scenario (less than 500 mrem) 232 mrem 152 mrem Acute-construction scenario (less than 500 mrem) 0.80 mrem 0.23 mrem Chronic post-drilling scenario (less than 500 mrem/yr) 91.1 mrem/yr 25 mrem/yr Chronic post-construction scenario (less than 500 mrem/yr) 26.1 mrem/yr 3.15 mrem/yr
Notes: 1. The groundwater pathway contributed 1.35 mrem/yr. 2. The peak annual dose to the thyroid is approximately 6 mrem/yr compared to the 10 CFR 61.41 limit of 75 mrem/yr. 3. The peak annual dose to any other organ is approximately 0.15 mrem/yr compared to the 10 CFR 61.41 limit of 25 mrem/yr.
For the residual inventory at closure, the Tanks WM-180 and WM-182 inventories are used as a
basis for the estimated doses shown in the last column of Table 19. Tanks WM-180 and WM-182 are used because this tank combination has the largest residual inventory of the cleaned 300,000-gal tanks. The modeling in the PA was designed to use the inventory from a set of tanks that are oriented north to south to match the regional groundwater flow. The radiation doses are estimated using a dose conversion factor (DCF), which is the ratio between the radiological inventory (in Ci) and the radiological dose (in mrem/yr), as determined in the PA. Although the DCF is a ratio determined from data used in the PA, the same ratio is applicable to the residual material present in a cleaned tank at the completion of closure activities. Therefore, since the post-closure inventory of the cleaned tanks is known, the exposure scenario doses may be determined using the DCF. A description of the methodology and results are
kkk. The Idaho High-Level Waste and Facilities Disposition Final Environmental Impact Statement (DOE 2002) shows higher doses for the action alternatives concerning tank closure than shown in this 3116 Basis Document. The EIS analysis is based on an inventory that does not reflect DOE’s current refined and enhanced methodology for cleaning the tanks. The TFF PA (DOE-ID 2003b) reflects the potential removal of radionuclides using DOE’s current cleaning methodology and shows lower inventory and calculated doses than the EIS. The inventory and calculated doses in this 3116 Basis Document (because Section 3116 calls for removal of radionuclides to the maximum extent practical) are based on actual and projected tank cleaning results. The inventory and calculated doses are less than either the TFF PA or the EIS. (See Staiger, M. D., and C. B. Millet, 2000, “Inventory Estimates for the Tank Farm and CSSF’s, MDS-01-00,” Idaho National Engineering and Environmental Laboratory, interdepartmental communication to J.T. Beck, February 18. [cited at page C.9-50, DOE 2002]; TtNUS [Tetra Tech NUS], 2001, Calculation Package for Appendix C.9 to the Idaho High-Level Waste and Facilities Disposition EIS, Tetra Tech NUS, Aiken, South Carolina. Id;. EIS Appendix C, pages C.9-24 to 25.)

87
shown in “Radiological Dose Calculations for the Tank Farm Facility at the Idaho Nuclear Technology and Engineering Center” (Portage 2005g). The ratio for DCFs is shown as an equation below.
DCFPAPA
i
d =
di CRDCFxCR =
where:
PAi = performance assessment inventory
PAd = performance assessment radiation dose
DCF = dose conversion factor
CRi = current residual inventory
CRd = current inventory radiation dose.
Since the PA inventory, the PA radiation dose, and the current estimate of residual inventory are known, the current residual inventory radiation dose can be calculated using the simple ratio shown above.
7.8 10 CFR 61.40, “General Requirement”
The general requirement of 10 CFR 61.40 states:
Land disposal facilities must be sited, designed, operated, closed, and controlled after closure so that reasonable assurance exists that exposures to humans are within the limits established in the performance objectives in §§ 61.41 through 61.44.
The TFF PA was developed under similar guidance and requirements from DOE, which required the analysis to provide a “reasonable expectation” that the performance objectives are not exceeded as a result of operation and closure of the facility. The PA meets the performance objective of “reasonable assurance” by using conservative estimates of parameter values, concrete degradation rates, and human activity models. In addition, a sensitivity and uncertainty analysis is used to ensure that a conservative analysis was conducted for the TFF closure that bounds the potential final closure status of the facility.
The following subsections compare each of the 10 CFR 61 performance objectives with those used in the TFF PA analyses.lll
lll. The NRC issued the requirement for LLW disposal, 10 CFR 61, on December 27, 1982. The requirement was developed to provide specific regulations for the disposal of LLW in near-surface disposal facilities.

88
7.9 10 CFR 61.41, “Protection of the General Population from Releases of Radioactivity”
The measure for protecting the public from radioactive material that may be released from the disposal facility by any pathway is established in 10 CFR 61.41. The NRC requirement states:
Concentrations of radioactive material which may be released to the general environment in groundwater, surface water, air, soil, plants, or animals must not result in an annual dose exceeding an equivalent of 25 mrems to the whole body, 75 mrems to the thyroid, and 25 mrems to any other organ of any member of the public. Reasonable effort should be made to maintain releases of radioactivity in effluents to the general environment as low as is reasonably achievable.
The standard for radiation dose to the general population reflects the standard dose methodology in use at the time 10 CFR 61 was promulgated, which was International Commission on Radiological Protection (ICRP)-2 (ICRP 1959). The TFF PA performance objective is stated as “doses to the representative members of the public shall not exceed 25 mrem (0.25 mSv) in a year total effective dose equivalent from all exposure pathways, excluding the dose from radon and progeny in air.” The performance measure of 25 mrem in a year total effective dose equivalent (TEDE) reflects the standard dose methodology currently in use, ICRP-30 (ICRP 1979). The measure of protection, 25 mrem, is the same.
The NRC Performance Assessment Working Group (NRC 2000) recommends using ICRP-30 dose methodology in computing potential dose from a LLW disposal facility to compare to this performance objective. The group stated, “that as a matter of policy, the Commission considers 0.25 mSv/yr (25 mrem/yr) TEDE to be an appropriate dose limit to compare with the range of potential doses represented by the older whole body dose limits.” Therefore, the performance objective for the general population used in the TFF PA is in agreement with 10 CFR 61.41.
Because 10 CFR 61.41 also has limits for doses to the thyroid and other key organs, these doses are calculated for this 3116 Basis Document. Using conversion factors specified by the EPA in Limiting Values of Radionuclides Intake and Air Concentrations and Dose Conversion Factors for Inhalation, Submersion, and Ingestion (EPA 1988), annual doses to the thyroid and other critical organs are calculated for each relevant radionuclide on an organ-by-organ basis. The peak annual dose to the thyroid is approximately 6 mrem/yr compared to the 10 CFR 61.41 limit of 75 mrem/yr. The peak annual dose to any other organ is approximately 0.15 mrem/yr compared to the 10 CFR 61.41 limit of 25 mrem/yr.
The NRC performance objectives of 10 CFR 61.41 also state that reasonable efforts should be made to maintain releases of radioactivity in effluents to the general environment to ALARA. The TFF PA was conducted in accordance with a similar DOE performance objective, which, as quoted in the PA, states “performance assessments shall include a determination that projected releases of radionuclides to the environment shall be maintained as low as reasonably achievable.” As described in Section 5 of this 3116 Basis Document and the TFF PA (DOE-ID 2003b), tank closure (i.e., disposal) activities are being conducted in a manner that will maintain releases of radioactivity ALARA.
The TFF PA presents a detailed description of the modeling approach and computer codes used in the assessment (DOE-ID 2003b) and includes an uncertainty analysis that considers best, realistic, conservative, and worst-case exposure scenarios. The results show that the general population is protected in scenarios used in the PA (DOE-ID 2003b).

89
Radionuclides released from the INTEC TFF to the environment have the potential to impact humans through a number of different pathways. Radionuclide transport from TFF waste to the aquifer is considered in the groundwater exposure pathway.mmm Other pathways that may contribute to human exposure are those associated with groundwater concentrations of contaminants. Irrigation with contaminated groundwater may lead to contamination of agricultural crops and animals. Ingestion of contaminated groundwater by terrestrial animals may lead to human exposure. In addition, human exposure may occur from ingestion of contaminated groundwater and from consumption of contaminated food supplies (DOE-ID 2003b). Additional pathways, such as the atmospheric transport pathway, were assessed; they provide approximately 0.5 mrem/yr dose to members of the public. As a result, all-pathways dose calculations are based solely on the groundwater pathways.
As Table 20 demonstrates, the PA results for the all-pathways dose to a future member of the public as a function of time after closure indicate a peak dose of 0.46 mrem/yr at approximately 14,000 years after closure. The majority of the total dose is from 99Tc. This projected dose satisfies the 10 CFR 61.41 requirements.
Table 20. Groundwater all-pathways dose (less than 25 mrem/yr).
Nuclide
Decontaminated Tank Residual Inventory (mrem/yr)
Time of Peak Dose (yr)
90Sr/90Y 2.10E−08 551 99Tc 0.46 14,590 129I 0.29 890 Peak Dose 0.46
To understand parameter sensitivity and to analyze uncertainty in the TFF PA (DOE-ID 2003b)
groundwater model,nnn the INL Site developed worst, conservative, expected, and best-case scenarios to include radionuclide inventory and transport parameters. Since the radionuclide inventory in a 30,000-gal tank is small when compared with a 300,000-gal tank, the impact from the 30,000-gal tanks is small. Data from these four scenarios are used to analyze the probability of radionuclide releases to the public and the environment. This sensitivity/uncertainty analysis shows that radionuclide releases are not under-predicted. The conservative-case scenario is used as the compliance-case scenario in the TFF PA. These evaluations are documented in the TFF PA (DOE-ID 2003b).
mmm. Three radionuclides contribute to the drinking water pathway dose: 129I, 99Tc, and 90Sr. The maximum dose for groundwater is 0.16 mrem/yr, which occurs at 890 years from 129I. (At 890 years, dose contribution from the remaining radionuclides is negligible.)
nnn. Page 100 of the TER (NRC 2006b) summarizes the NRC staff’s concerns with respect to the groundwater conceptual model presented in the PA, which include assumptions about the principal direction of vadose zone flow, the Big Lost River boundary condition, and hydrological features that are thought to be present in the INTEC area but that were not explicitly accounted for in the hydrology model. NRC acknowledges in its TER that there is a paucity of site-specific data, including well characterization data, which are directly relevant to the known principal direction of vadose zone flow. On page 101 of the TER (NRC 2006b), NRC staff conclude that the uncertainties in the hydrologic modeling are offset through consideration of multiple lines of evidence, including sampling data from the tank vaults that suggest the 90Sr concentrations in the sandpad are likely bounding, consideration of monitoring data from historical TFF releases that provide a basis from which predictive model results can be evaluated for all groundwater highly radioactive radionuclides, and consideration of varying levels of performance of the concrete vaults that have the potential to essentially eliminate any concern with short-lived radionuclide releases from the TFF. NRC states, “Therefore, NRC staff has confidence that overall system performance of both the engineered and natural barriers will be sufficient to meet performance objectives.”

90
7.10 10 CFR 61.42, “Protection of Individuals from Inadvertent Intrusion”
Provisions in 10 CFR 61.42 require:
[D]esign, operation, and closure of the land disposal facility must ensure protection of any individual inadvertently intruding into the disposal site and occupying the site or contacting the waste at any time after active institutional controls over the disposal site are removed.
This requirement reflects the NRC’s intent that persons inadvertently intruding into the waste be protected. The performance objective does not place quantitative limits on exposure. However, the EIS for 10 CFR 61 (NRC 1982) suggests a dose limit of 500 mrem/yr for the waste classification scheme in 10 CFR 61.55. Consequently, NRC uses a 500-mrem dose limit for evaluating impacts to an inadvertent intruder for purposes of 10 CFR 61.42.ooo
The PA provides a performance objective for assessing impacts on a person inadvertently intruding into the disposal facility that is more stringent than the NRC requirement. The PA performance objective for inadvertent intruders is:
[F]or purposes of establishing limits on the concentration of radionuclides that may be disposed of near-surface, the PA shall include an assessment of impacts calculated for a hypothetical person assumed to inadvertently intrude for a temporary period into the [LLW] disposal facility. For intruder analyses, institutional controls shall be assumed to be effective for at least 100 years following closure. The intruder analyses shall use performance measures for chronic and acute-exposure scenarios, 500 mrem (5 mSv).ppp,qqq
The intruder scenarios and associated doses for the INTEC TFF are evaluated in the PA
(DOE-ID 2003b). A site-specific radiological PA is used to verify that requirements for protecting the inadvertent intruder were satisfied. The environmental setting and the logic for using site-specific scenarios is explained in detail in the PA. As described in the PA, several intruder scenarios were evaluated for applicability to the INTEC TFF closure. However, the TFF is a unique environment for intruder scenario evaluations (DOE-ID 2003b). Many of the standard scenarios are not considered applicable to the TFF because the depth of the waste in the tanks is greater than 10 m (33 ft). Therefore, only the intruder-drilling and post-drilling scenarios are considered applicable for the tank and sandpad contamination. Additional scenarios were evaluated for the piping inventory located less than 3 m (10 ft) below the surface. These scenarios include the intruder-construction scenario and the intruder post-construction scenario. ooo. NRC guidance does not provide for including the assessment of impacts to inadvertent intruders as a part of the PA to provide reasonable assurance that the dose limit in 10 CFR 61.41 will not be exceeded. Rather, the site must show that it is following the precepts of the waste classification scheme (i.e., stabilizing Class B waste and providing an intruder barrier for Class C waste) (NRC 1987a, 1987b).
ppp. The NRC waste classification system is based on intruder calculations using a 500-mrem dose limit. The TFF PA meets the more stringent DOE guidance for protection of the inadvertent intruder.
qqq. The PA uses active institutional controls. Passive controls are not considered, although such controls may be adopted in the future as site closure designs mature. This plan to use active controls without passive controls applies to the TFF only. Both active and passive controls may be used at other sites.

91
The groundwater pathway was not included in the intruder scenarios because the groundwater pathways dose assessment was performed as part of compliance for protection of the general population from releases of radioactivity. However, if the groundwater all-pathways dose is included with the chronic intruder-drilling scenario it adds 1.35 mrem/yr to the 91.1 mrem/yr if the PA dose assessment is used. The total dose would increase to 92.5 mrem/yr or an increase of 1.5%. If the inventory after cleaning is used, the all-pathways dose is estimated at 0.46 mrem per year and the chronic intruder-drilling scenario adds 25 mrem/yr. The total dose would increase to 25.46 mrem/yr or an increase of 1.8%. These doses remain well below 500 mrem/yr. The groundwater pathway was prepared to estimate the radiation dose at the location and time that provided the greatest dose to the receptor. The time and location of the greatest drinking water dose (890 years) and location (600 m [1,969 ft]) south of the TFF do not correspond to the time or location for intruder scenarios. The intruder scenario was located directly over the TFF at 100 years after closure, or 2112. The time period for the intruder scenario was chosen because it predicts the greatest dose to intruders from those radionuclides that contribute the majority of the dose. The radionuclide 137Cs and its daughter 137Ba contribute over 80% of the dose. 137Cs has a half-life of 30.17 years; therefore, the radiation dose from 137Cs approaches 0 at approximately 250 years. In contrast to the intruder scenario, the groundwater pathway increases to the maximum dose at a time 890 years in the future (Portage 2005g).
For acute exposures, three potential intruder-exposure scenarios are considered: intruder-construction, intruder-discovery, and intruder-drilling scenarios. The intruder-discovery scenario is evaluated to analyze exposures from unearthing equipment and piping nearer than 3 m (10 ft) to the surface. The intruder is assumed to recognize that he or she is digging into very unusual soil immediately upon encountering the vault/tank/piping system and leaves the site. The intruder-discovery scenario is not considered for further analysis because the exposure time is low compared with exposures from the intruder-construction scenario. In the intruder-construction scenario, the intruder is assumed to dig a basement. This scenario is retained for evaluation because of contaminated TFF piping that is less than 3 m (10 ft) below the surface. The maximum dose after institutional control (i.e., 100 years) for the acute intruder-construction scenario is 0.23 mrem. The tank inventory used for the intruder construction scenario is Tank WM-182 because it has the greatest inventory of the cleaned tanks. This total dose is well within the performance objective of 500 mrem for all times after closure. Table 21 shows the major radionuclide contributors and associated dose.
Table 21. Acute intruder-construction dose (less than 500 mrem).
Nuclide Dose Based on Residual Inventory at Closure
(mrem) 90Sr/90Y 0.00005 94Nb 0.001 137Cs/137mBa 0.20 237Np 0.0001 238Pu 0.009 239Pu 0.006 240Pu 0.003 241Am 0.001 Total Dose 0.23
The credible acute intruder-drilling scenario assumes short-term exposure of a hypothetical intruder
to drill-cuttings from a borehole that has penetrated the closed facility and associated residuals. The intruder-drilling scenario takes no credit for the thick grout encapsulating the waste but assumes that

92
concentrated residuals are spread over a 0.5-acre lot. The exposure pathways analyzed are inhalation of resuspended drill cuttings, external exposure to the ground source, and inadvertent soil ingestion. The acute scenario dose for the limiting tank (represented by the conservative tank residual inventory for Tank WM-185) is approximately 152 mrem at 100 years after closure. Tank WM-185 is used for the chronic drilling scenario because the tank system includes a contaminated sandpad. The drilling scenario assumes the intruder will drill directly through the tank residual and sandpad.
This total dose is well within the limit of 500-mrem TEDE.rrr Table 22 lists the major radionuclides contributing to this dose.
Table 22. Acute intruder-drilling dose (less than 500 mrem) (Portage 2005g).
Nuclide Dose Based on Residual Inventory at Closure
(mrem) 90Sr/90Y 0.3 94Nb 0.14 137Cs/137mBa 108 237Np 0.07 238Pu 7.71 239Pu 15.1 240Pu 2.82 241Am 17.7 Total Dose 152
For chronic exposures, five intruder scenarios are investigated: intruder post-construction,
intruder-resident, intruder-radon, biointrusion, and post-drilling. Again, because of the depth of the final waste form in the tank bottom and piping, intruder post-construction and post-drilling exposure are the only credible scenarios. The chronic intruder post-construction scenario is an extension of the acute intruder-construction scenario. This scenario assumes that an intruder lives in the building constructed as part of the intruder-construction scenario and engages in agricultural activities on the contaminated site. The intruder is exposed to contamination by inhalation of resuspended contaminated soil, inhalation of
rrr. In its RAI Comment 16 (NRC 2006a), NRC noted that intruder analysis assumptions regarding the depth and area of contamination significantly impact the resulting dose for the acute or chronic well intruder scenarios and requested that DOE conduct additional sensitivity analysis. In DOE’s response to NRC RAI Comment 16 (ICP 2006l), an intruder sensitivity analysis was conducted for the acute intruder-drilling scenario. The acute intruder-drilling scenario assumed that the cuttings from a 0.6-m (22-in.) irrigation well were placed in a 3- by 3-m (10- by 10-ft) pit during drilling operations. The intruder was assumed to stand next to the pit for the entire drilling duration of 160 hours. The residuals from the tanks and sandpads would initially be exposed at the surface of the pit, and then increasing thicknesses of clean material would be placed on top of the contaminated material. On page 107 of its TER (NRC 2006b), NRC notes that the results show the external dose from 137Cs could be a factor of two higher with this alternative model and a factor of three higher considering the uncertainty in the sandpad inventory. NRC asserts that considering both of these factors, the intruder dose could be higher than the performance objective of 5 mSv/yr (500 mrem/yr). Although NRC notes that this would only occur under very pessimistic conditions, it did not provide its calculations to confirm its assertion. DOE has confirmed that results of its sensitivity analysis for the acute-intruder drilling scenario presented in NRC RAI Comment 16 (NRC 2006a) demonstrate that the alternative model along with the highest predicted sandpad inventory provide a maximum dose of 307 mrem. This 307 mrem value includes both the contribution from the highest sandpad inventory and the alternative pit model. On page 108 of the TER (NRC 2006b), the NRC staff notes “With the additional sensitivity analyses, DOE Idaho developed reasonable intruder scenarios to evaluate protection of inadvertent intruders and demonstrated that performance objectives found in 10 CFR 61.42, ‘Protection of Individuals from Inadvertent Intrusion,’ could be achieved…All intruder doses are calculated to be less than 5 mSv/yr (500 mrem/yr), except under very pessimistic conditions.”

93
gaseous radionuclides released from the waste, external irradiation, ingestion of contaminated soil, ingestion of contaminated beef and milk, and ingestion of contaminated vegetables. The maximum dose is 3.15 mrem/yr for the chronic intruder post-construction scenario at 100 years post-closure. This result is well below the performance objective of 500 mrem/yr. Table 23 shows the major radionuclide contributors to the total chronic intruder dose (Portage 2005g).
Table 23. Chronic intruder-construction dose (Portage 2005g).
Nuclide Dose Based on Residual Inventory at Closure
(mrem/yr) 90Sr/90Y 4.44E–02 94Nb 1.55E–02 137Cs/137mBa 2.88E+00 237Np 2.58E–03 238Pu 1.02E–01 239Pu 6.30E–02 240Pu 2.97E–02 241Am 1.37E–02 Total Dose 3.15E+00
The chronic post-drilling scenario is a logical extension of the drilling scenario considered for
acute exposures. This scenario assumes that the intruder occupies the site after drilling a water well and that the intruder grows crops on a mixture of clean soil and contaminated drill cuttings. Exposures from inhaling dust from farming activities, ingesting vegetables grown in the soil, and ingesting products from animals that have eaten contaminated feed are considered. The chronic scenario dose for Tank WM-185 is approximately 25 mrem/yr at 100 years after closure, as shown in Table 24. Tank WM-185 is used for the chronic drilling scenario because the tank system includes a contaminated sandpad. This scenario includes drilling through the tank residual and sandpad. The short-lived 137Cs/137mBa provides 85% of the total dose. Chronic intruder doses are reduced dramatically with time because of the decay of 137Cs (Portage 2005g).
Table 24. Chronic intruder-drilling dose comparison (Portage 2005g).
Nuclide Dose Based on Residual Inventory at Closure
(mrem/yr) 90Sr/90Y 1.69 94Nb 0.03 137Cs/137mBa 21 237Np 0.007 238Pu 0.33 239Pu 0.61 240Pu 0.12 241Am 0.75 Total Dose 25
The uncertainty in the intruder analyses is largely based on the assumptions and parameters
selected for the mathematical modeling. However, every attempt was made while running the models to consider the site-specific environment and habits of the people currently in the region. Therefore, the

94
analyses are considered to be representative of the INL Site region. The predicted doses are considered to be conservative, and there is a reasonable assurance that the performance objectives will not be exceeded for the 1,000-year post-closure period.sss
7.11 10 CFR 61.43, “Protection of Individuals during Operations”
Requirements in 10 CFR 61.43 state:
[O]perations at the land disposal facility must be conducted in compliance with the standards for radiation protection set out in part 20 of this chapter [10 CFR], except for releases of radioactivity in effluents from the land disposal facility, which shall be governed by §61.41 of this part. Every reasonable effort shall be made to maintain radiation exposures as low as is reasonably achievable.
This requirement references 10 CFR 20, “Standards for Protection Against Radiation,” which contains radiological protection standards for workers and the public. The DOE requirements for occupational radiological protection are provided in 10 CFR 835, “Occupational Radiation Protection,” and those for radiological protection of the public and the environment are provided in DOE Order 5400.5, “Radiation Protection of the Public and the Environment” (1993).
The closure activities at the TFF are maintained under the DOE dose limits for the worker, public, and environment. The TFF PA does not address the operational (i.e., closure and disposal activities) of the facility, only the post-closure (i.e., post-disposal) aspects of the facility. However, during Tank WM-182 cleaning operations, the total radiation exposure to the 23 workers was about 650 mrem for an average exposure of about 30 mrem per individual. This information is based upon a review of dosimetry results from TFF radiation work permits for the January 2002 to June 2005 timeframe (Martin 2005), and the following is summarized as further explained in Appendix B-4:
• The average radiation exposure per tank that will be experienced for cleaning each TFF tank is expected to total about 650 mrem for all occupational exposure
• The average exposure per person for cleaning a TFF tank will be about 650 mrem divided by 23 people, which is about 30 mrem per person
sss. In its RAI Comment 16 (NRC 2006a), NRC noted that intruder analysis assumptions regarding the depth and area of contamination significantly impact the resulting dose for the acute or chronic well intruder scenarios and requested that DOE conduct additional sensitivity analysis. In DOE’s response to NRC RAI Comment 16 (ICP 2006l), an intruder sensitivity analysis was conducted for the chronic intruder-drilling scenario. Three parameters were varied: well diameter (25, 20, and 15 cm [10, 8, and 6 in.]), contaminant spreading area (1,100, 1,600, and 2,200 m2 [0.3, 0.4, and 0.5 acres]), and the tilling depth (30, 46, and 61 cm [12, 18 and 24 in.]). On page 107 of its TER (NRC 2006b), NRC notes the results of the sensitivity analysis show that the dose of 0.21 mSv/yr (21 mrem/yr) reported in the PA could be a factor of three higher with a large diameter well (25 cm [10 in.] versus 15 cm [6 in.]), a factor of two higher with a smaller area of contamination (1,100 m2 [0.3 acres]), a factor of two higher considering the highest inventory in the sandpad, and a factor of two higher considering a factor of two reduction in the tilling depth. NRC states that all of these factors considered would lead to a maximum dose just over the 500-mrem/yr performance objective. NRC concludes that only under very pessimistic circumstances could the dose to an inadvertent intruder approach the performance objective of 500 mrem/yr for the chronic well drilling scenario. On page 108 of the TER (NRC 2006b), the NRC staff notes “With the additional sensitivity analyses, DOE Idaho developed reasonable intruder scenarios to evaluate protection of inadvertent intruders and demonstrated that performance objectives found in 10 CFR 61.42, ‘Protection of Individuals from Inadvertent Intrusion,’ could be achieved…All intruder doses are calculated to be less than 5 mSv/yr (500 mrem/yr), except under very pessimistic conditions.”

95
• The maximum radiation exposure for an individual worker is estimated to be 120 mrem for cleaning a single TFF tank.
Worker dose for tank cleaning is minimal because all cleaning is accomplished remotely. Worker exposures would be limited to equipment installation and operation and maintenance activities on contaminated equipment. Worker exposure per tank is estimated to total approximately 650 mrem for 23 workers (30 mrem per worker), which results in a total exposure of about 7.15 rem for cleaning eleven 300,000-gal tanks. Therefore, based on estimates that future tank cleaning will probably be accomplished in 1 year and that minimal exposure is expected during grouting (INEEL 1998), an estimated worker dose of 30 mrem/yr is reasonable.
Consistent with Section 3116(a), the cross-referenced “standards for radiation protection” in 10 CFR 20 that are considered in detail in this 3116 Basis Document are the dose limits for the public and the workers during disposal operations set forth in 10 CFR 20.1101(d), 20.1201(a)(1)(i), 20.1201(a)(1)(ii), 20.1201(a)(2)(i), 20.1201(a)(2)(ii), 20.1201(e), 20.1208(a), 20.1301(a)(1), 20.1301(a)(2), and 20.1301(b).ttt These dose limits correspond to the dose limits in 10 CFR 835 and relevant DOE orders that establish DOE regulatory and contractual requirements for DOE facilities and activities. The following subsections show that closure operations of the TFF meet these dose limits and that doses will be maintained ALARA.uuu
7.11.1 Air Emissions Limit for Individual Member of the Public [10 CFR 20.1101(d)]
The NRC regulation in 10 CFR 20.1101(d) provides in relevant part:
[A] constraint on air emissions of radioactive material to the environment, excluding radon-222 and its daughters, shall be established … such that the individual member of the public likely to receive the highest dose will not be expected to receive a total effective dose equivalent in excess of 10 mrem (0.1 mSv)/yr from these emissions.
ttt. The introductory “notwithstanding” phrase to Section 3116 makes it clear that the provisions of Section 3116(a) are to apply in lieu of other laws that “define classes of radioactive waste.” As is evident from the plain language of this introductory “notwithstanding” phrase, Section 3116(a) pertains to classification and disposal, and radiation protection standards for disposal, of certain waste at certain DOE sites. Thus, the factors for consideration set forth in Subsections (a)(1)–(3) of Section 3116 are those that pertain to classification and disposal of waste, and the radiation protection standards for disposal. The Joint Explanatory Statement of the Committee of Conference in Conference Report 108-767, accompanying H.R. 4200 (NDAA), also confirms that 3116(a) concerns classification, disposal, and radiation protection standards associated with disposal, and does not concern general environmental laws or laws regulating radioactive waste for purposes other than disposal. Moreover, in the plain language of Section 3116, Congress directed that the Secretary of Energy consult with the NRC but did not mandate that DOE obtain a license or any other authorization from NRC, and did not grant NRC any general regulatory, administrative, or enforcement authority for disposal of the DOE wastes covered by Section 3116. As such, the “standards for radiation protection” in 10 CFR 20 (as cross-referenced in the performance objective in 10 CFR 61.43), which are relevant in the context of Section 3116, are the dose limits for radiation protection of the public and the workers during disposal operations, and not those which address general licensing, administrative, programmatic, or enforcement matters administered by NRC for NRC licensees. Accordingly, this 3116 Basis Document addresses in detail the radiation dose limits for the public and the workers during disposal operations that are contained in the provisions of 10 CFR 20 referenced above. Although 10 CFR 20.1206(e) contains limits for planned special exposures for adult workers, there will not be any such planned special exposures for closure operations at TFF. Therefore, this limit is not discussed further in this 3116 Basis Document. Likewise, 10 CFR 20.1207 specifies occupational dose limits for minors. However, there will not be minors working at TFF who will receive an occupational dose. Therefore, this limit is not discussed further in this 3116 Basis Document.
uuu. In addition, 10 CFR 835, like 10 CFR 20 for NRC licensees, includes requirements that do not set dose limits, such as requirements for radiation protection programs, monitoring, entrance controls for radiation areas, posting, records, reporting, and training.

96
The DOE similarly limits doses from air emissions to the public to 10 mrem/yr in DOE Order 5400.5 (1993). The DOE is also subject to and complies with the EPA’s requirement in 40 CFR 61.92, which has the same limit.vvv The estimated dose per year from airborne emissions to the maximally exposed individual member of the public resulting from closure/disposal activities is 0.51 mrem/yr (DOE-ID 2003b).
7.11.2 Total Effective Dose Equivalent Limit for Adult Workers [10 CFR 20.1201(a)(1)(i)]
The NRC regulation in 10 CFR 20.1201(a), concerning occupational dose limits for adults, provides in relevant part:
(a) [C]ontrol the occupational dose to individual adults, except for planned special exposures…to the following dose limits.
(1) An annual limit, which is the more limiting of –
(i) The total effective dose equivalent being equal to 5 rems (0.05 Sv).
The DOE’s regulation in 10 CFR 835.202(a)(1) has the same annual dose limit for the annual
occupational dose to general employees.www For the occupational dose to adults during closure operations at the TFF, the TEDE per year will be controlled ALARA below 5 rem, as shown in Appendix B-4.
7.11.3 Any Individual Organ or Tissue Dose Limit for Adult Workers [10 CFR 20.1201(a)(1)(ii)]
The NRC regulation in 10 CFR 20.1201(a), concerning occupational dose limits for adults, provides in relevant part:
(a) [C]ontrol the occupational dose to individual adults, except for planned special exposures…to the following dose limits.
(1) An annual limit, which is the more limiting of –…
(ii) The sum of the deep-dose equivalent and the committed dose equivalent to any individual organ or tissue other than the lens of the eye being equal to 50 rems (0.5 Sv).
vvv. 40 CFR 61.92 provides as follows: “Emissions of radionuclides to the ambient air from DOE facilities shall not exceed those amounts that would cause any member of the public to receive in any year an effective dose equivalent of 10 mrem/yr. It is assumed that the individual is an adult living at the site perimeter that is exposed to the maximum yearly radioactive atmospheric release and maximum radiation concentration in food for 365 days per year. For the airborne pathway, the dose is developed by the input of atmospheric release data, vegetation consumption data, milk consumption data, and beef consumption data.”
www. The DOE’s regulation requires that the occupational dose per year for general employees shall not exceed both a TEDE of 5 rem and the sum of the deep-dose equivalent for external exposures and the committed dose equivalent to any other organ or tissue other than the lens of the eye of 50 rem. The NRC’s regulation specifies that either of these two limits shall be met by NRC licensees, whichever is more limiting. This 3116 Basis Document shows that DOE will meet the more stringent of the dose limits in 10 CFR 835 and the relevant dose limits in 10 CFR 20. Because DOE imposes stricter, separate requirements, the provisions of 10 CFR 20.1201(a)(1) and (a)(2), which correlate to 10 CFR 835.202(a)(1) and (a)(2), are discussed in separate subsections in this 3116 Basis Document.
97
The dose limit specified in 10 CFR 20.1201(a)(1)(ii) is the same as that specified in 10 CFR 835.202(a)(2). For the occupational dose to adults during disposal/closure operations at TFF, the sum of the deep-dose equivalent and the committed dose equivalent to any individual organ or tissue other than the lens of the eye will be controlled to ALARA below a maximum of 50 rem/yr. The INL “Radiological Control Manual” (PRD-183, 2002) provides that the design basis annual occupational exposure limits for any organ or tissue other than the eye cannot exceed 50 rem/yr, which is the same as the NRC limit. Furthermore, TFF disposal/closure operations will consist predominantly of remote cleaning technologies to minimize hands-on work and associated exposure.
7.11.4 Annual Dose Limit to the Lens of the Eye for Adult Workers [10 CFR 20.1201(a)(2)(i)]
The NRC regulation in 10 CFR 20.1201(a), concerning occupational dose limits for adults, provides in relevant part:
(a) [C]ontrol the occupational dose to individual adults, except for planned special exposure the following dose limits. …
(2) The annual limits to the lens of the eye, to the skin of the whole body or to the skin of the extremities, which are:
(i) A lens dose equivalent of 15 rems (0.15 Sv).
The dose limit specified in 10 CFR 20.1201(a)(2)(i) is the same as that specified in DOE’s
regulation in 10 CFR 835.202(a)(3). For the occupational dose to adults during closure operations at the TFF, the annual dose limit to the lens of the eye will be controlled to ALARA below a maximum of 15 rem/yr. Furthermore, disposal/closure operations will consist predominantly of remote cleaning technologies to minimize hands-on work and associated exposure.
7.11.5 Annual Dose Limit to the Skin of the Whole Body and to the Skin of the Extremities for Adult Workers [10 CFR 20.1201(a)(2)(ii)]
The NRC regulation in 10 CFR 20.1201(a), concerning occupational dose limits for adults, provides in relevant part:
(a) [C]ontrol the occupational dose to individual adults, except for planned special exposures…to the following dose limits. …
(2) The annual limits to the lens of the eye, the skin of the whole body, or to the skin of the extremities, which are: …
(ii) A shallow-dose equivalent of 50 rem (0.5 Sv) to the skin of the whole body or to the skin of any extremity.
This NRC dose limit specified in 10 CFR 20.1201(a)(2)(ii) is the same as the DOE dose limit specified in 10 CFR 835.202(a)(4). For the occupational dose to adults during closure operations at the TFF, which involve little hands-on activity, the annual dose limit to the skin of the whole body or to the skin of any extremity will be controlled to ALARA below a shallow-dose equivalent of 50 rem/yr. Furthermore, disposal/closure operations will consist predominantly of remote cleaning technologies to minimize hands-on work and associated exposure.

98
7.11.6 Limit on Soluble Uranium Intake [10 CFR 20.1201(e)]
The NRC regulation in 10 CFR 20.1201(e), concerning occupational dose limits for adults, provides in relevant part: “in addition to the annual dose limits, … limit the soluble uranium intake by an individual to 10 milligrams in a week in consideration of chemical toxicity.”
Requirements in DOE Order 440.1A (1998) for soluble uranium intake are the more restrictive of the concentrations in the American Conference of Governmental Industrial Hygienists Threshold Limit Values (0.2 mg/m3, which is the same as noted in 10 CFR 20, Appendix B) or the Occupational Safety and Health Administration permissible exposure limit (0.05 mg/m3) (DOE O 440.1A, 1998). The permissible exposure limit for soluble uranium, which equates to a soluble uranium intake of 2.4 mg/week, is the more restrictive of the two. Therefore, this limit is imposed for TFF closure operations. Furthermore, disposal/closure operations will consist predominantly of remote cleaning technologies to minimize hands-on work and associated exposure.
7.11.7 Dose Equivalent to an Embryo/Fetus [10 CFR 20.1208(a)]
The NRC regulation in 10 CFR 20.1208(a), concerning the dose equivalent to an embryo/fetus, provides in relevant part: “ensure that the dose equivalent to the embryo/fetus during the entire pregnancy, due to the occupational exposure of a declared pregnant woman, does not exceed 0.5 rem (5 mSv).”
The DOE’s regulation in 10 CFR 835.206(a) has the same dose limit. For the occupational dose to an embryo/fetus during closure operations at the TFF, doses will be controlled so that the dose equivalent to the embryo/fetus during the entire pregnancy for a declared pregnant worker will not exceed 0.5 rem. Furthermore, after declaration of pregnancy, DOE provides the option of a mutually agreeable assignment of work tasks, without loss of pay or promotional opportunity, such that further occupational radiation exposure during the remainder of the gestation period is unlikely. In addition, personnel dosimetry is provided and used to track exposure carefully.
7.11.8 Dose Limits for Individual Members of the Public [10 CFR 20.1301(a)(1)]
The NRC regulation in 10 CFR 20.1301(a), concerning dose limits for individual members of the public, provides in relevant part:
(a) [C]onduct operations so that –
(1) The total effective dose equivalent to individual members of the public …does not exceed 0.1 rem (1 mSv) in a year, exclusive of the dose contributions from background radiation, from any medical administration the individual has received, from exposure to individuals administered radioactive material and released…, from voluntary participation in medical research programs, and from the …disposal of radioactive material into sanitary sewerage.
Provisions in DOE Order 5400.5(II.1.a) (1993) similarly limit public doses to less than 100 mrem/yr. However, DOE’s application of the limit is more restrictive in that DOE is required to make a reasonable effort to ensure that multiple sources (e.g., DOE sources and NRC-regulated sources) do not combine to cause the limit to be exceeded. For individual members of the public during closure operations at the TFF, the TEDE limit to an individual member of the public will be controlled to less than 0.1 rem/yr. The dose to the maximally exposed individual outside the INL Site boundary is

99
calculated each year and shown less than 100 mrem/yr. The latest annual report shows the dose to be 0.035 mrem/yr for Calendar Year 2003 (DOE-ID 2004b).
7.11.9 Dose Limits for Individual Members of the Public [10 CFR 20.1301(a)(2)]
The NRC regulation in 10 CFR 20.1301(a), concerning dose limits for individual members of the public, provides in relevant part:
(a) [C]onduct operations so that – …
(2) The dose in any unrestricted area from external sources, exclusive of the dose contributions from patients administered radioactive material and released …, does not exceed 0.002 rem (0.02 millisievert) in any one hour.
The DOE’s regulation in 10 CFR 835.602 establishes the expectation that the TEDE in controlled areas will be less than 0.1 rem/yr. To ensure that these dose limits are met, the following measures have been instituted within controlled areas. Per 10 CFR 835.603(g), radioactive materials areas have been established for accumulations of radioactive material that could result in a radiation dose of 100 mrem/yr or greater. Averaged over a work year, this yields a constant dose rate of 0.00005 rem/hr as compared to the NRC limit of 0.002 rem in any one hour. In addition, training and dosimetry are required for individual members of the public for entry into controlled areas.
7.11.10 Dose Limits for Individual Members of the Public [10 CFR 20.1301(b)]
The NRC regulation in 10 CFR 20.1301(b), concerning dose limits for individual members of the public, provides in relevant part: “if … members of the public [are permitted] to have access to controlled areas, the limits for members of the public continue to apply to those individuals.”
The DOE’s regulation in 10 CFR 835.208 has the same dose limit. The TEDE limit to an individual member of the public granted access to controlled areasxxx during disposal operations at TFF will be controlled to 0.1 rem/yr. Furthermore, training is required for individual members of the public for entry into controlled areas. In addition, to ensure no member of the public exceeds radiation exposure limits, use of dosimetry is required if a member of the public is expected to enter a controlled area and receive a dose that may exceed 0.05 rem/yr.yyy
7.11.11 As Low As Reasonably Achievable (10 CFR 20.1003)
The NRC regulation in 10 CFR 20.1003 defines ALARA in relevant part: “ALARA … means making every reasonable effort to maintain exposures to radiation as far below the dose limits … as is practical consistent with the purpose for which the … activity is undertaken.”
xxx. 10 CFR 20.1003 defines restricted areas as “an area, access to which is limited … for the purpose of protecting individuals against undue risks from exposure to radiation and radioactive materials.” This definition is the same as that in 10 CFR 835.2 for a controlled area.
yyy. 10 CFR 20.1301(d) allows licensees to request NRC authorization to allow an individual member of the public to receive up to an annual dose limit of 0.5 rem. 10 CFR 835 is more restrictive for the dose to an individual member of the public with a limit of 0.1 rem maximum annual dose.

100
The DOE has a similar requirement, and DOE’s regulation in 10 CFR 835.2 defines ALARA as “the approach to radiation protection to manage and control exposures (both individual and collective) to the work force and to the general public to as low as is reasonable.” For radiological work activities during closure operations at the TFF, every reasonable effort will be made to maintain exposures to radiation as far below the dose limits as is practical consistent with the purpose for which the activity is undertaken. Furthermore, DOE’s regulation in 10 CFR 835.101(c) requires the contents of each radiation protection program (RPP) to include formal plans and measures for applying the ALARA process to occupational exposure.
The ALARA process provides for rigorous reviews. Worker dose reduction is achieved through reviews of potential worker exposures against established criteria and then applying appropriate radiological engineering measures, including:
• Inclusion of radiological control points
• Use of work processes and special tools to reduce exposure time
• Use of engineered controls, including fixatives or covering work areas
• Specification of special radiological training or unique monitoring requirements
• Use of mockup training for first of a kind, high exposure, or complex tasks
• Engineering design and use of temporary shielding to reduce radiation levels and time in radiation fields
• Walk-down or dry run of activity using applicable procedures
• Staging and prefabrication of necessary materials and special tools
• Maximization of prefabrication and shop work
• Provisions for waste minimization.
The institutionalized application of the ALARA program for TFF activities contributed to the low doses achieved for previous tank work as described in Appendix B-4.
7.11.12 Reasonable Assurance
Measures that provide reasonable assurance that closure operations at the TFF will comply with the applicable dose limits and with the ALARA provisions include: (1) the documented RPP; (2) the safety analysis; (3) design; (4) regulatory and contractual enforcement mechanisms; and (5) access controls, training, and dosimetry. These measures are discussed in the following subsections.
7.11.12.1 INL Radiation Protection Program. The DOE regulates occupational radiation exposure at its facilities through 10 CFR 835, “Occupational Radiation Protection,” which establishes exposure limits and other requirements to ensure that DOE facilities are operated in a manner such that occupational exposure to workers is maintained within acceptable limits and as far below these limits as is reasonably achievable. The requirements in 10 CFR 835 are nuclear safety requirements, which if violated, provide a basis for the assessment of civil penalties under the Section 234A of the Atomic Energy Act (42 USC 2011 et seq. 1954).

101
Pursuant to 10 CFR 835, activities at the INL Site, including closure operations at the TFF, must be conducted in compliance with the documented RPP for the INL Site as approved by DOE (PLN-260, 2003). The key elements of the RPP include monitoring of individuals and work areas, control of access to areas containing radiation and radioactive materials, use of warning signs and labels, methods to control the spread of radioactive contamination, radiation safety training, objectives for the design of facilities, criteria for levels of radiation and radioactive material in the workplace, and continually updated records to document compliance with the provisions of 10 CFR 835. The RPP also includes formal plans and measures for applying the ALARA process.
The RPP procedures control the planning of radiological work, the use of radiation monitoring devices by employees, the bioassay program, the air monitoring program, the contamination control program, the ALARA program, the training of general employees, radiological workers, radiological control inspectors, and health physics professionals and technicians, and the other aspects of an occupational RPP as required by 10 CFR 835.
7.11.12.2 Documented Safety Analysis. The DOE has approved a safety analysis report for operating the TFF in accordance with 10 CFR 830. The “Safety Analysis Report for the Tank Farm Facilities” (SAR-107, 2004) identifies, classifies, and evaluates hazards associated with the closure project. The first step in developing the safety analysis report was a formal hazards analysis to evaluate the potential risk of operations to the workers and the public. A group of subject-matter experts with expertise in operations, engineering, industrial hygiene, radiological protection, environmental compliance, and maintenance performed the analysis.
The hazards analysis consisted of three basis phases: hazard identification, hazard classification, and hazard evaluation. During the hazard identification phase, all possible radiological and chemical hazardous materials associated with the normal and abnormal operations of the facility were identified, along with all potential energy sources available to disperse the hazardous materials to the environment.
During the hazard classification phase, the maximum quantities of hazardous materials possible in the TFF were evaluated against the criteria listed in DOE-STD-1027-92, “Hazard Categorization and Accident Analysis Techniques for Compliance with DOE Order 5480.23, Nuclear Safety Analysis Reports” (1997), to determine the overall hazard classification of the facility. The team determined that the hazard classification of the TFF was Hazard Category 2. This classification denotes a potential for significant onsite consequences. This facility has the potential for release of sufficient quantities of hazardous material, which would require onsite emergency planning activities.
During the third and final phase of the hazard analysis, all possible normal and abnormal operational events that could result in exposing facility workers or the public to hazardous material were evaluated to determine the magnitude of the risk. During this hazard evaluation phase, the consequence and frequency of each operational event were determined qualitatively, and the resulting level of risk was identified. The purpose of identifying the level of risk was to determine which operational events posed some level of risk (and thus required additional evaluation) and which events presented negligible risk to the facility workers and public.
The safety analysis report analyzed the hazards that were identified in the hazards analysis that could impact facility workers during normal operations and accident conditions, and specifically included radiation exposure hazards. The report identified the basis for derivation of the TFF technical safety requirements and also provided summary descriptions of the key features of safety management programs at the INL Site as they pertain to the TFF (see Appendix I).

102
7.11.12.3 Regulatory and Contractual Enforcement. Any violation of the requirements in 10 CFR 835 is subject to civil penalties pursuant to Section 234A of the Atomic Energy Act of 1954 (42 USC 2011 et seq. 1954), as implemented by DOE regulations in 10 CFR 820. In addition, the requirements in 10 CFR 835 and all applicable DOE orders are incorporated into all contracts with DOE contractors, the DOE contractor for closure operations at the TFF, as well as other operations at the INL Site. The DOE enforces these contractual requirements through contract enforcement measures, including the reduction of contract fees.
7.11.12.4 Access Controls, Training, Dosimetry, and Monitoring. Training or an escort is required for individual members of the public to enter controlled areas. In addition, dosimetry is required if a member of the public is expected to enter a controlled area and exceed a dose of 0.05 rem/yr to ensure radiation exposure limits are not exceeded for any member of the public.
Also, worker radiation exposure monitoring is performed for all workers expected to receive 100 mrem/yr from internal and external sources of radiation to provide that no worker exceeds radiation exposure limits and that all radiation doses are maintained as far below the limits as is reasonably achievable.zzz
7.12 10 CFR 61.44, “Long-Term Stability of Disposal Site”
10 CFR 61.44 states:
The disposal facility must be sited, designed, used, operated and closed to achieve long-term stability of the disposal site and to eliminate to the extent practicable the need for ongoing active maintenance of the disposal site following closure so that only surveillance, monitoring, or minor custodial care are required.
As discussed previously, several of the tanks in the TFF have been removed from service and cleaned in preparation for grouting and final closure of the TFF. Once the remaining SBW has been transferred from the tanks for treatment and disposal outside the State of Idaho, the remainder of the tanks will be cleaned and closed. Cleaning and closure of the TFF is planned to be completed by 2012. As shown below, disposal of the stabilized residuals in the TFF, and TFF tank system, in situ will meet the performance objectives of 10 CFR 61.44 for long-term stability.
7.12.1 Siting
A comprehensive review of site geology, seismology, hydrology, demography, meteorology, and environmental setting are presented in Section 2 of the TFF PA (DOE-ID 2003b), which is briefly summarized as follows. The INL is located in southeastern Idaho, on the west-central portion of the Eastern Snake River Plain (ESRP). The nearest INL boundaries are 35 km (22 mi) west of Idaho Falls, 37 km (23 mi) northwest of Blackfoot, 71 km (44 mi) northwest of Pocatello, and 11 km (7 mi) east of Arco. There are no permanent residents within an 18-km (11-mi) radius of INTEC. The Snake River Plain Aquifer is approximately 122 m (400 ft) below ground surface at INTEC.
The principal surface materials at the INL are basalt, alluvium, lakebed sediments, volcanic rocks, and sedimentary rocks. The natural plant life consists mainly of sagebrush and various grasses. The most zzz. On page 112 of its TER (NRC 2006b) NRC concluded, “…there is reasonable assurance that DOE Idaho can meet 10 CFR 61.43 requirements for protection of individuals during operations.”
103
prominent ground cover is a mixture of sagebrush and a variety of grasses. The soil at the INL TFF site is previously disturbed sandy gravel; the flat terrain precludes erosion.
The seismically active intermountain seismic belt surrounds the ESRP. The intermountain seismic belt is a zone of concentrated seismicity, which extends from northwestern Montana to eastern Idaho. The ESRP is not a part of the intermountain seismic belt, and therefore, is not seismically active. The primary seismic hazards from earthquakes to INL Site facilities consist of the effects from ground shaking and surface deformation. Based on the seismic history and geologic conditions, earthquakes greater than a magnitude of 5.5 and associated strong ground shaking and surface fault ruptures are not likely to occur within the ESRP (DOE-ID 2003b).
A large earthquake, in the vicinity of the INL but outside the ESRP, occurred in 1983 and had a surface-wave magnitude of 7.3. The epicenter for this event was located approximately 89–97 km (55–60 mi) from the INL Site. Although the earthquake ground motions were felt at the INL Site, only minor non-nuclear building damage occurred in the form of hairline cracks and settlement. The INTEC facility did not experience structural failures or waste spills as a result of the earthquake and waste storage facilities did not show evidence of permanent movement or resulting damage. Peak ground accelerations ranging from 0.022 to 0.078 g were recorded at several INL Site facility areas. The largest earthquake in the region occurred in, 1959, at Hebgen Lake, Montana, located approximately 193 km (120 mi) northeast of the INL. The event had a surface-wave magnitude of 7.5; it was felt at the INL Site, but caused no damage (DOE-ID 2003b).
Volcanic hazards include the effects of lava flows, fissures, uplift, subsidence, volcanic earthquakes, and ash flows or airborne ash deposits. Most of the volcanic activity occurred from 4 million to 2,100 years ago in the INL Site area. The most recent and closest volcanic eruption occurred at the Craters of the Moon National Monument, 46 km (27 mi) southwest of INTEC. Volcanic activity is a result of large volumes of magma or hotspots relatively near the Earth’s surface. Because the hotspot is now situated beneath Yellowstone National Park and continues to move away from the INL Site, recurrence of volcanic activity in the INL Site area is unlikely (DOE-ID 2003b).
The Big Lost River enters the INL Site near the southern end from the west. During exceptionally wet years, the Big Lost River flows in a large arc north to the foot of the Lemhi Mountain Range, where it ends in a series of playas (sinks). The northwest boundary of INTEC is closest to the Big Lost River channel, approximately 61 m (200 ft) away. The Big Lost River is the principle natural surface water feature on the INL and the only stream with potential impacts to the TFF.
A record snow pack occurred in the Big Lost River Basin in the winter of 1964/1965. This flood is significant because it exhibited the largest crest and largest water volume to be discharged onto the INL Site in 65 years of record, yet caused no damage to INL Site facilities. In a review of the historical information, no flooding or inundation from storms or runoff has caused flooding of the INTEC site. To evaluate the potentially higher infiltration rates at the TFF, modeling was conducted to simulate a 500-year flood event of the Big Lost River. The analysis performed as part of the PA sensitivity analysis indicated there was no significant increase to the groundwater receptor based on these high transient infiltration rates.
7.12.2 Design
As described in Section 2 of this 3116 Basis Document, the TFF design provides for eleven underground 300,000-gal stainless tanks surrounded by concrete vault structures. These tanks have a right-cylinder shape, and are approximately 15.2 m (50 ft) in diameter and approximately 6.4–7.0 m (21–23 ft) in height. The bottom and lower half of the tank walls are constructed of 0.8-cm (0.3-in.) thick

104
Type 304L stainless steel with two tanks constructed of Type 307 stainless steel. The upper half to the tank wall and domes are constructed of 0.63-cm (0.25-in.) thick stainless steel. Stainless steel piping of approximately 5 cm (2 in.) in diameter is in place between the tanks to allow transfers to and from individual tanks and process facilities.
The concrete vaults are of three different designs. The vaults surrounding Tanks WM-180 and WM-181 are approximately 0.3 m (1 ft) thick, including a 0.6-m (2-ft) thick vault floor. An approximately 15-cm (6-in.) thick layer of sand was placed between the bottom of the tanks and the vault floor to provide cushioning for the tank. The vaults that surround Tanks WM-182 through WM-186 are of different construction. The concrete walls are approximately 0.3 m (1 ft) in thickness and the floor is approximately 0.6 m (2 ft) in thickness. The vaults surrounding Tanks WM-187 through WM-190 have walls that are 1 m (3 ft) thick and a floor that is 0.8 m (2.5 ft) thick. A minimum space of approximately 0.5–1.2 m (1.5–4 ft) between the outer tank walls and the inside of the vault wall is referred to as the tank annulus. The space and volume of the annulus surrounding the tanks varies because of varied vault construction.
The four 30,000-gal tanks are constructed much differently. These tanks are horizontal cylinders (“cigar-shaped”) approximately 3.5 m (11.5 ft) in diameter and 11.6 m (38 ft) in length. The tanks were made of Type 316L stainless steel (thicker plate than the 300,000-gal tanks (1.7 cm [0.68-in.] cylinder and 0.27-cm [0.5-in.] heads), and had extra plate installed over the weld seams to protect them from corrosion. These tanks are not surrounded by a vault structure. Each of the 30,000-gal tanks is buried approximately 3 m (10 ft) underground and rests on a curbed concrete pad. Stainless steel piping of approximately 5 cm (2 in.) diameter is in place between the tanks allow transfers from individual tanks and to process facilities.
7.12.3 Use/Operation
The TFF is used to store a variety of wastes as described in Section 2 of this 3116 Basis Document. These wastes include both radioactive constituents and constituents that are considered hazardous under RCRA (42 USC 6901 et seq. 1976). As such, the TFF is operated regulated by the State of Idaho as an interim status unit under HWMA (State of Idaho 1983) regulations. As described in Section 2, seven of the 300,000-gal tanks and the four 30,000-gal tanks have been removed from operational service and cleaned in preparation for grouting and future closure of the TFF. Four other 300,000-gal tanks remain in an active, operational status to store the remaining SBW. In the future, as the SBW is removed from the tanks for treatment and disposal, these tanks will be cleaned, grouted, and closed.
7.12.4 Closure
As described in Section 2, closure of the tanks includes cleaning of the tanks, vaults, and associated interconnecting piping and ancillary equipment, followed by completely filling these components with a grout material to immobilize any remaining residual waste and provide for a stable structure.aaaa
Long-term stability of the disposal site after closure means that the waste maintains structural integrity under the expected disposal conditions. As such, the long-term stability of the closed facility is an important element of meeting the performance objectives. Stability prevents trench subsidence, water aaaa. In a separate process under CERCLA, DOE also plans to cap the surface of the TFF to meet the remedial action objectives agreed to by DOE, DEQ, and EPA pursuant to the 1991 Federal Facility Agreement and Consent Order. The DOE’s Proposed Plan for Tank Farm Soil and INTEC Groundwater, Operable Unit 3-14 (ICP 2006k), which includes capping the surface of the TFF, has been issued for public comment. The CERCLA ROD is planned for 2007. Capping will reduce water infiltration and provide worker protection, where appropriate.

105
infiltration, and radionuclide release because of disintegration of the waste form, and minimizes the likelihood of intrusion into the waste. The waste form itself can provide structural stability by processing the waste to a stable form or by placing the waste in a disposal container or structure that provides stability after disposal. The primary barrier relied upon at the TFF to provide structural stability for the tank residuals is the stainless steel tank. The primary barrier for the residuals in the vault and sandpads is the concrete vault walls and the grouted vault, which provide structural stability and reduce migration of contamination. The primary barrier for the residuals in the transfer piping is the stainless steel piping (DOE-ID 2003b).
The grouted tanks, vaults, piping, and valve boxes provide a long-term, stable waste form. For guidance, DOE considered the Standard Format and Content of a License Application for a Low-Level Radioactive Waste Disposal Facility (NRC 1987a), which notes that site stability is focused on reducing the contact of water with the waste and providing assurance that active maintenance will not be needed following closure. The long-term stability of the facility is evaluated in the TFF PA (DOE-ID 2003b), which provides a degradation analysis of the grouted tanks, vaults, and piping, and shows the grout will likely remain intact for at least 2,000 years, but much more likely to remain intact for much longer. As shown above, the site conditions do not present hazards that impact the stability of the closed TFF. In addition, the methods used to close the TFF will result in a closed facility that does not require ongoing active maintenance of the facility following closure. As such, the performance of the closed TFF complies with the objectives of 10 CFR 61.44.bbbb
7.13 Conclusions
The previous analysis demonstrates that disposal of the stabilized residuals in the TFF, and in the TFF tank system, will meet the performance objectives set out in 10 CFR 61, Subpart C.cccc
bbbb. On page 112 of its TER (NRC 2006b) NRC concluded, “…there is reasonable assurance that DOE Idaho can meet 10 CFR 61.44 stability requirements.”
cccc. On page 111 of its TER (NRC 2006b) NRC concluded, “There is reasonable assurance that DOE Idaho can meet Criterion Three of the NDAA because:
• Based on information provided by DOE Idaho, NRC staff expects the maximum public dose from all pathways to be below the 0.25-mSv/yr [25-mrem/yr] dose limit. Reasonable effort will be made by DOE Idaho to maintain releases in radioactive activity in effluents to the general environment as low as reasonable achievable. Therefore NRC concludes that there is reasonable assurance that DOE Idaho can meet 10 CFR 61.41 requirements.
• Based on analysis provided by DOE Idaho, NRC staff concludes there is reasonable assurance that DOE Idaho can meet 10 CFR 61.42 requirements for protection of individuals from inadvertent intrusion.
• Workers are protected by DOE regulations that are comparable to 10 CFR Part 20. DOE Idaho controls are also in place to protect members of the public during operations. Therefore, the NRC staff concludes that there is reasonable assurance that DOE Idaho can meet 10 CFR 61.43 requirements for protection of individuals during operations.
• DOE Idaho plans to fill the tanks, vaults, and ancillary equipment with grout which will provide structural stability and limit waste dispersal. Therefore, NRC staff concludes that there is reasonable assurance that DOE Idaho can meet 10 CFR 61.44 stability requirements.”

106
8. STATE-APPROVED CLOSURE PLANS
Key Points
• DOE is conducting performance-based closure of the TFF pursuant to closure plans approved by the State of Idaho. DOE intends for the TFF closure to meet clean closure standards for hazardous constituents. Clean closure is the removal or decontamination of all waste residues to meet State-approved levels for hazardous constituents. If these clean closure standards are not met, the TFF may be closed in accordance with landfill standards established by the State of Idaho in a State-approved closure plan. However, waste removal and decontamination activities needed to meet performance objectives for radioactive constituents will likely result in the removal of hazardous constituents to the clean closure standard.
• Prior to closure, the closure plan for the four 300,000-gal tanks remaining to be cleaned will be submitted to the State of Idaho.
• A final closure plan for all of the TFF tanks will be submitted to the State of Idaho after each partial closure phase of the TFF is completed.
Section 3116(a) of the NDAA provides in pertinent part:
[T]he term “high-level radioactive waste” does not include radioactive waste resulting from the reprocessing of spent nuclear fuel that the Secretary of Energy …, in consultation with the Nuclear Regulatory Commission …, determines— …
(3)(A)(ii) [will be disposed of] pursuant to a State-approved closure plan or State-issued permit, authority for the approval or issuance of which is conferred on the State outside of this section.
As discussed in Subsection 2.3, the TFF closure is being performed under both DOE and State of Idaho Department of Environmental Quality (DEQ) requirements, which includes preparing closure plans. The wastes stored in the TFF are mixed wastes.dddd As such, the State of Idaho regulates the hazardous constituents and the DOE regulates the radioactive constituents. Because the TFF stores mixed wastes, TFF closure must comply with closure requirements for hazardous waste as well as radioactive waste. For hazardous waste, closure must comply with HWMA (State of Idaho 1983) and RCRA (42 USC 6901 et seq. 1976) as implemented by IDAPA 58.01.05.009 and 40 CFR 265, “Interim Status Standards for Owners and Operators of Hazardous Waste Treatment, Storage, and Disposal Facilities.” These regulations require the preparation of a closure plan that includes specific elements. Because the TFF tanks do not meet secondary containment standards, the regulations also specify that both a closure plan for clean closure and a contingent closure plan for closure of the TFF to meet landfill standards must be prepared. Clean closure is the removal or decontamination of waste residues to meet State-approved performance objectives for the hazardous constituents. Landfill closure is necessary if the clean closure standards cannot be met. The clean closure standards are included as part of the HWMA/RCRA closure plans. For all of the tanks and ancillary equipment cleaned from 2002 to 2005, these clean closure requirements have been met.
dddd. A mixture of hazardous wastes regulated under Subtitle C of the Resource Conservation and Recovery Act of 1976 (42 USC 6901 et seq. 1976) and radioactive wastes regulated under the Atomic Energy Act of 1954 (42 USC 2011 et seq. 1954).

107
In accordance with these requirements, the DOE has prepared a series of closure plans to support the TFF closure. These closure plans present the strategy for clean closure of the TFF tanks to site-specific action levels. The closure plan for TFF Tanks WM-187, WM-188, WM-189, and WM-190 will be submitted prior to closure. In addition, a final closure plan for all of the TFF tanks will be prepared and submitted to the state for approval. Closure actions, such as grout placement, will not be initiated until the DEQ approves the applicable closure plan.
The following closure plans have been submitted to DEQ for approval:
• Tanks WM-182 and WM-183—Idaho Hazardous Waste Management Act/Resource Conservation and Recovery Act Closure Plan for Idaho Nuclear Technology and Engineering Center Tanks WM-182 and WM-183 (DOE-ID 2003a)
• Tanks WM-184, WM-185, and WM-186—Idaho Hazardous Waste Management Act/Resource Conservation and Recovery Act Closure Plan for Idaho Nuclear Technology and Engineering Center Tanks WM-184, WM-185, and WM-186 (DOE-ID 2004a)
• Tanks WM-103, WM-104, WM-105, WM-106, and WM-181—Idaho Hazardous Waste Management Act/Resource Conservation and Recovery Act Closure Plan for Idaho Nuclear Technology and Engineering Center Tanks WM-103, WM-104, WM-105, WM-106, and WM-181 (DOE Idaho 2004a)
• Tank WM-180—Idaho Hazardous Waste Management Act/Resource Conservation and Recovery Act Closure Plan for Idaho Nuclear Technology and Engineering Center Tank WM-180 (DOE Idaho 2004b).
In addition, the DOE has prepared and submitted to DEQ two contingent landfill closure plans as required by the hazardous waste management regulations. The Contingent Landfill Closure and Post-Closure Plan for Idaho Nuclear Technology and Engineering Center Tanks WM-182 and WM-183 (DOE-ID 2003c) applies to TFF Tanks WM-182 and WM-183. The Contingent Landfill Closure and Post-Closure Plan for Idaho Nuclear Technology and Engineering Center Tanks in the Tank Farm Facility (DOE-ID 2003d) applies to all of the tanks in the TFF. Previously, contingent landfill closure plans were planned to be developed for each closure phase, in a manner similar to the clean closure plans. However, DEQ and DOE agreed that one contingent landfill closure plan should be developed for the entire TFF.
The closure activities presented in these plans are designed to satisfy both DOE radioactive waste requirements and HWMA/RCRA hazardous waste requirements. Although contingent landfill closure plans were prepared as required, the TFF is being closed to HWMA/RCRA clean closure standards. Waste removal and decontamination activities needed to remove the required radionuclides to meet performance objectives for the radioactive waste will result in the removal of the hazardous constituents to the HWMA/RCRA clean closure standard.
In addition to the closure plans, a SAP for each closure phase is submitted to DEQ for approval. These plans describe the sampling and analysis to be performed to confirm that the residuals remaining the tanks and ancillary equipment: (1) are not hazardous waste, (2) meet the clean closure action levels specified in the associated HWMA/RCRA closure plan, and (3) meet the DOE performance objectives. As the sampling and analysis activities for a closure phase are completed, a series of DQA reports are prepared. The purpose of the DQAs is to evaluate the quality of the characterization data collected to determine whether the data could be used to meet the DQOs established for the sampling and analysis activities. The following SAPs have been submitted to DEQ:

108
• Tanks WM-182 and WM-183
- Sampling and Analysis Plan for the Post-Decontamination Characterization of the WM-182 and WM-183 Tank Residuals (INEEL 2002b)
- Sampling and Analysis Plan for the Post-Decontamination Characterization of the Process Waste Lines from INTEC Tank Farm Facility Tanks WM-182 and WM-183 (INEEL 2001)
• Tanks WM-184, WM-185, and WM-186
- Sampling and Analysis Plan for the Post-Decontamination Characterization of the WM-184, WM-185, and WM-186 Tank Residuals (INEEL 2003)
• Tanks WM-103, WM-104, WM-105, WM-106, and WM-181
- Sampling and Analysis Plan for the Post-Decontamination Characterization of the WM-103, WM-104, WM-105, WM-106, and WM-181 Tank Residuals (ICP 2004a)
• Tank WM-180
- Sampling and Analysis Plan for the Post-Decontamination Characterization of the WM-180 Tank Residuals (ICP 2004b).
The following DQA reports have been provided to DEQ:
• Tanks WM-182 and WM-183
- Data Quality Assessment Report for the Post-Decontamination Characterization of the Contents of Tank WM-182 at the Idaho Nuclear Technology and Engineering Center Tank Farm Facility (INEEL 2006a)
- Data Quality Assessment Report for the Post-Decontamination Characterization of the Contents of Tank WM-183 at the Idaho Nuclear Technology and Engineering Center Tank Farm Facility (INEEL 2006b)
- Data Quality Assessment Report for the Post-Decontamination Characterization of the Ancillary Equipment Associated with Tanks WM-182 and WM-183 at the Idaho Nuclear Technology and Engineering Center Tank Farm Facility (ICP 2006b)
- Data Quality Assessment Report for the Post-Decontamination Characterization of the Contents of Rewashed Tank WM-183 at the Idaho Nuclear Technology and Engineering Center Tank Farm Facility (ICP 2006a)
• Tanks WM-184, WM-185, and WM-186
- Data Quality Assessment Report for the Post-Decontamination Characterization of the Contents of Tank WM-184 at the Idaho Nuclear Technology and Engineering Center Tank Farm Facility (ICP 2006c)
- Data Quality Assessment Report for the Post-Decontamination Characterization of the Contents of Tank WM-185 at the Idaho Nuclear Technology and Engineering Center Tank Farm Facility (ICP 2006d)

109
- Data Quality Assessment Report for the Post-Decontamination Characterization of the Contents of Tank WM-186 at the Idaho Nuclear Technology and Engineering Center Tank Farm Facility (ICP 2006e)
- Data Quality Assessment Report for the Post-Decontamination Characterization of the Ancillary Equipment Associated with Tanks WM-184, WM-185, and WM-186 at the Idaho Nuclear Technology and Engineering Center Tank Farm Facility (ICP 2006f)
• Tanks WM-103, WM-104, WM-105, WM-106, and WM-181
- Data Quality Assessment Report for the Post-Decontamination Characterization of the Contents of Tanks WM-103, WM-104, WM-105, and WM-106 at the Idaho Nuclear Technology and Engineering Center Tank Farm Facility (ICP 2006g)
- Data Quality Assessment Report for the Post-Decontamination Characterization of the Contents of Tank WM-181 at the Idaho Nuclear Technology and Engineering Center Tank Farm Facility (ICP 2006h)
- Data Quality Assessment Report for the Post-Decontamination Characterization of the Ancillary Equipment Associated with Tanks WM-103, WM-104, WM-105, WM-106, and WM-181 at the Idaho Nuclear Technology and Engineering Center Tank Farm Facility (ICP 2006i).
• Tank WM-180
- Data Quality Assessment Report for the Post-Decontamination Characterization of the Contents of Tank WM-180 and Associated Ancillary Equipment at the Idaho Nuclear Technology and Engineering Center Tank Farm Facility (ICP 2006j).
As of September 2006, DEQ has approved four of the closure plans for clean closure (DOE-ID 2003a, 2004a; DOE Idaho 2004a, 2004b) and their associated SAPs (ICP 2004a, 2004b; INEEL 2001, 2002b, 2003). Both of the contingent landfill closure plans (DOE-ID 2003c, 2003d) have also been approved.eeee
Results of the confirmatory sampling and analysis of the TFF tank residuals for the TFF closure activities performed as of May 2005 indicate that HWMA/RCRA clean closure requirements and DOE performance objectives as set forth in the closure plans have been met. The final closure of the TFF will be certified by an independent, Idaho-registered professional engineer, the facility contractor, and/or the DOE Idaho Operations Office, in accordance with IDAPA 58.01.05.009 (40 CFR 265.115).ffff
eeee. On page xii of its TER (NRC 2006b) NRC states, “DOE Idaho is seeking clean closure status with the Idaho Department of Environment Quality (DEQ) for the tanks at INTEC under the Hazardous Waste Management Act (HWMA) and Resource Conservation and Recovery Act (RCRA) which would allow DOE Idaho to close the TFF without a state permit.” It should be noted that the TFF will be closed under state-approved closure plans as described in this section. Grouting will not be performed on tanks until they have State-approved closure plans.
ffff. Certification of partial closures is not required (EPA 1998).

110
9. CONCLUSION
Based on consultation with the NRC and as shown in the preceding sections of this 3116 Basis Document,gggg the stabilized residuals in the TFF, and the TFF tank system, are not HLW pursuant to the criteria set forth in Section 3116(a) of the NDAA and may be disposed of at the INL Site in accordance with Section 3116 of the NDAA. This conclusion takes into account NRC comments during consultation, and although not required by Section 3116, State of Idaho and other public comments.
gggg. On page 114 of its TER (NRC 2006b) NRC concludes, “DOE Idaho has adequately demonstrated that NDAA criteria in Section 3116(a)(1), (a)(2), and (a)(3)(A)(i) or (a)(3)(B)(i) can be met for residual waste disposed of at TFF.”

111
10. REFERENCES
10 CFR 20, 2004, “Standards for Protection Against Radiation,” Code of Federal Regulations, Office of the Federal Register, January 1, 2004.
10 CFR 60, 2004, “Disposal of High-Level Radioactive Wastes in Geological Repositories,” Code of Federal Regulations, Office of the Federal Register, January 1, 2004.
10 CFR 61, 2004, “Licensing Requirements for Land Disposal of Radioactive Waste,” Code of Federal Regulations, Office of the Federal Register, January 1, 2004.
10 CFR 820, 2004, “Procedural Rules for DOE Nuclear Activities,” Code of Federal Regulations, Office of the Federal Register, January 1, 2004.
10 CFR 830, Subpart A, 2004, “Quality Assurance Requirements,” Code of Federal Regulations, Office of the Federal Register, January 1, 2004.
10 CFR 835, 2004, “Occupational Radiation Protection,” Code of Federal Regulations, Office of the Federal Register, January 1, 2004.
40 CFR 61, 2004, “National Emissions Standards for Hazardous Air Pollutants,” Code of Federal Regulations, Office of the Federal Register, July 1, 2004.
40 CFR 265, 2004, “Interim Status Standards for Owners and Operators of Hazardous Waste Treatment, Storage, and Disposal Facilities,” Code of Federal Regulations, Office of the Federal Register, July 1, 2004.
42 USC 2011 et seq., 1954, “Atomic Energy Act of 1954, as amended.”
42 USC 6901 et seq., 1976, “Resource Conservation and Recovery Act of 1976, as amended.”
42 USC 9601 et seq., 1980, “Comprehensive Environmental Response, Compensation, and Liability Act.”
70 FR 54374, “Notice of Availability of Draft Section 3116 Determination Idaho Nuclear Technology and Engineering Center Tank Farm Facility,” Federal Register, U.S. Department of Energy, September 14, 2005, pp. 54374–54375.
70 FR 74846, Notice: “Draft Interim Concentration Averaging Guidance for Waste Determinations,” Federal Register, U.S. Nuclear Regulatory Commission, December 16, 2005, pp. 74846–74850.
ACRi, 2000, PORFLOW Users Manual, Version 4.0, Rev. 4, Bel Air, California.
AutoCAD 2004, San Rafael, California: Autodesk Inc., 2003.
Bernero, R. M., NRC, to J. Lytle, DOE, March 2, 1993, “Denial of Petition for Rulemaking Submitted by the State of Washington and the State of Oregon.”
Cambridge, 2004, Cambridge Dictionary of American English, Cambridge University Press 2004 http://dictionary.cambridge.org/define.asp?key=practical*2+0&dict=A.

112
CLI-05-05, 2005, In the Matter of Louisiana Energy Services, L.P. (National Enrichment Services), slip op. at 11, January 18, 2005.
Croff, A. G., 1980, A User’s Manual for the ORIGEN2 Computer Code, ORNL/TM-7175, July 1980.
DOE, 2002, Idaho High-Level Waste and Facilities Disposition Final Environmental Impact Statement, DOE/EIS-0287, September 2002.
DOE, 2006a, letter from Mark A. Gilbertson, DOE, to Scott C. Flanders, NRC, submitting Response to Request for Additional Information on the Draft Section 3116 Determination Idaho Nuclear Technology and Engineering Center Tank Farm Facility (ICP/EXT-06-01204), March 13, 2006.
DOE, 2006b, letter from Mark A. Gilbertson, DOE, to Scott C. Flanders, NRC, submitting Response to Request for Additional Information on the Draft Section 3116 Determination Idaho Nuclear Technology and Engineering Center Tank Farm Facility (ICP/EXT-06-01204), April 26, 2006.
DOE, 2006c, letter from Mark A. Gilbertson, DOE, to Scott C. Flanders, NRC, submitting Response to Request for Additional Information on the Draft Section 3116 Determination Idaho Nuclear Technology and Engineering Center Tank Farm Facility (ICP/EXT-06-01204), May 31, 2006.
DOE G 435.1-1, 1999, “Implementation Guide for Use with DOE M-435.1-1,” U.S. Department of Energy, July 9, 1999.
DOE M 435.1-1, 2001, “Radioactive Waste Management Manual,” U.S. Department of Energy, June 19, 2001.
DOE O 435.1, 2001, “Radioactive Waste Management,” Change 1, U.S. Department of Energy, August 28, 2001.
DOE O 440.1A, 1998, “Worker Protection Management for DOE Federal and Contractor Employees,” U.S. Department of Energy, March 27, 1998.
DOE O 5400.5, 1993, “Radiation Protection of the Public and the Environment,” U.S. Department of Energy, January 7, 1993.
DOE-ID, 1995, Long-Term Land Use Future Scenarios for the Idaho National Engineering Laboratory, DOE/ID-10440, August 1995.
DOE-ID, 1997, INEEL Comprehensive and Facility Land Use Plan, DOE/ID-10514, December 1997.
DOE-ID, 2003a, Idaho Hazardous Waste Management Act/Resource Conservation and Recovery Act Closure Plan for Idaho Nuclear Technology and Engineering Center Tanks WM-182 and WM-183, DOE/ID-10802, Rev. 1, September 2003.
DOE-ID, 2003b, Performance Assessment for the Tank Farm Facility at the Idaho National Engineering and Environmental Laboratory, DOE/ID-10966, Rev. 1, April 2003 (Errata December 2, 2003).
DOE-ID, 2003c, Contingent Landfill Closure and Post-Closure Plan for Idaho Nuclear Technology and Engineering Center Tanks WM-182 and WM-183, DOE/ID-10841, Rev. 1, September 2003.
DOE-ID, 2003d, Contingent Landfill Closure and Post-Closure Plan for Idaho Nuclear Technology and Engineering Center Tanks in the Tank Farm Facility, DOE/ID-11068, April 2003.

113
DOE-ID, 2004a, Idaho Hazardous Waste Management Act/Resource Conservation and Recovery Act Closure Plan for Idaho Nuclear Technology and Engineering Center Tanks WM-184, WM-185, and WM-186, DOE/ID-11067, Rev. 2, March 2004.
DOE-ID, 2004b, Idaho National Engineering and Environmental Laboratory Site Environmental Report Calendar Year 2003, DOE/ID-12082(03) ISSN 1089-5469, October 2004.
DOE-ID, 2006a, Tier 1 Closure Plan for the Idaho Nuclear Technology and Engineering Center Tank Farm Facility at the INEEL, DOE/ID-10975, Rev. 2, August 2006.
DOE-ID, 2006b, Composite Analysis for Tank Farm Closure, DOE/ID-10974, Rev. 1, May 2006.
DOE Idaho, 2004a, Idaho Hazardous Waste Management Act/Resource Conservation and Recovery Act Closure Plan for Idaho Nuclear Technology and Engineering Center Tanks WM-103, WM-104, WM-105, and WM-106, DOE/NE-ID-11134, Rev. 1, May 2004.
DOE Idaho, 2004b, Idaho Hazardous Waste Management Act/Resource Conservation and Recovery Act Closure Plan for Idaho Nuclear Technology and Engineering Center Tank WM-180, DOE/NE-ID-11167, Rev. 0, June 2004.
DOE-STD-1027-92, 1997, “Hazard Categorization and Accident Analysis Techniques for Compliance with DOE Order 5480.23, Nuclear Safety Analysis Reports,” U. S. Department of Energy, December 1992, Change Notice No. 1, September 1997.
Dykes, J. W., (ed.) 1963, MTR Progress Report, Cycle No. 198, September 30, 1962–October 21, 1963, IDO-16952, Phillips Petroleum Company, 1963.
EDF-015722-041, 2000, “Surrogate Sludge for Tank Farm Closure Mockups,” INTEC Tank Farm Facility Closure Conceptual Design Report, Project File No. 015722, Book 6, Volume 2, EDFs, September 2000.
EDF-2973, 2001, “INTEC Tank Farm Closure Grouting Evaluation,” October 2001.
EDF-CPP-058, 1997, “Evaluation of Contaminated Soil Site CPP-31 Activity,” Functional File Number 1000-50, 1997.
EDF-FDO-006, 1997, “Evaluation of Radionuclide Inventory for Sodium Bearing Waste,” November 26, 1997.
EDF-TST-001, 2000, “Solids Characterization,” September 20, 2000.
EPA, 1988, Limiting Values of Radionuclide Intake and Air Concentration and Dose Conversion Factors for Inhalation, Submersion, and Ingestion, Federal Guidance Report No. 11, EPA-520/1-88-020, Office of Radiation Programs, Washington, D.C.; Oak Ridge National Laboratory, Oak Ridge, Tennessee; U.S. Department of Energy, Washington, D.C., September 1988.
EPA, 1993, External Exposure to Radionuclides in Air, Water, and Soil, Federal Guidance Report No. 12, EPA-402-R-93-081, U.S. Environmental Protection Agency, Office of Radiation and Indoor Air, Washington, D.C., 1993.

114
EPA, 1998, Monthly Hotline Report, February 1998, EPA530-R-98-005b, SUB-9224-98-002, U.S. Environmental Protection Agency, http://www.epa.gov/epaoswer/hotline/98report/feb98.txt, published February 1998, Web page visited February 16, 2005.
EPA, 2006a, Guidance on Systematic Planning Using the Data Quality Objectives Process, EPA QA/G-4, EPA/240/B-06/001, U.S. Environmental Protection Agency, Office of Environmental Information, Washington, D.C., February 2006.
EPA, 2006b, Data Quality Assessment: Statistical Methods for Practitioners, EPA QA/G-9S, EPA/240/B-06/003, U.S. Environmental Protection Agency, Office of Environmental Information, Washington D.C., February 2006.
Fowler, H., 1930, A Dictionary of Modern English Usage.
Hardesty, T., DEQ, letter to M. Gilbertson, DOE, regarding DEQ Review Draft 3116 Determination for INL Tank Farm, August 18, 2006.
ICP, 2004a, Sampling and Analysis Plan for the Post-Decontamination Characterization of the WM-103, WM-104, WM-105, WM-106, and WM-181 Tank Residuals, ICP/EXT-03-00103, Rev. 0, March 2004.
ICP, 2004b, Sampling and Analysis Plan for the Post-Decontamination Characterization of the WM-180 Tank Residuals, ICP/EXT-04-00357, Rev. 0, June 2004.
ICP, 2005a, Tank Farm Volumes, Idaho Cleanup Project, http://icpweb/intec/tank-farm-data, Web page updated April 30, 2005.
ICP, 2005b, Generation, Disposition, and Current Inventory of Radionuclides in the INTEC Tank Farm, ICP/EXT-05-00928, June 2005.
ICP, 2006a, Data Quality Assessment Report for the Post-Decontamination Characterization of the Contents of Rewashed Tank WM-183 at the Idaho Nuclear Technology and Engineering Center Tank Farm Facility, ICP/EXT-06-01165, Rev. 0, January 2006.
ICP, 2006b, Data Quality Assessment Report for the Post-Decontamination Characterization of the Ancillary Equipment Associated with Tanks WM-182 and WM-183 at the Idaho Nuclear Technology and Engineering Center Tank Farm Facility, ICP/EXT-04-00465, Rev. 1, January 2006.
ICP, 2006c, Data Quality Assessment Report for the Post-Decontamination Characterization of the Contents of Tank WM-184 at the Idaho Nuclear Technology and Engineering Center Tank Farm Facility, ICP/EXT-04-00404, Rev. 1, January 2006.
ICP, 2006d, Data Quality Assessment Report for the Post-Decontamination Characterization of the Contents of Tank WM-185 at the Idaho Nuclear Technology and Engineering Center Tank Farm Facility, ICP/EXT-04-00358, Rev. 1, January 2006.
ICP, 2006e, Data Quality Assessment Report for the Post-Decontamination Characterization of the Contents of Tank WM-186 at the Idaho Nuclear Technology and Engineering Center Tank Farm Facility, ICP/EXT-04-00405, Rev. 1, January 2006.

115
ICP, 2006f, Data Quality Assessment Report for the Post-Decontamination Characterization of the Ancillary Equipment Associated with Tanks WM-184, WM-185, and WM-186 at the Idaho Nuclear Technology and Engineering Center Tank Farm Facility, ICP/EXT-04-00529, Rev. 1, January 2006.
ICP, 2006g, Data Quality Assessment Report for the Post-Decontamination Characterization of the Contents of Tanks WM-103, WM-104, WM-105, and WM-106 at the Idaho Nuclear Technology and Engineering Center Tank Farm Facility, ICP/EXT-04-00550, Rev. 1, January 2006.
ICP, 2006h, Data Quality Assessment Report for the Post-Decontamination Characterization of the Contents of Tank WM-181 at the Idaho Nuclear Technology and Engineering Center Tank Farm Facility, ICP/EXT-04-00551, Rev. 1, January 2006.
ICP, 2006i, Data Quality Assessment Report for the Post-Decontamination Characterization of the Ancillary Equipment Associated with Tanks WM-103, WM-104, WM-105, WM-106, and WM-181 at the Idaho Nuclear Technology and Engineering Center Tank Farm Facility, ICP/EXT-04-00552, Rev. 1, January 2006.
ICP, 2006j, Data Quality Assessment Report for the Post-Decontamination Characterization of the Contents of Tank WM-180 and Associated Ancillary Equipment at the Idaho Nuclear Technology and Engineering Center Tank Farm Facility, ICP/EXT-05-00892, Rev. 1, January 2006.
ICP, 2006k, Proposed Plan for Tank Farm Soil and Groundwater at the Idaho Nuclear Technology and Engineering Center, Operable Unit 3-14, RPT-223, Rev. 0, August 2006.
ICP, 2006l, Response to Request for Additional Information on the Draft Section 3116 Determination Idaho Nuclear Technology and Engineering Center Tank Farm Facility, ICP/EXT-06-01204, May 31, 2006.
ICRP, 1959, Report of ICRP Committee II on Permissible Dose for Internal Radiation, ICRP Publication 2, International Commission on Radiological Protection, Pergamon Press, New York.
ICRP, 1979, Limits for Intakes of Radionuclides by Workers, ICRP Publication 30, International Commission on Radiological Protection, Pergamon Press, New York.
IDAPA 58.01.05.009, 2004, “Interim Status Standards for Owners and Operators of Hazardous Waste Treatment, Storage, and Disposal Facilities,” Idaho Administrative Procedures Act, Idaho Department of Environmental Quality Rules, March 20, 2004.
INEEL, 1998, ICPP Tank Farm Closure Study, INEEL/EXT-97-01204, Rev. 0, February 1998.
INEEL, 1999a, Status and Estimated Life of the 300,000-gal INTEC Tanks, INEEL/EXT-99-00743, Rev. 1, November 1999.
INEEL, 1999b, Idaho Nuclear Technology and Engineering Center Tank Farm Facility (TFF) Closure TFF WM-182 Grout Mock-Up, INEEL/EXT-99-01067, Rev. 0, October 1999.
INEEL, 2000a, Idaho Nuclear Technology and Engineering Center Tank Farm Facility Conceptual DOE and HWMA/RCRA Closure Approach (DRAFT FINAL), INEEL/EXT-99-01066, March 2000.

116
INEEL, 2000b, Tank Farm WM-182 and WM-183 Heel Slurry Samples PSD Results, INEEL/EXT-2000-01097, Rev. 0, August 2000.
INEEL, 2000c, INTEC Tank Farm Facility Closure Conceptual Design Report, Project File No. 015722, September 29, 2000.
INEEL, 2001, Sampling and Analysis Plan for the Post-Decontamination Characterization of the Process Waste Lines from WM-182 and WM-183, INEEL/EXT-01-01543, Rev. 1, November 2001.
INEEL, 2002a, Voluntary Consent Order SITE-TANK-005 Combined System Identification and Characterization for the Uranium Dissolution and Extraction Process at the Idaho Nuclear Technology and Engineering Center, INEEL/EXT-2001-00225, Rev. 2, February 2002.
INEEL, 2002b, Sampling and Analysis Plan for the Post-Decontamination Characterization of the WM-182 and WM-183 Tank Residuals, INEEL/EXT-01-00666, Rev. 2, August 2002.
INEEL, 2003, Sampling and Analysis Plan for the Post-Decontamination Characterization of the WM-184, WM-185, and WM-186 Tank Residuals, INEEL/EXT-03-00057, Rev. 0, April 2003.
INEEL, 2006a, Data Quality Assessment Report for the Post-Decontamination Characterization of the Contents of Tank WM-182 at the Idaho Nuclear Technology and Engineering Center Tank Farm Facility, INEEL/EXT-03-00679, Rev. 2, January 2006.
INEEL, 2006b, Data Quality Assessment Report for the Post-Decontamination Characterization of the Contents of Tank WM-183 at the Idaho Nuclear Technology and Engineering Center Tank Farm Facility, INEEL/EXT-03-01202, Rev. 2, January 2006.
Jacobson, V. L., INEEL, to K. Quigley, INEEL, October 30, 2002, “Radiation Exposures from Tank WM-182 Cleaning.”
Kennedy, W. E., Jr., and R. A. Peloquin, 1988, Intruder Scenarios for Site-Specific Low-Level Radioactive Waste Classification, DOE/LLW-71T, U.S. Department of Energy Idaho Operations Office, 1988.
Kimmitt, R. R., INEEL, to V. L. Jacobson, INEEL, November 22, 2002, “Revision 1 – Tank WM-182 Cleaning Effectiveness.”
Kipping, D., INL Site EM Citizens Advisory Board, to R. B. Provencher, DOE-ID, November 16, 2005, “Draft Section 3116 Determination for the Idaho Nuclear Technology and Engineering Center Tank Farm.”
Knecht, D. A., et al., 1997, “Historical Fuel Reprocessing and HLW Management in Idaho,” Radwaste Magazine, May 1997, pp. 35–45.
Latchum, J. W., A. L. Biladeau, E. S. Brown, D. D. Deming, B. L. Schmalz, F. M. Warzel, and L. J. Weber, 1962, Report of the Investigating Committee, CPP Waste Tank WM-187 Leakage of March 17, 1962, La-53-62A, Phillips Petroleum Company, 1962.
Loos, R. L., ICP, to F. C. Holmes, DOE Idaho, January 26, 2004, “Contract No. DE-AC07-99ID13727-INTEC Tank Farm Operating History Report (INTEC-WP-03-021) and Completion of Sodium-bearing Waste Treatment Process Project Milestone A4070160,” CCN47582.

117
Maheras, S. J., A. S. Rood, S. O. Magnuson, E. M. Sussman, and R. N. Bhatt, 1997, Addendum to Radioactive Waste Management Complex Low-Level Waste Radiological Performance Assessment (EGG-WM-8773), INEEL/EXT-97-00462, April 1997.
Martin, J. R., Portage, Inc., to K. Quigley, INL, July 7, 2005, “Review of Radiation Exposures for INEEL INTEC Tank Farm – January 2002–June 2005.”
NRC, 1982, Final Environmental Impact Statement on 10 CFR 61 “Licensing Requirements for Land Disposal of Radioactive Waste”, NUREG-0945, U.S. Nuclear Regulatory Commission, Office of Nuclear Material Safety and Safeguards, November 1982.
NRC, 1987a, Standard Format and Content of a License Application for a Low-Level Radioactive Waste Disposal Facility, NUREG-1199, January 1987.
NRC, 1987b, Standard Review Plan for the Review of a License Application for a Low-Level Radioactive Waste Disposal Facility, NUREG-1200, January 1987.
NRC, 1995, Branch Technical Position on Concentration Averaging and Encapsulation, U.S. Nuclear Regulatory Commission, Office of Nuclear Material Safety and Safeguards, January 17, 1995.
NRC, 2000, A Performance Assessment Methodology for Low-Level Radioactive Waste Disposal Facilities: Recommendations of NRC’s Performance Assessment Working Group, NUREG-1573, June 2000.
NRC, 2002, “Final Policy Statement for the Decommissioning Criteria for the West Valley Demonstration Project at the West Valley Site,” February 2002.
NRC, 2003a, “NRC Review of Idaho National Laboratory Draft Incidental Waste (Waste-Incidental-To-Reprocessing) Determination for Tank Farm Facility Closure,” SECY-03-0079, May 2003.
NRC, 2003b, “Characterization, Survey, and Determination of Radiological Criteria” Consolidated NMSS Decommissioning Guidance, Volume 2, NUREG-1757, September 2003.NRC, 2006a, “Technical Evaluation Report for the U.S. Department of Energy Idaho National Laboratory Site Draft Section 3116 Waste Determination for Idaho Nuclear Technology and Engineering Center Tank Farm Facility,” U.S. Nuclear Regulatory Commission, October 2006.
NRC, 2006b, “Request for Additional Information on the Draft Section 3116 Determination for Idaho Nuclear Technology and Engineering Center Tank Farm Facility (DOE/NE-ID-11226),” January 10, 2006.
Oztunali, O. I., and G. W. Roles, 1986, Update of Part 61: Impacts Analysis Methodology, Methodology Report, NUREG/CR-4370, Vol. 1, Nuclear Regulatory Commission, Washington, D.C, January 1986.
PLN-260, 2003, “INEEL Radiation Protection Program,” Rev. 4, November 13, 2003.
PNNL, 2001, Technical Review of Retrieval and Closure Plans for the INEEL INTEC Tank Farm Facility, PNNL UC-721, Pacific Northwest National Laboratory, Richland Washington, September 2001.

118
Portage, 2005a, “WM-180 Tank Solid and Liquid Volume Estimates and Post-Decontamination Radionuclide Inventories,” PEI-EDF-1019, Rev. 1, Portage, Inc., Idaho Falls, Idaho, August 31, 2005.
Portage, 2005b, “WM-182 Tank Solid and Liquid Volume Estimates and Post-Decontamination Radionuclide Inventories with Comparisons to Performance Assessment Modeling Results,” PEI-EDF-1009, Rev. 2, Portage, Inc., Idaho Falls, Idaho, August 31, 2005.
Portage, 2005c, “WM-183 Tank Solid and Liquid Volume Estimates and Post-Decontamination Radionuclide Inventories with Comparisons to Performance Assessment Modeling Results,” PEI-EDF-1010, Rev. 3, Portage, Inc., Idaho Falls, Idaho, December 22, 2005.
Portage, 2005d, “WM-184 Tank Solid and Liquid Volume Estimates and Post-Decontamination Radionuclide Inventories with Comparisons to Performance Assessment Modeling Results,” PEI-EDF-1011, Rev. 2, Portage, Inc., Idaho Falls, Idaho, August 31, 2005.
Portage, 2005e, “WM-185 Tank Solid and Liquid Volume Estimates and Post-Decontamination Radionuclide Inventories with Comparisons to Performance Assessment Modeling Results,” PEI-EDF-1012, Rev. 2, Portage, Inc., Idaho Falls, Idaho, August 31, 2005.
Portage, 2005f, “WM-186 Tank Solid and Liquid Volume Estimates and Post-Decontamination Radionuclide Inventories with Comparisons to Performance Assessment Modeling Results,” PEI-EDF-1013, Rev. 2, Portage, Inc., Idaho Falls, Idaho, August 31, 2005.
Portage, 2005g, “Radiological Dose Calculations for the Tank Farm Facility at the Idaho Nuclear Technology and Engineering Center,” PEI-EDF-1020, Rev. 0, Portage, Inc., Idaho Falls, Idaho, May 24, 2005.
Portage, 2006a, “WM-181 Tank Solid and Liquid Volume Estimates and Post-Decontamination Radionuclide Inventories with Comparisons to Performance Assessment Modeling Results,” PEI-EDF-1016, Rev. 4, Portage, Inc., Idaho Falls, Idaho, January 12, 2006.
Portage, 2006b, “WM-103, WM-104, WM-105, and WM-106 Tank Solid and Liquid Volume Estimates and Post-Decontamination Radionuclide Inventories,” PEI-EDF-1015, Rev. 4, Portage, Inc., Idaho Falls, Idaho, October 2006.
PRD-183, 2002, “Radiological Control Manual,” Rev. 3, September 3, 2002.
Provencher, R. B., DOE-ID, to D. Kipping, INL Site EM Citizens Advisory Board, December 20, 2005, “Response to Citizens Advisory Board Questions Regarding the Draft Section 3116 Waste Determination for the Idaho Nuclear Technology and Engineering Center Tank Farm (FMDP-MTPP-05-040).”
Public Law 108-375, 2004, “Ronald W. Reagan National Defense Authorization Act for Fiscal Year 2005,” U.S. Department of Defense and U. S. Department of Energy, October 28, 2004.
Random House, 1997, Random House Unabridged Dictionary, Random House, Inc., http://www.infoplease.com/dictionary.html, Web page visited March 15, 2005.
Rebish, K. J., INEL, to J. M. Roberts, INEL, October 15, 1993, “HLLW Tank Sump Transfer History,” KJR-10-93.

119
Report 108-767, 2004, Ronald W. Reagan National Defense Authorization Act for Fiscal Year 2005, House of Representatives, 108th Congress, 2nd Session, H.R. 4200, 2004.
SAR-107, 2004, “Safety Analysis Report for the Tank Farm Facilities,” Rev. 3, December 21, 2004.
Seitz, R. R., 1991, Well Parameters for Intruder Drilling Scenario at RWMC, SEM-RWMC-91-002, EG&G Idaho, August 1991.
Staiger, M. D., BBWI, to D. J. Harrell, BBWI, April 16, 1999, “Modified Tank Farm Residual Estimate,”MDS-07-99.
State of Idaho, 1983, “Hazardous Waste Management,” Idaho Statute, Title 39, “Health and Safety,” Chapter 44, “Hazardous Waste Management” (also known as the Hazardous Waste Management Act of 1983).
State of Idaho, Department of Health and Welfare; U.S. Environmental Protection Agency, Region 10; and U.S. Department of Energy, 1991, Federal Facility Agreement and Consent Order for the Idaho National Engineering Laboratory, Administrative Docket No. 1088-06-120, December 9, 1991.
State of Idaho, Department of Health and Welfare; and U.S. Department of Energy, 1992, Consent Order for the Idaho National Engineering Laboratory, Idaho Code § 39-4413, April 10, 1992.
State of Idaho, Department of Health and Welfare; and U.S. Department of Energy, 1994, Modification to Consent Order for the Idaho National Engineering Laboratory, Idaho Code § 39-4413, March 24, 1994.
State of Idaho, U.S. Department of Energy, and Department of the Navy, 1995, Settlement Agreement, October 16, 1995.
State of Idaho, Department of Health and Welfare; and U.S. Department of Energy, 1998, Second Modification to Consent Order for the Idaho National Engineering Laboratory, Idaho Code § 39-4413, July 31, 1998.
State of Idaho, Department of Health and Welfare; and U.S. Department of Energy, 1999, Third Modification to Consent Order for the Idaho National Engineering Laboratory, Idaho Code § 39-4413, April 19, 1999.
Sullivan, T. M., 1993, DUST: Disposal Unit Source Term: Data Input Guide, NUREG/CR-6041, BNL-NUREG-52375, 1993.
Sullivan, T. M., 2001, DUST-MS Disposal Unit Source Term: Multiple Species Data Input Guide, Brookhaven National Laboratory, Environmental and Waste Technology Center, 2001.
Surfer 8, Version 8.0, Golden, Colorado: Golden Software, Inc., 2003.
Trever, K. E., DEQ, to K. Lockie and X. Yin, DOE, January 17, 2006, “State of Idaho Document Review Report on §3116 Determination for INL Tank Farm.”
Van Camp, S. G., DOE-ID, to K. E. Trever, DEQ, March 20, 2006(a), “State of Idaho Review Report on Section 3116 Determination for Idaho Tank Farm (FMDP-MTPP-06-005).”

120
Van Camp, S. G., DOE-ID, to K. E. Trever, DEQ, July 26, 2006(b), “Response State of Idaho Review of Draft 3116 Determination for the Idaho Nuclear Technology and Engineering Center Tank Farm Facility (FMDP-MTPP-06-022).”

121
11. DRAWING
055705, INL Reference Drawing, INTEC Plot Plan, Rev. 41, February 15, 2005. (This drawing has been classified as “Official Use Only.”)