Basin Modelling Abstract Book Main Content
49
Modelling Sedimentary Basins and their Petroleum Systems June 2010 Page 1 Modelling Sedimentary Basins and their Petroleum Systems 3-4 June 2010 The Petroleum Group would like to thank BP, Eni and ExxonMobil for their support of this event :
-
Upload
achmad-winarko -
Category
Documents
-
view
224 -
download
0
Transcript of Basin Modelling Abstract Book Main Content

7/26/2019 Basin Modelling Abstract Book Main Content
http://slidepdf.com/reader/full/basin-modelling-abstract-book-main-content 1/49
Modelling Sedimentary Basins and their Petroleum Systems
June 2010 Page 1
Modelling Sedimentary Basins
and their Petroleum Systems
3-4 June 2010
The Petroleum Group would like to thank BP, Eni and
ExxonMobil for their support of this event :

7/26/2019 Basin Modelling Abstract Book Main Content
http://slidepdf.com/reader/full/basin-modelling-abstract-book-main-content 2/49
Modelling Sedimentary Basins and their Petroleum Systems
June 2010 Page 2
CONTENTS PAGE
Conference Programme Pages 3-5
Oral Presentation Abstracts Pages 6-35
Poster Abstracts Pages 36-46
Fire Information Pages 47-48

7/26/2019 Basin Modelling Abstract Book Main Content
http://slidepdf.com/reader/full/basin-modelling-abstract-book-main-content 3/49
Modelling Sedimentary Basins and their Petroleum Systems
June 2010 Page 3
PROGRAMME
Thursday 3 June
08.30 Registration and Coffee
9.00 Welcome
9.05 Keynote: Nicky WhiteCrustal Modelling Challenges
9.40 Muriel Thibaut3D Advanced Basin Modelling Workflow
10.05 Karsten KroegerThe Role of Crust and Mantle in the Reconstruction of Heat-Flow in Sedimentary Basins, anExample from the Taranaki Basin, New Zealand
10.30 Coffee and Poster Session
10.50 Jorham ContrerasSeismic Stratigraphy and Integrated Reverse-Basin and Forward Stratigraphic Modelling of theSouthern Brazilian Margin (Campos, Santos and Pelotas Basins)
11.15 Stephan DuppenbeckerPetroleum Systems Dynamics of the South Caspian Basin
11.40 Session Summary Discussion
11.50 Poster Summaries – Session One
12.05 Lunch and Poster Session
13.20 Keynote: Joe CartwrightGeophysical evidence for highly focused fluid flow in sedimentary basins
13.55 James MaynardForward Modelling the Miocene Stratigraphy of an Unconventional Basin Centred HydrocarbonPlay, Pannonian Basin, Hungary
14.20 Pete Burgess Application of Stratigraphic Forward Modelling to Exploration Problems
14.40 Coffee and Poster Session
15.05 Sebastien Rohais
Coupling 3D Structural Restoration with Stratigraphic Modelling in Rifted Margins, Suez Rift,Egypt
15.30 Anne Domzig3D Structural Restoration and Forward Turbidite Modelling to Predict Sand DepositionPatterns on Restored Palaeo-Bathymetric Surface: A Case Study in the North Sea
15.55 Fiona Whitaker3D Forward Modelling of Carbonate Platform Sedimentology and Diagenesis
16.20 Session Summary Discussion
16.30 Reception

7/26/2019 Basin Modelling Abstract Book Main Content
http://slidepdf.com/reader/full/basin-modelling-abstract-book-main-content 4/49
Modelling Sedimentary Basins and their Petroleum Systems
June 2010 Page 4
Friday 4 June
08.30 Registration and Coffee
9.00 Keynote: Andy Bell
Charge and Flow Modelling: It’s Not Only About Geochemistry
9.35 Robert OndrakReconstructing the HC-Filling History of a Haltenbanken Oil Field, Mid-Norway on Basin andReservoir Scales
10.00 Anna ScottiExperimental Validation of Multicomponent Hydrocarbon Differential Expulsion from SourceRock
10.25 Coffee and Poster Session
10.45 Ulf Boeker
Evaluation of Gas Migration History Through Integration of Multidisciplinary Laboratory andField Based Measurements
11.10 Chris ClaytonIncorporation of Biogenic Gas Generation into Petroleum System Models
11.35 Session Summary Discussion
12.00 Poster Summaries – Session Two
12.15 Lunch and Poster Session
13.30 Keynote: Marie-Christine CacasHydrocarbon Mass Balance at Basin Scale with Integrated Generation and Migration Modelling
14.05 Jonathan McQuilken A Workflow Solving Migration Problems with Combined Structural and Petroleum SystemsModelling: Case Studies from Offshore Brazil and Onshore Trinidad
14.30 Michael ChengCalibration and Prediction of Petroleum Charge Scenarios – An Example from the NorwegianBarents Sea
14.55 Coffee and Poster Session
15.15 Matilde Dalla RosaPetroleum System Calibration Under Uncertainty Constraints
15.40 Douglas MooreExploration-Phase 2D Basin Modelling to Highlight Key Risks, Focus Technical Tasks andPotentially Reduce Time to Drilling: Devil’s Hole Basin, UK North Sea
16.05 Robert OndrakHydrocarbon Leakage Indicators on The Angola Oceanic Basin, Deep-Offshore West AfricanMargin: Seismic Interpretation and Numerical Modelling
16.30 Session Summary Discussion
16.45 Conference Ends

7/26/2019 Basin Modelling Abstract Book Main Content
http://slidepdf.com/reader/full/basin-modelling-abstract-book-main-content 5/49
Modelling Sedimentary Basins and their Petroleum Systems
June 2010 Page 5
POSTER PROGRAMME
Session One
Michael DrewsEnhancing Seal Quality Prediction by Modelling Spatial Permeability Distributions of Meter-Scale Fine-Grained Sediments
Jingsheng MaUpscaling Compaction Relationships for Basin Modelling
Muriel ThibautFull High Resolution Basin Model and Local Grid Refinement – Pros and Cons
Session Two
Jean-Paul CallotBasin Modelling in Foothills: A Coupled Thrustpack-Ceres Study of the Kanau-Kutubu-Mubi-Wage Cross Section (Papua New Guinea Fold-and-Thrust Belt)
Jorham ContrerasSeismic Stratigraphy and Numerical Basin Modelling of the Southern Brazilian Margin(Campos, Santos and Pelotas Basins)
William PrendergastPlate-Scale 3D Mapping in Exploration Workflows

7/26/2019 Basin Modelling Abstract Book Main Content
http://slidepdf.com/reader/full/basin-modelling-abstract-book-main-content 6/49
Modelling Sedimentary Basins and their Petroleum Systems
June 2010 Page 6
Oral Presentation Abstracts
(in presentation order)

7/26/2019 Basin Modelling Abstract Book Main Content
http://slidepdf.com/reader/full/basin-modelling-abstract-book-main-content 7/49
Modelling Sedimentary Basins and their Petroleum Systems
June 2010 Page 7
Thursday 3 June

7/26/2019 Basin Modelling Abstract Book Main Content
http://slidepdf.com/reader/full/basin-modelling-abstract-book-main-content 8/49
Modelling Sedimentary Basins and their Petroleum Systems
June 2010 Page 8
Keynote Speaker: How to Model the Thermal Evolution of ExtensionalSedimentary Basins and Passive Margins
Nicky White, Cambridge University
It is widely agreed that many basins and margins form by stretching of continentallithosphere. Nevertheless, there is considerable disagreement about the way in whichstretching is accommodated at depth. Does lithosphere ever stretch uniformly? Ifdepth-dependent stretching does occur, what form does it take? The answers to thesegeneral and important questions have profound implications for the structural, thermaland magmatic evolution of margins. Ten years ago, the hydrocarbon industry began toexplore deep-water margins in earnest. A quantitative understanding of the way inwhich these highly stretched margins develop will play a central role in reducingexploration risk (White et al., 2003). Two contrasting strategies have been used toaddress the problem of depth-dependent stretching. One approach exploitsincreasingly sophisticated dynamical models, which assume that body forces act uponthe rheological framework of the lithosphere to produce deformation. These forward
models have two drawbacks. First, the rheological framework is based uponextrapolating the results of laboratory experiments by over ten orders of magnitudeand so is poorly understood. For example, it is still unclear whether the strength of thelithosphere is controlled by crust or by lithospheric mantle. Secondly, dynamicalalgorithms are slow and the more useful inverse problem cannot yet be posed. Analternative approach has concentrated on developing simple kinematic algorithmswhich are fast enough to be used as the basis of inverse modelling. These inversealgorithms seek patterns of deformation which generate the best possible matchbetween model and observation. We have developed a flexible inverse model whichassumes that the lithosphere deforms by spatial and temporal variation of the strainrate tensor. In this kinematic model, strain rate can vary with time, with distance acrossthe margin, and with depth. Crucially, and in contrast to other groups, we make no
assumptions about the way in which strain rate varies with depth. Instead, we invert forthe existence and form of depth dependency. This strategy is therefore a logicalgeneralization of our previously published work (Bellingham & White, 2000). To ensurecomputational speed and conservation of mass, we employ a spectral approach. Inorder to invert, we must assume an initial distribution of strain rate. This starting modelis calculated by setting the thermal expansion coefficient of the lithosphere to zero andby assuming that material does not move sideways. The algorithm then seeks thesmoothest spatial and temporal distribution of strain rate which yields the smallestmisfit between predicted and observed subsidence and crustal thinning profiles.Different search algorithms have been tested and we conclude that the conjugategradient method is a suitably efficient and stable search engine. This general inversemodel has been tested on synthetic datasets which display different patterns of depthdependency. In general, depth dependency is recoverable when its existence ismanifested by changes in the pattern of subsidence. We have also modelled datasetsfrom basins (e.g. North Sea, Gulf of Suez) and from margins (e.g. South China Sea,Black Sea, Brazil-Angola). The results from these regions suggest that depthdependency is mild and that lithosphere stretching is largely, but not completely,uniform. An important exception is the Newfoundland-Iberia conjugate margin systemwhich exhibits marked depth dependency for reasons which are not clearly understood(Crosby et al., 2008). Our inverse algorithms are flexible and powerful tools formitigating exploration risk at deep-water margins where stretching history is poorlyknown. These algorithms can also be used to calculate thermal histories at margins(Jones et al., 2004).

7/26/2019 Basin Modelling Abstract Book Main Content
http://slidepdf.com/reader/full/basin-modelling-abstract-book-main-content 9/49
Modelling Sedimentary Basins and their Petroleum Systems
June 2010 Page 9
3D Advanced Basin Modelling Workflow
M. Thibaut, I. Faille, A. Jardin, IFP, Rueil Malmaison, France
Basin modelling tools aim at giving a qualitative and quantitative description of
petroleum systems. To enhance oil and gas recovery, they need to improve the faultdescription in structurally deformed environments.
This paper presents a 3D basin modelling workflow with the ongoing research onvolumetric restoration and basin scale simulation adapted to a faulted and thrustedarea.
Methodology
An integrated workflow that combines a variety of expertises from geophysics togeology for petroleum system evaluation has been developed. This workflow is basedon a flow chart. The first step is the building of the structural model at present day.
Second step builds the history of the structural deformation of the basin. Last step isthe forward simulation in pressure, maturity coupled with the structural deformation.This step implies the development of a new basin simulator taking into account foldedand faulted structures.
First studied area
Our integrated approach has been tested on the Gaspé belt. The Gaspé Peninsula islocated in the northern part of the Canadian Appalachians.
Field observations and timing relationships within the fault zone provide evidence ofthrusting during Ordovician times, normal faulting during the Silurian and Early
Devonian times and dextral strike-slip movement during the Middle Devonian AcadianOrogeny. To the south, the Causapscal fault is interpreted as a backthrust.
Results
In this area of foothills, the building of the 3D model is complicated because of theshadow zones on seismic images. The structural paleo-models are generated usingKine3D-3, a volumetric restoration. From this approach is generated a suitableevolutive mesh for the thermal history, the deformation of rock properties such assedimentation, erosion and compaction, and fluid transfer.
Last step of the 3D adapted basin workflow is the coupling the structural deformationwith the forward simulation. Results exist at different significant time steps: a) atpresent day after the Quaternary erosion, b) after the deposition of the youngest rocksof the syncline, c) after the compressive phase of the Saint Leon formation, d) duringthe extension phase after the deposition of Doublet Val-Brillant – Sayabec, the oldestformation.
Second case study
The second application is a high-resolution scaled sandbox model designed toinvestigate the precise kinematics during the growth of a normal fault system. Weapply the same workflow as for the previous example, and results on a simplified
model in temperature and overpressure are been simulated.

7/26/2019 Basin Modelling Abstract Book Main Content
http://slidepdf.com/reader/full/basin-modelling-abstract-book-main-content 10/49
Modelling Sedimentary Basins and their Petroleum Systems
June 2010 Page 10
Conclusion
We have presented the main steps of an integrated workflow for basin modellingstudies in a deformed context in 3D on two case studies. The first results with the newcalculator ArcTem linking a dynamic geometry with a fluid flow simulation are very
encouraging, because they demonstrate that a solution exists for 3D future petroleumsystem evaluation studies in complex areas.
7/26/2019 Basin Modelling Abstract Book Main Content
http://slidepdf.com/reader/full/basin-modelling-abstract-book-main-content 11/49
Modelling Sedimentary Basins and their Petroleum Systems
June 2010 Page 11
The Role of Crust and Mantle in the Reconstruction of Heat-Flow in SedimentaryBasins, an Example from the Taranaki Basin, New Zealand
K.F. Kroeger, K.J. Bland, M. Fohrmann & R.H. Funnell, Institute of Geological and Nuclear
Sciences, PO Box 30368, Lower Hutt .
A typical approach to modelling the influence of crustal- and lithospheric-scaleprocesses on heat-flow in sedimentary basins is to use standardised models of heat-flow evolution through time, based on the regional tectonic setting and type ofunderlying crust. Our study in the Taranaki Basin on the west coast of the North Islandof New Zealand provides an example where this generalised approach is inadequateto reproduce the observed present-day heat-flow pattern. Surface heat-flow calculatedfrom numerous exploration wells varies between 46 and 83 mW/m2 within a distance of200 km. An explanation for this variability, apart from sedimentation and erosioneffects, lies in the compositionally and structurally heterogeneous basement of theTaranaki Basin. The crust consists of a series of terranes ranging from continental,granite-dominated Gondwana crust in the west to sedimentary, continental and
oceanic arc related sedimentary rocks in the east with a series of more mafic plutonsinbetween. The calculated present-day heat productivity of these units varies between3.3 microW/m3 in Palaeozoic granites and 0.85 microW/m3 in mafic plutons. In addition,during the Tertiary the Taranaki Basin has progressively evolved from a rift margin to ahybrid intra-arc/back-arc basin/fold-thrust belt in response to propagation of PacificPlate subduction beneath the Australian Plate in the region. This plate boundarydevelopment has had considerable impact on Taranaki Basin subsidence andexhumation, crustal thickness, and mantle heat advection.
We have mapped basement composition and sedimentary architecture from seismicdata and, using mid- and lower-crust analogues exhumed in the South Island of NewZealand, have constructed a Petromod model of the crust and the sedimentary cover
of the Taranaki Basin. Model results indicate that crustal thickening in the forelandbasin phase resulted in considerable crustal-scale cooling in the south-eastern part ofthe basin. The north-eastern part of the basin, on the other hand, has been influencedby mantle heat-advection and related magmatic and hydrothermal processes. Anexhumation event in the Late Miocene resulted in a modelled transient increase insurface heat-flow in parts of the basin of up to 10 mW/m2. The influence of thevariability in crustal heat generation on surface heat-flow, however, is modelled to beas large as all other overall effects taken together, being as high as 20 mW/m 2. Inbasins situated on a structurally complex and heterogeneous crust such as theTaranaki Basin, it is therefore vital to consider crustal-scale processes andcomposition when assessing hydrocarbon generation potential.

7/26/2019 Basin Modelling Abstract Book Main Content
http://slidepdf.com/reader/full/basin-modelling-abstract-book-main-content 12/49
Modelling Sedimentary Basins and their Petroleum Systems
June 2010 Page 12
Seismic Stratigraphy and Integrated Reverse-Basin and Forward StratigraphicModelling of the Southern Brazilian Margin (Campos, Santos and PelotasBasins)
J. Contreras1, R. Zühlke
1, S. Bowman
2, T. Bechstädt
1
1GeoResources STC at the Institute of Geosciences, Heidelberg University, Germany
2 Petrodynamics Inc., 12410 Meadow Lake Drive, Houston, USA
An integrated approach of sequence stratigraphy, two-dimensional reverse-basin andforward stratigraphic modelling have been carried out on three seismic reflectionprofiles (300-340 km long), located in the Campos (CB), Santos (SB) and Pelotas (PB)basins, offshore Brazil. Twenty-one calibration wells provided lithologic and bio-/chronostratigraphic correlation ties for the Barremian to Holocene basin fill. Mainresults for each of the studied basins include: (i) identification of twelve to fourteenseismo-stratigraphic units (3-50 m.y. of duration), containing smaller-scale stackingpatterns and key stratigraphic surfaces; (ii) recognition of six major subsidence trends
(ST1 to ST6) controlling the Barremian-Holocene basin development; (iii) geneticsubsidence model in time (i.e., thermo-tectonic, flexural- and compaction-inducedcomponents); (iv) analysis of processes controlling accommodation space evolutionand basin infill: subsidence, eustacy and sediment supply (Fig. 1); (v) impact of basinevolution stages and plate-tectonic reconfigurations on basin architecture: Barremiansyn-rift, Aptian syn-rift sag in CB, SB or post-rift in PB, Early-Middle Albian postrift andMiddle Albian-Holocene drift. Forward stratigraphic modelling simulates the basindevelopment and predicts the sedimentary distribution in time (Fig. 2). It incorporates acomprehensive set of algorithms, including: lithologies, ages and geometry of seismo-stratigraphic units, flexural rigidity of the crust, eustatic sea-level and quantitativereverse modelling results of subsidence, paleobathymetry and sediment flux.
After Barremian syn-rift brittle extension had ceased (subsidence trend ST1), depth-dependent lithospheric extension in the CB and SB controlled the syn-rift sag stage(trend ST2). Fault-bounded depocenters expanded; lacustrine environments evolved tosalt basins in the Late Aptian, prior to continental break up. In the PB, Barremian syn-rift volcanism (SDRs) and crustal thickening preceded post-rift Aptian clasticprogradation in open marine environments. During the Late Cretaceous drift stage(ST3), decreasing subsidence characterized the thermal phase of “passive margins”.Long-term retrogradation in the CB and PB contrast with progradation in the SB led byhigher sediment supply. During the Tertiary (ST4-ST6), flexural-induced subsidencecontrolled decreases and increases in accommodation space. Subsidence/uplift trendsare highly variable between basins and along the shelf-basin transition. Thesevariations are related to changes in sediment flux and resulting accommodation, far-
field stress and thermal re-adjustments of the crust. Salt deformation in the CB and SBwas also a major control on sedimentation patterns. In the PB, where the saltsuccession is absent, the basin development was largely controlled by differentialflexural subsidence. Results of forward stratigraphic modelling can be compared withthe initial seismo stratigraphic interpretation and previous quantitative analysis; itallows to control and modifies existing sedimentary genetic models.

7/26/2019 Basin Modelling Abstract Book Main Content
http://slidepdf.com/reader/full/basin-modelling-abstract-book-main-content 13/49
Modelling Sedimentary Basins and their Petroleum Systems
June 2010 Page 13
Petroleum Systems Dynamics of the Shah Deniz Field in the South CaspianBasin
S. J. Duppenbecker , G. W. Riley, N. R. Abdullayev, T. J. Green, H. Doran
BP Exploration Ltd., Azerbaijan Business Unit, Chertsey Road, Sunbury-on-Thames, TW167LN, UKBP Exploration (Caspian Sea) Limited, 2 Neftchiler, Villa Petrolea, Baku, AZ 1003
The South Caspian Basin represents an extremely young petroleum system in whichover 8 kilometres of sediment have been deposited in the past 6-10 million years.Within the last 1-2 million years sediment deposition rates increased up to 3kilometres. These high deposition rates have pushed the sedimentary section intosignificant disequilibrium with respect to the evolution of temperature and porepressure as well as the generation and migration of hydrocarbons. The basin dynamicsare expressed in:
(1) Rapid, vertical and lateral pressure changes in the sediments that limit the capacityof seals to build and preserve petroleum columns and present challenges for wellplanning and execution.(2) Low temperature gradients which delay petroleum generation from the source rockintervals and slow down diagenetic processes in the reservoirs.
In the South Caspian the Miocene Maykop Source Rock series is overlain by thePliocene „Productive Series‟ (PS) which consist of world-class reservoir systems andlacustrine shales. This sedimentary sequence is strongly layered at the scale of metersto hundreds of meters. Structural events during the Pliocene resulted in the creation oflarge anticlines with significant relief and local surface exposure of reservoir/aquiferintervals on the basin margin due to uplift. Pressure observations from wells in the
widespread reservoir sequences of the lower PS show that overpressure is increasingtowards the basin centre.
The large Shah Deniz structure developed as a doubly plunging anticline over the last3 Ma, with approximately 2km of vertical relief and 360km 2 of four-way dip closure.From the extensive drainage area around anticline petroleum migration was focussedfor considerable time into the core of the structure. A recent, large scale pressureregression event created seal capacity, and thus the hydrocarbon trap within thereservoir units which created significant petroleum column heights for a number ofreservoirs.
3D Basin Modelling studies were the key to understand the fundamental controls on
pressure distribution and the capacity to build hydrocarbon columns in Shah Deniz.The complex interaction between the 3D connectivity of high permeability sediments(aquifers) and the 3D architecture of the low permeability sediments (aquitards) arebest understood by fluid flow simulation techniques. Our Basin Modelling work links theobservation of pressure regressed reservoirs to the phenomena of a hydrodynamicaquifer in the most recent geologic history. The complex distribution of regional aquiferpressures around the Shah Deniz Structure is felt to explain the hydrocarbon columnheights as well as the fluid contact variations in the field.
7/26/2019 Basin Modelling Abstract Book Main Content
http://slidepdf.com/reader/full/basin-modelling-abstract-book-main-content 14/49
Modelling Sedimentary Basins and their Petroleum Systems
June 2010 Page 14
Keynote Speaker: Geophysical Evidence for Highly Focused Fluid Flow inSedimentary Basins
J. Cartwright, 3DLab, School of Earth, Ocean and Planetary Sciences, Cardiff University, MainBuilding, Park Place, Cardiff CF10 3YE, Wales, UK
Modern 3D seismic has opened a high spatial resolution window into a number ofsubsurface processes, but perhaps none more so than into mechanisms contributingto subsurface fluid flow regimes. There is a diversity of seismic expression of fluid flow,arising either from the change in acoustic properties due to changes in the pore fillingfluid (or cement), or from the damage to the acoustic layering resulting from the fluidflow (hydraulic fracture, liquefaction, fluidization). In this presentation, I show examplesof both: firstly, how amplitude anomalies related to gas or cements can provide cluesas to migration pathways, and secondly how vigorous fluid flow is associated withpropagation of natural hydraulic fractures on a range of scales, but all under conditionsof extreme fluid pressure gradient.
Seismic amplitude is sensitive to the presence of free gas, through its impact on bothvelocity and density of most sedimentary rocks. Free gas is thus easily detected withseismic data in the shallow sedimentary realm. Examples are presented showing howmethane accumulations appear in three dimensions, and how their spatial context withrespect to structure and lithofacies can be used to explore the possibility of differentmigration pathways.
Subsurface fluid pressures are only very rarely known to approach the present daylithostatic gradient, but evidence is presented here that supralithostatic fluid pressureshave existed in many sedimentary basins in the past. The evidence comes from: (1)the widespread occurrence of development of sandstone intrusions with a sill-likegeometry, and (2) fluid expulsion pipes ascending >1km from synclinal regions and
homoclinally dipping slopes. The sandstone sills can be up to 2km in diameter and>100m thick, and form interconnected conical networks ascending over 1000mthrough ultra-fine „sealing‟ sequences, providing pathways for subsequent highlyfocused vertical fluid flow. It is argued here from the classical mechanics of sheetintrusions that sandstone sills of this scale can only be sourced from a pressurecompartment (with a major net sand component) that has pore fluid pressure in excessof lithostatic. The fluid expulsion pipes are typically 50-100m in diameter, withcylindrical geometry and with circular to elliptical appearance on slice imagery. Theycan be >2000m tall, and are associated with hydrocarbon anomalies on seismic data.They feed surface or palaeo pockmark craters, indicating a significant fluid flux was intransit along the pipes, either during their formation, or over subsequent periods.
7/26/2019 Basin Modelling Abstract Book Main Content
http://slidepdf.com/reader/full/basin-modelling-abstract-book-main-content 15/49
Modelling Sedimentary Basins and their Petroleum Systems
June 2010 Page 15
Forward Modelling the Miocene Stratigraphy of an Unconventional BasinCentred Hydrocarbon Play, Pannonian Basin, Hungary
J. Maynard, ExxonMobil International Ltd, ExxonMobil House, Ermyn Way, Leatherhead,Surrey, KT22 8UX, UK
The trapping mechanism of a continuous basin centred tight hydrocarbon playdepends upon both the reservoir quality and the geometry of the reservoir andpotential seal horizons. To aid the understanding of the depositional system andstratigraphic architecture a Dionisos forward model was built to simulate the fill of theMako-Trough and Bekes Basins of the Pannonian Basin of Hungary with the objectiveof integrating observations made from wells and seismic and investigate plausiblestratigraphic scenarios.
The Pannonian basin was formed in the early to middle Miocene by back-arc extensionbehind the Carpathian orogenic belt. The basin is surrounded by mountains on allsides which are pre-Miocene in age. The basement consists of Palaeozoic
successions and Mesozoic Tethyan carbonates. The region underwent WSW-ENEextension along normal faults, forming half grabens. This study focuses on two half-grabens, the Mako Trough and Bekes Basin. The basins are filled with Miocenethrough Pliocene post rift sediments, with only a thin Miocene syn-rift succession,sourced from the Palaeo-Danube and Palaeo-Tisza Rivers. The fill consists ofdeepwater lacustrine marls and locally sourced clastics (Endrod Formation) overlain byturbidites (Szolnok Formation), slope deposits (Algyo Fm), delta front (Ujfalu Fm) andalluvial plain (Zagyva Fm).
Seal continuity and stratal connectivity are key to the potential trap risks and data fromthe basins and analogues suggest a distal distributive lobe dominated systemdominates Szolnok deposition with extensive lateral mudstones defined as maximum
flooding surfaces from the downlap surface in their correlative toe of slope settings.Pressure data from wells drilled indicated that these surfaces might be importantpressure cell boundaries. Data from wells also shows two provenances for thesandstones in the Szolnok with some evidence for differential reservoir quality. Themix of these two sediment sources and their presence and or absence was also seenas a key risk.
Key observations from the stratal geometry observed from seismic include two sourcesfor deltaic clinoforms illustrating high frequency aggradational-progradational cyclespunctuated by infrequent episodes of major to the basin down step of the depositionalsystem associated with incision Dionisos was used iteratively to alter sedimentationrates and timing, compaction, subsidence, lake level to recreate these geometries, andthereby gain insight into the process of filling the basin.
These insights were used to understand the potential trap geometry; likely reservoirand seal layer continuity and their impact on hydrocarbon migration and formationpressure. The timing of infill and mix of the two provenances from the Palaeo-Danube /Tisza systems was also examined.
7/26/2019 Basin Modelling Abstract Book Main Content
http://slidepdf.com/reader/full/basin-modelling-abstract-book-main-content 16/49
Modelling Sedimentary Basins and their Petroleum Systems
June 2010 Page 16
Application of Stratigraphic Forward Modelling to Exploration Problems
Peter Burgess, Shell International E&P, Rijswijk, The Netherlands
The first numerical stratigraphic forward models (SFMs) applied to hydrocarbon
exploration were developed during the 1980s. Since then models have increased insophistication and, debatably, realism, with development of 3D process-based modelsof depositional systems spanning siliciclastic and carbonate deposystems and rangingfrom terrestrial to deep-marine environments. Three basic approaches exist forapplication of SFM; best-fit models, preferably generated via an inversion process,scenario modelling, and experimental modelling. However, in general SFM technologyremains immature and is rarely applied compared to charge modelling methods.
Best fit modelling is in most respects the least useful of the three methods inexploration applications because, like other non-numerical modelling methods, itsuffers from issues of model uniqueness, and the tendency to over-interpret a singlemodel result that may well be based on sparse data, and dubious implicit assumptions.
Inversion methods help to address this problem by addressing issues of non-uniqueness and sensitivity, and adding important objectivity and quantitative rigour.
Scenario modelling has links to aspects of inversion methods and is particularly usefulin exploration applications where data are sparse and a variety of subsurfacepossibilities exist. It has the advantage of being able to investigate sensitivities and thestratal consequences of various different assumptions. Multiple model runs can quicklyinvestigate the range of possibilities and results can be combined into easilyinterpreted maps, for example reservoir presence maps.
Experimental modelling is rarely of direct use in exploration problems, but results fromthis method may be very useful in developing knowledge and understanding of how
stratal systems operate. This knowledge and understanding can then be applied tosubsurface prediction. Examples include investigation of carbonate ramp dynamicsand shelf-edge delta formation.

7/26/2019 Basin Modelling Abstract Book Main Content
http://slidepdf.com/reader/full/basin-modelling-abstract-book-main-content 17/49
Modelling Sedimentary Basins and their Petroleum Systems
June 2010 Page 17
Coupling 3D Structural Restoration with Stratigraphic Modelling in RiftedMargins, Suez Rift, Egypt
A. Barrois, S. Rohais, D. Granjeon, J-L. Rudkiewicz, M.C. Cacas, IFP, France
IFP is developing two innovative simulation tools applied to basin modelling. The firstone is a backward volumetric restoration (Kine3D): its output is a set of 3D complex-architecture geo-models of the basin under consideration at different times throughgeological history. The second one is a forward stratigraphic model (Dionisos): itsimulates sedimentologic processes through geological times and provides the userwith a full 3D description of the stratigraphic architecture of the basin at different times.
The aim of this project is to integrate the two applications in a single workflow in orderto get a better characterization of the evolution of sedimentary basins, thanks to takinginteractions between tectonic and sedimentary processes into account.
The project is based on the well documented case study of the Gulf of Suez where
cross-sections, maps and wells are available.
The modelling workflow was conducted as follows:1. four stratigraphic correlation cross-sections were realised from well-logs, in
order to provide a reference 3D stratigraphic model;2. the structural 3D model was built with Gocad by integrating all the relevant
data;3. the structural geo-model at Present was restored with Kine3D-3;4. then, subsidence maps and horizontal displacements calculated with Kine-3D
at the bottom of the syn-rift sediments were exported to Dionisos in order tobuild a stratigraphic model constrained by these tectonic deformations.Different hypotheses on location and volume of sediment input at the basin
boundaries were tested in order to fit the model with observed data.
This project illustrates a combined approach integrating structural volumetricrestoration with stratigraphic modelling in order to build 3D basin models which takeinto account interactions between tectonic and sedimentary processes. Reservoir andseal distribution, as well as burial history are finally much better constrained, providingmore consistent input for a next step of petroleum systems modelling.
7/26/2019 Basin Modelling Abstract Book Main Content
http://slidepdf.com/reader/full/basin-modelling-abstract-book-main-content 18/49
Modelling Sedimentary Basins and their Petroleum Systems
June 2010 Page 18
3D Structural Restoration and Forward Turbidite Modelling to Predict SandDeposition Patterns on Restored Palaeo-Bathymetric Surfaces: A Case Study inthe North Sea
A. Domzig1, S. MacLean
1, D. Waltham
2, T. Rice
1, R. Shackelton
1
1Midland Valley Exploration Ltd., 144 West George Street, Glasgow G2 2HG, U.K.
2 Department of Geology, Royal Holloway, University of London, Egham, Surrey TW20 0EX,
U.K.
Modelling ancient turbidity flow deposits on palaeosurfaces is a key method toestimate depositional patterns of sand deposits in areas where no seismic attribute orhigh-quality isopach maps are available. We describe here a methodology tosequentially restore the present-day horizons up to the time of turbidite deposition andpredict areas of sand deposition on the obtained palaeoseafloor as well as thepreferential sediment-source locations. We present an example of restoration in anextensional tectonic setting in the North Sea which integrates 2D and 3D structural
restoration with forward modelling of turbidity flows.
The first part of the workflow is to establish the palaeo-geometry at the time ofdeposition of target sand reservoirs. Restoration of 2D seismic lines is performed bysequential backstripping and restoring up to the desired palaeosurface to determinetransport direction and deformation style in the study area. Restoration and back-stripping parameters can be fine-tuned in this stage as well as the sequence ofdeformation events. Then the same workflow needs to be applied to 3D surfaces inorder to obtain palaeo-bathymetric surfaces at the time of reservoir turbiditesdeposition. For this we use geometric and geomechanical algorithms available inMidland Valley‟s software Move to restore the 3D surfaces.
Forward modelling of turbidity flows and sediment deposition patterns is thenperformed on the obtained palaeobathymetry using 4DSediment software. A multiplescenarios approach allows to assess the influence of the input parameters, such as:flow dimensions, volume, direction and origin of the flow and grain properties. Additionally, a Monte Carlo approach was used to find a set of parameters thatproduces a flow which gives results closest to the available well data in terms of sandfraction and deposit thicknesses. The paleaoseafloor and the modelled sedimentdeposits can then be forward modelled to their present-day position to estimate theposition of present-day sand reservoirs. The presented workflow therefore providespowerful tools to identify potential sediment source location and preferential areas forsand deposition in zones of poor seismic definition and away from existing wells.

7/26/2019 Basin Modelling Abstract Book Main Content
http://slidepdf.com/reader/full/basin-modelling-abstract-book-main-content 19/49
Modelling Sedimentary Basins and their Petroleum Systems
June 2010 Page 19
3D Forward Modelling of Carbonate Platform Sedimentology and Diagenesis
Fiona Whitaker 1, Peter Smart
2, Graham Felce
1, Katherine Cooper
1, Thomas Leadbeater
1
1Department of Earth Sciences, University of Bristol, UK.
2 School of Geographical Sciences, University of Bristol, UK.
Forward sediment models offer considerable potential for reducing the uncertainty inprediction of reservoir quality and bridging between seismic and well-scale data topopulate geologic models. CARB3D+ is a 3D forward model for simulation of thesedimentary architecture of isolated carbonate platforms, and the distribution ofporosity and permeability as a function of both depositional and early diageneticprocesses. The model includes depth-dependent sediment production in fourcarbonate factories, wave-driven sediment entrainment and transport by currents andby gravity on angle of repose slopes, for user specified sea-level curves andsubsidence rates. Prediction of depositional porosity is based on the proportion ofcoarse and fine grains, and primary permeability is derived from the porosity using
facies dependent empirical relationships.
CARB3D+ simulations of the Triassic Latemar platform, Northern Italy, successfullyreplicate the 3D distribution of depositional facies and platform top topographydescribed by Egenhoff et al. (1999). The classic Latemar cyclic sequences arearranged in thinning upwards packages, probably providing a complete record ofsedimentation, and allowing investigation of cycle bundling resulting from sea-leveloscillations with a hierarchy of periodicities. However, during condensed intervals,accommodation is limiting and many cycles can be shown by modeling to be absent(“missed beats”) due to lack or deposition and/or subaerial dissolution. Althoughstacking patterns in the Latemar and many other cyclic platform carbonate sequenceshave been interpreted in terms of Milankovitch-driven cyclicity in sea level, others have
suggested that such patterns are illusory or related to auto-cyclicity. CARB3D+
synthetic stratigraphies using both stationary Milankovitch cyclic and random sea leveldrivers suggest the layer thickness inventories (LTI) test devised by Bailey and Smith(2005) is a more reliable method for detected cyclicity than the exponential distributiontest used by Burgess (2008).
CARB3D+ also simulates early diagenetic modification of depositional mineralogy,porosity and primary permeability by mineral stabilization, carbonate dissolution,cementation and dolomitisation within four hydrologically-defined diagenetic zones(“hydrozones”). Diagenetic rates are controlled by climate, the presence and nature ofsoil cover and grain size, and vary within hydrozone reflecting results fromhydrochemical studies of modern platforms and reactive transport modeling. CARB3D+
also includes prediction of secondary (dissolutional) porosity which provides animportant feedback between the extent of meteoric hydrozones and evolving sedimentproperties.
CARB3D+ simulations of meteoric diagenesis show a strong lateral continuity, withdepth-dependent diagenesis within the vadose and meteoric phreatic zones, andsystematic lateral variations from margin to interior particularly within the fresh-saltwater mixing zone. These patterns reflect a high degree of temporal overprinting,particularly during periods of high amplitude (icehouse) sea-level fluctuations.CARB3D+ simulations generate diagenetic patterns which are similar to those reportedin the Bahamas during the middle to late Cenozoic icehouse period (Beach 1995;Melim et al. 2001). Here low subsidence rates and protracted periods of subaerialexposure result in thinning and elimination of platform top cycles, and intensesubsurface meteoric diagenetic overprinting. In contrast for the Latemar, low amplitude(greenhouse) sea-level cyclicity limits the depth of vadose meteoric diageneticalteration, and also the lateral extent of the freshwater lens, which may be confined to

7/26/2019 Basin Modelling Abstract Book Main Content
http://slidepdf.com/reader/full/basin-modelling-abstract-book-main-content 20/49
Modelling Sedimentary Basins and their Petroleum Systems
June 2010 Page 20
platform margin highs. However, during condensed intervals the limitedaccommodation results in significant surface dissolution and overprinting.

7/26/2019 Basin Modelling Abstract Book Main Content
http://slidepdf.com/reader/full/basin-modelling-abstract-book-main-content 21/49
Modelling Sedimentary Basins and their Petroleum Systems
June 2010 Page 21
Friday 4 June

7/26/2019 Basin Modelling Abstract Book Main Content
http://slidepdf.com/reader/full/basin-modelling-abstract-book-main-content 22/49
Modelling Sedimentary Basins and their Petroleum Systems
June 2010 Page 22
Keynote Speaker: Charge and Flow Modeling: It’s Not Only About Geochemistry
J. Wendebourg, A. Bell, Shell International, Rijswijk, Netherlands
Charge and flow modeling is performed routinely as part of the exploration workflow in
IOCs like Shell. Its purpose is to quantify the risks associated with charge availability,volumes and hydrocarbon type for greenfield exploration, and to obtain more detailedinformation on composition and volumetrics in near-field exploration. Geochemistryplays a major role to link source rocks with oil and gas occurrence and to identifyprocesses that may have altered HC fluids within the source rock, during migration orin the reservoir. Historically, basin and charge modeling has originated as a sub-discipline of organic geochemistry (e.g. Tissot and Welte 1978). Sophisticatedworkflows and software tools have been developed since which closely link sourcerock kinetics and HC migration with thermal and flow history.
Evidence of HC presence and charge is derived at the molecular level from fluidsamples that are not only taken from the production stream but also in situ, sometimes
under difficult subsurface conditions. Tiny samples can be obtained from fluidinclusions, even in the absence of material discoveries. However, in many explorationcases, large uncertainties remain that cannot be reduced, even if we take into accountsensitivities and uncertainties in our tools and workflows. Additional evidence fromother data sources is needed to effectively de-risk charge access and occurrence. Thisis particularly true in cases where the present day conditions do not representmaximum stress and temperature conditions. Examples of additional data sourcesinclude surface evidence of HC migration, geophysical DHIs, active hydrodynamics,fault reactivation etc.
Shell‟s exploration effort in the Southern Rub-al Khali basin in Saudi Arabia is shownas an example where sophisticated geochemical evidence has been used to de-risk
charge in a greenfield area. Geochemical and petrophysical source rockcharacterization is linked with shows of oil and gas and geophysical evidence of HCpresence, and the evolution of the petroleum and fluid system is explained as part ofthe very long and complex tectonic history of the southern Arabian Peninsula.
7/26/2019 Basin Modelling Abstract Book Main Content
http://slidepdf.com/reader/full/basin-modelling-abstract-book-main-content 23/49
Modelling Sedimentary Basins and their Petroleum Systems
June 2010 Page 23
Reconstructing the HC-Filling History of a Haltenbanken Oil Field, Mid-Norway onBasin and Reservoir Scales
R. Ondrak1, R. di Primio
1, T. L. Leith
2, G. Lescoffit
2, B. Horsfield
1
1GFZ - German Research Centre for Geosciences, Section Organic Geochemistry,
Telegrafenberg Potsdam Germany2 StatoilHydro ASA, Trondheim, Norway
We present a basin modeling study for the reconstruction of the detailed hydrocarbon-filling history of a Haltenbanken oil field. The main focus of the study lays on the fillinghistory of the field, specifically the identification of the spatial and temporal maturityevolution of different kitchen areas as well as the migration pathways into the reservoir.
We constructed a large scale regional model based on seismic horizons of the mainstratigraphic units and well-tops of about 100 exploration wells. The regional modelcovers an area of approximately 80 by 60 km on a 500 by 500 m equidistant grid. We
calibrated the temperature and pressure history of the basin model of the northern partof Haltenbanken with vitrinite reflectance, temperature and pressure data which wasobtained from a public data base supplemented by confidential data. The modelprovided the framework to study hydrocarbon generation and migration.
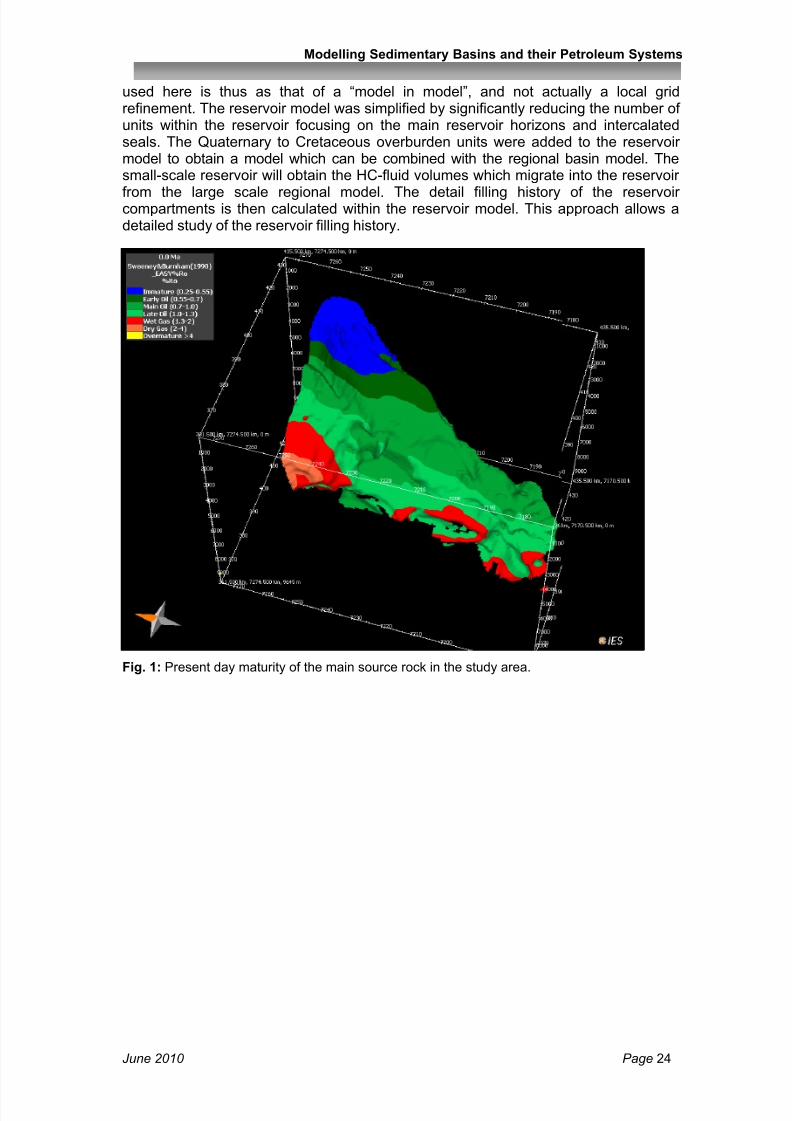
Large variations of burial depth of the upper Jurassic Spekk formation which isconsidered to be the main source rock but also other potential source rocks in theHaltenbanken area result in the maturation of different kitchen areas (Fig. 1)throughout basin evolution. Onset of hydrocarbon generation in different kitchen areaswith progressive burial resulted in changing drainage areas and migration pathwayscontributing to the filling of the reservoir structure through time. The use of source rocktracers assigned to the various kitchen areas allows unraveling the timing of
hydrocarbon generation and migration pathways in the study area.
The filling of the reservoir started in late Paleocene times. During subsequent burialfrom the Cenozoic onward until today the source rock enters the oil windowprogressively from North-West to South-West. Hydrocarbon migration into thereservoir occurs most likely along faults in Paleocene times. During the Eocene andMiocene long-range migration along structural highs becomes the dominant migrationpathway. In Miocene times fill-spill from a deeper lying reservoir adds to reservoirfilling. For the last 3-4 Ma hydrocarbon supply from the deep kitchens has been cut offby diagenetic sealing of the main fault controlling also the occurrence of overpressurein the system.
This basin modeling study provides important understanding for the filling history ofthis Haltenbanken oil field. Subdividing the source rock into different kitchen areasbased on structural elements and burial history helps to elucidate the filling history ofthe reservoir. We can quantify the amounts to which the different kitchen areascontribute to the charge of the reservoir as well as the dominant migration pathwaysinto the reservoir structure.
Different HC-migrations modeling approaches are used to model migration pathwaysand the filling history of the area and the comparison of the modeling approaches withrespect to accuracy and efficiency of the methods is an important aspect of the project.Presently, we use either a combination of Darcy flow and ray tracing to simulatehydrocarbon migration on a regional scale and invasion percolation migration for the
simulation of HC-migration on a reservoir scale.
For a detailed reconstruction of the filling history of the field a reservoir scale modelwas constructed based on a very detailed reservoir production model. The approach
7/26/2019 Basin Modelling Abstract Book Main Content
http://slidepdf.com/reader/full/basin-modelling-abstract-book-main-content 24/49
Modelling Sedimentary Basins and their Petroleum Systems
June 2010 Page 24
used here is thus as that of a “model in model”, and not actually a local gridrefinement. The reservoir model was simplified by significantly reducing the number ofunits within the reservoir focusing on the main reservoir horizons and intercalatedseals. The Quaternary to Cretaceous overburden units were added to the reservoirmodel to obtain a model which can be combined with the regional basin model. Thesmall-scale reservoir will obtain the HC-fluid volumes which migrate into the reservoir
from the large scale regional model. The detail filling history of the reservoircompartments is then calculated within the reservoir model. This approach allows adetailed study of the reservoir filling history.
Fig. 1: Present day maturity of the main source rock in the study area.

7/26/2019 Basin Modelling Abstract Book Main Content
http://slidepdf.com/reader/full/basin-modelling-abstract-book-main-content 25/49
Modelling Sedimentary Basins and their Petroleum Systems
June 2010 Page 25
Experimental Validation of Multicomponent Hydrocarbon Differential ExpulsionFrom Source Rock
L. Caldiero1
, A. Consonni1
, A. De Poli1
, D. Dolci1
, R. Galimberti1
, P. Ruffo1
, A. Scotti2
1
Eni, E&P Division, Basin Geology Department2 MOX - Politecnico di Milano
To simulate generation, cracking and expulsion of hydrocarbons in source rock amulticomponent model, which considers differential retention effects (1) on organic andinorganic matrix, was attempted. Compositional kinetic schemes for seven pseudo-components (C1, C2-C5, C6-C14 Sat, C6-C14 Aro, C14+ sat, C14+ aro and NSO)were used for thermal modelling and the results compared with the more conventionalfour components approach.
Model validation was performed through artificial source rock maturation tests carriedout in laboratory using micro scale reactors (Micro Scaled Sealed Vessels) coupled
with a mass spectrometer. Each pseudo- component set was reconstructed usingsingles compounds representatives of the molecular classes (2,3,4). Model wasvalidated on a type II-III kerogen and further experiments on different organic mattertypes are still in progress.
A simulation algorithm was developed (5), to integrate the differential retention ofdifferent components with the cracking and expulsion processes in ageneration/expulsion module. This has been used to evaluate hydrocarbon expelledfrom source rock.
The forecast composition of expelled products is in agreement with typical well data: ahigher amount of gas is produced in respect to the primary generation, as expected
due to introduction of retention effects.

7/26/2019 Basin Modelling Abstract Book Main Content
http://slidepdf.com/reader/full/basin-modelling-abstract-book-main-content 26/49
Modelling Sedimentary Basins and their Petroleum Systems
June 2010 Page 26
Evaluation of Gas Migration History through Integration of MultidisciplinaryLaboratory and Field Based Measurements
U. Boeker 1, A.C. Aplin
1, A. Georgiopoulou
2,3, J. Cartwright
2, M. Drews
1, K.D. Kurtev
1, T. Dodd
4
1Newcastle University,2 Cardiff University,
3University College Dublin,
4BP Egypt
The aim of this study is to combine petrophysical and geochemical data in order toreconstruct the migration history and pathways of mixed microbial-thermogenic gasesdrilled in part of a major North African Tertiary delta. Special attention is dedicated tounderstanding (a) the origin of gas in both reservoir and non-reservoir units usingchemical and isotopic fingerprints and (b) whether or not a free gas phase occurs innon-reservoir units both above and below commercial accumulations. The latter is of
central importance since only the presence of a free gas phase can result in relativelyrapid leakage, via bulk flow, as a function of relative permeability; if gas is dissolved inwater, then transport is by diffusion or by water flow, with very different consequencesfor rates and volumetrics.
The Pliocene section in this study is a classic slope environment comprising channels,mud-rich turbidites, mass transport complexes and hemipelagites. Data from seismicand drilled wells suggest that the channel and levee reservoirs are rarely full to spill,implying either a lack of charge and/or a balance between charge and leakage rateswhich precludes complete filling of the structures. Here, we are interested inunderstanding migration routes, rates and mechanisms.
In principle, gas migration may take place along one or both of two general routes: (a)high permeability, seismic-scale bypass systems including injected sands and sands juxtaposed at e.g. levee-levee connections (“multi-storey migration”), and/or (b)predominantly vertical flow through mud-rich sediment sequences. In this relativelyshallow region, potential large-scale conduits are readily identified on seismic as gas-bearing anomalies. However, their role as migration pathways for thermogenic gas isalways uncertain due to the ubiquitous generation of microbial gas in this area.
Our comprehensive dataset enables a quantitative assessment of gas distribution andits genetic fingerprint in the context of both stratigraphic position and lithology. Wehave a seismic cube penetrated by 28 boreholes, each provided with a conventional
wireline log suite and some with borehole images and high-quality core images. Forcalibration of these petrophysical signals we use a mudrock database containingvarious measurements of more than 300 samples from the study area. Gasconcentration data, plus compositional and isotope data are available from isotubesand headspace gas for both reservoir and non-reservoir units. Great care was taken todepth-match core, log and gas data.
In general, the gases comprise a variable mixture of microbial gas (~99.7% methane)and thermogenic gas containing <10% wet gas and condensate components. Mixing ofthese two gas types results in gases which generally contain >98% methane. Inaddition, there is evidence for microbially generated ethane and also for combined
methanogenesis (light13
CC1, heavy13
CCO2) and wet gas biodegradation (abnormallyheavy 13CC2+) at temperatures below 70°C. In many structures, thermogenic gasoccurs not only inside the reservoirs but also in both the underseals and top seals,indicating vertical migration through mud-rich units. Generally, reservoired gas

7/26/2019 Basin Modelling Abstract Book Main Content
http://slidepdf.com/reader/full/basin-modelling-abstract-book-main-content 27/49
Modelling Sedimentary Basins and their Petroleum Systems
June 2010 Page 27
comprises a greater proportion of thermogenic gas, with a greater biogenic signature inthe non-reservoir units. On a pore scale, we suggest that this implies migration throughfocused pathways within the non-reservoir, allowing the retention of pre-existingbiogenic gas sorbed to organic matter. Mixing and flushing is prevalent in the reservoirunits.
Careful assessment of the maturity of the thermogenic gas charge suggests that in agiven structure, maturities are similar throughout the sampled section of underseal,reservoir and top seal. We see no evidence for compositional stratification as a result,for example, of gases of differing maturity arriving in reservoirs and non –reservoirs atdifferent times and along different flowpaths. Furthermore, we see no evidence ofbiodegraded gas above ~65°C, suggesting that palaeo-degraded gas has beenflushed out of the system in the last ~1my by fresh gas. Overall, the data support theidea of focused, sub-vertical, geologically rapid gas migration through an overall mud-rich stratigraphic section.
Combining the gas concentration data with wireline log data and a simplified system of
a porous medium filled with methane, water and salt, we attempted to estimate the gassaturation in non-reservoir units. Initial results, which need to be tested further, suggestsaturations of up to 20%, supporting the idea of bulk flow, rather than diffusion or theflow of gas-bearing water as a result of compaction.
In summary, we believe that the study shows that a combination of geochemical datawith lithological and petrophysical data generates very useful insights into both ratesand mechanisms of two phase flow within gas-charged basins.

7/26/2019 Basin Modelling Abstract Book Main Content
http://slidepdf.com/reader/full/basin-modelling-abstract-book-main-content 28/49
Modelling Sedimentary Basins and their Petroleum Systems
June 2010 Page 28
Incorporation of Biogenic Gas Generation into Petroleum System Models
C. Clayton, Geochemistry Consultant, High Bank House, Eardiston, Tenbury Wells,Worcestershire, WR15 8JJ, UK
All potential petroleum source rocks will have passed through a phase of biogenic gasgeneration before thermogenic petroleum generation processes become active andthis has important implications for modelling the behaviour of the petroleum system.Firstly, biogenic methane is becoming increasingly important as an exploration targetin its own right, yet we have limited capability in predicting its presence. Secondly,most source rocks would already be saturated with biogenic methane ahead of anythermogenic gas generation, which will influence the timing of gas expulsion, expelledgas volumes, and the isotopic ratio of methane expelled at low maturity. Despite thisimportance, the prediction of biogenic generation rates over geological timescales hasproved elusive.
Recent advances in understanding the microbiology of methane formation during
diagenesis provide a basis for incorporation of biogenic methane generation processesinto computational basin models. Methanogenic activity is now known to be rate-limitedby the availability of substrate supplied by parallel microbial reactions. These parallelreactions are, in turn, temperature controlled and so are amenable to modelling usingan Arrhenius-type kinetic approach. It is then necessary to introduce a temperature-dependant substrate conversionrate which reflects thetemperature-limited efficiency ofthe methanogenic organismsthemselves.
Modelled methane generation
rates using this dual substrategeneration-conversion approachclosely match measuredmethane generation ratesduring early diagenesisdetermined for sedimentsrecovered by ODP drilling andreproduce headspace gasprofiles measured in mud-dominated sediments such asthe Tertiary of the North Sea(right) and PLio-Pleistocene of
the Gulf of Mexico over timescales of millions of years.
Modelled methane generation prof il e for
Terti ary of the North Sea compared with gas

7/26/2019 Basin Modelling Abstract Book Main Content
http://slidepdf.com/reader/full/basin-modelling-abstract-book-main-content 29/49
Modelling Sedimentary Basins and their Petroleum Systems
June 2010 Page 29
Keynote Speaker: Hydrocarbon Mass Balance at Basin Scale with IntegratedGeneration and Migration Modelling
M. C. Cacas, J.L. Rudkiewicz1, B. Carpentier
1, LF. Carvalho-Coutinho
2, J-F Lecomte
1
1
Institut Français du Pétrole, Rueil-Malmaison Cedex France2 Petrobras, CENPES, Rio de Janeiro
Hydrocarbon migration modelling reconstructs the generation of hydrocarbons, then theirmovement in the sediments of a basin through geological times and eventually itheirtrapping. Therefore, when applied to a complete geological basin, HC modelling can beused for original oil or gas in place estimation. This presentation will focus on this topic andwill present the principles of the application, as well as its related uncertainties, based onseveral real examples, among which the Reconcavo basin in Brazil.
To estimate hydrocarbon in place, the workflow goes through the following steps :1. definition and estimation of the porosity of the main reservoir units;
2. computation of the surface and pore volume of closed structures;3. estimation of the mass of generated hydrocarbons in the various source rocks;4. estimation of the nature of the expelled hydrocarbons, either oil, condensate or
gas;5. calibration of migration parameters based on observations;6. computation of accumulated HC volumes in the previously defined closures;7. computation of lost hydrocarbons through capillary leakage;8. estimation of volumes of hydrocarbons in surface conditions.
The structural closures are defined for each potential reservoir, with the computation of thelocal structural tops, the closure heights and the maximum trapped volumes. Faults can betaken into account as being laterally permeable or impermeable. Moreover, lateral faulttransmissivity may vary with geological time or with azimuth, depending on the tectonic
regime of the basin. Lateral facies changes from reservoir facies to non reservoir faciesmay result in stratigraphic traps. The size and the spill points of structural or stratigraphictraps may change through geological times with basin subsidence and tilting.
Simultaneously, the quantity of generated and expelled hydrocarbons from the sourcerocks of the basin can be computed, based upon compositional kinetics and volume andmass balances within the pore space of the source rock. Source rock related parametersneed to be calibrated to observations, so that in situ retention is accounted for.
Then, the hydrocarbon charge of accumulations is computed along the source rock layers,the faults and the reservoir layers. Later, when the basin history goes on with increasingsubsidence or tilting of the basin horizons, hydrocarbon secondary migration can occur
through fill and spill along leakage points. Due to decreasing pressure and temperaturewith decreasing burial depth, the hydrocarbons expelled from the underlying source rockcan undergo a phase split. This phase split is computed with thermodynamically basedequation of states. The phase split depends thus upon composition, pressure and lastlytemperature. In case of a regional uplift, phase separation can occur and the global volumeof trapped hydrocarbons increases.
Once completed, the migration modelling can be used to compute the total availablevolume of hydrocarbons in a given sedimentay basin. Because the modelling proceduretakes into consideration compositional primary and secondary cracking, both in sourcerock and reservoirs, as well as liquid/vapour phase separation in subsurface and insurface, the total volumes of trapped oil and gas components can be computed, which is a
way to access to original oil in place.
7/26/2019 Basin Modelling Abstract Book Main Content
http://slidepdf.com/reader/full/basin-modelling-abstract-book-main-content 30/49
Modelling Sedimentary Basins and their Petroleum Systems
June 2010 Page 30
A Workflow Solving Migration Problems with Combined Structural andPetroleum Systems Modelling: Case Studies from Offshore Brazil and OnshoreTrinidad.
J. McQuilken, BG Group plc, Thames Valley Park Drive, Reading, Berkshire, RG6 1PT
The IES 2D PetroMod software utilizes the present day structural configuration of adepth section and back-strips it through time to give a series of time steps which arethen used for petroleum systems modelling. As such, these time steps are notstructurally restored and can have an impact on the modelling outcome, particularly,where structuration and migration are contemporaneous. In addition, complexgeometries such as salt or thrust tectonics cannot be modelled. To overcome thisinadequacy, BG Group jointly sponsored a Joint Industry Project (JIP) to develop theIES 2D PetroMod TecLink Module which enables a workflow whereby structurallyrestored depth sections can be directly imported into 2D PetroMod for use as a seriesof time steps for modelling. This workflow has now been successfully used on anumber of structurally restored sections within BG Group: these include a salt tectonicssection from the Santos Basin, offshore Brazil and a complex thrust tectonics section
from the Central Block area, onshore Trinidad.
For the Santos Basin, BG Brazil were concerned with the role of salt on hydrocarbonmigration and supplied ten structurally restored time steps directly exported from theMidland Valley 2DMove software ranging in age from the Top Albian to the presentday. Simulation showed that salt windows were not developed through time and thatthe salt acts as a migration barrier and top seal to all the oil and gas generated fromthe pre-salt Barremian and Aptian source rocks allowing the generated hydrocarbonsto be trapped in the pre-rift succession. Furthermore, the absence of salt windowsprecludes any further vertical migration through the petroleum system. It is also evidentthat the traps within the pre-rift succession begin to fill with gas as early as the mid Albian; in addition, there is evidence of oil being displaced by gas. Insignificant gaspools exist in the Albian fractured carbonates and are sourced from the mid Albianpost-salt source and have filled by vertical migration through fractures.
BG Trinidad & Tobago were primarily concerned with being able to explain the mix ofliquids and dry gases seen in the petroleum system as accumulations in the onshoreCentral Block area and supplied eight structurally restored time steps from the MidlandValley 2DMove software ranging in age from the Oligocene to the present day.Simulation showed that the working petroleum system in the Central Block area is acombined biogenic and thermogenic system which explains the presence of dry gas inthe down-dip extension of the Corosan discovery, the mix of biogenic and thermogenicgas seen in the down-dip extension of the Carapal Field and the liquids and associated
thermogenic gas in the Penal-Barrackpore structure.
Overall this workflow is now utilised within the routine workflows at BG Group andhighlights how JIPs can be used to overcome problems and significantly improveworkflows.

7/26/2019 Basin Modelling Abstract Book Main Content
http://slidepdf.com/reader/full/basin-modelling-abstract-book-main-content 31/49
Modelling Sedimentary Basins and their Petroleum Systems
June 2010 Page 31
Calibration & Prediction of Petroleum Charge Scenarios – An Example from theNorwegian Barents Sea
M. Cheng, L. Lawton, D. Burnett, W. Parsons, J. Guthrie, Hess Limited, Level 9, The AdelphiBuilding, 1-11 John Adam Street, London WC2N 6AG
Petroleum systems analysis is now routinely applied in many oil and gas companiesfor regional and prospect scale geological evaluations for exploration. Analysis ofcharge adequacy and scenarios - integral to petroleum systems analysis - often carriesuncertainties due to either poor characterization of source rock variability and/orinaccurate mapping of thermal stress (e.g. related to uplifting and erosion). In thispaper we present a case study of regional-scale charge scenario analysis designed toconstrain uncertainties for an area in the Norwegian Barents Sea.
The Norwegian Barents Sea is a prolific petroleum province with multiple provensource rocks and reservoirs. Within this province significant volume of gas andcondensate have been discovered while large volume of oil was discovered only in theSnohvit field. However, the recent oil discoveries at Goliat (2000) and Nucula (2007)
present a different aspect of the petroleum systems complexity in the NorwegianBarents Sea.
To help us understand such complexity and investigate for viable petroleum chargescenarios for Goliat & Nucula as well as regional evaluation of prospect chargeadequacy, we conducted an integrated petroleum systems analysis. Our analysis hastwo important components: 1) we characterized source rocks for ultimate expellablepotential (UEPs) using data from a large number of wells and built a 3D thermal historymodel (via ZetaWare Trinity) using regional seismic maps of key horizons; and 2) weintegrated results of a regional geochemistry analysis of reservoir fluids and fluidinclusion stratigraphy analysis for multiple wells.
We applied the regional-scale 3D Trinity model, which incorporates regional estimatesof erosion and is constrained by observed bottom-hole temperatures, for chargescenario and fetch history analysis. Using known pressure and temperature, fluid andreservoir properties at the Snohvit and other discoveries (oil and gas API gravities,column heights, net-to-gross, and HC in-place volume), we then applied prospect-scale Trinity model for multi-stage (pre and post- uplift) PVT considerations andunderstanding post-filling reservoir dynamics. Such PVT considerations provided us aunique calibration to our charge scenario/fetch history analysis. This integratedregional analysis shed important insights for us to the likely charge scenarios for Goliatand Nucula and it provided us a confident risking for prospect charge scenarios.

7/26/2019 Basin Modelling Abstract Book Main Content
http://slidepdf.com/reader/full/basin-modelling-abstract-book-main-content 32/49
Modelling Sedimentary Basins and their Petroleum Systems
June 2010 Page 32
Petroleum System Calibration under Uncertainty Constraints
M. Dalla Rosa, L. Bazzana, P. Ruffo, G. Scrofani, M. Tonetti, Eni – E&P Div., GEBA Dept. ;Via Emilia 1, 20097 S. Donato Mil.se (MI) ; Italy
The Petroleum System Modelling (PSM) is a complex activity as it synthesises manydifferent expertises and it is aimed to model different geological, physical andgeochemical processes, interconnected by non linear interactions.
Basically, PSM is equivalent to an inversion, from the available data and geologicalknowledge to the spatio-temporal evolution of the geological model. However suchinversion is an ill-posed problem due to the irreversibility of the physical processesinvolved and to the scarcity and the poor quality of the data. A currently viablesolution consists in generating several admissible models, running the PSM simulatorson these models and then selecting the models which are calibrating with availabledata and information. The calibration phases, repeated several times for each step ofthe PSM approach, are therefore the critical ones in finding the optimal solution in a
PSM study.
The proposed methodology describes how calibration is affected by the inputuncertainty, not restricted as usual to some parameters (porosity, permeability, etc.)but extended to the uncertainty of the geological model itself. In fact the combinationof the uncertainty of seismic interpretation and of the seismic velocities leads (throughgeostatistical simulations) to a number of admissible depth basin models, with differentlayers geometries. As such a great number of admissible basin models would bequite time consuming to manage, a selection criterion has been introduced in order toreduce the uncertainty to a narrower set of representative basin model scenarios.
For each basin model scenario a semi-automatic calibration of temperature and
pressure can be performed, allowing the modeller to keep control of the data fitting aswell as of a priori geological information. Using the results of this step and with thehelp of a geostatistical approach, a number of calibrated heat flow maps can beproduced and used as input to temperature modelling. Afterwards the resultingcalibrated temperature scenarios are then used in the modelling of the generation andexpulsion processes and the results may be compared to available data, in order tofilter out unrealistic solutions.
The effect of the geometric uncertainty on hydrocarbon migration is quite strong,affecting not only migration directions but also drainage area definition and spilldirections out of a fully filled reservoir. The calibration of this step against knownreserves and/or dry wells enables to keep control on hydrocarbon migration modellingresults.
A final sensitivity analysis of the “calibration under uncertainty” has been performedevaluating the effects, on the final PSM results, of the uncertainty of the differentparameters including that of the geological model. In conclusion the management ofdifferent sources of uncertainty in the calibration phase results in a betterunderstanding of the petroleum system behaviour and a more robust forecast ofundrilled traps.
Moreover we can discard all the simulated basin models providing unrealistic resultsfrom the viewpoint of the PSM (inconsistency with available data and information), thus
improving at the same time the evaluation of the basin “deterministic” geometry (equalto the average of all the valid simulated ones).

7/26/2019 Basin Modelling Abstract Book Main Content
http://slidepdf.com/reader/full/basin-modelling-abstract-book-main-content 33/49
Modelling Sedimentary Basins and their Petroleum Systems
June 2010 Page 33
The described methodology has been applied on an area of the North Sea where themaximum temperatures have been experienced at present day, so that for thepurposes of this study the thermal calibration and the uncertainty/sensitivity analyseshave been focused only on the last time-step.
In fact, in the North Sea, the lithological succession is experiencing the maximum
temperatures at Present-Day consequently to the fast deposition rate that interests theLate Miocene to Present-Day interval. This is apparently in contrast with the heat flowdevelopment through time that shows a peak during the Middle to Late Cretaceous,related to a rifting phase, and a decrease in magnitude from the Paleocene to Present-Day. Despite of this, due to the contemporaneous deepening of source layers, themaximum temperatures are reached only recently.
7/26/2019 Basin Modelling Abstract Book Main Content
http://slidepdf.com/reader/full/basin-modelling-abstract-book-main-content 34/49
Modelling Sedimentary Basins and their Petroleum Systems
June 2010 Page 34
Exploration-phase 2D Basin Modelling to Highlight Key Risks, Focus TechnicalTasks and Potentially Reduce Time to Drilling: Devil’s Hole Basin, UK North Sea
D. S. Moore1, M. Camm
1, J. R. Allwardt
2
1ConocoPhillips (U.K.) Limited, Aberdeen
2ConocoPhillips Company, Houston
The Pre-Zechstein play, an extension of the Paleozoic Southern North Sea play northof the Mid North Sea High, will test the potential of the Early CarboniferousScremerston Coal in an area traditionally reliant on the Upper Jurassic for source. Tomaximize prospect value, the play work program aims to minimize the time to maturefrom prospect to drill ready status.
Exploration-phase 2D basin modeling was carried out for UK Licence P.1432 both totest the potential of the Scremerston Coal for hydrocarbon generation and expulsion,and to highlight key risks, thus focusing technical evaluation. To build the model, a
recent long offset 2D seismic line was selected that: 1.) goes over the license and adeeper part of the source kitchen, 2.) is near well control and 3.) crosses a mappedlead. Key horizons were depth converted, serving as the framework for enteringgeologic elements into a 2D basin modeling package.
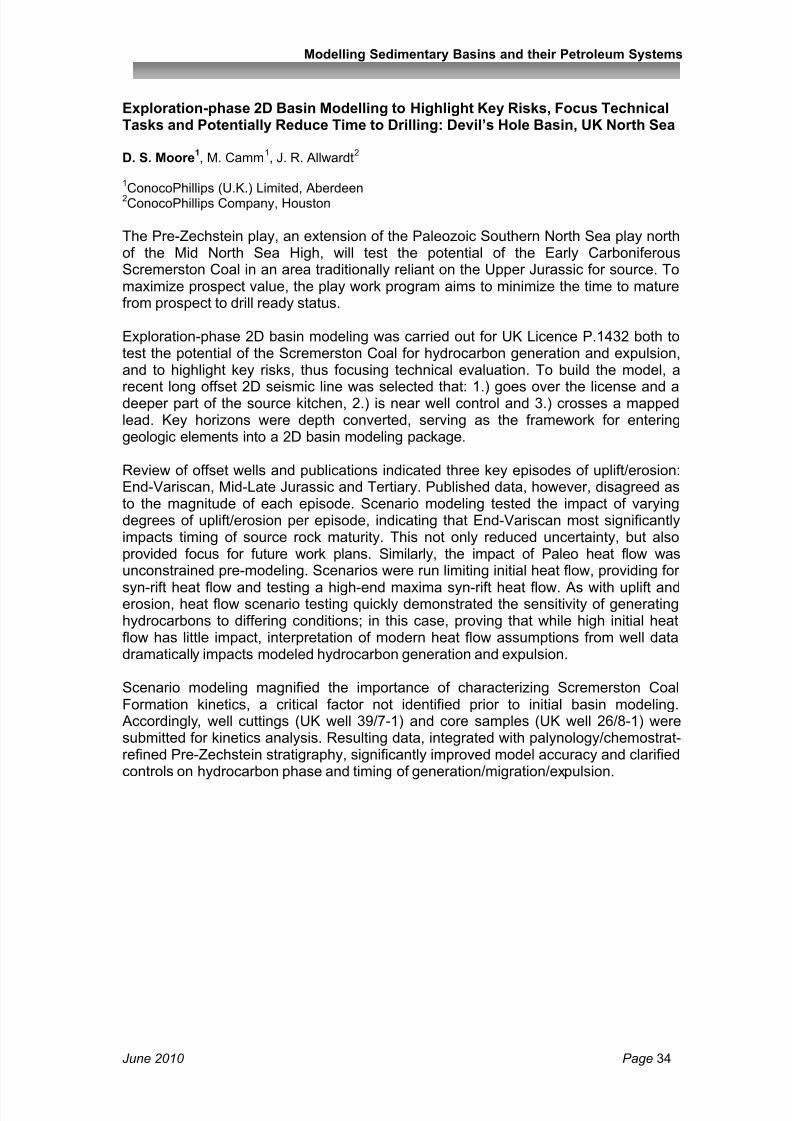
Review of offset wells and publications indicated three key episodes of uplift/erosion:End-Variscan, Mid-Late Jurassic and Tertiary. Published data, however, disagreed asto the magnitude of each episode. Scenario modeling tested the impact of varyingdegrees of uplift/erosion per episode, indicating that End-Variscan most significantlyimpacts timing of source rock maturity. This not only reduced uncertainty, but alsoprovided focus for future work plans. Similarly, the impact of Paleo heat flow wasunconstrained pre-modeling. Scenarios were run limiting initial heat flow, providing for
syn-rift heat flow and testing a high-end maxima syn-rift heat flow. As with uplift anderosion, heat flow scenario testing quickly demonstrated the sensitivity of generatinghydrocarbons to differing conditions; in this case, proving that while high initial heatflow has little impact, interpretation of modern heat flow assumptions from well datadramatically impacts modeled hydrocarbon generation and expulsion.
Scenario modeling magnified the importance of characterizing Scremerston CoalFormation kinetics, a critical factor not identified prior to initial basin modeling. Accordingly, well cuttings (UK well 39/7-1) and core samples (UK well 26/8-1) weresubmitted for kinetics analysis. Resulting data, integrated with palynology/chemostrat-refined Pre-Zechstein stratigraphy, significantly improved model accuracy and clarifiedcontrols on hydrocarbon phase and timing of generation/migration/expulsion.

7/26/2019 Basin Modelling Abstract Book Main Content
http://slidepdf.com/reader/full/basin-modelling-abstract-book-main-content 35/49
Modelling Sedimentary Basins and their Petroleum Systems
June 2010 Page 35
Hydrocarbon Leakage Indicators on the Angola Oceanic Basin, Deep-OffshoreWest African Margin: Seismic Interpretation and Numerical Modelling
Z. Anka1, R. Ondrak
1, A. Kowitz
2, L. Clausen
3 N. Schodt
1GFZ German Research Centre for Geosciences. Section 4.3. Organic Geochemistry. D-14473
Potsdam. - GERMANY -2 Technical University Berlin.
3Maersk Oil. Esplanaden 50. 1263 Copenhagen, Denmark.
We analysed several of hundreds of km of 2D seismic-reflection profiles on the deep-offshore of the Angola basin. A variety of features, identified southwards of the Congosubmarine canyon, such as: bright and flat spots, gas chimneys, buried and seafloorpockmarks, seabed mounds, are evidences of either past or active hydrocarbonaccumulations or leakage. We have mapped and classified these seepage indicatorsbased on whether they are associated to stratigraphic (i.e. paleo-channels,downlapping clastic wedges, onlaps and unconformities) or structural (i.e. growthfaults, salt diapirs, crestal faulting) elements. Their dimensions may vary from somehundreds of meters up to few kms (fig 1). Most of the currently active chimneys, bothstratigraphically and structurally-controlled, are identified on the eastern flank of agraben, while the non-active are located basinwards and buried by the post-Miocenefine-grained sedimentary cover. No evidence of gas sequestration or gas hydratesdeposits as BSR was identified.
Figure 1. Stratigraphically and structurally-controlled seafloor seepage indicators identified onthe slope of the Angola basin
Based on two 70 km-long NE-SW trending profiles across the slope, we developed aconceptual model of the basin that was used to build a 2D basin model We simulatedthe thermal evolution and hydrocarbon generation history and modelled possible
hydrocarbon-migration pathways observed as leakage features on the seismic data(fig. 1). Salt diapirs present in the basin were treated in a schematic approach toconsider the thermal effect of these structures.
Two main post-rift source rocks (SR) were considered: (1) Late Cretaceous oil-pronefrom Iabe Fm.: Type II kerogen, 5% TOC, HI 300 mgHC/gTOC; (2) Early Miocenemixed gas-oil prone from Lower Malembo Fm.: Type III kerogen, 4% TOC, HI: 200-300mgHC/gTOC. Different paleo-heat flow scenarios were tested and an average heatflow of 55 mW/m² allowed a good calibration with the regional trend of temperature andvitrinite reflectance (Ro) borehole data (fig 2).
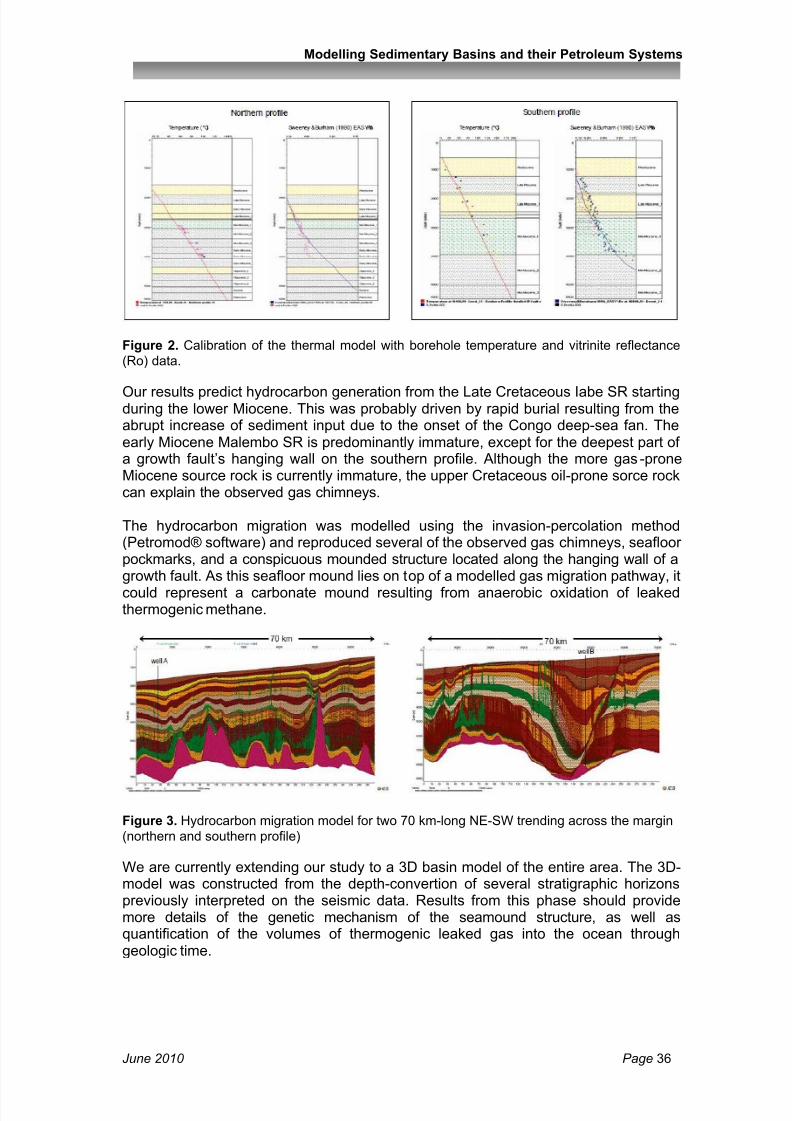
7/26/2019 Basin Modelling Abstract Book Main Content
http://slidepdf.com/reader/full/basin-modelling-abstract-book-main-content 36/49
Modelling Sedimentary Basins and their Petroleum Systems
June 2010 Page 36
Figure 2. Calibration of the thermal model with borehole temperature and vitrinite reflectance
(Ro) data.
Our results predict hydrocarbon generation from the Late Cretaceous Iabe SR startingduring the lower Miocene. This was probably driven by rapid burial resulting from theabrupt increase of sediment input due to the onset of the Congo deep-sea fan. Theearly Miocene Malembo SR is predominantly immature, except for the deepest part ofa growth fault‟s hanging wall on the southern profile. Although the more gas-proneMiocene source rock is currently immature, the upper Cretaceous oil-prone sorce rockcan explain the observed gas chimneys.
The hydrocarbon migration was modelled using the invasion-percolation method(Petromod® software) and reproduced several of the observed gas chimneys, seafloorpockmarks, and a conspicuous mounded structure located along the hanging wall of agrowth fault. As this seafloor mound lies on top of a modelled gas migration pathway, it
could represent a carbonate mound resulting from anaerobic oxidation of leakedthermogenic methane.
Figure 3. Hydrocarbon migration model for two 70 km-long NE-SW trending across the margin
(northern and southern profile)
We are currently extending our study to a 3D basin model of the entire area. The 3D-model was constructed from the depth-convertion of several stratigraphic horizonspreviously interpreted on the seismic data. Results from this phase should providemore details of the genetic mechanism of the seamound structure, as well asquantification of the volumes of thermogenic leaked gas into the ocean throughgeologic time.

7/26/2019 Basin Modelling Abstract Book Main Content
http://slidepdf.com/reader/full/basin-modelling-abstract-book-main-content 37/49
Modelling Sedimentary Basins and their Petroleum Systems
June 2010 Page 37
Poster Abstracts
(In alphabetical order by
presenter surname)

7/26/2019 Basin Modelling Abstract Book Main Content
http://slidepdf.com/reader/full/basin-modelling-abstract-book-main-content 38/49
Modelling Sedimentary Basins and their Petroleum Systems
June 2010 Page 38
Session One

7/26/2019 Basin Modelling Abstract Book Main Content
http://slidepdf.com/reader/full/basin-modelling-abstract-book-main-content 39/49
Modelling Sedimentary Basins and their Petroleum Systems
June 2010 Page 39
Enhancing Seal Quality Prediction by Modelling Spatial PermeabilityDistributions of Meter-Scale Fine-Grained Sediments
M. Drews1, K. D. Kurtev
1, U.Boeker
1, J. Ma
2, A. C. Aplin
1
1Newcastle University
2 Heriot Watt University, Edinburgh
Current best practice for predicting seal quality and flow in fine-grained sedimentsincludes conventional log measurements for lithological interpretation (e.g. Yang et al.,2004) in combination with regional compaction curves and porosity-permeabilitymodels. However, conventional log measurements miss important small-scaleheterogeneities and the spatial component of rock property distributions. For example,the spatial component or texture has a major impact on permeability contrast andanisotropy (Kh/Kv) (e.g. Weber, 1982).Permeability controls migration and leakage rates, and thus seal capacity and quality,once the critical capillary entry pressure of the caprock is exceeded. Permeability
estimates of fine-grained sediments should thus be as accurate as possible.
The aim of this study is to improve present seal quality prediction workflows byimplementing cm-scale sedimentological textures into a new approach to model spatialpermeability distributions (SPDs) of fine-grained sediments (Fig. 1). We will presentresults from our database, which represents an integration of sample measurements,high resolution measurements (core and microresistivity images), log measurements,geometrical attributes, and fluid flow simulation results for different sedimentologicaltextures common in fine-grained sediments.
As a starting point, we define several typical textures present in fine-grained sedimentsvia interpretation of high quality core and microresistivity (FMI) images. These textures
may be the result of different sedimentological processes. An abstraction to purelygeometric features allows for mathematical description of the different textures usinggeostatistical methods (variography). In parallel, log signals, sample measurements,and core and FMI images are related using a combined multivariate and probabilisticapproach. Each step feeds into a database, which is later used as an input forgeostatistical simulation of each texture type and finally for populating these texturemodels with realistic SPDs to perform fluid flow simulation. The whole workflow is aniterative process so that the initial classification model of textures might be updatedaccording to the results of each cycle through the workflow. Current results show astrong dependence of permeability results on sedimentological textures and lithologyof fine-grained sediments, such that predictions based only on homogeneousmudstones may be in error by up to 4 orders of magnitude.
Successfully modelled SPDs of different textures of fine-grained sediments can serveas building blocks for larger scale models and as a direct permeability estimate forwireline facies. Hence, our new approach closes the gap between sample and logscale in current practice upscaling workflows.

7/26/2019 Basin Modelling Abstract Book Main Content
http://slidepdf.com/reader/full/basin-modelling-abstract-book-main-content 40/49
Modelling Sedimentary Basins and their Petroleum Systems
June 2010 Page 40
Fig. 1: Workflow implementing cm-scale textures into spatial permeability distribution (SPD)models of fine-grained sediments.

7/26/2019 Basin Modelling Abstract Book Main Content
http://slidepdf.com/reader/full/basin-modelling-abstract-book-main-content 41/49
Modelling Sedimentary Basins and their Petroleum Systems
June 2010 Page 41
Upscaling Compaction Relationships for Basin Modelling
J. Ma1, G. Couples
1, A. Aplin
2
1Heriot-Watt University
2 Newcastle University
Modelling the evolution of compaction is a key element of basin modelling, which aimsto provide insights into the processes that occurred in a basin. In typical basinmodelling, we are concerned with mechanical compaction of the sediments, i.e. theloss of porosity during burial, caused by the more recently deposited sediments, andits interaction with fluid flow. Compaction is of particular importance in predicting,among others, the pressure distributions in a basin, typically up to a burial depth of5000 meters.
A basin-scale numerical modelling study requires a basin to be discretised into blockswhose sizes may be kilometres laterally and hundreds of meters vertically. Each block
is then assumed to contain homogenous sediments described by the same mechanicaland fluid properties, although the sediments are typically heterogonous to variabledegrees. As a result of such simplification, the effects of intra-block heterogeneity ofthe sediments, such as metre-scale layers of alternating muddy and sandy/siltysediments, are not taken into account.
We report a numerical upscaling technique, which enables us to derive the effectivecompaction relationships for modelled heterogeneous sediments in 1-3 dimensions.Our approach is to discretise the heterogeneous medium into small cells that we canconsider to be homogeneous. Each sediment of cell in the fine model is assumed tofollow a mechanical compaction relationship in the following form:
, where e and σ‟ are void-solid ratio and effective stress,
respectively. eref , the void-solid ratio at reference effective stress σ‟ref , and β are twocoefficients known to vary from one sediment type to another depending on thelithologies.
The calculated effective compaction relationship takes the same form, but the twoupscaled coefficients become the weighted average of the respective pure-materialcoefficients. We prove that this effective compaction relationship ensures the sameamount of compaction to the overall sediments as would occur when individualcompaction relationships are applied over individual cells, respectively.
Numerical analysis shows that the effective stress at fine cells can be replaced by the
mean effective stresses over a larger region, even for cases with abnormal pressures,as long as the local variation is small. This approach can, therefore, be applied todetermine effective compaction relationships for the cases, e.g. well logs, whereeffective stresses can be estimated at discrete locations, and for cases whereeffective stresses are not available and have to be determined as part of basinmodelling. We explore how this approach might be incorporated into existing basinmodelling software, and how it might fit into future software which can capture theeffects of multi-scale heterogeneity in compaction relationships more effectively andaccurately.

7/26/2019 Basin Modelling Abstract Book Main Content
http://slidepdf.com/reader/full/basin-modelling-abstract-book-main-content 42/49
Modelling Sedimentary Basins and their Petroleum Systems
June 2010 Page 42
Full High Resolution Basin Model and Local Grid Refinement – Pros and Cons.
M. Thibaut. B. Carpentier, S. Pegaze-Fiornet, S Wolf, IFP 2-4 av. De Bois Préau Rueil-Malmaison
Local grid refinement is a new available algorithm developed by IFP for its basin model(TemisSuite). It enables us to build a mesh which combines several grid dimensions(or sub-models) into a single, fully coupled, basin model. The mesh is made of largecells in areas where there is a lack of information and small cells (in X, Y and Z) wheremore precise information is available and where fine results are needed. Thisapproach, which optimises the total number of cells, allows detailed simulations onpotential target areas without any compromise on their coupling with the behaviour ofthe whole basin
The approach allows the fitting of the cell sizes to the heterogeneous distribution of theavailable data. Very fine cells are defined where detailed information with numerouswells and/or 3D seismic cubes is available whereas, in other areas of the basin, coarse
cells are present where only scarce information is available. In classical basin model,constructing a numerical basin model which captures the fine information implies theuse of a high resolution grid on the whole basin. This, in turn, leads to very large basinmodels which cannot be run with a compositional description of the fluid, especiallywhen wanting to use a thorough migration approach like the Darcy laws.
To overcome these numerical problems, basin modellers use drastic simplifications ofthe expulsion and migration schemes by using percolation or ray tracing approaches.When necessar y, they use “tartan” grids which can be, in some cases, a satisfyingalternative. However, when several high resolution zones are present in the samebasin, the “tartan” grid does not reduce significantly memory and CPU time.
The work presented in this paper aims to compare the results between full highresolution models (considered as references) and their equivalent LGR models. Basedon synthetic and field case data, the comparison will show the differences found on themain results of basin modelling. Special care will be devoted to the comparison of thetemperature, pressure and hydrocarbon saturation. Comparison on CPU time will alsobe investigated. The conclusions will highlight the pros and cons of both approachesand the interests and drawbacks of the fully coupled Local Grid Refinement algorithmdeveloped at IFP.

7/26/2019 Basin Modelling Abstract Book Main Content
http://slidepdf.com/reader/full/basin-modelling-abstract-book-main-content 43/49
Modelling Sedimentary Basins and their Petroleum Systems
June 2010 Page 43
Session Two

7/26/2019 Basin Modelling Abstract Book Main Content
http://slidepdf.com/reader/full/basin-modelling-abstract-book-main-content 44/49
Modelling Sedimentary Basins and their Petroleum Systems
June 2010 Page 44
Basin Modeling in Foothills: A Coupled Thrustpack-Ceres Study of the Kanau-Kutubu-Mubi-Wage Cross Section (Papua New Guinea Fold And-Thrust Belt)
J-P. Callot1, W. Sassi
1, K. Hill
2, F. Roure
1, S. Wood
2
1IFP Geology, Geochemisry Geophysics, 1-4 avenue de Bois Préau, 92852 Rueil Malmaison
cedex, France2 Oil Search Ltd, Angel Place 123 Pitt Street, Sydney, NSW, Australia 2000.
IntroductionUnlike in passive margins where most deformation relates to vertical subsidence andonly limited erosion occurred, petroleum modelling in fold-and-thrust belts requires agood understanding of past geometries, and to get accurate estimates of erosion. Another critical issue is the evolution through time of the free water level to define thepressure boundary condition. The Papua New Guinea fold and thrust belt offers apromising target to test the basin modelling tools (Hill et al., 2008; Hill and Hall, 2002;figure 1).
Kinematic scenario and calibration A regional balanced and restored cross-section over the fold belt was validatedkinematically using Thrustpack, (Sassi and Rudkiewicz, 1999) and a basin model wasbuilt using Ceres2D (Schneider et al., 2001). It integrates Lower Jurassic rifting,passive margin subsidence, Upper Cretaceous uplift related to the Coral Sea riftingand shortening during the Plio-Pleistocene. The scenario is based on an early growthof the frontal anticline which cuts off lateral migration of oil, and prevents charge of theDarai plateau. Calibration of the section boundary conditions and properties was doneby comparison with data from 7 wells. Apart from the high pressure trend in theKutubu-Moran structures, all data are accounted for with a good to very good fit, andmost of the model appears quantitatively predictive.
Figure 1: Present day section with the lithologies and localisation of the wells.
Pressure modellingThe pressure modelling indicates a strong under pressurization of the reservoirs belowthe topographic highs, with pressure values lower than the hydrostatic trend. Thisreproduces the data if one takes into account the correction for the burial depth of thereservoirs and the shift in the water table depth. This effect can be explained by strongwater flow away from the topographic highs in the pervious Darai carbonates atsurface. The underlying Ieru Shale decouples this flow from the low fluid velocity belowthe Ieru, creating a delay in the pressure equilibrium between the deep escape of thefluids from the highs and the slow recharge from above. The modelling demonstratesthree major pathways for water: (1) topographically driven flow, active from the onsetof mountain building until present day, (2) deep updip basinal flux, flowing along the
flexed reservoirs and starting at the onset of thrusting, and (3) across fault escape fromconnected reservoir bodies during late stage of basement fault inversion.
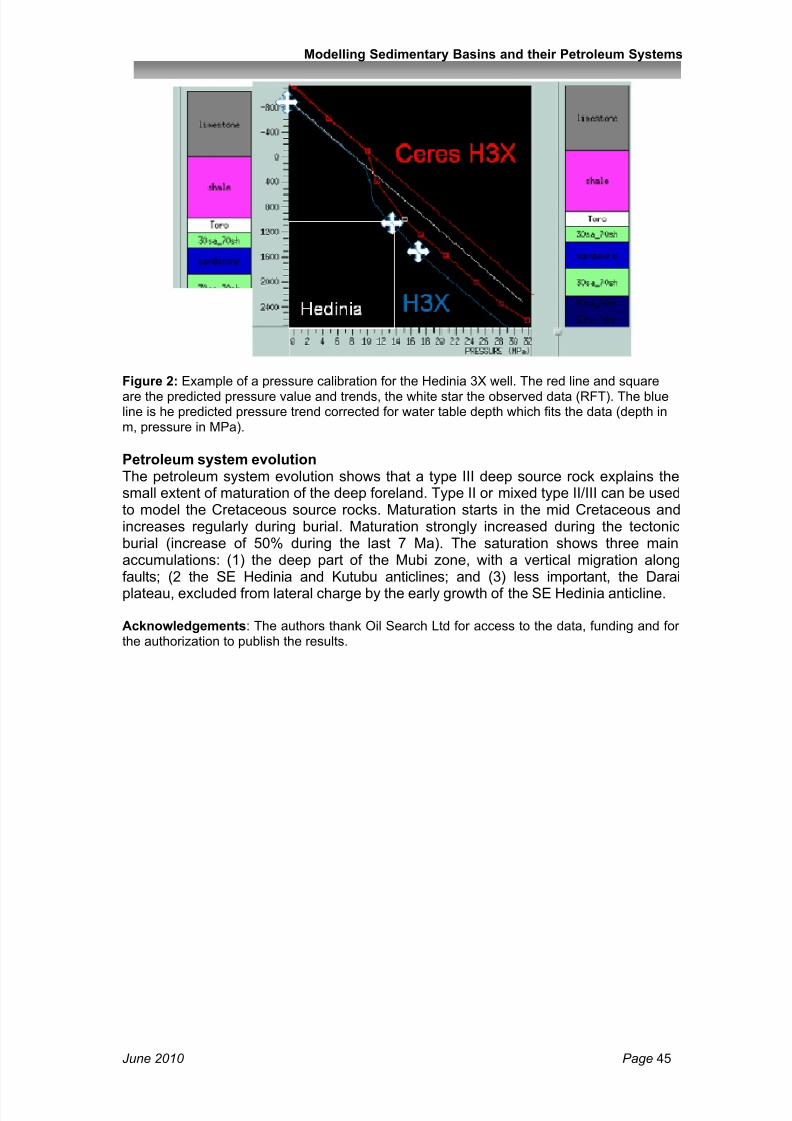
7/26/2019 Basin Modelling Abstract Book Main Content
http://slidepdf.com/reader/full/basin-modelling-abstract-book-main-content 45/49
Modelling Sedimentary Basins and their Petroleum Systems
June 2010 Page 45
Figure 2: Example of a pressure calibration for the Hedinia 3X well. The red line and square
are the predicted pressure value and trends, the white star the observed data (RFT). The blueline is he predicted pressure trend corrected for water table depth which fits the data (depth inm, pressure in MPa).
Petroleum system evolutionThe petroleum system evolution shows that a type III deep source rock explains thesmall extent of maturation of the deep foreland. Type II or mixed type II/III can be usedto model the Cretaceous source rocks. Maturation starts in the mid Cretaceous andincreases regularly during burial. Maturation strongly increased during the tectonicburial (increase of 50% during the last 7 Ma). The saturation shows three mainaccumulations: (1) the deep part of the Mubi zone, with a vertical migration alongfaults; (2 the SE Hedinia and Kutubu anticlines; and (3) less important, the Darai
plateau, excluded from lateral charge by the early growth of the SE Hedinia anticline.
Acknowledgements: The authors thank Oil Search Ltd for access to the data, funding and forthe authorization to publish the results.

7/26/2019 Basin Modelling Abstract Book Main Content
http://slidepdf.com/reader/full/basin-modelling-abstract-book-main-content 46/49
Modelling Sedimentary Basins and their Petroleum Systems
June 2010 Page 46
Seismic Stratigraphy and Numerical Basin Modelling of the Southern BrazilianMargin (Campos, Santos and Pelotas basins)
J. Contreras1, R. Zühlke
1, S. Bowman
2, T. Bechstädt
1
1GeoResources STC at Institute of Geosciences, Heidelberg University, Germany
2 Petrodynamics Inc., 12410 Meadow Lake Drive, Houston, USA
This study provides an integrated approach of sequence stratigraphy, numericalreverse and forward stratigraphic basin modelling. The database includes threeregional seismic reflection profiles, 300-340 km long, located in the Campos (CB),Santos (SB) and Pelotas (PB) basins. In addition, 21 calibration wells providedlithologic and bio-/chronostratigraphic information for the studied Barremian toHolocene basin fill. Main results of sequence stratigraphic and reverse modellinginclude: (i) identification of 12-14 seismic units (3-50 m.y.) in each basin, includingsmaller-scale stacking patterns and seismic geometries; (ii) recognition of six majorsubsidence trends (ST1 to ST6) from Barremian to recent times; (iii) geneticsubsidence model in time (i.e., thermo-tectonic, flexural and compaction induced
components); (iii) integrated basin modelling including accommodation space andbasin infill, showing subsidence/uplift trends as primary and eustatic sea-level changesas secondary controls; (iv) four tectonic basin stages controlling the evolution of thesouthern Brazilian margin: Barremian syn-rift, Aptian syn-rift sag in CB, SB or post-riftin PB, Early-Middle Albian post-rift and Middle Albian-Holocene drift. Lithologies,paleobathymetry, ages and geometry of the seismic units, flexural rigidity of the crust,eustatic sea-level changes (Hardenbol et al., 1998) and subsidence trendsrepresented the input data for statigraphic forward modelling.
After Barremian syn-rift extensional faulting had ceased, depth-dependent lithosphericextension in the CB and SB triggered thermally driven basin sagging (ST1 to ST2).Fault-bounded subsiding depocenters evolved to wide lakes and subsequently to salt
basins during the Late Aptian. In the PB, widespread Barremian syn-rift volcanism wasdirectly followed by post-rift Aptian clastic progradation in open marine environments.During the Late Cretaceous drift stage (ST3), longterm retrogradation in the CB andPB contrast with progradation in the SB. During the Tertiary (ST4-ST6), individualsubsidence/uplift trends are highly variable along the shelf-basin transition. Variationsare closely related to changes in sediment flux and resulting accommodation. Saltdeposition and deformation in the CB and SB controlled their great hydrocarbonpotential. It affected the distribution of source rocks, seals and reservoirs intervals aswell as the development of potential stratigraphic-structural traps and facilitatedthermal maturation of syn-rift source rocks. In the PB, where the salt succession isabsent, the basin development was largely controlled by differential flexuralsubsidence. Potential hydrocarbon traps are mainly stratigraphic and the quality of
syn-rift source intervals is uncertain to date.
Fig. 1. Numerical accommodation spacemodelling red: Campos; blue: Santos; green:Pelotas dashed line: eustatic sea-level(Hardenbol et al., 1998)
Fig. 2. Forward stratigraphic modelling(PB). Facies distribution(65.5 Ma). Lights (sand, silt, limestones);darks (shales)

7/26/2019 Basin Modelling Abstract Book Main Content
http://slidepdf.com/reader/full/basin-modelling-abstract-book-main-content 47/49
Modelling Sedimentary Basins and their Petroleum Systems
June 2010 Page 47
Plate-Scale 3D Mapping in Exploration Workflows
W. Prendergast, C. Holley, J. Etienne, R. Martin, D. Macgregor, Neftex
Here we present examples that utilise a combination of 3D modelling and gross
depositional environment mapping in plate scale and basin scale petroleum systemsanalysis.
A 3-dimensional geological model has been constructed for the entire North Africa toMiddle East region using Roxar IRAP RMS. Input data for this „CUBE‟ model include1300 wells, regional depth maps, >300 structural cross sections and ~300 fieldstructure maps sourced from the public domain. The CUBE has a grid cell resolutionof 1 km x 1 km and covers an area of 7000 km (E-W) x 2500 km (N-S). The CUBE isdivided into 354 regional depth surface grids which correspond to regionally significantNeftex sequence stratigraphic surfaces.
In this 3D environment, we incorporate geothermal gradient, surface temperature,
heatflow and a palaeotemperature correction which takes account of burial histories toevaluate regional maturity trends.

7/26/2019 Basin Modelling Abstract Book Main Content
http://slidepdf.com/reader/full/basin-modelling-abstract-book-main-content 48/49
Modelling Sedimentary Basins and their Petroleum Systems
June 2010 Page 48
Burlington HouseFire Safety Information
If you hear the Alarm
Alarm Bells are situated throughout the building and will ring continuously for anevacuation. Do not stop to collect your personal belongings.Leave the building via the nearest and safest exit or the exit that you are advised to bythe Fire Marshall on that floor.
Fire Exits from the Geological Society Conference Rooms
Lower Library:Exit via Piccadilly entrance or main reception entrance.
Lecture Theatre Exit at front of theatre (by screen) onto Courtyard or via side door out to
Piccadilly entrance or via the doors that link to the Lower Library and to themain reception entrance.Piccadilly Entrance
Straight out door and walk around to the Courtyard or via the mainreception entrance.
Close the doors when leaving a room. DO NOT SWITCH OFF THE LIGHTS.
Assemble in the Courtyard in front of the Royal Academy, outside the Royal Astronomical Society.
Please do not re-enter the building except when you are advised that it is safe to do so
by the Fire Brigade.
First Aid
All accidents should be reported to Reception and First Aid assistance will be providedif necessary.
Facilities
The ladies toilets are situated in the basement at the bottom of the staircase outsidethe Lecture Theatre.
The Gents toilets are situated on the ground floor in the corridor leading to the ArthurHolmes Room.
The cloakroom is located along the corridor to the Arthur Holmes Room.

7/26/2019 Basin Modelling Abstract Book Main Content
http://slidepdf.com/reader/full/basin-modelling-abstract-book-main-content 49/49
Modelling Sedimentary Basins and their Petroleum Systems
STAFF ONLY
Reception