Reporteisdocs.dsdip.qld.gov.au/Bowen Basin Coal Growth Proj 2 - Caval Rid… · Caval Ridge -...
53
Report Caval Ridge Air Quality Assessment - Supplementary Report 30 OCTOBER 2009 Prepared for BMA Level 23 71 Riparian Plaza Brisbane Qld 4000 42626420
Transcript of Reporteisdocs.dsdip.qld.gov.au/Bowen Basin Coal Growth Proj 2 - Caval Rid… · Caval Ridge -...

Report Caval Ridge Air Quality Assessment - Supplementary Report
30 OCTOBER 2009
Prepared for
BMA Level 23 71 Riparian Plaza Brisbane Qld 4000
42626420

Caval Ridge - Supplementary Air Quality Report
j:\jobs\42626420\6 deliv\6001 - draft\appendices\air quality supplementary report\air quality assessment supplementary report_20091111_cmp.doc
Project Manager:
Robert Storrs Associate Environmental Scientist
Project Director:
Chris Pigott Senior Principal
Author:
Darlene Heuff Senior Associate Scientist
URS Australia Pty Ltd
Level 16, 240 Queen Street Brisbane, QLD 4000 GPO Box 302, QLD 4001 Australia T: 61 7 3243 2111 F: 61 7 3243 2199
Reviewer:
p.p. Lisa Russ Senior Associate Environmental Engineer
Date: Reference: Status:
30 October 2009 42626420/1/3 Draft
© Document copyright of URS Australia Pty Limited.
This report is submitted on the basis that it remains commercial-in-confidence. The contents of this report are and remain the intellectual property of URS and are not to be provided or disclosed to third parties without the prior written consent of URS. No use of the contents, concepts, designs, drawings, specifications, plans etc. included in this report is permitted unless and until they are the subject of a written contract between URS Australia and the addressee of this report. URS Australia accepts no liability of any kind for any unauthorised use of the contents of this report and URS reserves the right to seek compensation for any such unauthorised use.
Document delivery
URS Australia provides this document in either printed format, electronic format or both. URS considers the printed version to be binding. The electronic format is provided for the client’s convenience and URS requests that the client ensures the integrity of this electronic information is maintained. Storage of this electronic information should at a minimum comply with the requirements of the Commonwealth Electronic Transactions Act (ETA) 2000.
Where an electronic only version is provided to the client, a signed hard copy of this document is held on file by URS and a copy will be provided if requested.

Caval Ridge - Supplementary Air Quality Report
42626420/1/3 i
Table of Contents
1 Introduction .......................................................................................................1
1.1 Changes to EPP (Air) 2008................................................................................1
1.2 Modifications to Air Quality Assessment Methodology.................................1
1.3 Wind Speed Dependent Wind Erosion.............................................................2 1.3.1 Introduction ......................................................................................................................2 1.3.2 Wind Erosion for Stockpiles...........................................................................................3 1.3.3 Wind Erosion for Exposed Areas...................................................................................4 1.3.4 Wind Speed Dependent Emission Factors....................................................................4
2 Site Emissions Inventory .................................................................................5
2.1 Annual Emissions Scenarios............................................................................5
2.2 Worst-Case 24-Hours Emissions Scenario .....................................................9
3 Interpretation of Air Quality Impacts .............................................................10
3.1 Sensitive Receptors.........................................................................................10
3.2 Annual Emissions Scenario............................................................................11 3.2.1 Particulate Matter as TSP..............................................................................................11 3.2.2 Particulate Matter as PM10.............................................................................................15 3.2.3 Particulate Matter as PM2.5 ............................................................................................21 3.2.4 Dust Deposition .............................................................................................................30
3.3 Worst-Case 24 Hour Emissions Scenario .....................................................32 3.3.1 Worst-Case North Scenario ..........................................................................................32 3.3.2 Worst Case South Scenario..........................................................................................36 3.3.3 Likelihood of Occurrence of Worst Case Impacts .....................................................40
4 Comments and Summary...............................................................................42
4.1 Ambient Air Monitoring Program ...................................................................42
4.2 Cumulative Impacts .........................................................................................43
4.3 Summary...........................................................................................................43
5 References.......................................................................................................45
6 Limitations.......................................................................................................46
Caval Ridge - Supplementary Air Quality Report
42626420/1/3
Tables Table 1-1 Summary of Project Goals for Particulate Matter ............................................................. 1 Table 1-2 Additional Changes to Model Parameters ........................................................................ 2 Table 1-3 Summary of Parameters used to Calculate Wind Erosion Emission Factors................... 4 Table 2-1 Year 1 Annual Emission Rate of TSP and PM10 (kg/year) ............................................... 6 Table 2-2 Year 2 Annual Emission Rate of TSP and PM10 (kg/year) .............................................. 7 Table 2-3 Year 20 Annual Emission Rate of TSP and PM10 (kg/year) ............................................ 8 Table 2-4 Worst-Case 24 hour Emission Rate Scenarios for PM10 (kg/day) .................................... 9 Table 3-1 Predicted Annual Average Ground-Level Concentrations of TSP.................................. 12 Table 3-2 Year 1 and Year 2 Emission Scenarios – Predicted Fifth Highest 24 Hour Average
Ground-Level Concentration of PM10 (µg/m3). EPP(Air) Objective is 50 µg/m3 ............. 16 Table 3-3 Year 20 Emission Scenario – Fifth Highest 24 Hour Average Ground Level
Concentration of PM10 (µg/m3)........................................................................................ 18 Table 3-4 Maximum 24 Hour Average Ground Level Concentration of PM2.5 (µg/m3). .................. 23 Table 3-5 Annual Average Concentration of PM2.5 (µg/m3). ........................................................... 24 Table 3-6 Monthly Annual Average Dust Deposition (g/m2/month) ................................................ 31 Table 3-7 Worst Case North Scenario - Fifth Highest Ground-Level Concentration of PM10 (µg/m3).
........................................................................................................................................ 33 Table 3-8 Worst Case South Scenario - Fifth Highest Ground-Level Concentration of PM10
(µg/m3). ........................................................................................................................... 37
Figures Figure 1-1 Wind Speed Dependent Emission Factor for Stockpiles .................................................. 4 Figure 3-1 Sensitive Receptor Locations ......................................................................................... 11 Figure 3-2 Annual Average Ground-Level Concentration of TSP for Year 1. EPP(Air) objective is 90
µg/m3 (dashed line)......................................................................................................... 13 Figure 3-3 Annual Average Ground-Level Concentration of TSP for Year 2. EPP(Air) objective is 90
µg/m3 (dashed line)......................................................................................................... 14 Figure 3-4 Annual Average Ground-Level Concentration of TSP for Year 20. EPP(Air) objective is
90 µg/m3 (dashed line).................................................................................................... 15 Figure 3-5 Fifth Highest 24-hour Average Ground-Level Concentration of PM10 for Year 1. EPP(Air)
objective is 50 µg/m3 (dashed line). ................................................................................ 19 Figure 3-6 Fifth Highest 24-hour Average Ground-Level Concentration of PM10 for Year 2. EPP(Air)
objective is 50 µg/m3 (dashed line). ................................................................................ 20 Figure 3-7 Fifth Highest 24-hour Average Ground-Level Concentration of PM10 for Year 20.
EPP(Air) objective is 50 µg/m3 (dashed line).................................................................. 21

Caval Ridge - Supplementary Air Quality Report
42626420/1/3 iii
Figure 3-8 Maximum 24-hour Average Ground-Level Concentration of PM2.5 for Year 1. EPP(Air) objective is 25 µg/m3 (dashed line). ................................................................................ 25
Figure 3-9 Maximum 24-hour Average Ground-Level Concentration of PM2.5 for Year 2. EPP(Air) objective is 25 µg/m3 (dashed line). ................................................................................ 26
Figure 3-10 Maximum 24-hour Average Ground-Level Concentration of PM2.5 for Year 20. EPP(Air) objective is 25 µg/m3 (dashed line). ................................................................................ 27
Figure 3-11 Annual Average Ground-Level Concentration of PM2.5 for Year 1. EPP(Air) objective is 8 µg/m3 (dashed line)......................................................................................................... 28
Figure 3-12 Annual Average Ground-Level Concentration of PM2.5 for Year 2. EPP(Air) objective is 8 µg/m3 (dashed line)......................................................................................................... 29
Figure 3-13 Annual Average Ground-Level Concentration of PM2.5 for Year 20. EPP(Air) objective is 8 µg/m3 (dashed line)...................................................................................................... 30
Figure 3-14 Monthly Dust Deposition for Year 20. Project goal is 4 g/m2/month (dashed line)......... 32 Figure 3-15 Worst-Case North Scenario - Fifth Highest 24-hour Average Ground-Level
Concentration of PM10 for Year 1. EPP(Air) objective is 50 µg/m3 (dashed line). .......... 34 Figure 3-16 Worst-Case North Scenario - Fifth Highest 24-hour Average Ground-Level
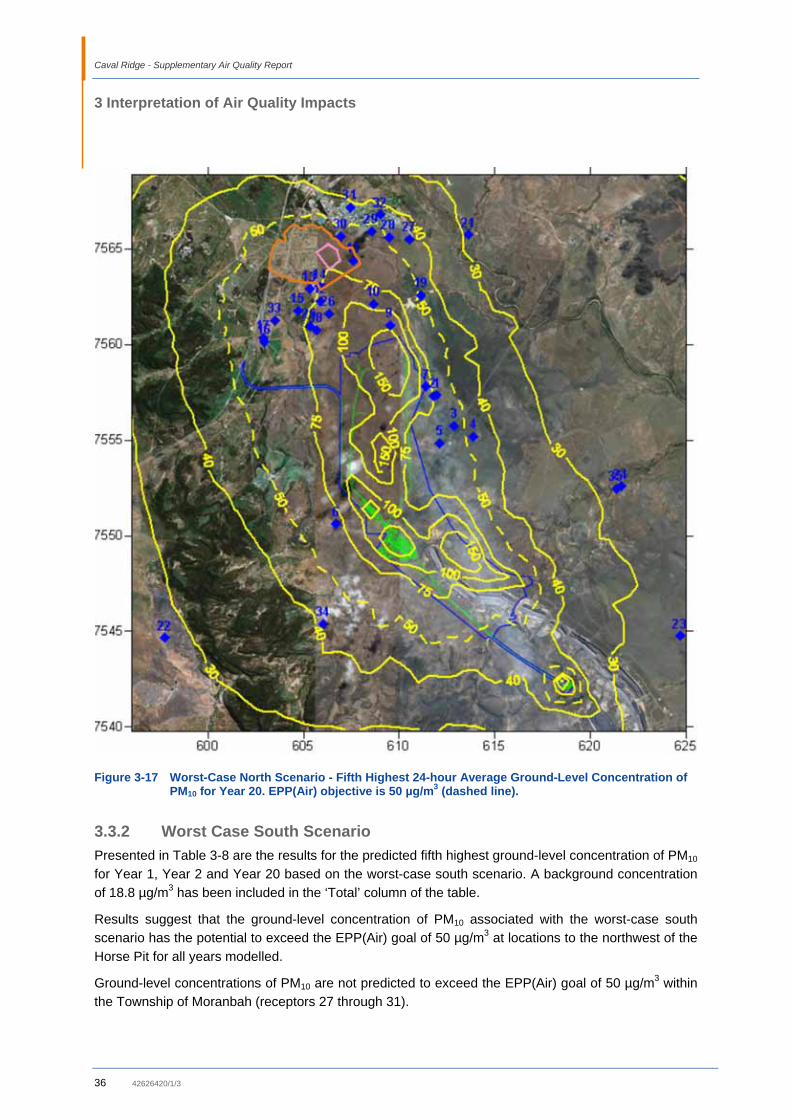
Concentration of PM10 for Year 2. EPP(Air) objective is 50 µg/m3 (dashed line). .......... 35 Figure 3-17 Worst-Case North Scenario - Fifth Highest 24-hour Average Ground-Level
Concentration of PM10 for Year 20. EPP(Air) objective is 50 µg/m3 (dashed line). ........ 36 Figure 3-18 Worst-Case South Scenario - Fifth Highest 24-hour Average Ground-Level
Concentration of PM10 for Year 1. EPP(Air) objective is 50 µg/m3 (dashed line). .......... 38 Figure 3-19 Worst-Case South Scenario - Fifth Highest 24-hour Average Ground-Level
Concentration of PM10 for Year 2. EPP(Air) objective is 50 µg/m3 (dashed line). .......... 39 Figure 3-20 Worst-Case South Scenario - Fifth Highest 24-hour Average Ground-Level
Concentration of PM10 for Year 20. EPP(Air) objective is 50 µg/m3 (dashed line). ........ 40 Figure 3-21 Year 20 Worst-Case North Scenario - Timeseries of Predicted 24-hour Average Ground-
Level Concentration of PM10 at Receptor Location 28. EPP(Air) objective is 50 µg/m3 (dashed line). .................................................................................................................. 41
Figure 4-1 Proposed Ambient Air Monitoring Program Including Dust Deposition, Monitoring of Particulate Matter and Meteorological Parameters ........................................................ 42

Caval Ridge - Supplementary Air Quality Report
42626420/1/3 iv
Abbreviations
Abbreviation Description
@ At CPP Coal Processing Plant DERM Department of Environment and Resource Management EPP(Air) Queensland Environmental Protection (Air) Policy 2008 EIS Environmental Impact Statement kg/ha/year Kilograms per hectare per year kg/ha/hr Kilograms per hectare per hour µg/m3 Micrograms per cubic metre m Metres m/s Metre per second OB Overburden % Percentage PM10 Particulate matter less than 10 microns in diameter PM2.5 Particulate matter less than 2.5 microns in diameter ROM Run of mine T+S Truck and shovel TSP Total suspended particulate VKT Vehicle kilometres travelled

Caval Ridge - Supplementary Air Quality Report
42626420/1/3 1
1
1 Introduction
1.1 Changes to EPP (Air) 2008 The methodology for Caval Ridge EIS Air Quality Assessment (EIS Section 10 and Appendix L) was developed in mid 2008 at which time the Queensland EPP (Air) 1997 was under affect. These guidelines have since been updated, with the new EPP(Air) policy having taken affect on 1 January 2009. In particular, the revised EPP(Air) 2008 air quality objective for the 24-hour average concentration of PM10 of 50 µg/m³ is much stricter than the EPP(Air) 1997 air quality objective of 150 µg/m³.
In summary, relevant differences in the EPP(Air) 1997 and EPP(Air) 2008 include:
• PM10 24 hour: 50 µg/m³ with 5 exceedances allowed per year, previously 150 µg/m³ with no allowable exceedances
• PM10 annual: removed in 2008 guidelines, previously 50 µg/m³ • PM2.5 24 hour: 25 µg/m³, previously not included • PM2.5 annual: 8 µg/m³, previously not included
The adopted air quality goals for the Caval Ridge Project for TSP, PM10, PM2.5 and dust deposition are included in Table 1-1.
Table 1-1 Summary of Project Goals for Particulate Matter
Pollutant Averaging Period Objective or Goal Jurisdiction
Total suspended particulates
Annual 90 µg/m³ EPP(Air)
PM10 24-hour 50 µg/m³ (5 exceedences allowed)
EPP(Air)
24-hour 25 µg/m³ EPP(Air) PM2.5
Annual 8 µg/m³ EPP(Air) Dust deposition Monthly 4 g/m²/month Queensland DERM
1.2 Modifications to Air Quality Assessment Methodology A review of modelling results presented in Caval Ridge EIS Chapter 10 and Appendix L suggested that the methodology applied as part of the Caval Ridge EIS Air Quality Assessment has lead to excessively conservative predictions of air quality impacts of dust from Caval Ridge mine. In order to refine the modelling methodology, consideration was given to the implementation of additional operational commitments from BMA as well as changes to modelling strategies.
Changes to operations to reduce dust that have been incorporated into the revised modelling included:
• Fleet optimisation - reduced fleet and dozers (less vehicle kilometres travelled (VKT)); • Introduction of back hauling to minimise number of trucks running empty (reduced VKTs); • Additional coal ramps in Horse Pit (reduced VKTs); and • Redistributed tailings and rejects placement across Horse and Heyford Pits (reduced VKTs in the
northern part of mine. Initially it was planned to use Horse Pit for rejects disposal.)
Changes to modelling methodology that have been incorporated in order to reduce the level of conservatism within the model include:

Caval Ridge - Supplementary Air Quality Report
1 Introduction
2 42626420/1/3
• Dragline drop height calculated more accurately using mine planning parameters; • More accurate reflection of dozer utilisation; • More accurate representation of coal moisture content with the EIS value of 8% for all coal
replaced with 4% for ROM coal and 9% for product coal • Simulations were conducted for 2008 using wind speed and wind direction data from the Caval
Ridge monitoring site. Year 2007 was modelled in the Caval Ridge EIS air quality assessment (Chapter 10, Appendix L); and
• Constant emission rates associated with stockpiling and exposed area replaced with wind speed dependent emission rates for dust sources outlined in Section 1.3.4.
Presented in Table 1-2 is a summary of the changes to the parameters used in the Caval Ridge EIS air quality assessment (EIS Appendix L) that have been implemented in the Caval Ridge EIS supplementary air quality assessment.
Table 1-2 Additional Changes to Model Parameters
Parameter Units EIS Value EIS Supplement Value
Moisture content of coal % 8.1 -
Moisture content of ROM coal % - 4
Moisture content of product coal % - 9
Dozer utilisation % 100 48.5 (1)
Dragline drop height m 30 15
Emission factor for wind erosion kg/ha/year 0.4 Wind speed dependent (Section 1.3)
Year modelled - 2007 2008(2)
Note: (1) Dozers operate on average for between 4,000 and 4,500 hours per year (person. comm. with BMA). (2) Year 2008 was modelled as site-specific wind speed and wind direction for the 12 month period was available from the Caval Ridge monitoring site
1.3 Wind Speed Dependent Wind Erosion
1.3.1 Introduction In a recent evaluation of fugitive particulate matter emission estimation techniques, SKM (2005) recommended not using the current default emission factors in the NPI Mining Manual (2001), which are a constant value of 0.4 kg/ha/h for TSP and 0.2 kg/ha/hr for PM10, as crucial environmental factors such as wind and surface wetness are not considered. SKM (2005) suggested retaining the current NPI equation, presented here as Equation 1, to account for the climate variations across Australia while recognising the uncertainty and indicative nature of the NPI equation.
)15
)(2356
365(365)5.1
(9.1 fpsE −=
Equation 1
Caval Ridge - Supplementary Air Quality Report
1 Introduction
42626420/1/3 3
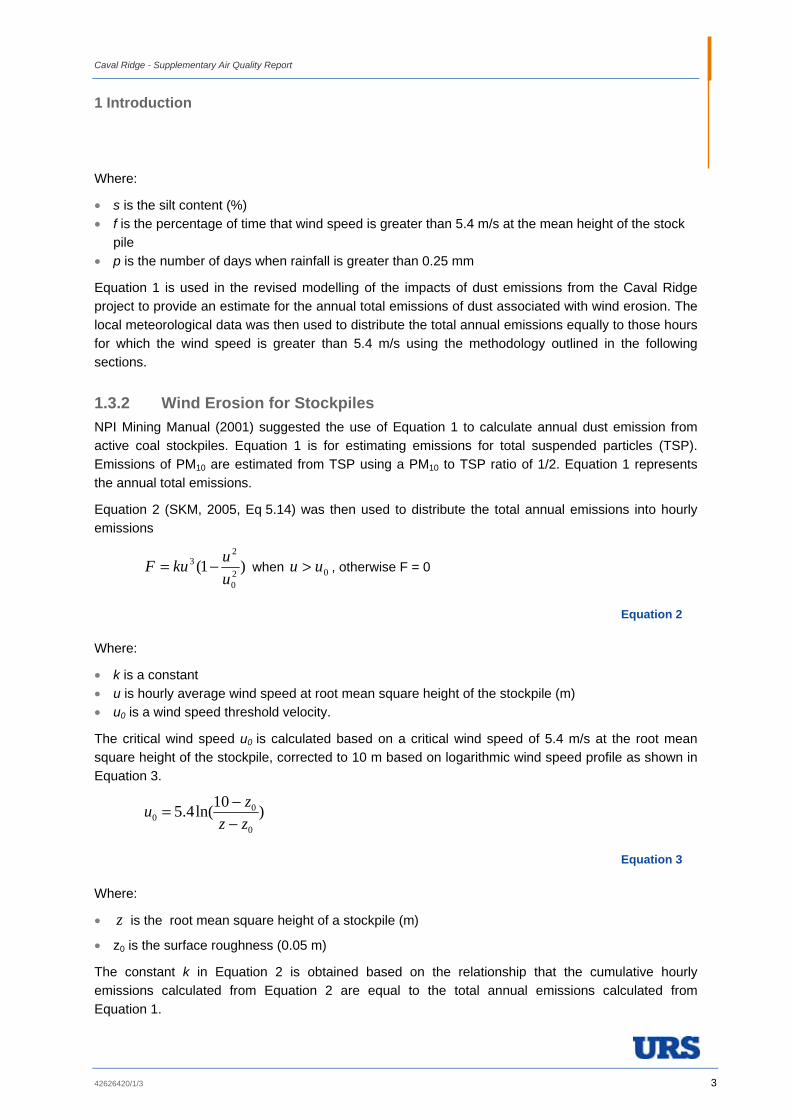
Where:
• s is the silt content (%) • f is the percentage of time that wind speed is greater than 5.4 m/s at the mean height of the stock
pile • p is the number of days when rainfall is greater than 0.25 mm
Equation 1 is used in the revised modelling of the impacts of dust emissions from the Caval Ridge project to provide an estimate for the annual total emissions of dust associated with wind erosion. The local meteorological data was then used to distribute the total annual emissions equally to those hours for which the wind speed is greater than 5.4 m/s using the methodology outlined in the following sections.
1.3.2 Wind Erosion for Stockpiles NPI Mining Manual (2001) suggested the use of Equation 1 to calculate annual dust emission from active coal stockpiles. Equation 1 is for estimating emissions for total suspended particles (TSP). Emissions of PM10 are estimated from TSP using a PM10 to TSP ratio of 1/2. Equation 1 represents the annual total emissions.
Equation 2 (SKM, 2005, Eq 5.14) was then used to distribute the total annual emissions into hourly emissions
)1( 20
23
uukuF −= when 0uu > , otherwise F = 0
Equation 2
Where:
• k is a constant • u is hourly average wind speed at root mean square height of the stockpile (m) • u0 is a wind speed threshold velocity.
The critical wind speed u0 is calculated based on a critical wind speed of 5.4 m/s at the root mean square height of the stockpile, corrected to 10 m based on logarithmic wind speed profile as shown in Equation 3.
)10ln(4.50
00 zz
zu−−=
Equation 3
Where:
• z is the root mean square height of a stockpile (m)
• z0 is the surface roughness (0.05 m)
The constant k in Equation 2 is obtained based on the relationship that the cumulative hourly emissions calculated from Equation 2 are equal to the total annual emissions calculated from Equation 1.
Caval Ridge - Supplementary Air Quality Report
1 Introduction
4 42626420/1/3
1.3.3 Wind Erosion for Exposed Areas The methodology for the development of wind speed dependent dust emissions for exposed areas is identical to that for stockpiles with a critical wind speed of 5.4 m/s at 10 m height used in Equation 2.
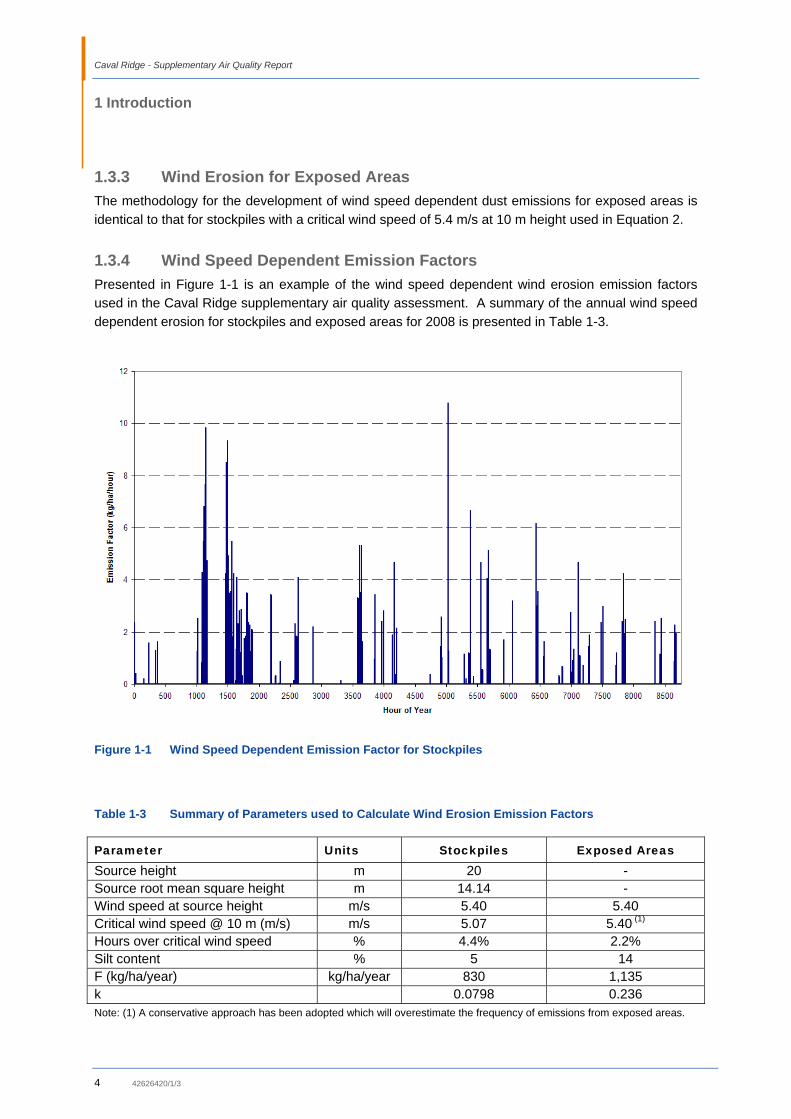
1.3.4 Wind Speed Dependent Emission Factors Presented in Figure 1-1 is an example of the wind speed dependent wind erosion emission factors used in the Caval Ridge supplementary air quality assessment. A summary of the annual wind speed dependent erosion for stockpiles and exposed areas for 2008 is presented in Table 1-3.
Figure 1-1 Wind Speed Dependent Emission Factor for Stockpiles
Table 1-3 Summary of Parameters used to Calculate Wind Erosion Emission Factors
Parameter Units Stockpiles Exposed Areas Source height m 20 - Source root mean square height m 14.14 - Wind speed at source height m/s 5.40 5.40 Critical wind speed @ 10 m (m/s) m/s 5.07 5.40 (1) Hours over critical wind speed % 4.4% 2.2% Silt content % 5 14 F (kg/ha/year) kg/ha/year 830 1,135 k 0.0798 0.236 Note: (1) A conservative approach has been adopted which will overestimate the frequency of emissions from exposed areas.

Caval Ridge - Supplementary Air Quality Report
42626420/1/3 5
2
2 Site Emissions Inventory
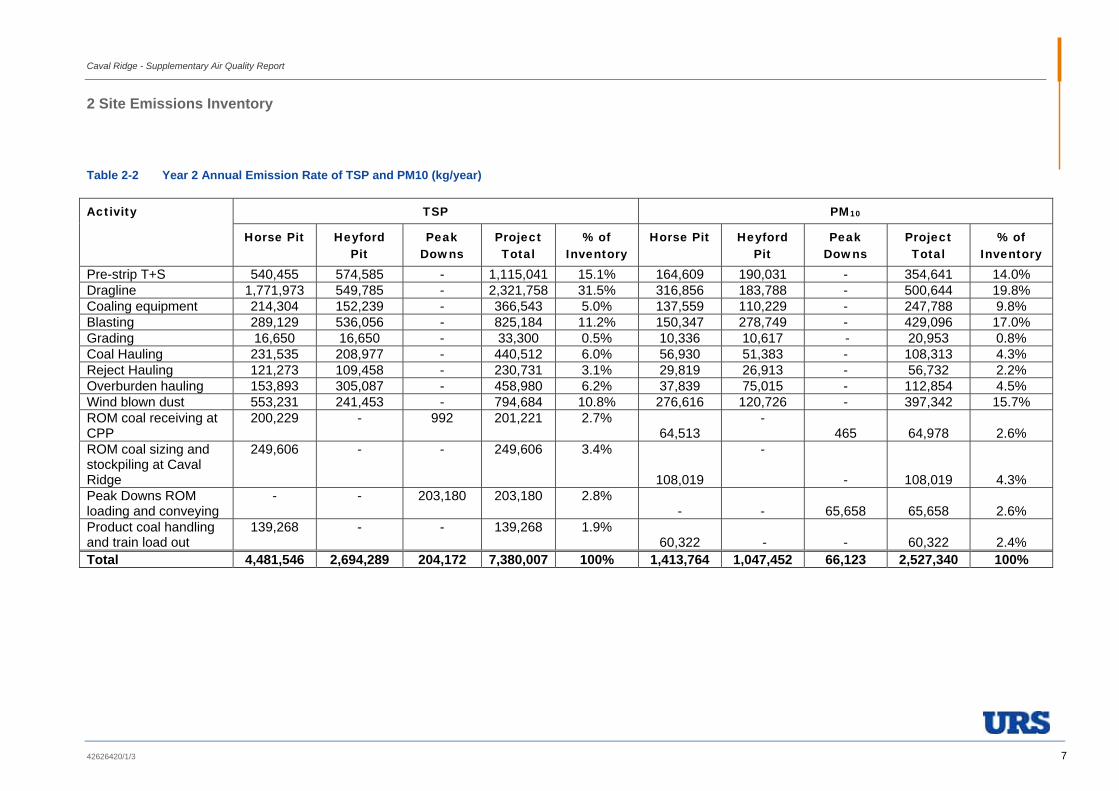
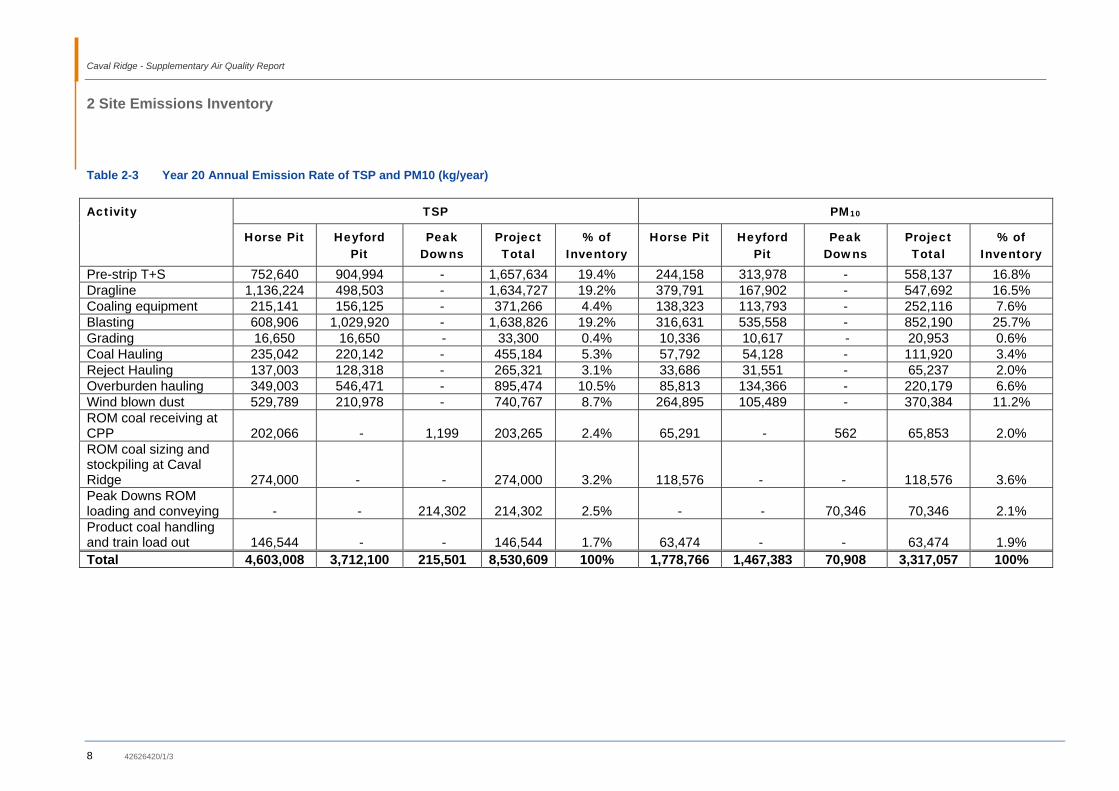
2.1 Annual Emissions Scenarios The updated annual emissions rates of TSP and PM10 for Year 1 are summarised in Table 2-1, for Year 2 in Table 2-2 and for Year 20 in Table 2-3.
Included in the tables are the percentage contributions of dust emissions from various activities to the annual emissions inventory for the project.

Caval Ridge - Supplementary Air Quality Report
2 Site Emissions Inventory
6 42626420/1/3
Table 2-1 Year 1 Annual Emission Rate of TSP and PM10 (kg/year)
TSP PM10 Activity
Horse Pit Heyford Pit
Peak Downs
Project Total
% of Inventory
Horse Pit Heyford Pit
Peak Downs
Project Total
% of Inventory
Pre-strip T+S 1,346,753 544,060 - 1,890,813 26.0% 466,915 191,568 - 658,483 23.5% Dragline 0 498,233 - 498,233 6.8% 0 168,061 - 168,061 6.0% Coaling equipment 197,568 136,909 - 334,477 4.6% 122,271 96,143 - 218,413 7.8% Blasting 773,413 723,396 - 1,496,809 20.6% 402,175 376,166 - 778,341 27.8% Grading 16,650 16,650 - 33,300 0.5% 103,36 10,617 - 20,953 0.7% Coal Hauling 161,416 165,910 - 327,327 4.5% 39,689 40,794 - 80,483 2.9% Reject Hauling 80,894 83,146 - 164,040 2.3% 19,890 20,444 - 40,334 1.4% Overburden hauling 970,400 398,317 - 1,368,717 18.8% 238,602 97,938 - 336,539 12.0% Wind blown dust 328,188 192,224 - 520,412 7.1% 164,094 96,112 - 260,206 9.3% ROM coal receiving at CPP
187,695 - 630 188,324 2.6% 59,205 - 295 59,500 2.1%
ROM coal sizing and stockpiling at Caval Ridge
177,172 - - 177,172 2.4% 76,673 - - 76,673 2.7%
Peak Downs ROM loading and conveying
- - 183,725 183,725 2.5% - - 57,458 57,458 2.1%
Product coal handling and train load out
97,849 - - 97,849 1.3% 42,382 - - 42,382 1.5%
Total 4,337,997 2,758,846 184,355 7,281,198 100% 1,642,232 1,097,842 57,753 2,797,827 100.0%
Caval Ridge - Supplementary Air Quality Report
2 Site Emissions Inventory
42626420/1/3 7
Table 2-2 Year 2 Annual Emission Rate of TSP and PM10 (kg/year)
TSP PM10 Activity
Horse Pit Heyford Pit
Peak Downs
Project Total
% of Inventory
Horse Pit Heyford Pit
Peak Downs
Project Total
% of Inventory
Pre-strip T+S 540,455 574,585 - 1,115,041 15.1% 164,609 190,031 - 354,641 14.0% Dragline 1,771,973 549,785 - 2,321,758 31.5% 316,856 183,788 - 500,644 19.8% Coaling equipment 214,304 152,239 - 366,543 5.0% 137,559 110,229 - 247,788 9.8% Blasting 289,129 536,056 - 825,184 11.2% 150,347 278,749 - 429,096 17.0% Grading 16,650 16,650 - 33,300 0.5% 10,336 10,617 - 20,953 0.8% Coal Hauling 231,535 208,977 - 440,512 6.0% 56,930 51,383 - 108,313 4.3% Reject Hauling 121,273 109,458 - 230,731 3.1% 29,819 26,913 - 56,732 2.2% Overburden hauling 153,893 305,087 - 458,980 6.2% 37,839 75,015 - 112,854 4.5% Wind blown dust 553,231 241,453 - 794,684 10.8% 276,616 120,726 - 397,342 15.7% ROM coal receiving at CPP
200,229 - 992 201,221 2.7% 64,513
- 465 64,978 2.6%
ROM coal sizing and stockpiling at Caval Ridge
249,606 - - 249,606 3.4%
108,019
-
- 108,019 4.3% Peak Downs ROM loading and conveying
- - 203,180 203,180 2.8% - - 65,658 65,658 2.6%
Product coal handling and train load out
139,268 - - 139,268 1.9% 60,322 - - 60,322 2.4%
Total 4,481,546 2,694,289 204,172 7,380,007 100% 1,413,764 1,047,452 66,123 2,527,340 100%
Caval Ridge - Supplementary Air Quality Report
2 Site Emissions Inventory
8 42626420/1/3
Table 2-3 Year 20 Annual Emission Rate of TSP and PM10 (kg/year)
TSP PM10 Activity
Horse Pit Heyford Pit
Peak Downs
Project Total
% of Inventory
Horse Pit Heyford Pit
Peak Downs
Project Total
% of Inventory
Pre-strip T+S 752,640 904,994 - 1,657,634 19.4% 244,158 313,978 - 558,137 16.8% Dragline 1,136,224 498,503 - 1,634,727 19.2% 379,791 167,902 - 547,692 16.5% Coaling equipment 215,141 156,125 - 371,266 4.4% 138,323 113,793 - 252,116 7.6% Blasting 608,906 1,029,920 - 1,638,826 19.2% 316,631 535,558 - 852,190 25.7% Grading 16,650 16,650 - 33,300 0.4% 10,336 10,617 - 20,953 0.6% Coal Hauling 235,042 220,142 - 455,184 5.3% 57,792 54,128 - 111,920 3.4% Reject Hauling 137,003 128,318 - 265,321 3.1% 33,686 31,551 - 65,237 2.0% Overburden hauling 349,003 546,471 - 895,474 10.5% 85,813 134,366 - 220,179 6.6% Wind blown dust 529,789 210,978 - 740,767 8.7% 264,895 105,489 - 370,384 11.2% ROM coal receiving at CPP 202,066 - 1,199 203,265 2.4% 65,291 - 562 65,853 2.0% ROM coal sizing and stockpiling at Caval Ridge 274,000 - - 274,000 3.2% 118,576 - - 118,576 3.6% Peak Downs ROM loading and conveying - - 214,302 214,302 2.5% - - 70,346 70,346 2.1% Product coal handling and train load out 146,544 - - 146,544 1.7% 63,474 - - 63,474 1.9% Total 4,603,008 3,712,100 215,501 8,530,609 100% 1,778,766 1,467,383 70,908 3,317,057 100%

Caval Ridge - Supplementary Air Quality Report
2 Site Emissions Inventory
42626420/1/3 9
2.2 Worst-Case 24-Hours Emissions Scenario The Caval Ridge EIS air quality assessment considered two worst-case scenarios which focused on quantifying the potential impacts of dust emissions associated with specific equipment working at optimal capacity on the 24-hour average ground-level concentration of PM10. One scenario considered the clustering of equipment in the northern section of Horse Pit and Heyford Pit (north scenario). The other scenario considered the clustering of equipment towards the southern ends of the pits (south scenario).
Worst-cast dust emissions scenarios were associated with optimal (full operational capacity) operational performance of draglines, truck and shovel fleets, dozers and/or excavators. It was assumed that these emissions scenarios occurred for all days of the year in order to capture worst-case meteorological conditions.
Presented in Table 2-4 is a summary of the updated annual emissions inventory of PM10 for the worst-case 24 hour emissions scenario outlined in Caval Ridge EIS Appendix L, Table 3-4 of Section 3.4.1.
Table 2-4 Worst-Case 24 hour Emission Rate Scenarios for PM10 (kg/day)
Activity Year 1 Year 2 Year 20 Pre-strip T+S 1,726 1,712 1,733 Dragline 491 1,648 1,590 Coaling equipment 296 302 290 Blasting 2,132 1,176 2,335 Grading 57 57 57 Coal Hauling 221 297 307 Reject Hauling 111 155 179 Overburden hauling 922 309 603 Wind blown dust(1) 713(1) 1,089(1) 1,015(1)
ROM coal receiving at CPP 163 178 180 ROM coal sizing and stockpiling 210 296 325 Peak Downs ROM loading and conveying 157 180 193 Product coal handling and train load out 116 165 174 Total 7,316 7,563 8,981 Note (1): Figure presented is indicative of annual average. Wind blown dust is wind speed dependent and varies on an hourly
basis as discussed in Section 1.3.4

Caval Ridge - Supplementary Air Quality Report
10 42626420/1/3
3
3 Interpretation of Air Quality Impacts
3.1 Sensitive Receptors Presented in Figure 3-1 are the locations of the sensitive receptors for which results of the dispersion modelling will be presented. The two enclosed polygons to the south west of the Moranbah township (Figure 3-1) represent the location of the area zoned as the emerging community area (orange polygon) and proposed expansion of the Moranbah residential area (pink polygon). There is currently no development in the emerging communities area. The emerging community area is nominated under the Planning Scheme for Belyando Shire Part 4 Zones. The Planning Scheme indicates in clause 5 that planning will be undertaken in the emerging communities area in an integrated manner, such that: the potential impacts of any existing or future rural, mining or rail activities are adequately mitigated through the design, orientation, location and buffering of new development.
It is also noted in the Belyando Planning Scheme Policy 3 – Structure planning guidelines (Section2.1.2, Step 2), Identification of constraints that; Land in an Emerging Community Area is generally suitable for development. However some land may have environmental, scenic or other constraints that will influence the location, form and density of development. As a minimum, land with the following constraints must be identified, mapped and considered in the design of the overall development.
BMA will work with the appropriate development authority to ensure that potential air quality impacts from it's mining operations on potential developments are minimised through the design, orientation, location and buffering of new development in the emerging community area.

Caval Ridge - Supplementary Air Quality Report
3 Interpretation of Air Quality Impacts
42626420/1/3 11
Figure 3-1 Sensitive Receptor Locations
3.2 Annual Emissions Scenario
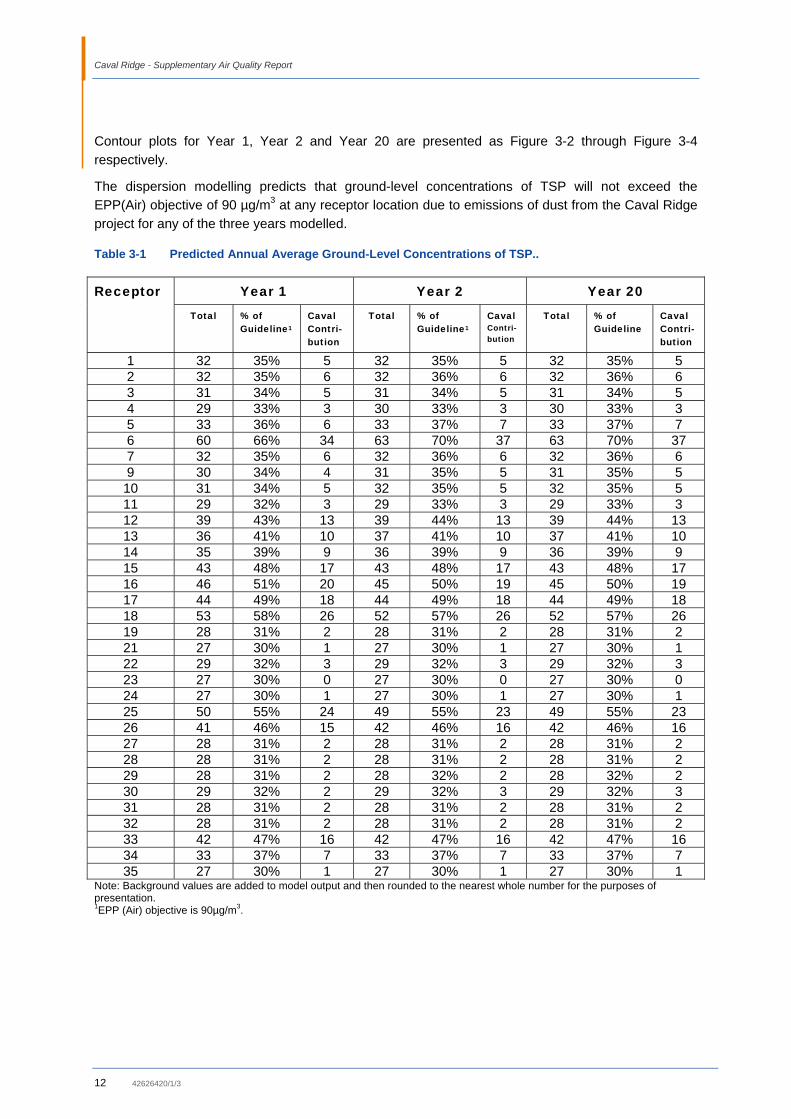
3.2.1 Particulate Matter as TSP Presented in Table 3-1 is a summary of the results of the dispersion modelling for the predicted annual average ground-level concentration of TSP at sensitive receptor locations. Included in the table is the incremental contribution to the annual average ground-level concentrations of TSP from the Caval Ridge project. A background level of 26.2 µg/m3 has been included in the ground-level concentration denoted in the ‘Total’ column of the table.
Caval Ridge - Supplementary Air Quality Report
12 42626420/1/3
Contour plots for Year 1, Year 2 and Year 20 are presented as Figure 3-2 through Figure 3-4 respectively.
The dispersion modelling predicts that ground-level concentrations of TSP will not exceed the EPP(Air) objective of 90 µg/m3 at any receptor location due to emissions of dust from the Caval Ridge project for any of the three years modelled.
Table 3-1 Predicted Annual Average Ground-Level Concentrations of TSP..
Year 1 Year 2 Year 20 Receptor Total % of
Guideline1 Caval Contri-bution
Total % of Guideline1
Caval Contri-bution
Total % of Guideline
Caval Contri-bution
1 32 35% 5 32 35% 5 32 35% 5 2 32 35% 6 32 36% 6 32 36% 6 3 31 34% 5 31 34% 5 31 34% 5 4 29 33% 3 30 33% 3 30 33% 3 5 33 36% 6 33 37% 7 33 37% 7 6 60 66% 34 63 70% 37 63 70% 37 7 32 35% 6 32 36% 6 32 36% 6 9 30 34% 4 31 35% 5 31 35% 5 10 31 34% 5 32 35% 5 32 35% 5 11 29 32% 3 29 33% 3 29 33% 3 12 39 43% 13 39 44% 13 39 44% 13 13 36 41% 10 37 41% 10 37 41% 10 14 35 39% 9 36 39% 9 36 39% 9 15 43 48% 17 43 48% 17 43 48% 17 16 46 51% 20 45 50% 19 45 50% 19 17 44 49% 18 44 49% 18 44 49% 18 18 53 58% 26 52 57% 26 52 57% 26 19 28 31% 2 28 31% 2 28 31% 2 21 27 30% 1 27 30% 1 27 30% 1 22 29 32% 3 29 32% 3 29 32% 3 23 27 30% 0 27 30% 0 27 30% 0 24 27 30% 1 27 30% 1 27 30% 1 25 50 55% 24 49 55% 23 49 55% 23 26 41 46% 15 42 46% 16 42 46% 16 27 28 31% 2 28 31% 2 28 31% 2 28 28 31% 2 28 31% 2 28 31% 2 29 28 31% 2 28 32% 2 28 32% 2 30 29 32% 2 29 32% 3 29 32% 3 31 28 31% 2 28 31% 2 28 31% 2 32 28 31% 2 28 31% 2 28 31% 2 33 42 47% 16 42 47% 16 42 47% 16 34 33 37% 7 33 37% 7 33 37% 7 35 27 30% 1 27 30% 1 27 30% 1
Note: Background values are added to model output and then rounded to the nearest whole number for the purposes of presentation. 1EPP (Air) objective is 90µg/m3.

Caval Ridge - Supplementary Air Quality Report
3 Interpretation of Air Quality Impacts
42626420/1/3 13
Figure 3-2 Annual Average Ground-Level Concentration of TSP for Year 1. EPP(Air) objective is 90 µg/m3 (dashed line).

Caval Ridge - Supplementary Air Quality Report
14 42626420/1/3
Figure 3-3 Annual Average Ground-Level Concentration of TSP for Year 2. EPP(Air) objective is 90 µg/m3 (dashed line).

Caval Ridge - Supplementary Air Quality Report
3 Interpretation of Air Quality Impacts
42626420/1/3 15
Figure 3-4 Annual Average Ground-Level Concentration of TSP for Year 20. EPP(Air) objective is 90 µg/m3 (dashed line).
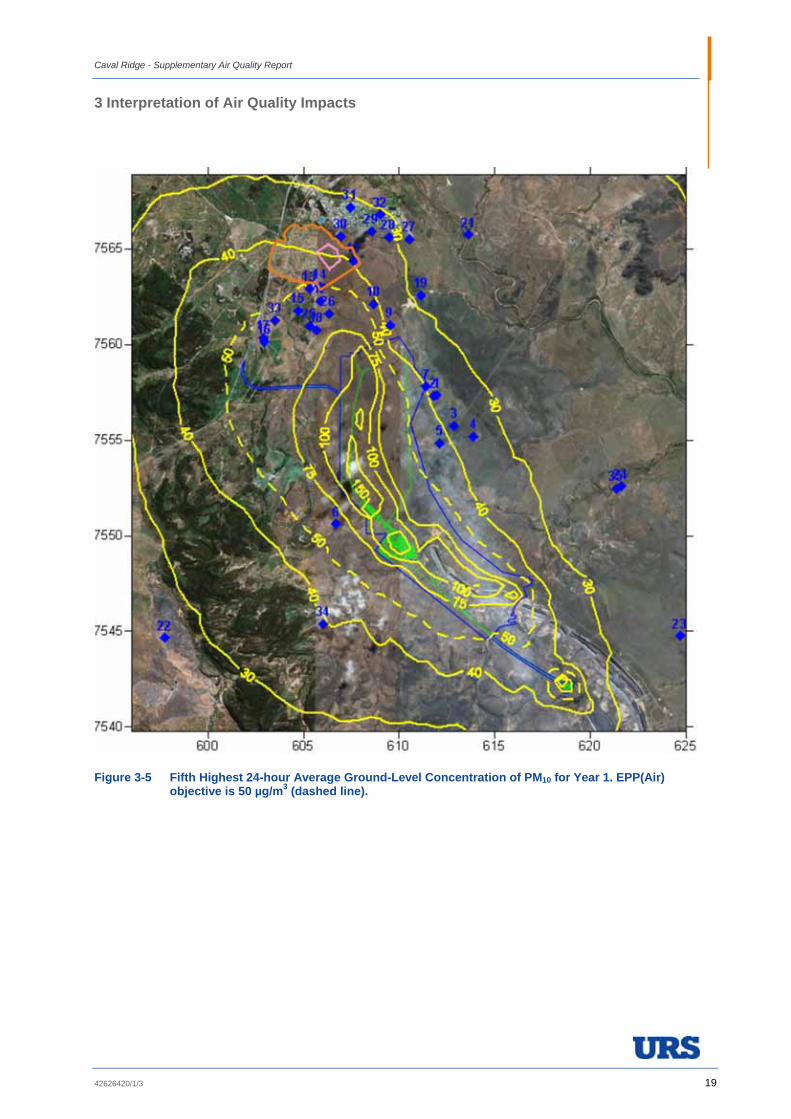
3.2.2 Particulate Matter as PM10 Presented in Table 3-2 are the results of the dispersion modelling for project Year 1 and Year 2 for the fifth highest ground-level concentration of PM10 at receptor locations. Locations which are predicted to exceed that EPP(Air) objective of 50 µg/m3 are highlighted in bold. Included in the table is the predicted incremental contribution of emissions of dust from the project at each of the sensitive receptor locations. As discussed in the EIS, the existing background concentration of PM10 is 18.8 µg/m3 . This has been included in the ground-level concentration denoted in the ‘Total’ column of the table.
Results suggest that the incremental contribution of emissions at sensitive receptor locations (in isolation from background conditions) will generally be greater during Year 1 site activities compared

Caval Ridge - Supplementary Air Quality Report
16 42626420/1/3
with Year 2. The residences located to the northwest of the site are predicted to be most affected. Year 1 activities in the northern area of the project site are associated with the construction of Horse Pit.
During Year 2 operations, all mining-related activities (such as draglines, truck and shovel, coaling) will be located near the surface of Horse Pit and will not benefit from the dust reduction potential associated with activities that are located within an established pit.
During Year 1 and Year 2, the incremental contribution of PM10 from project activities is predicted to be a maximum of 15 µg/m3 to the ground-level concentrations within Moranbah (receptor locations 27 through 31).
Table 3-2 Year 1 and Year 2 Emission Scenarios – Predicted Fifth Highest 24 Hour Average Ground-Level Concentration of PM10 (µg/m3). EPP(Air) Objective is 50 µg/m3
Year 1 Year 2 Receptor
Total % of Guideline1
Caval Contribution
Total % of Guideline1
Caval Contribution
1 42 85% 24 41 81% 22 2 43 86% 24 41 83% 23 3 37 74% 18 37 74% 18 4 33 67% 15 33 66% 14 5 40 79% 21 40 80% 21 6 66 132% 47 69 137% 50 7 43 85% 24 41 82% 22 9 37 74% 18 38 76% 19
10 46 92% 27 44 88% 25 11 35 71% 16 35 70% 16 12 61 121% 42 54 108% 35 13 56 112% 37 51 101% 32 14 55 110% 36 49 98% 30 15 62 124% 43 54 107% 35 16 56 112% 37 51 103% 33 17 54 107% 35 49 99% 30 18 73 146% 54 61 122% 42 19 28 56% 9 28 57% 10 21 24 48% 5 24 49% 5 22 28 56% 9 28 56% 9 23 23 46% 4 23 46% 4 24 24 47% 5 23 47% 4 25 70 140% 51 59 117% 40 26 64 128% 45 56 112% 37 27 32 63% 13 31 62% 12 28 33 65% 14 32 63% 13 29 34 67% 15 31 62% 12 30 33 66% 14 31 63% 13 31 32 65% 13 31 62% 12 32 31 62% 12 30 60% 11 33 51 102% 32 46 92% 27 34 39 79% 21 38 77% 20 35 24 48% 5 24 47% 5
Note: Background values are added to model output and then rounded to the nearest whole number for the purposes of presentation. 1EPP (Air) objective is 50 µg/m3
Caval Ridge - Supplementary Air Quality Report
3 Interpretation of Air Quality Impacts
42626420/1/3 17
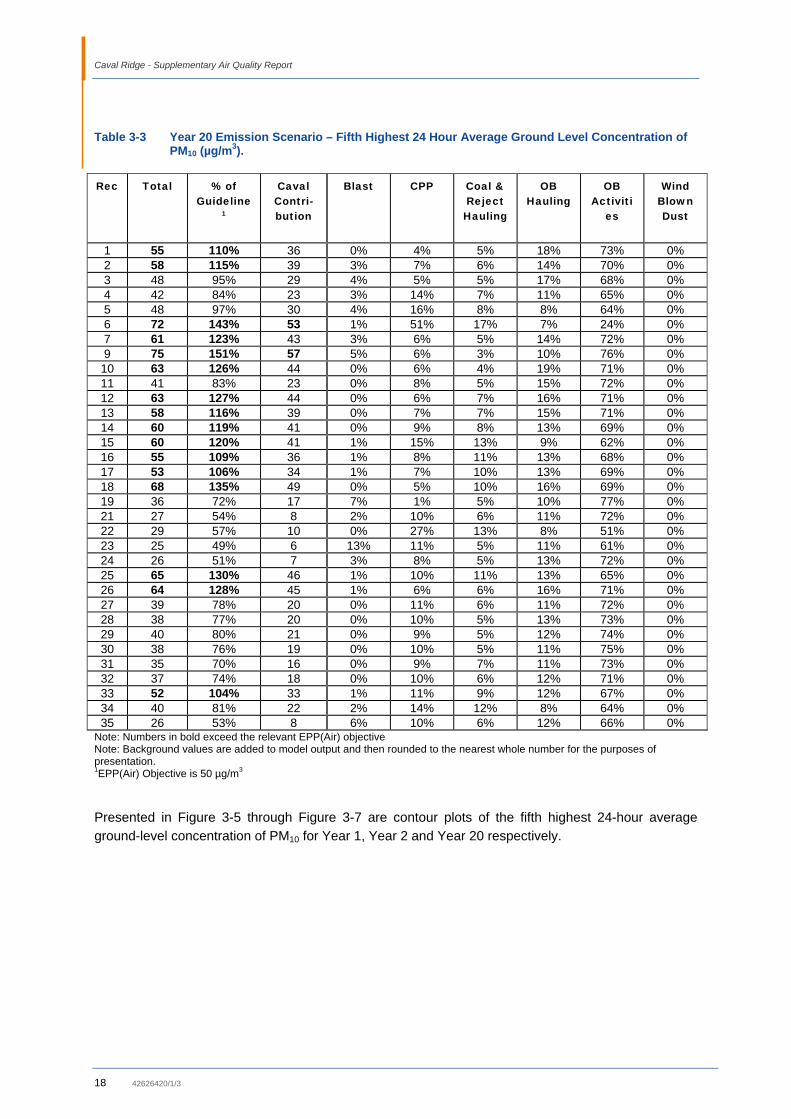
Presented in Table 3-3 are results of the dispersion modelling during Year 20. A background level of 18.8 µg/m3 has been included in the ground-level concentration denoted in the ‘Total’ column of the table.
Dust generating activities during Year 20 are predicted to contribute a maximum of 21 µg/m3 to 24 hour ground-level concentrations of PM10 within the township of Moranbah (receptor locations 27 through 31).
Also included in the table is the percentage contribution of the various mining activities on predicted ground-level concentrations of PM10 at the receptor locations. Overburden-related dust generating activities which include draglines, overburden and rejects truck dumping, drilling and dozer activities are predicted to contribute to the majority of the predicted ground-level concentration of dust.
Caval Ridge - Supplementary Air Quality Report
18 42626420/1/3
Table 3-3 Year 20 Emission Scenario – Fifth Highest 24 Hour Average Ground Level Concentration of PM10 (µg/m3).
Rec Total % of Guideline
1
Caval Contri-bution
Blast CPP Coal & Reject Hauling
OB Hauling
OB Activiti
es
Wind Blown Dust
1 55 110% 36 0% 4% 5% 18% 73% 0% 2 58 115% 39 3% 7% 6% 14% 70% 0% 3 48 95% 29 4% 5% 5% 17% 68% 0% 4 42 84% 23 3% 14% 7% 11% 65% 0% 5 48 97% 30 4% 16% 8% 8% 64% 0% 6 72 143% 53 1% 51% 17% 7% 24% 0% 7 61 123% 43 3% 6% 5% 14% 72% 0% 9 75 151% 57 5% 6% 3% 10% 76% 0% 10 63 126% 44 0% 6% 4% 19% 71% 0% 11 41 83% 23 0% 8% 5% 15% 72% 0% 12 63 127% 44 0% 6% 7% 16% 71% 0% 13 58 116% 39 0% 7% 7% 15% 71% 0% 14 60 119% 41 0% 9% 8% 13% 69% 0% 15 60 120% 41 1% 15% 13% 9% 62% 0% 16 55 109% 36 1% 8% 11% 13% 68% 0% 17 53 106% 34 1% 7% 10% 13% 69% 0% 18 68 135% 49 0% 5% 10% 16% 69% 0% 19 36 72% 17 7% 1% 5% 10% 77% 0% 21 27 54% 8 2% 10% 6% 11% 72% 0% 22 29 57% 10 0% 27% 13% 8% 51% 0% 23 25 49% 6 13% 11% 5% 11% 61% 0% 24 26 51% 7 3% 8% 5% 13% 72% 0% 25 65 130% 46 1% 10% 11% 13% 65% 0% 26 64 128% 45 1% 6% 6% 16% 71% 0% 27 39 78% 20 0% 11% 6% 11% 72% 0% 28 38 77% 20 0% 10% 5% 13% 73% 0% 29 40 80% 21 0% 9% 5% 12% 74% 0% 30 38 76% 19 0% 10% 5% 11% 75% 0% 31 35 70% 16 0% 9% 7% 11% 73% 0% 32 37 74% 18 0% 10% 6% 12% 71% 0% 33 52 104% 33 1% 11% 9% 12% 67% 0% 34 40 81% 22 2% 14% 12% 8% 64% 0% 35 26 53% 8 6% 10% 6% 12% 66% 0%
Note: Numbers in bold exceed the relevant EPP(Air) objective Note: Background values are added to model output and then rounded to the nearest whole number for the purposes of presentation. 1EPP(Air) Objective is 50 µg/m3
Presented in Figure 3-5 through Figure 3-7 are contour plots of the fifth highest 24-hour average ground-level concentration of PM10 for Year 1, Year 2 and Year 20 respectively.
Caval Ridge - Supplementary Air Quality Report
3 Interpretation of Air Quality Impacts
42626420/1/3 19
Figure 3-5 Fifth Highest 24-hour Average Ground-Level Concentration of PM10 for Year 1. EPP(Air) objective is 50 µg/m3 (dashed line).

Caval Ridge - Supplementary Air Quality Report
20 42626420/1/3
Figure 3-6 Fifth Highest 24-hour Average Ground-Level Concentration of PM10 for Year 2. EPP(Air) objective is 50 µg/m3 (dashed line).

Caval Ridge - Supplementary Air Quality Report
3 Interpretation of Air Quality Impacts
42626420/1/3 21
Figure 3-7 Fifth Highest 24-hour Average Ground-Level Concentration of PM10 for Year 20. EPP(Air) objective is 50 µg/m3 (dashed line).
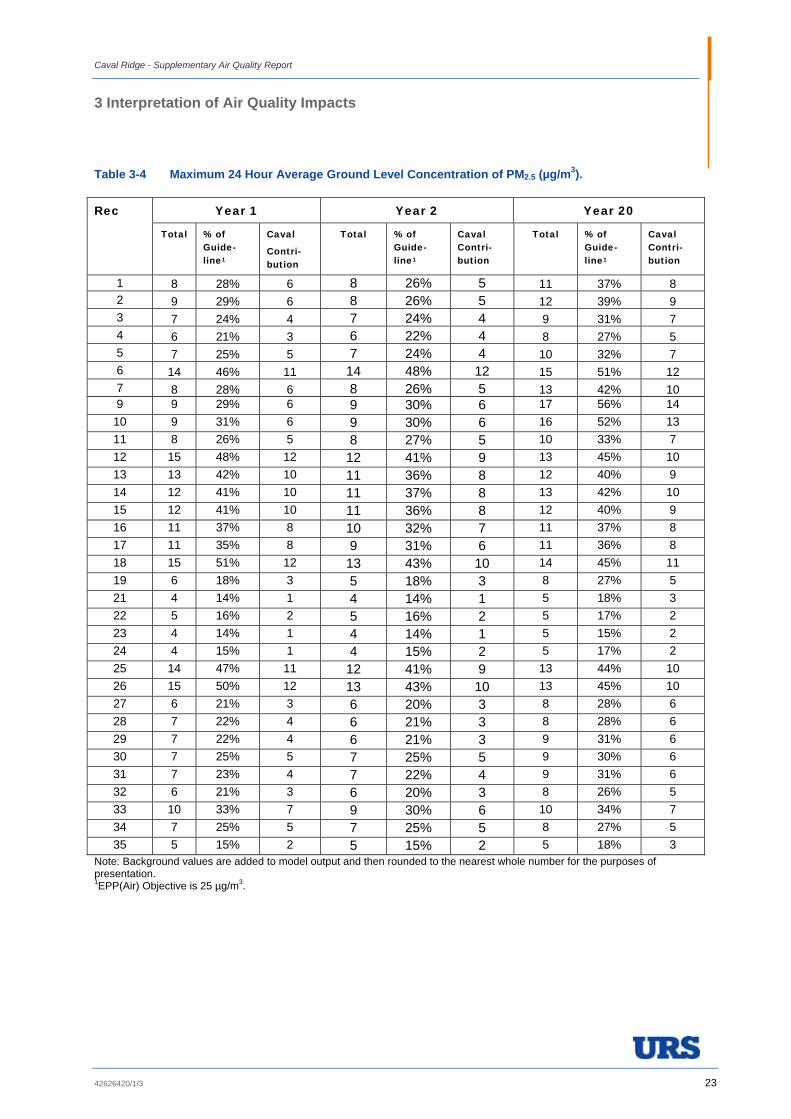
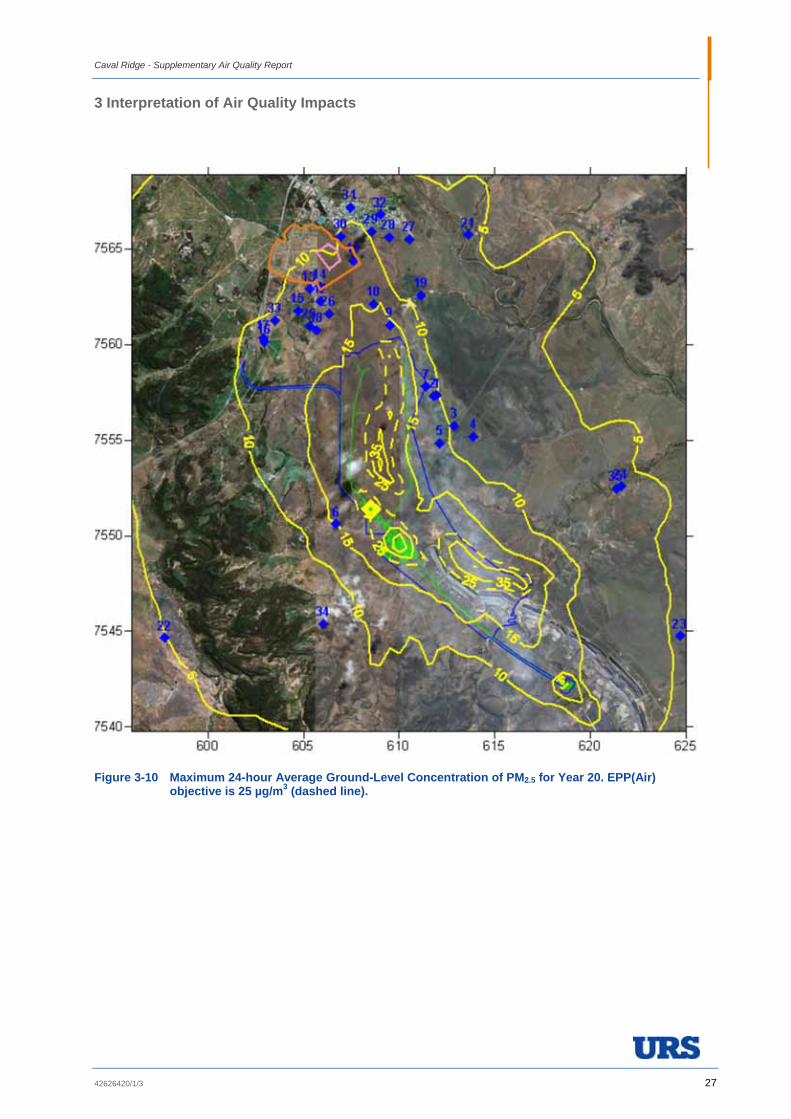
3.2.3 Particulate Matter as PM2.5 Presented in Table 3-4 is the maximum 24-hour average ground-level concentration of PM2.5 at the receptor locations. Results suggest that the EPP(Air) objective of 25 µg/m3 will not be exceeded at any of the receptor locations for the three years modelled. The maximum predicted contribution to ground-level concentration of PM2.5 due to the Caval Ridge project is 14 µg/m3 at receptor location 9 during Year 20. The maximum predicted project contribution to the ground-level concentration of PM2.5 within Moranbah (receptor locations 27 through 31) is 6 µg/m3 during Year 20. As discussed in the EIS, the existing background concentration of PM2.5 is 2.9 µg/m3. This has been included in the ground-level concentration denoted in the ‘Total’ column of the table.

Caval Ridge - Supplementary Air Quality Report
22 42626420/1/3
Presented in Table 3-5 is the annual average ground-level concentration of PM2.5 at each of the receptor locations. Results suggest that the EPP(Air) objective of 8 µg/m3 will not be exceeded at any of the receptor locations for the three years modelled. A background level of 1.6 µg/m3 has been included in the ground-level concentration denoted in the ‘Total’ column of the table.
Presented in Figure 3-8 through Figure 3-10 are contour plots of the maximum 24-hour average ground-level concentration of PM2.5 for Year 1, Year 2 and Year 20 respectively.
Presented in Figure 3-11 through Figure 3-13 are contour plots of the annual average ground-level concentration of PM2.5 for Year 1, Year 2 and Year 20 respectively.
Caval Ridge - Supplementary Air Quality Report
3 Interpretation of Air Quality Impacts
42626420/1/3 23
Table 3-4 Maximum 24 Hour Average Ground Level Concentration of PM2.5 (µg/m3).
Year 1 Year 2 Year 20 Rec
Total % of Guide-line1
Caval
Contri-bution
Total % of Guide-line1
Caval Contri-bution
Total % of Guide-line1
Caval Contri-bution
1 8 28% 6 8 26% 5 11 37% 8 2 9 29% 6 8 26% 5 12 39% 9 3 7 24% 4 7 24% 4 9 31% 7 4 6 21% 3 6 22% 4 8 27% 5 5 7 25% 5 7 24% 4 10 32% 7 6 14 46% 11 14 48% 12 15 51% 12 7 8 28% 6 8 26% 5 13 42% 10 9 9 29% 6 9 30% 6 17 56% 14
10 9 31% 6 9 30% 6 16 52% 13 11 8 26% 5 8 27% 5 10 33% 7 12 15 48% 12 12 41% 9 13 45% 10 13 13 42% 10 11 36% 8 12 40% 9 14 12 41% 10 11 37% 8 13 42% 10 15 12 41% 10 11 36% 8 12 40% 9 16 11 37% 8 10 32% 7 11 37% 8 17 11 35% 8 9 31% 6 11 36% 8 18 15 51% 12 13 43% 10 14 45% 11 19 6 18% 3 5 18% 3 8 27% 5 21 4 14% 1 4 14% 1 5 18% 3 22 5 16% 2 5 16% 2 5 17% 2 23 4 14% 1 4 14% 1 5 15% 2 24 4 15% 1 4 15% 2 5 17% 2 25 14 47% 11 12 41% 9 13 44% 10 26 15 50% 12 13 43% 10 13 45% 10 27 6 21% 3 6 20% 3 8 28% 6 28 7 22% 4 6 21% 3 8 28% 6 29 7 22% 4 6 21% 3 9 31% 6 30 7 25% 5 7 25% 5 9 30% 6 31 7 23% 4 7 22% 4 9 31% 6 32 6 21% 3 6 20% 3 8 26% 5 33 10 33% 7 9 30% 6 10 34% 7 34 7 25% 5 7 25% 5 8 27% 5 35 5 15% 2 5 15% 2 5 18% 3
Note: Background values are added to model output and then rounded to the nearest whole number for the purposes of presentation. 1EPP(Air) Objective is 25 µg/m3.

Caval Ridge - Supplementary Air Quality Report
24 42626420/1/3
Table 3-5 Annual Average Concentration of PM2.5 (µg/m3).
Year 1 Year 2 Year 20 Rec
Total % of Guide-line1
Caval Total % of Guide-line1
Caval Total % of Guide-line1
Caval
1 2 28% 1 2 28% 1 3 35% 1 2 2 29% 1 2 28% 1 3 36% 1 3 2 27% 1 2 27% 1 3 33% 1 4 2 25% 0 2 25% 0 2 29% 1 5 2 30% 1 2 29% 1 3 38% 1 6 5 66% 4 5 68% 4 6 69% 4 7 2 29% 1 2 28% 1 3 37% 1 9 2 26% 0 2 26% 0 3 35% 1 10 2 27% 1 2 27% 1 3 35% 1 11 2 25% 0 2 24% 0 2 28% 1 12 3 39% 2 3 36% 1 4 47% 2 13 3 36% 1 3 34% 1 3 43% 2 14 3 34% 1 3 32% 1 3 41% 2 15 4 46% 2 3 41% 2 4 50% 2 16 4 51% 2 4 45% 2 4 51% 2 17 4 49% 2 3 43% 2 4 50% 2 18 5 56% 3 4 48% 2 5 59% 3 19 2 23% 0 2 23% 0 2 25% 0 21 2 21% 0 2 21% 0 2 22% 0 22 2 25% 0 2 25% 0 2 25% 0 23 2 21% 0 2 21% 0 2 21% 0 24 2 21% 0 2 21% 0 2 21% 0 25 4 54% 3 4 47% 2 4 56% 3 26 3 41% 2 3 38% 1 4 51% 2 27 2 23% 0 2 23% 0 2 25% 0 28 2 23% 0 2 23% 0 2 25% 0 29 2 23% 0 2 23% 0 2 25% 0 30 2 24% 0 2 24% 0 2 27% 1 31 2 23% 0 2 23% 0 2 25% 0 32 2 23% 0 2 23% 0 2 25% 0 33 4 44% 2 3 40% 2 4 47% 2 34 2 31% 1 3 31% 1 3 32% 1 35 2 21% 0 2 21% 0 2 21% 0
Note: Background values are added to model output and then rounded to the nearest whole number for the purposes of presentation. 1EPP(Air) Objective is 8 µg/m3.

Caval Ridge - Supplementary Air Quality Report
3 Interpretation of Air Quality Impacts
42626420/1/3 25
Figure 3-8 Maximum 24-hour Average Ground-Level Concentration of PM2.5 for Year 1. EPP(Air) objective is 25 µg/m3 (dashed line).

Caval Ridge - Supplementary Air Quality Report
26 42626420/1/3
Figure 3-9 Maximum 24-hour Average Ground-Level Concentration of PM2.5 for Year 2. EPP(Air) objective is 25 µg/m3 (dashed line).
Caval Ridge - Supplementary Air Quality Report
3 Interpretation of Air Quality Impacts
42626420/1/3 27
Figure 3-10 Maximum 24-hour Average Ground-Level Concentration of PM2.5 for Year 20. EPP(Air) objective is 25 µg/m3 (dashed line).

Caval Ridge - Supplementary Air Quality Report
28 42626420/1/3
Figure 3-11 Annual Average Ground-Level Concentration of PM2.5 for Year 1. EPP(Air) objective is 8 µg/m3 (dashed line).

Caval Ridge - Supplementary Air Quality Report
3 Interpretation of Air Quality Impacts
42626420/1/3 29
Figure 3-12 Annual Average Ground-Level Concentration of PM2.5 for Year 2. EPP(Air) objective is 8 µg/m3 (dashed line).

Caval Ridge - Supplementary Air Quality Report
3 Interpretation of Air Quality Impacts
30 42626420/1/3
Figure 3-13 Annual Average Ground-Level Concentration of PM2.5 for Year 20. EPP(Air) objective is 8 µg/m3 (dashed line).
3.2.4 Dust Deposition Presented in Table 3-6 are the results for the predicted dust deposition at receptor locations for Year 1, Year 2 and Year 20. Results suggest that dust deposition will remain below the project goal of 4 g/m2/month at all locations. As discussed in the EIS, the existing background concentration of dust deposition is 1.5 g/m2/month. This has been included in the ‘Total’ column of the table.
Presented in Figure 3-14 is a contour plot of the monthly dust deposition for Year 20.

Caval Ridge - Supplementary Air Quality Report
3 Interpretation of Air Quality Impacts
42626420/1/3 31
Table 3-6 Monthly Annual Average Dust Deposition (g/m2/month)
Year 1 Year 2 Year 20 Rec
Total % of Guide-line1
Caval Contri-bution
Total % of Guide-line1
Caval Contri-bution
Total % of Guide-line1
Caval Contri-bution
1 1.6 40% 0.1 1.6 40% 0.1 1.6 40% 0.1 2 1.6 40% 0.1 1.6 40% 0.1 1.6 40% 0.1 3 1.6 40% 0.1 1.6 40% 0.1 1.6 40% 0.1 4 1.6 39% 0.1 1.6 39% 0.1 1.6 39% 0.1 5 1.6 41% 0.1 1.6 41% 0.1 1.6 41% 0.1 6 2.2 55% 0.7 2.3 57% 0.8 2.3 57% 0.8 7 1.6 40% 0.1 1.6 40% 0.1 1.6 40% 0.1 9 1.6 39% 0.1 1.6 40% 0.1 1.6 40% 0.1 10 1.6 40% 0.1 1.6 40% 0.1 1.6 40% 0.1 11 1.5 39% 0.0 1.6 39% 0.1 1.6 39% 0.1 12 1.7 43% 0.2 1.8 44% 0.3 1.8 44% 0.3 13 1.7 42% 0.2 1.7 43% 0.2 1.7 43% 0.2 14 1.6 41% 0.1 1.7 42% 0.2 1.7 42% 0.2 15 1.8 45% 0.3 1.9 47% 0.4 1.9 47% 0.4 16 1.8 46% 0.3 1.9 48% 0.4 1.9 48% 0.4 17 1.8 46% 0.3 1.9 47% 0.4 1.9 47% 0.4 18 2.0 50% 0.5 2.1 52% 0.6 2.1 52% 0.6 19 1.5 38% 0.0 1.5 38% 0.0 1.5 38% 0.0 21 1.5 38% 0.0 1.5 38% 0.0 1.5 38% 0.0 22 1.5 39% 0.0 1.5 39% 0.0 1.5 39% 0.0 23 1.5 38% 0.0 1.5 38% 0.0 1.5 38% 0.0 24 1.5 38% 0.0 1.5 38% 0.0 1.5 38% 0.0 25 1.9 49% 0.4 2.0 51% 0.5 2.0 51% 0.5 26 1.8 44% 0.3 1.8 46% 0.3 1.8 46% 0.3 27 1.5 38% 0.0 1.5 38% 0.0 1.5 38% 0.0 28 1.5 38% 0.0 1.5 39% 0.0 1.5 39% 0.0 29 1.5 38% 0.0 1.5 39% 0.0 1.5 39% 0.0 30 1.5 38% 0.0 1.6 39% 0.1 1.6 39% 0.1 31 1.5 39% 0.0 1.6 39% 0.1 1.6 39% 0.1 32 1.5 39% 0.0 1.6 39% 0.1 1.6 39% 0.1 33 1.8 45% 0.3 1.9 46% 0.4 1.9 46% 0.4 34 1.6 40% 0.1 1.6 41% 0.1 1.6 41% 0.1 35 1.5 38% 0.0 3.1 77% 1.6 3.1 77% 1.6
Note: Background values are added to model output and then rounded to the nearest whole number for the purposes of presentation. 1Project goal is 4g/m2/month.

Caval Ridge - Supplementary Air Quality Report
3 Interpretation of Air Quality Impacts
32 42626420/1/3
Figure 3-14 Monthly Dust Deposition for Year 20. Project goal is 4 g/m2/month (dashed line).
3.3 Worst-Case 24 Hour Emissions Scenario The reader is directed to Appendix L of the Caval Ridge EIS for more details of the worst-case 24 hour emissions scenarios.
A discussion regarding the likelihood of the impacts associated with these worst-case dust emission scenarios is presented in Section 3.3.3.
3.3.1 Worst-Case North Scenario Presented in Table 3-7 are the results for the predicted fifth highest ground-level concentration of PM10 for Year 1, Year 2 and Year 20 based on the worst-case north scenario. A background concentration of 18.8 µg/m3 has been included in the ‘Total’ column of the table.

Caval Ridge - Supplementary Air Quality Report
3 Interpretation of Air Quality Impacts
42626420/1/3 33
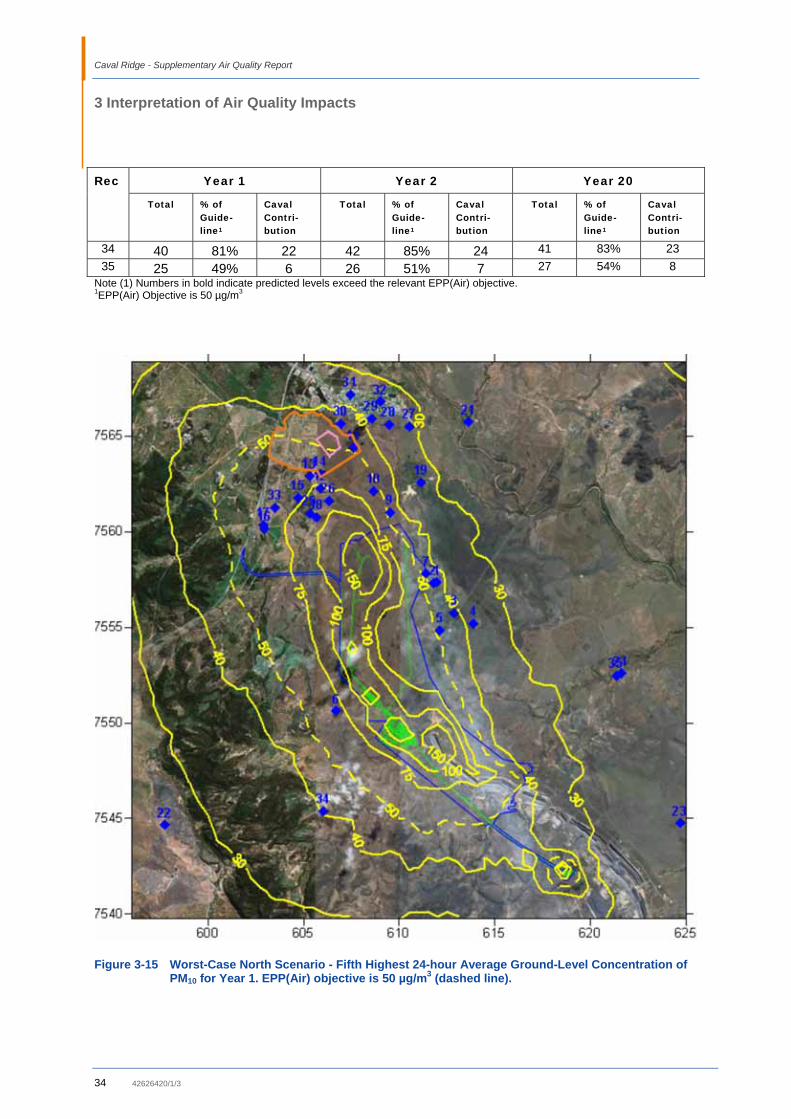
Results suggest that the ground-level concentrations of PM10 associated with the worst-case north scenario has the potential to exceed the EPP(Air) goal of 50 µg/m3 at locations to the northwest of the Horse Pit for all years modelled.
Ground-level concentrations of PM10 are predicted to exceed the EPP(Air) goal of 50 µg/m3 at receptor location 28 (51 µg/m3) and location 29 (51 µg/m3) which are within the Township of Moranbah (receptors 27 through 31).
Presented in Figure 3-15 through Figure 3-17 are contour plots of the fifth-highest 24-hour average ground-level concentrations of PM10 based on the worst-case north operational conditions. A background concentration of 18.8 µg/m3 has been included in the figures.
Table 3-7 Worst Case North Scenario - Fifth Highest Ground-Level Concentration of PM10 (µg/m3).
Year 1 Year 2 Year 20 Rec
Total % of Guide-line1
Caval Contri-bution
Total % of Guide-line1
Caval Contri-bution
Total % of Guide-line1
Caval Contri-bution
1 47 94% 28 47 94% 28 75 150% 56 2 48 96% 29 48 96% 29 76 152% 57 3 41 82% 22 44 88% 25 57 115% 39 4 36 72% 17 40 80% 21 45 89% 26 5 44 87% 25 44 88% 25 53 106% 34 6 69 137% 50 76 152% 57 69 137% 50 7 50 101% 32 44 88% 25 89 178% 70 9 46 93% 28 39 77% 20 140 280% 121 10 59 118% 40 41 82% 22 101 203% 83 11 44 88% 25 33 66% 14 57 113% 38 12 85 171% 67 53 106% 34 80 160% 61 13 75 149% 56 48 97% 30 75 151% 56 14 67 134% 48 47 94% 28 79 158% 60 15 78 157% 60 59 117% 40 72 144% 53 16 64 127% 45 64 128% 45 59 118% 40 17 63 125% 44 61 122% 42 57 115% 39 18 96 191% 77 64 127% 45 81 162% 62 19 31 63% 13 30 60% 11 44 88% 25 21 24 48% 5 26 52% 7 28 55% 9 22 27 55% 9 31 61% 12 28 57% 9 23 22 44% 3 25 50% 6 24 48% 5 24 24 48% 5 25 51% 7 26 53% 8 25 86 173% 68 63 126% 44 78 156% 59 26 91 183% 73 52 104% 33 90 179% 71 27 36 71% 17 32 65% 14 48 96% 29 28 38 75% 19 33 66% 14 51 101% 32 29 37 73% 18 32 64% 13 52 103% 33 30 39 78% 20 31 62% 12 48 97% 30 31 37 75% 19 31 63% 13 43 86% 24 32 35 70% 16 31 62% 12 46 92% 27 33 62 124% 43 54 108% 35 61 121% 42
Caval Ridge - Supplementary Air Quality Report
3 Interpretation of Air Quality Impacts
34 42626420/1/3
Year 1 Year 2 Year 20 Rec
Total % of Guide-line1
Caval Contri-bution
Total % of Guide-line1
Caval Contri-bution
Total % of Guide-line1
Caval Contri-bution
34 40 81% 22 42 85% 24 41 83% 23 35 25 49% 6 26 51% 7 27 54% 8
Note (1) Numbers in bold indicate predicted levels exceed the relevant EPP(Air) objective. 1EPP(Air) Objective is 50 µg/m3
Figure 3-15 Worst-Case North Scenario - Fifth Highest 24-hour Average Ground-Level Concentration of PM10 for Year 1. EPP(Air) objective is 50 µg/m3 (dashed line).

Caval Ridge - Supplementary Air Quality Report
3 Interpretation of Air Quality Impacts
42626420/1/3 35
Figure 3-16 Worst-Case North Scenario - Fifth Highest 24-hour Average Ground-Level Concentration of PM10 for Year 2. EPP(Air) objective is 50 µg/m3 (dashed line).
Caval Ridge - Supplementary Air Quality Report
3 Interpretation of Air Quality Impacts
36 42626420/1/3
Figure 3-17 Worst-Case North Scenario - Fifth Highest 24-hour Average Ground-Level Concentration of PM10 for Year 20. EPP(Air) objective is 50 µg/m3 (dashed line).
3.3.2 Worst Case South Scenario Presented in Table 3-8 are the results for the predicted fifth highest ground-level concentration of PM10 for Year 1, Year 2 and Year 20 based on the worst-case south scenario. A background concentration of 18.8 µg/m3 has been included in the ‘Total’ column of the table.
Results suggest that the ground-level concentration of PM10 associated with the worst-case south scenario has the potential to exceed the EPP(Air) goal of 50 µg/m3 at locations to the northwest of the Horse Pit for all years modelled.
Ground-level concentrations of PM10 are not predicted to exceed the EPP(Air) goal of 50 µg/m3 within the Township of Moranbah (receptors 27 through 31).

Caval Ridge - Supplementary Air Quality Report
3 Interpretation of Air Quality Impacts
42626420/1/3 37
Presented in Figure 3-18 through Figure 3-20 are contour plots of the fifth-highest 24-hour average ground-level concentrations of PM10 based on the worst-case south operational conditions. A background concentration of 18.8 µg/m3 has been included in the figures.
Table 3-8 Worst Case South Scenario - Fifth Highest Ground-Level Concentration of PM10 (µg/m3).
Year 1 Year 2 Year 20 Rec
Total % of Guide-line1
Caval Contri-bution
Total % of Guide-line1
Caval Contri-bution
Total % of Guide-line1
Caval Contri-bution
1 49 97% 30 47 94% 28 55 110% 36 2 49 99% 31 48 96% 29 55 110% 36 3 44 89% 26 44 88% 25 51 101% 32 4 40 80% 21 40 80% 21 46 92% 27 5 45 91% 27 44 88% 25 55 110% 36 6 76 151% 57 76 152% 57 77 154% 58 7 49 98% 30 44 88% 25 52 104% 33 9 41 81% 22 39 77% 20 49 98% 30 10 46 92% 27 41 82% 22 47 94% 28 11 36 71% 17 33 66% 14 36 73% 18 12 62 125% 44 53 106% 34 57 114% 38 13 57 114% 38 48 97% 30 54 108% 35 14 54 108% 35 47 94% 28 52 105% 34 15 68 136% 49 59 117% 40 63 125% 44 16 70 139% 51 64 128% 45 63 126% 44 17 66 131% 47 61 122% 42 61 122% 42 18 75 150% 56 64 127% 45 73 147% 55 19 31 62% 12 30 60% 11 34 68% 15 21 26 52% 7 26 52% 7 28 55% 9 22 30 60% 11 31 61% 12 30 61% 12 23 25 51% 6 25 50% 6 27 55% 8 24 25 51% 7 25 51% 7 27 55% 9 25 75 150% 56 63 126% 44 72 143% 53 26 62 125% 43 52 104% 33 57 115% 39 27 34 68% 15 32 65% 14 37 74% 18 28 34 69% 16 33 66% 14 36 72% 17 29 33 67% 15 32 64% 13 36 71% 17 30 33 66% 14 31 62% 12 34 69% 16 31 34 68% 15 31 63% 13 32 65% 14 32 33 65% 14 31 62% 12 35 70% 16 33 58 116% 39 54 108% 35 55 110% 36 34 45 90% 26 42 85% 24 43 86% 24 35 26 51% 7 26 51% 7 28 56% 9
Note (1) Numbers in bold indicate predicted levels exceed the relevant EPP(Air) objective. 1 EPP(Air) Objective is 50 µg/m3

Caval Ridge - Supplementary Air Quality Report
3 Interpretation of Air Quality Impacts
38 42626420/1/3
Figure 3-18 Worst-Case South Scenario - Fifth Highest 24-hour Average Ground-Level Concentration of PM10 for Year 1. EPP(Air) objective is 50 µg/m3 (dashed line).

Caval Ridge - Supplementary Air Quality Report
3 Interpretation of Air Quality Impacts
42626420/1/3 39
Figure 3-19 Worst-Case South Scenario - Fifth Highest 24-hour Average Ground-Level Concentration of PM10 for Year 2. EPP(Air) objective is 50 µg/m3 (dashed line).

Caval Ridge - Supplementary Air Quality Report
3 Interpretation of Air Quality Impacts
40 42626420/1/3
Figure 3-20 Worst-Case South Scenario - Fifth Highest 24-hour Average Ground-Level Concentration of PM10 for Year 20. EPP(Air) objective is 50 µg/m3 (dashed line).
3.3.3 Likelihood of Occurrence of Worst Case Impacts The worst-case north and south scenarios have been developed assuming that during a 24-hour period:
• One dragline is working at an optimal operational capacity of 44,000 bcm; • One shovel and truck fleet is working at an optimal operational capacity of 147,200 tonnes; and • One excavator is working on overburden at an optimal operational capacity of 48,300 tonnes.

Caval Ridge - Supplementary Air Quality Report
3 Interpretation of Air Quality Impacts
42626420/1/3 41
Based on information provided by BMA, the likelihood that one of the aforementioned equipment (ie dragline, shovel and truck fleet, or excavator) is operating at optimal capacity for a 24 hour period is 5% (i.e. 1 day in 20). The likelihood that two of the three are operating at optimal operational capacity for a 24 hour period is 0.25% (i.e. 1 day in 400 days) and the likelihood that all three are operating at optimal capacity for a 24 hour period is 0.0125% (i.e. 1 day in 8,000 days or 22 years).
Presented in Figure 3-21 is a timeseries of the 24-hour average ground-level concentration of PM10 at receptor location 28 (on the southern edge of the Township of Moranbah). Results of the dispersion modelling suggest that due to meteorological conditions there is the potential for emissions of dust during optimal operating conditions to contribute to an exceedence of the EPP(Air) objective of 50 µg/m3 at this location 6 days per year.
Thus the likelihood that worst-case meteorological conditions and optimal operation of two pieces of equipment is 1 day in 2,400 days (or 1 day in 6.5 years) and with three pieces of equipment (presented in Section 3.3.1 and Section 3.3.2) is 1 day in 48,000 days (or 1 day in 131.5 years).
Figure 3-21 Year 20 Worst-Case North Scenario - Timeseries of Predicted 24-hour Average Ground-Level Concentration of PM10 at Receptor Location 28. EPP(Air) objective is 50 µg/m3 (dashed line).

Caval Ridge - Supplementary Air Quality Report
42626420/1/3 42
4
4 Comments and Summary
4.1 Ambient Air Monitoring Program The ambient air monitoring program is proposed to be extended to include continuous monitoring of TSP, PM10 and/or PM2.5 at locations surrounding the Caval Ridge Mine site. The details of the extension of the monitoring program have yet to be finalised but is proposed to include (in addition to the operational monitoring outlined the Caval Ridge EIS Appendix L):
• Continuous PM10, PM2.5 and meteorological monitoring at the Moranbah Airport; and • Continuous TSP, PM10, PM2.5 and meteorological monitoring at a location between the Caval Ridge
Mine and the Township of Moranbah as indicated in Figure 4-1.
Figure 4-1 Proposed Ambient Air Monitoring Program Including Dust Deposition, Monitoring of Particulate Matter and Meteorological Parameters

Caval Ridge - Supplementary Air Quality Report
4 Comments and Summary
42626420/1/3 43
4.2 Cumulative Impacts Submissions have been raised during the Caval Ridge EIS review, expressing concerns regarding the effects of the cumulative impacts of dust on local and regional air quality as a result of an increased number of dust generating activities in the region.
The role of dispersion modelling is to highlight the potential for adverse air quality impacts within the study region and to guide decisions relating to the design and implementation of ambient air monitoring programs. Assurances that air quality is maintained at levels that are acceptable to the local communities can be verified through a well designed and implemented ambient air monitoring program.
It should be noted that there are inherent limitations associated with modelling low level, non-buoyant dust sources, and combined with the large degree of uncertainty in relation to the location of the dust sources associated with the existing and proposed mines in any given 24-hour period, it is unlikely that modelling will provide the necessary certainties.
Based on the geographic location of the Township of Moranbah and proposed and existing mining operations, local quarrying activities, and other regional sources of dust, possible impacts on the 24-hour average concentration of PM10 within Moranbah Township include (but may not be limited to) the following:
• Impacts from activities located within a similar band of wind directions will be additive. Thus when the wind is from the east, any and all dust sources to the east of the Moranbah will be additive. Similarly, when the wind is from the south, any and all dust sources to the south of Moranbah will be additive.
• Worst-case impacts of dust from the Isaac Plains Mine will not coincide with those from the proposed Caval Ridge mine.
• Worst-case impacts of dust from the Isaac Plains Mine will not coincide with those from the other dust generating activities that are not to the west of the Township
• Moranbah may experience a higher frequency of elevated levels of PM10
Thus, worst-case 24-hour average concentrations of PM10 due to dust-generating activities from all emission sources in the region are not additive during any given 24-hour period as worst-case meteorological conditions for each mine (such as wind speed and wind direction) differ depending on the geographic location of the mine from the Township.
With respect to the annual averages of PM2.5, TSP, and monthly dust deposition, impacts will be cumulative.
4.3 Summary A review and refinement of the dispersion modelling methodology utilised in the air quality assessment of the Caval Ridge Project has been undertaken.
Changes to operations at the mine site to reduce dust have been incorporated into the revised modelling, including:
• Fleet optimisation - reduced fleet and dozers • Introduction of back hauling to minimise the number of trucks running empty • Additional coal ramps in Horse pit • Redistributed tailings and rejects placement across Horse and Heyford Pits

Caval Ridge - Supplementary Air Quality Report
4 Comments and Summary
44 42626420/1/3
Changes to the modelling methodology that have been incorporated in order to reduce the level of conservatism within the model include:
• Dragline drop height calculated more accurately using mine planning parameters • More accurate reflection of dozer utilisation • Constant emission rates associated with stockpiling and exposed area were replaced with wind
speed dependent emission rates
Results of the revised dispersion modelling suggest that the Caval Ridge project will contribute a maximum of 21 µg/m3 to the 24-hour average ground-level concentration of PM10 at receptor locations within the Township of Moranbah under normal operating conditions which is less than the guideline level of 50 µg/m3.
During worst-case 24-hour operating conditions, dust emissions from the Caval Ridge project are predicted to contribute a maximum of 33 µg/m3 to the 24-hour average ground-level concentration of PM10 at receptor locations within the Township of Moranbah. The likelihood of optimal operational conditions (as modelled) occurring in combination with meteorological conditions that are associated with worst case dust impacts is estimated at 0.002% (equivalent to 1 day in 131.5 years).
The annual average ground-level concentration of PM2.5 is not predicted to exceed the EPP(Air) objective of 8 µg/m3 at any of the receptor locations under typical operations.
Ground-level concentrations of TSP and dust deposition are not predicted to exceed the relevant project goals at any of the receptor locations included in the dispersion modelling.

Caval Ridge - Supplementary Air Quality Report
42626420/1/3 45
5
5 References
Environmental Protection (Air) Policy 1998
Environmental Protection (Air) Policy 2008
National Pollutant Inventory (NPI). 2001. Emission Estimation Technique Manual for Mining, Version 2.3, (5 December 2001) (part of the Mining Handbook). Available by download from the NPI website at: http://www.npi.gov.au/handbooks/approved_handbooks/mining.html.
Sinclair Knight Merz (SKM, 2005), Improvement of NPI Fugitive Particulate Matter Emission Estimation Techniques, May 2005.
Caval Ridge - Supplementary Air Quality Report
42626420/1/3 46
6
6 Limitations
URS Australia Pty Ltd (URS) has prepared this report in accordance with the usual care and thoroughness of the consulting profession for the use of BMA and only those third parties who have been authorised in writing by URS to rely on the report. It is based on generally accepted practices and standards at the time it was prepared. No other warranty, expressed or implied, is made as to the professional advice included in this report.
The methodology adopted and sources of information used by URS are outlined in this report. URS has made no independent verification of this information beyond the agreed scope of works and URS assumes no responsibility for any inaccuracies or omissions. No indications were found during our investigations that information contained in this report as provided to URS was false.
This report was prepared between July 2009 and October 2009 and is based on the conditions encountered and information reviewed at the time of preparation. URS disclaims responsibility for any changes that may have occurred after this time.
This report should be read in full. No responsibility is accepted for use of any part of this report in any other context or for any other purpose or by third parties. This report does not purport to give legal advice. Legal advice can only be given by qualified legal practitioners.

URS Australia Pty Ltd Level 16, 240 Queen Street Brisbane, QLD 4000 GPO Box 302, QLD 4001 Australia T: 61 7 3243 2111 F: 61 7 3243 2199
www.ap.urscorp.com