Basics of z Scores, Percentiles, Quartiles, and Boxplots 3-4 Measures of Relative Standing.
19
Basics of z Scores, Percentiles, Quartiles, and Boxplots 4 Measures of Relative Standi
-
Upload
ada-morgan -
Category
Documents
-
view
222 -
download
2
Transcript of Basics of z Scores, Percentiles, Quartiles, and Boxplots 3-4 Measures of Relative Standing.

Basics of z Scores, Percentiles, Quartiles, and
Boxplots
3-4 Measures of Relative Standing

z Score (or standardized value)
the number of standard deviations that a given value x is above or below the mean
z score
jarvis01
Can you align these two lines so that they align vertically with z? I couldn't move the second line.

Sample
x xz
s
Population
Round z scores to 2 decimal places
Measures of Position z Score
xz

Interpreting Z Scores
Whenever a value is less than the mean, its corresponding z score is negative
Ordinary values:
Unusual Values:
2 score 2z
score 2 or score 2z z

Example
The author of the text measured his pulse rate to be 48 beats per minute.
Is that pulse rate unusual if the mean adult male pulse rate is 67.3 beats per minute with a standard deviation of 10.3?
Answer: Since the z score is between – 2 and +2, his pulse rate is not unusual.
48 67.31.87
10.3
x xz
s

Percentiles
are measures of location. There are 99 percentiles denoted P1, P2, . . ., P99, which divide a set of data into 100 groups with about 1% of the values in each group.

Finding the Percentile of a Data Value
Percentile of value x = • 100number of values less than x
total number of values

ExampleFor the 40 Chips Ahoy cookies, find the percentile for a cookie with 23 chips.
Answer: We see there are 10 cookies with fewer than 23 chips, so
A cookie with 23 chips is in the 25th percentile.
10Percentile of 23 100 25
40

n total number of values in the data set
k percentile being used
L locator that gives the position of a value
Pk kth percentile
Notation
Converting from the kth Percentile to the Corresponding Data Value
100
kL n

Converting from the kth Percentile to the Corresponding Data Value
Quartiles
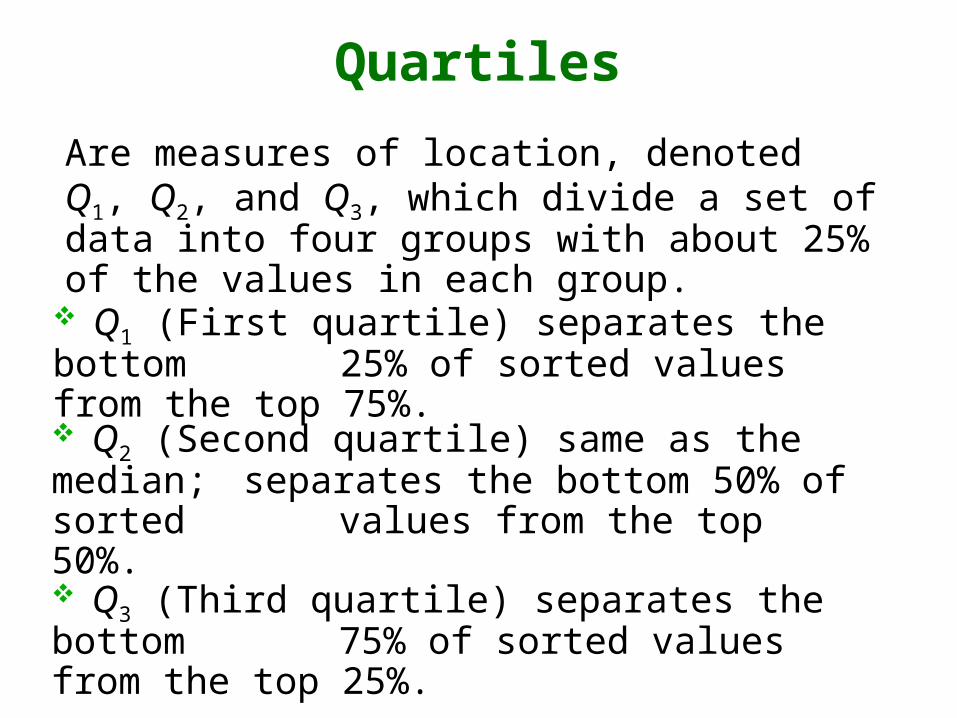
Q1 (First quartile) separates the bottom 25% of sorted values from the top 75%.
Q2 (Second quartile) same as the median; separates the bottom 50% of sorted values from the top 50%.
Q3 (Third quartile) separates the bottom 75% of sorted values from the top 25%.
Are measures of location, denoted Q1, Q2, and Q3, which divide a set of data into four groups with about 25% of the values in each group.
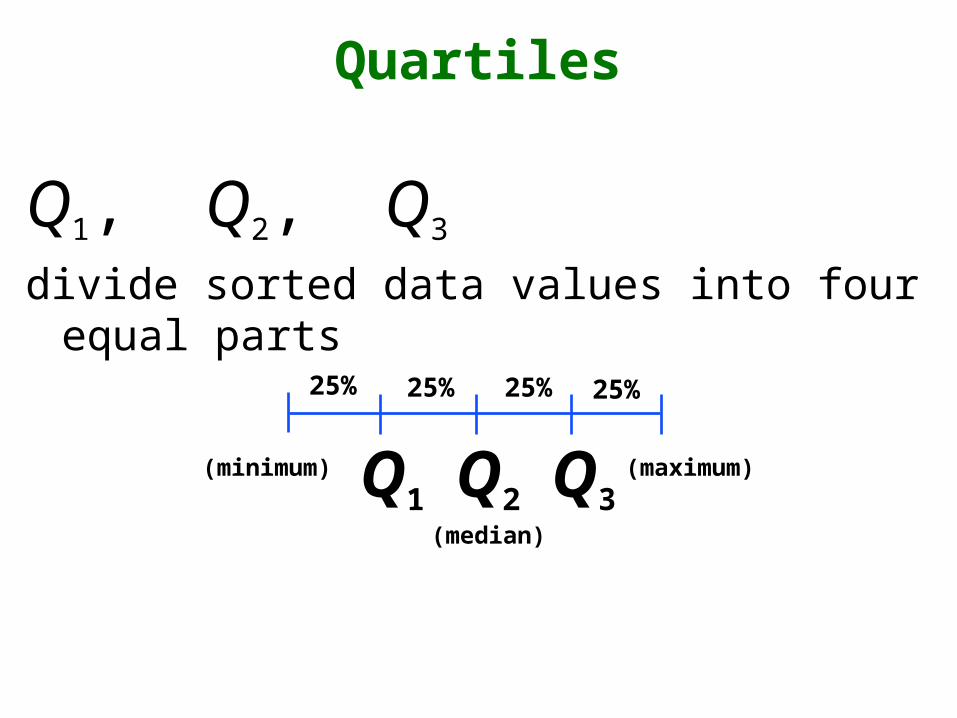
Q1, Q2, Q3 divide sorted data values into four equal parts
Quartiles
25% 25% 25% 25%
Q3Q2Q1(minimum) (maximum)
(median)

Other Statistics
Interquartile Range (or IQR):
10 - 90 Percentile Range:
Midquartile:
Semi-interquartile Range: 3 1
2
Q Q
3 1Q Q
3 1
2
Q Q
90 10P P

For a set of data, the 5-number summary consists of these five values:
1. Minimum value
2. First quartile Q1
3. Second quartile Q2 (same as median)
4. Third quartile, Q3
5. Maximum value
5-Number Summary

A boxplot (or box-and-whisker-diagram) is a graph of a data set that consists of a line extending from the minimum value to the maximum value, and a box with lines drawn at the first quartile, Q1, the median, and the third quartile, Q3.
Boxplot
jarvis01
Would include a slide on how to construct a boxplot. Would put that slide afterthis one. The procedure is on p. 119.

1. Find the 5-number summary.
2. Construct a scale with values that include the minimum and maximum data values.
3. Construct a box (rectangle) extending from Q1 to Q3 and draw a line in the box at the value of Q2 (median).
4. Draw lines extending outward from the box to the minimum and maximum values.
Boxplot - Construction
jarvis01
Would include a slide on how to construct a boxplot. Would put that slide afterthis one. The procedure is on p. 119.

Boxplots

Boxplots - Normal Distribution
Normal Distribution:Heights from a Simple Random Sample of Women

Boxplots - Skewed Distribution
Skewed Distribution:Salaries (in thousands of dollars) of NCAA Football Coaches