

Basics of Supercomputing - Interdisciplinary | Innovativesbrandt/basics_of_supercomputing/L6... ·...
72
Day 4: OS 2010 - Course MT1 Basics of Supercomputing Prof. Thomas Sterling Pervasive Technology Institute School of Informatics & Computing Indiana University Dr. Steven R. Brandt Center for Computation & Technology Louisiana State University User Environments
-
Upload
phunghuong -
Category
Documents
-
view
213 -
download
0
Transcript of Basics of Supercomputing - Interdisciplinary | Innovativesbrandt/basics_of_supercomputing/L6... ·...

Day 4: OS 2010 - Course MT1
Basics of Supercomputing
Prof. Thomas Sterling
Pervasive Technology Institute
School of Informatics & Computing
Indiana University
Dr. Steven R. Brandt
Center for Computation & Technology
Louisiana State University
User Environments

Day 4: OS 2010 - Course MT1
Getting Class Materials
• http://tinyurl.com/basics-of-supercomputing
• Email: [email protected]
2

Day 4: OS 2010 - Course MT1 3
Opening Remarks: Where are We??
• The two ends: what we’ve covered so far
– From the top down:
• Models, methods, and means
• Parallel Programming Models: the 3 C’s:
– Capability (OpenMP), Capacity (Condor), Cooperative (MPI)
– From the bottom up:
• Enabling device technologies
• Micro architectures
• Parallel system architectures
– Performance as cross cutting theme
• We’re now at the system center:
– The Operating System
• It owns the computer
• It controls the applications
• It facilitates your needs but limits your access
• It protects you from others, and they from you

Day 4: OS 2010 - Course MT1 4
Topics
• Operating System Structures and Services
• Mass Storage and File I/O
• Visualization

Day 4: OS 2010 - Course MT1
User Environments
• Provide added facilities that support critical functionality
for supercomputer users
• The operating system provides many of the services for
managing basic computing resources and scheduling
jobs, processes, and threads
• File I/O provides the capability of persistent storage and
large scale data maintenance
• Visualization hardware and software creates images of
raw data for ease of understanding
5

Day 4: OS 2010 - Course MT1 6
Topics
• Operating System Structures and Services
• Mass Storage and File I/O
• Visualization

Day 4: OS 2010 - Course MT1 7
Operating System
• What is an Operating System?
– A persistent program that controls the execution of application
programs
– An interface between applications and hardware
• Primary functionality
– Exploits the hardware resources of one or more processors
– Provides a set of services to system users
– Manages secondary memory and I/O devices
• Objectives
– Convenience: Makes the computer more convenient to use
– Efficiency: Allows computer system resources to be used in an
efficient manner
– Reliability: through protection between jobs
– Ability to evolve: Permit effective development, testing, and
introduction of new system functions without interfering with service
Source: William Stallings “Operating Systems: Internals and Design Principles (5th Edition)”
Day 4: OS 2010 - Course MT1 9
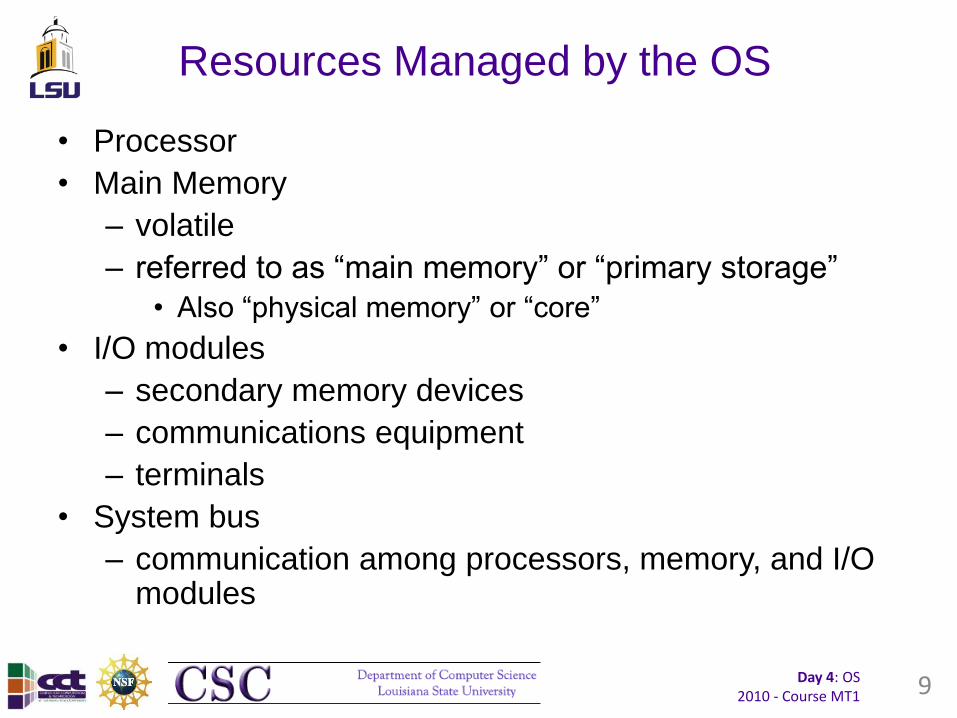
Resources Managed by the OS
• Processor
• Main Memory
– volatile
– referred to as “main memory” or “primary storage”
• Also “physical memory” or “core”
• I/O modules
– secondary memory devices
– communications equipment
– terminals
• System bus
– communication among processors, memory, and I/O modules
Day 4: OS 2010 - Course MT1
Operating System Components: Overview
• Process Management: Creating and deleting user and system processes, suspending and resuming processes, mechanisms for process communication, process synchronization, & deadlock handling
• Memory Management: managing usage of memory, loading processes into memory, allocation and de-allocation of memory
• File Management: Creating and deleting files, creating and deleting directories, manipulating files and directories, mapping to secondary storage etc.
• I/O System Management: buffering, caching, spooling, general device driver interfaces, drivers for specific hardware devices
• Secondary Storage Management: Free space management, storage allocation, disk scheduling
• Networking: Communication drivers, protocols
• Protection & Security systems: Controlling access of programs, processes, or users to the resources defined by the computer system.
10

Day 4: OS 2010 - Course MT1
Operating System Services
• Operating system provides an environment to execute programs. Following are some of the services an Operating System provides :
• Program execution: ability to load a program into memory and execute the program. Program must be able to end execution normally or abnormally.
• I/O operations: help in input/output operations to a file or an I/O device.
• File System Manipulation: read, write, modify, create, delete files by name.
• Communication: facilitate exchange of information between processes through shared memory or message passing.
• Error detection and handling: Monitor for potential errors in CPU, memory hardware, I/O devices, external devices, potential errors in user programs such as access to illegal memory location etc.
11

Day 4: OS 2010 - Course MT1
Multiprogramming & Multitasking
• Multiprogramming needed for efficiency
– Single user cannot keep CPU and I/O devices busy at all times
– Multiprogramming organizes jobs (code and data) so CPU always has one to execute
– A subset of total jobs in system is kept in memory
– One job selected and run via job scheduling
– When it has to wait (for I/O for example), OS switches to another job
• Timesharing (multitasking) is logical extension in which CPU switches jobs so frequently that users can interact with each job while it is running, creating interactive computing
– Response time should be < 1 second
– Each user has at least one program executing in memory process
– If several jobs ready to run at the same time CPU scheduling
– If processes don’t fit in memory, swapping moves them in and out to run
– Virtual memory allows execution of processes not completely in memory
12

Day 4: OS 2010 - Course MT1
Linux History
• Initial version written by Linus Torvalds (Finland) in 1991
• Originally intended as a non-commercial replacement for the
Minix kernel
• Since then, a number of contributors continued to improve Linux
collaborating over the Internet under Torvalds’ control:
– Added many features available in commercial counterparts
– Optimized the performance
– Ported to other hardware architectures (Intel x86 and IA-64, IBM
Power, MIPS, SPARC, ARM and others)
• The source code is available and free (protected by the GNU
Public License)
• The current kernel version is 3.0.8 (see http://kernel.org)
• Today Linux can be found on plethora of computing platforms,
from embedded microcontrollers and handhelds, through
desktops and workstations, to servers and supercomputers
15

Day 4: OS 2010 - Course MT1
Linux Design
• Monolithic OS – All functionality stored mainly in a single block of code
– All components of the kernel have access to all internal data structures
and routines
– Changes require relinking and frequently a reboot
• Modular architecture – Extensions of kernel functionality (modules) can be loaded and
unloaded at runtime (dynamic linking)
– Can be arranged hierarchically (stackable)
– Overcomes use and development difficulties associated with monolithic
structure
16

Day 4: OS 2010 - Course MT1 18
Topics
• Operating System Structures and Services
• Mass Storage and File I/O
• Visualization
Day 4: OS 2010 - Course MT1
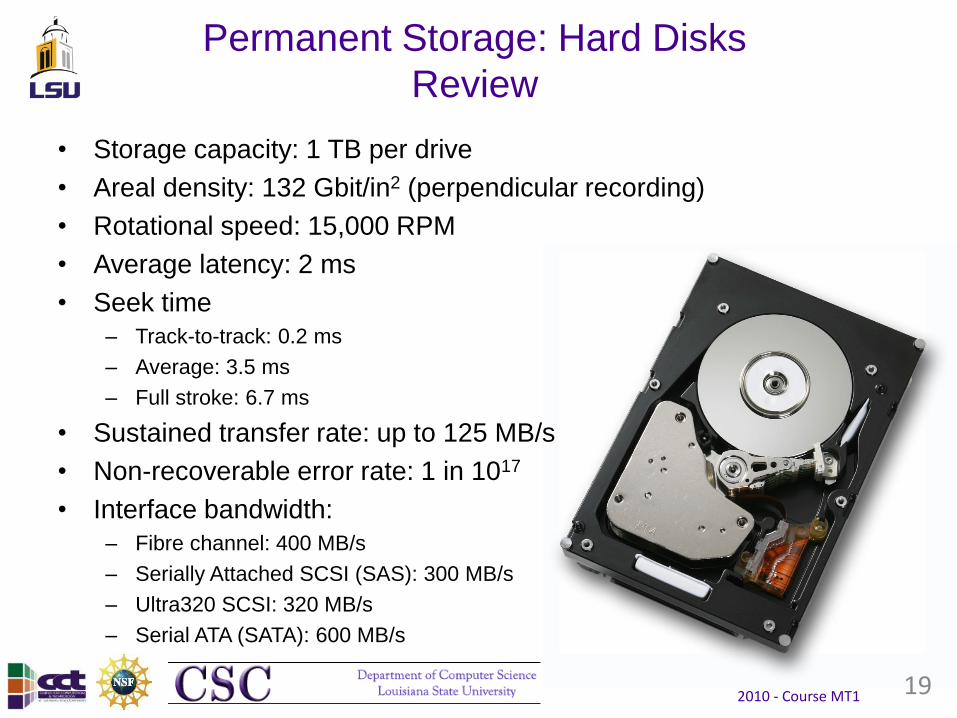
• Storage capacity: 1 TB per drive
• Areal density: 132 Gbit/in2 (perpendicular recording)
• Rotational speed: 15,000 RPM
• Average latency: 2 ms
• Seek time
– Track-to-track: 0.2 ms
– Average: 3.5 ms
– Full stroke: 6.7 ms
• Sustained transfer rate: up to 125 MB/s
• Non-recoverable error rate: 1 in 1017
• Interface bandwidth:
– Fibre channel: 400 MB/s
– Serially Attached SCSI (SAS): 300 MB/s
– Ultra320 SCSI: 320 MB/s
– Serial ATA (SATA): 600 MB/s
Permanent Storage: Hard Disks
Review
19
Day 4: OS 2010 - Course MT1
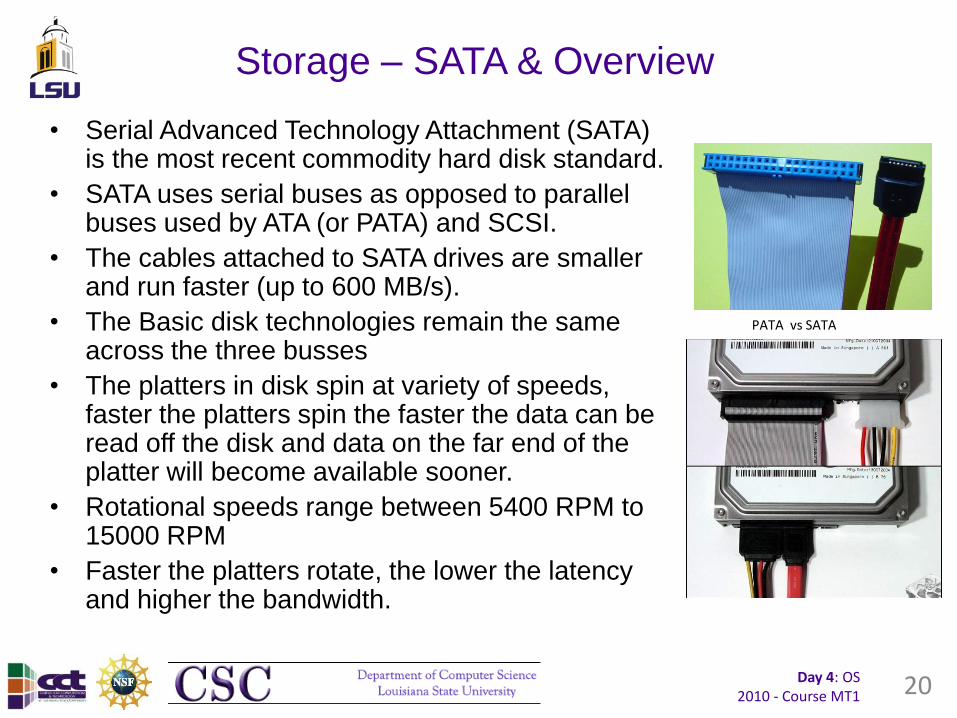
Storage – SATA & Overview
• Serial Advanced Technology Attachment (SATA) is the most recent commodity hard disk standard.
• SATA uses serial buses as opposed to parallel buses used by ATA (or PATA) and SCSI.
• The cables attached to SATA drives are smaller and run faster (up to 600 MB/s).
• The Basic disk technologies remain the same across the three busses
• The platters in disk spin at variety of speeds, faster the platters spin the faster the data can be read off the disk and data on the far end of the platter will become available sooner.
• Rotational speeds range between 5400 RPM to 15000 RPM
• Faster the platters rotate, the lower the latency and higher the bandwidth.
20
PATA vs SATA

Day 4: OS 2010 - Course MT1
I/O Needs on Parallel Computers
• High Performance
– Take advantage of parallel I/O paths (where available)
– Support application-level data access and throughput needs
– Scalable with systems size and user number/needs
• Data Integrity
– Sanely deal with hardware and power failures
• Single Namespace
– All nodes and users “see” the same file systems
– Equal access from anywhere on the resource
• Ease of Use
– Whenever possible, a storage system should be accessible
in consistent way, in the same ways as a traditional UNIX-
style file systems
21
Ohio Supercomputer Center

Day 4: OS 2010 - Course MT1
Related Topics
• Hardware-based solutions
– RAID
• File systems commonly used in parallel computing
– NFS
– PVFS2
– Lustre
– GPFS
– pNFS
– Panasas
• Software I/O libraries (next topic)
– POSIX I/O
– MPI-IO
– NetCDF
– HDF5
22

Day 4: OS 2010 - Course MT1
RAID: Key Concepts
• RAID stands for Redundant Array of Inexpensive (or: Independent) Disks - term coined by David Patterson, Garth Gibson and Randy Katz
• Aims to achieve greater levels of performance, reliability, and/or larger volume sizes
• Several basic architectures, ranging from RAID 0 through RAID 6
• Groups of two or more disks are treated effectively as single large disks; performance of multiple disks is better than that of individual disks due to bandwidth aggregation and overlap of multiple accesses
• Using multiple disks helps store data in multiple places (redundancy), allowing the system to continue functioning in case of failures
• Both software (OS managed) and hardware (dedicated I/O cards) raid solutions available
– Hardware solutions are more expensive, but provide better performance without CPU overhead
– Software solutions provide better flexibility, but have associated computational overhead
23

Day 4: OS 2010 - Course MT1
RAID 5
• Striped set with distributed parity
• Requires at least 3 disks per array
• Similarly to RAID 0, data are distributed
across all the disks
• Parity information for each stripe is also
distributed across the disks, eliminating the
bottleneck of a single parity disk (RAID 4)
and equalizing the load across components
• Tolerates single disk failures; the missing
data block may be recomputed based on the
contents of the parity block and the data
blocks of the remaining disks in the same
stripe
• Write performance of RAID 5 is reduced due
to parity computation for every physical write
operation
24
http://www.drivesolutions.com/datarecovery/raid.shtml

Day 4: OS 2010 - Course MT1
Distributed File Systems
• A distributed file system is a file system that is stored locally on one system
(server) but is accessible by processes on many systems (clients)
• Multiple processes access multiple files simultaneously
• Other attributes of a DFS may include:
– Access control lists (ACLs)
– Client-side file replication
– Server- and client- side caching
• Some examples of DFSes:
– NFS (Sun)
– DCE/DFS (Transarc / IBM)
– CIFS (Microsoft)
– SSHFS (Fuse / SSH)
• Distributed file systems can be used by parallel programs, but they have
significant disadvantages:
– The network bandwidth of the server system is a limiting factor on performance
– To retain UNIX-style file consistency, the DFS software must implement some form
of locking which has significant performance implications
25
Ohio Supercomputer Center

Day 4: OS 2010 - Course MT1
Distributed File System: NFS
• Popular means for accessing remote file systems in a local area network
• Based on the client-server model, the remote file systems may be “mounted” via NFS and accessed through the Linux Virtual File System (VFS) layer
• NFS clients cache file data, periodically checking with the original file for any changes
• The loosely-synchronous model makes for convenient, low-latency access to shared spaces
• NFS avoids the common locking systems used to implement POSIX semantics
• Most client implementations are open-source; many servers remain proprietary
26
NFS support via
VFS layer in Linux

Day 4: OS 2010 - Course MT1
Why NFS is bad for Parallel I/O
• Clients can cache data indiscriminately, and tend to do that at
arbitrary block boundaries
• When nearby regions of a file are written by different processes on
different clients, the result is undefined due to lack of consistency
control
• All file operations are remote operations; extensive file locking is
required to implement sequential consistency
• Communication between client and server typically uses relatively
slow communication channels, adding to performance degradation
• Inefficient specification (e.g., a read operation involves two RPCs;
one for look-up of file handle and second for reading of file data)
27
Day 4: OS 2010 - Course MT1
Parallel File Systems
• Parallel File System is one in which there are multiple servers as
well as clients for a given file system, equivalent of RAID across
several file systems.
• Multiple processes can access the same file simultaneously
• Parallel File Systems are usually optimized for high performance
rather than general purpose use, common optimization criterion
being :
– Large block sizes (≥ 64kB)
– Relatively slow metadata operations (eg. fstat()) compared to reads
and writes
– Special APIs for direct access and additional optimizations
• Examples of Parallel file systems include :
– GPFS (IBM)
– Lustre (Cluster File Systems/Sun)
– PVFS2 (Clemson/ANL)
28
Ohio Supercomputer Center

Day 4: OS 2010 - Course MT1
Characteristics of Parallel File Systems
• Three Key Characteristics:
– Various hardware I/O data storage resources
– Multiple connections between these hardware
devices and compute resources
– High-performance, concurrent access to these I/O
resources
• Multiple physical I/O devices and paths ensure
sufficient bandwidth for the high performance
desired
• Parallel I/O systems include both the hardware
and number of layers of software
29
Storage Hardware
Parallel File System
Parallel I/O (MPI I/O)
High-Level I/O Library

Day 4: OS 2010 - Course MT1
Parallel File Systems: Hardware Layer
• I/O Hardware is usually comprised of disks, controllers,
and interconnects for data movement
• Hardware determines the maximum raw bandwidth and
the minimum latency of the system
• Bisection bandwidth of the underlying transport
determines the aggregate bandwidth of the resulting
parallel I/O system
• At the hardware level, data is accessed at the
granularity of blocks, either physical disk blocks or
logical blocks spread across multiple physical devices
such as in a RAID array
• Parallel File Systems :
– manage data on the storage hardware,
– present this data as a directory hierarchy,
– coordinate access to files and directories in a consistent
manner
• File systems usually provide a UNIX like interface,
allowing users to access contiguous regions of files
30
Storage Hardware
Parallel I/O (MPI I/O)
High-Level I/O Library
Parallel File System
Day 4: OS 2010 - Course MT1
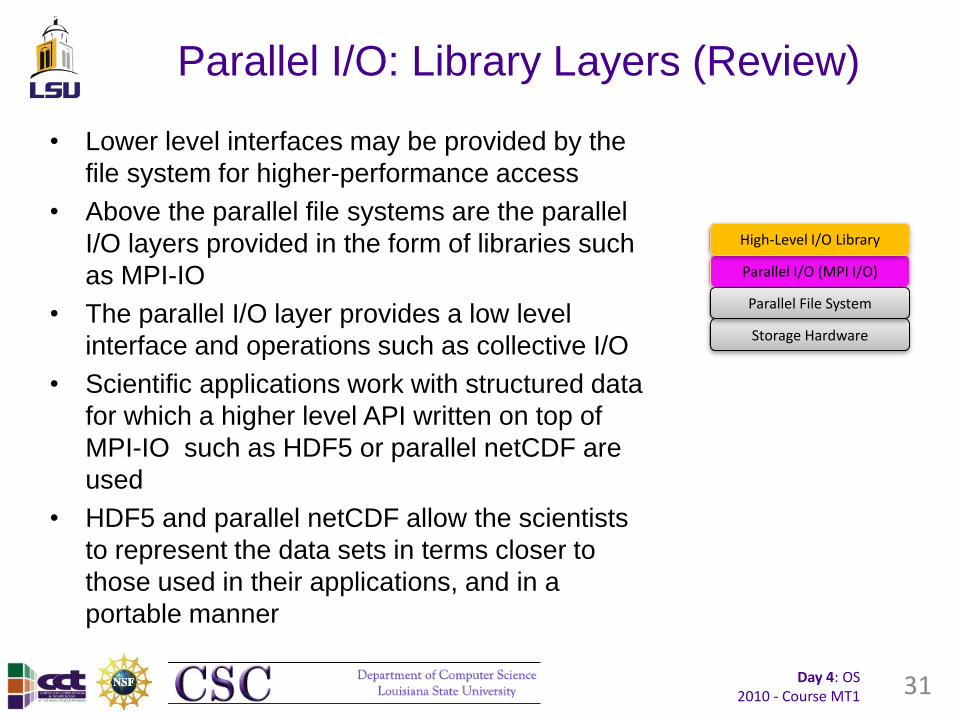
Parallel I/O: Library Layers (Review)
• Lower level interfaces may be provided by the
file system for higher-performance access
• Above the parallel file systems are the parallel
I/O layers provided in the form of libraries such
as MPI-IO
• The parallel I/O layer provides a low level
interface and operations such as collective I/O
• Scientific applications work with structured data
for which a higher level API written on top of
MPI-IO such as HDF5 or parallel netCDF are
used
• HDF5 and parallel netCDF allow the scientists
to represent the data sets in terms closer to
those used in their applications, and in a
portable manner
31
Storage Hardware
Parallel I/O (MPI I/O)
Parallel File System
High-Level I/O Library

Day 4: OS 2010 - Course MT1
POSIX File Access API • Widespread standard
• Available on any UNIX-compliant platform – IBM AIX, HP HP-UX, SGI Irix, Sun Solaris, BSDi BSD/OS, Mac OS X, Linux,
FreeBSD, OpenBSD, NetBSD, BeOS, and many others
– Also: Windows NT, XP, Server 2003, Vista (through C runtime libraries)
• Simple interface: six functions from POSIX.1 (core services) provide practically all necessary I/O functionality – File open
– File close
– File data read
– File data write
– Flush buffer to disk
– Adjust file pointer (seek)
• Two interface variants, provide roughly equivalent functionality – Low-level file interface (file handles are integer descriptors)
– C stream interface (streams are represented by FILE structure; function names prefixed with “f”)
• But: no parallel I/O support
32

Day 4: OS 2010 - Course MT1
Problems with POSIX File I/O • Too simplistic interface
– Operates on anonymous sequences of bytes
– No preservation of type or information structure
– Cumbersome access to optimized/additional features (fcntl, ioctl)
– Designed for sequential I/O (even regularly strided accesses require multiple calls and may suffer from poor performance)
• Portability issues – Must use specialized reader/writer created for a particular application
– Compatibility checks dependent on application developers (possibility of undetected failures)
– No generic utilities to parse and interpret the contents of saved files
– Cross platform endianness and type representation problem if saving in binary mode
– Significant waste of storage space if text mode is used (for portability or readability of transferred data)
• Permit access only to locally mounted storage, or remote storage via NFS (which has its share of problems)
• Parallel and concurrent access issues – Lack of synchronization when accessing shared files from multiple nodes
– Atomic access to shared files may not be enforceable, has unclear semantics, or has to rely on the programmer for synchronization
– Uncoordinated access of I/O devices shared by multiple nodes may result in poor performance (bottlenecks)
– Additional performance loss due to suboptimal bulk data movement (e.g., no collective I/O)
– On the other hand, without sharing, the management of individual files (i.e. with at least one data file per I/O node) is complicated and tedious
33

Day 4: OS 2010 - Course MT1
MPI-IO Overview
• Initially developed as a research project at the IBM T. J. Watson
Research Center in 1994
• Voted by the MPI Forum to be included in MPI-2 standard (Chapter 9)
• Most widespread open-source implementation is ANL’s ROMIO,
written by Rajeev Thakur (http://www-unix.mcs.anl.gov/romio/ )
• Integrates file access with the message passing infrastructure, using
similarities between send/receive and file write/read operations
• Allows MPI datatypes to meaningfully describe data layouts in files
instead of dealing with unorganized streams of bytes
• Provides potential for performance optimizations through the
mechanism of “hints”, collective operations on file data, or relaxation
of data access atomicity
• Enables better file portability by offering alternative data
representations
34

Day 4: OS 2010 - Course MT1 35
Topics
• Operating System Structures and Services
• Mass Storage and File I/O
• Visualization

Day 4: OS 2010 - Course MT1
Goals of visualization
• Understand not the data but the underlying
phenomenon. Numbers are not enough.
• Computers produce too much data
• Bandwidth of human visual channel is high and large
portion of brain devoted to visual processing
• Well developed languages for visual communication
• Understanding of the phenomenon represented by the
data.
• Achieving compelling visual depictions.
36

Day 4: OS 2010 - Course MT1
Why Visualization ?
u =
-6.427857 , -6.523186 , -6.54103 , -6.54103 , -6.482776 , -6.390405 ,
-6.390405 , -6.572558 , -6.97136 , -7.201595 , -7.348364 , -7.329116 ,
-7.452635 , -7.64616 , -7.942822 , -8.201272 , -8.43337 , -8.660357 ,
-8.717431 , -8.655432 , -8.406534 , -8.33491 , -8.369874 , -8.578186 ,
-8.721748 , -8.844964 , -8.925459 , -8.98138 , -8.984378 , -8.983262 ,
-8.971765 , -8.961585 , -8.971635 , -8.925839 , -8.84674 , -8.710734 ,
-8.628431 , -8.573109 , -8.573581 , -8.507746 , -8.403376 , -8.241115 ,
-8.10023 , -7.968015 , -7.840099 , -7.750834 , -7.682921 , -7.671621 ,
-7.535857 , -7.322661 , -6.97717 , -6.752327 , -6.593081 , -6.5627 ,
-6.429719 , -6.255228 , -5.996966 , -5.849945 , -5.849944 , -5.849944 ,
-5.866279 , -6.008289 , -6.256032 , -6.256031 , -6.061061 , -5.582273 ,
-5.318203 , -5.304733 , -5.304731 , -5.304732 , -5.400971 , -5.525061 ,
-5.695447 , -5.908212 , -6.120428 , -6.483144 , -6.929903 , -7.499269 ,
-7.870482 , -7.944466 , -7.944464 , -7.944464 , -7.659261 , -7.229546 ,
-6.725167 , -6.161546 , -5.556448 , -4.978111 , -4.438664 , -3.956492 ,
-3.541891 , -3.200402 , -2.948171 , -2.725869 , -2.547415 , -2.403962 ,
-2.328887 , -2.328887 , -2.362912 , -2.47964 , -2.661769 , -2.897908 ,
-3.173306 , -3.469175 , -3.77889 , -4.023475 , -4.197217 , -4.269307 ,
-4.269307 , -4.141403 , -3.900984 , -3.598546 , -3.241225 , -2.838429 ,
-2.448151 , -2.077646 , -1.729339 , -1.448499 , -1.221355 , -1.075136 ,
-0.8622113 , -0.610992 , -0.309599 , -0.008249226 , 0.2866637 ,
0.5844232 , 0.7551345 , 0.7551345 , 0.7404107 , 0.628957 , 0.4618129 ,
0.254385 , -0.001586894 , -0.2942654 , -0.6273276 , -0.9602203 ,
-1.302442 , -1.651798 , -2.040005 , -2.473109 , -2.927637 , -3.536143 ,
-4.256138 , -5.131937 , -5.909329 , -6.632139 , -7.264142 , -7.914654 ,
-8.569831 , -9.225504 , -9.972804 , -10.79719 , -11.69678 , -12.65146 ,
-13.63585 , -14.65405 , -15.52981 , -16.26998 , -16.84625 , -17.27217 ,
-17.54335 , -17.63945 , -17.68136 , -17.6488 , -17.5907 , -17.36112 ,
-17.01713 , -16.55005 , -16.1187 , -15.72782 , -15.39774 , -15.21338 ,
-15.21338 , -15.29171 , -15.5386 ,
-5.872988 , -6.085768 , -6.315414 , -6.46691 , -6.566167 , -6.463671 ,
-6.516846 , -6.661736 , -6.950105 , -7.139693 , -7.292792 , -7.35294 ,
-7.509007 , -7.711919 , -7.98795 , -8.204489 , -8.388111 , -8.53765 ,
-8.549171 , -8.494419 , -8.274727 , -8.235106 , -8.290669 , -8.485452 ,
-8.631478 , -8.758162 , -8.843537 , -8.905816 , -8.901114 , -8.923553 ,
-8.900274 , -8.85834 , -8.826035 , -8.742122 , -8.633344 , -8.481342 ,
-8.38605 , -8.324376 , -8.328 , -8.283401 , -8.224975 , -8.140258 ,
-8.033843 , -7.907145 , -7.744395 , -7.630397 , -7.540941 , -7.511995 ,
-7.380935 , -7.18389 , -6.89576 , -6.690366 , -6.539803 , -6.49908 ,
-6.338212 , -6.121155 , -5.800247 , -5.614371 , -5.590841 , -5.617583 ,
-5.618993 , -5.705396 , -5.831448 , -5.808238 , -5.637913 , -5.273538 ,
-5.048944 , -4.978347 , -4.939844 , -4.935815 , -5.005646 , -5.125065 ,
-5.340047 , -5.640095 , -6.118582 , -6.479867 , -7.020726 , -7.656367 ,
-8.091928 , -8.235412 , -8.256392 , -8.288987 , -8.02024 , -7.594208 ,
-7.080354 , -6.493727 , -5.853112 , -5.222045 , -4.61448 , -4.051221 ,
-3.540982 , -3.094106 , -2.729883 , -2.4017 , -2.128516 , -1.901242 ,
-1.783949 , -1.794434 , -1.854288 , -2.025638 , -2.276666 , -2.588354 ,
-2.951093 , -3.336414 , -3.737945 , -4.051697 , -4.247976 , -4.299063 ,
-4.287614 , -4.141403 , -3.773021 , -3.392112 , -2.966861 , -2.511141 ,
-2.104363 , -1.752656 , -1.458143 , -1.264281 , -1.149855 , -1.12121 ,
-1.021299 , -0.857702 , -0.6503528 , -0.3679736 , -0.04715691 ,
0.330871 , 0.5817654 , 0.6693039 , 0.6839384 , 0.6188942 , 0.4083084 ,
0.09041793 , -0.2997381 , -0.7528136 , -1.269037 , -1.776355 ,
-2.282719 , -2.770765 , -3.301226 , -3.86602 , -4.443498 , -5.119157 ,
-5.857961 , -6.703572 , -7.392374 , -7.978982 , -8.419954 , -8.906201 ,
-9.416592 , -9.960371 , -10.61076 , -11.35791 , -12.20694 , -13.09808 ,
-14.01462 , -14.95342 , -15.77099 , -16.46989 , -17.01907 , -17.4528 ,
-17.75783 , -17.91834 , -18.00619 , -17.99242 , -17.95625 , -17.69617 ,
-17.28662 , -16.70866 , -16.18466 , -15.72867 , -15.31314 , -15.07428 ,
-15.04266 , -15.08206 , -15.2573 ,
…
…
…
v =
-1.094848 , -1.388215 , -1.7774 , -1.87638 , -1.769933 , -1.374895 ,
-1.068985 , -0.7930366 , -0.6055306 , -0.4153382 , -0.2618484 ,
-0.1600156 , -0.09336649 , -0.0933665 , -0.09336649 , -0.29928 ,
-0.6517227 , -1.185737 , -1.632164 , -2.017494 , -2.310865 , -2.50579 ,
-2.557264 , -2.540595 , -2.557264 , -2.543922 , -2.557264 , -2.534354 ,
-2.340377 , -2.021534 , -1.68185 , -1.31723 , -0.9375733 , -0.6081405 ,
-0.331678 , -0.1343881 , 0.0349655 , 0.1550956 , 0.2184148 , 0.2184148 ,
0.09506586 , -0.1572805 , -0.3115382 , -0.4108411 , -0.3943729 ,
-0.472298 , -0.5880879 , -0.7785369 , -0.8741692 , -0.8741691 ,
-0.852599 , -0.7818746 , -0.6815349 , -0.559538 , -0.4188876 ,
-0.2667979 , -0.1274622 , 0.04737541 , 0.222767 , 0.4350842 , 0.4537844 ,
0.3320421 , 0.02712467 , -0.2381335 , -0.4869398 , -0.7065635 ,
-0.8304897 , -0.8304898 , -0.7885993 , -0.7802173 , -0.8343163 ,
-0.9507663 , -0.9507663 , -0.7676437 , -0.4141116 , 0.03086369 ,
0.5632063 , 1.191833 , 1.741727 , 2.228943 , 2.614007 , 2.988411 ,
3.328841 , 3.646137 , 3.926322 , 4.182895 , 4.416797 , 4.670647 ,
4.945902 , 5.249022 , 5.59187 , 5.97444 , 6.391531 , 6.847597 ,
7.327731 , 7.829793 , 8.284888 , 8.688264 , 9.02784 , 9.276457 ,
9.431317 , 9.460448 , 9.460449 , 9.355015 , 9.180367 , 8.963261 ,
8.718586 , 8.452602 , 8.229078 , 8.049659 , 7.91937 , 7.852942 ,
7.852942 , 7.884611 , 7.904743 , 7.898197 , 7.849684 , 7.732419 ,
7.538555 , 7.259863 , 6.899429 , 6.457614 , 5.938355 , 5.356821 ,
4.723446 , 4.041956 , 3.363791 , 2.691295 , 2.037988 , 1.397454 ,
0.7774612 , 0.1903167 , -0.394103 , -0.9607456 , -1.504752 , -1.999091 ,
-2.432707 , -2.797345 , -3.046965 , -3.053234 , -3.053234 , -3.023986 ,
-2.730067 , -2.301303 , -1.71073 , -0.9851491 , -0.1510314 , 0.7523372 ,
1.677023 , 2.615013 , 3.343748 , 3.86464 , 4.160915 , 4.184602 ,
3.966629 , 3.474625 , 3.016644 , 2.568788 , 2.165158 , 1.824501 ,
1.54189 , 1.360883 , 1.035977 , 0.6115122 , 0.06123456 , -0.5250472 ,
-1.146736 , -1.800962 , -2.367146 , -2.846602 , -3.223269 , -3.491419 ,
-3.655909 , -3.702413 , -3.745571 ,
-0.5370894 , -0.8362811 , -1.261836 , -1.431323 , -1.439548 , -1.197057 ,
-1.010797 , -0.8057232 , -0.6501509 , -0.4674788 , -0.2819314 ,
-0.1039538 , -0.003672248 , -0.03016879 , -0.08807017 , -0.2992798 ,
-0.6517226 , -1.04221 , -1.493191 , -1.87203 , -2.175377 , -2.407176 ,
-2.555969 , -2.599726 , -2.671768 , -2.712004 , -2.75505 , -2.75902 ,
-2.60304 , -2.328378 , -2.018466 , -1.671619 , -1.297618 , -0.9531922 ,
-0.6438362 , -0.3950594 , -0.1701427 , 0.01022664 , 0.1364522 ,
0.1747276 , 0.07895294 , -0.163308 , -0.3119612 , -0.4108411 ,
-0.4113753 , -0.4671833 , -0.514634 , -0.6230809 , -0.6598164 ,
-0.6212637 , -0.5786133 , -0.5099974 , -0.4389736 , -0.3768384 ,
-0.2941028 , -0.184191 , -0.06520332 , 0.04737541 , 0.222767 ,
0.4200633 , 0.4607859 , 0.3320421 , 0.3006737 , 0.07510712 ,
-0.07692574 , -0.2115855 , -0.2936291 , -0.2928487 , -0.292287 ,
-0.2969472 , -0.3166117 , -0.4137569 , -0.4247616 , -0.2855123 ,
-0.01641562 , 0.3228842 , 0.7352448 , 1.223382 , 1.67242 , 2.098369 ,
2.465089 , 2.82751 , 3.167285 , 3.493491 , 3.772224 , 4.01767 ,
4.227215 , 4.45173 , 4.692906 , 4.956936 , 5.272628 , 5.639721 ,
6.05663 , 6.525858 , 7.034393 , 7.579512 , 8.094472 , 8.572382 ,
9.010693 , 9.246994 , 9.600247 , 9.734415 , 9.818371 , 9.768746 ,
9.634361 , 9.467207 , 9.223889 , 8.935048 , 8.680677 , 8.465234 ,
8.293701 , 8.204026 , 8.200741 , 8.238729 , 8.27344 , 8.296266 ,
8.249908 , 8.143016 , 7.933974 , 7.620547 , 7.205623 , 6.692104 ,
6.073251 , 5.356821 , 4.704732 , 3.950881 , 3.223222 , 2.52102 ,
1.863057 , 1.214219 , 0.5855544 , -0.008720525 , -0.6155071 , -1.212232 ,
-1.798152 , -2.302297 , -2.713413 , -2.993824 , -3.092898 , -3.038303 ,
-2.847107 , -2.602939 , -2.127067 , -1.511888 , -0.7935675 ,
-0.009873301 , 0.8129019 , 1.657815 , 2.47968 , 3.274564 , 3.86061 ,
4.223564 , 4.421453 , 4.368874 , 4.113844 , 3.630303 , 3.202399 ,
2.802837 , 2.467391 , 2.162023 , 1.88674 , 1.675342 , 1.306858 ,
0.8053824 , 0.09287734 , -0.5250471 , -1.144472 , -1.850449 , -2.463693 ,
…
…
...
MM5 Data (Left)
MM5 Viz (Right) using Amira
37

Day 4: OS 2010 - Course MT1
Uses of visualization
• Data exploration.
• Hypothesis testing.
• Steering of computation.
• Program/performance debugging.
• Presentation.
39

Day 4: OS 2010 - Course MT1
Hypothesis testing
• Promoters of statistical methods may use linear correlation coefficients to detect relationships between variables, which works wonderfully when there is a linear relationship between variables and when the data is free from anomalies.
• However, if the relationship is quadratic (or exponential, sinusoidal, etc.) a linear algorithm may fail to detect the relationship.
• Similarly, if there are data collection problems that add outliers or if there are discontinuities over the range (e.g. freezing or boiling points of water), then linear correlation may fail.
• A visual presentation is more likely to help researchers find such phenomena and suggest richer hypotheses.
41

Day 4: OS 2010 - Course MT1
Steering of computation
• Understanding the atmospheric dispersion of reacting chemicals is one of the major scientific challenges in the world today.
• Scientists study the problem by constructing a numerical simulation of the dispersion, combining the expertise of the scientist in the physical processes involved, and the skill of numerical mathematicians in the numerical modeling of these processes.
• As part of the analysis, a scientist will want to explore different scenarios: varying the chimney height, varying the terrain, varying the emission rate and varying the wind direction.
• http://www.visualization.leeds.ac.uk/CovisaG/demo.html
43

Day 4: OS 2010 - Course MT1
Steering of computation
• The IRIS Explorer application (shown on the right) provides a 'user friendly' interface to computational steering and visualization.
• This application allows the scientist to control the simulation, experiment with different wind directions and see the visualized results with or without the ground and chimney geometry displayed.
44

Day 4: OS 2010 - Course MT1
Program/performance debugging
• TAU was designed to improve parallel programming productivity by combining advances in parallel debugging, performance evaluation, and program visualization tools.
45

Day 4: OS 2010 - Course MT1
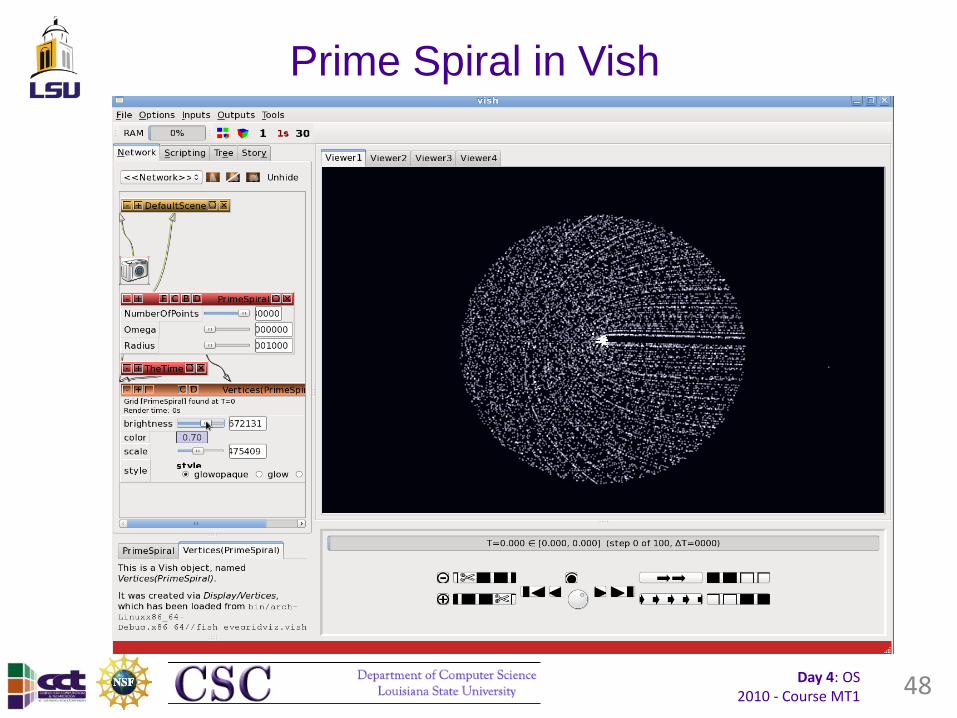
Prime Spiral
• A visualization example: Prime Numbers
• Sequence of numbers whose only factors are
themselves and 1: 2, 3, 5, 7, 11, 13, 17, 19, …
• Important for security / encryption
• We know what a prime number is, and how to determine
if a number is prime – but do we understand prime
numbers?
47

Day 4: OS 2010 - Course MT1
Topics
• Introduction
• Application of Visualization
• Challenges and Approaches
• GnuPlot
• Others
49

Day 4: OS 2010 - Course MT1
Scalability and large dataset
management
• Databases often store data on the terabyte scale. Simulation results are often several gigabytes in size.
• Software growth exceeds hardware growth. Hence, processing speed is limited.
• Visualization algorithms have to process huge amounts of data to generate visual representations. Delay should be minimum.
• Some have to filter the data in order to extract relevant information.
• Visualization algorithms should be scalable.
50

Day 4: OS 2010 - Course MT1
Challenges & Approaches
• High data dimensionality : – Understand relationship between the attributes or dimensions.
– Represent data with high dimensionality or multiple attributes accurately; e.g. representation of flow simulation data attributes that describe the flow like velocity, temperature, pressure, kinetic energy, etc.
– Representation becomes more complex if data is time-dependent.
• Time dependent data
– Questions asked about time-dependent data element
• does it exist, when, how long, where, how often, in what order?
– Challenges
• High-dimensional temporal data.
• Comparability of visualizations for time-frames.
51
Day 4: OS 2010 - Course MT1
Challenges & Approaches
• Cross-Platform Visualization:
– Large variety of hardware, operating systems and display
devices.
– User-friendly visualization tools must adapt to variable
environments.
• Other challenges include defining the audience, the
primary features in the visual depiction, appropriate
visual metaphors, user-friendly design, choosing
compelling visual representations and interactive/pre-
generated graphics
52

Day 4: OS 2010 - Course MT1
GnuPlot
• Portable command-line driven
– interactive data and function plotting utility
• for UNIX, IBM OS/2, MS Windows, DOS, Macintosh, VMS,
Atari and many other platforms.
– copyrighted but freely distributed.
– supported and under development since 1986.
53
Day 4: OS 2010 - Course MT1
GnuPlot
• Plots – 2D and 3D.
• Presentations – lines, points, boxes, contours, vector fields, surfaces, and
various associated text.
• Output – interactive screen terminals
– direct output to printers
– output to many types of file (eps, jpeg, LaTeX, pdf, png, postscript).
54

Day 4: OS 2010 - Course MT1
GnuPlot
• Newest version of GnuPlot is 4.4 (October 2010). Official
web site is http://www.gnuplot.info/ .
• Current version can be obtained at
– http://sourceforge.net/projects/gnuplot/
– several mirror sites you can find at the URL above.
• For a development version:
http://sourceforge.net/projects/gnuplot/
55

Day 4: OS 2010 - Course MT1
GnuPlot
• “exec GnuPlot” shows a GnuPlot command line prompt "GnuPlot> ".
• exit or quit command terminates GnuPlot.
gnuplot> save "savefile.plt"
gnuplot> load "savefile.plt"
% gnuplot savefile.plt
The above command is in batch mode.
56

Day 4: OS 2010 - Course MT1
gnuplot
• 2 basic commands to plot a graph – plot: 2-dimensional graph.
– splot: 3-dimensional graph.
• To plot a function – use the plot/splot command
with a range of X-axis (or X and Y ranges for 3-dim. plot) and the function.
– you can omit the range parameters.
gnuplot> plot [0:5] sin(x)
gnuplot> plot sin(x)
57

Day 4: OS 2010 - Course MT1
gnuplot
• You can change the appearance of your plot by the set command.
gnuplot> help set
gnuplot> set xlabel "X-AXIS“
gnuplot> set ylabel "Y-AXIS"
gnuplot> set xrange [0:5]
gnuplot> set yrange [-2:2]
gnuplot> plot sin(x)
58

Day 4: OS 2010 - Course MT1
gnuplot
• Produces a graph in a Postscript format when “set
terminal postscript” command is given.
• If an output direction is not specified, the produced
Postscript data flow on your screen.
• The set output command changes the destination of
output.
gnuplot> help set
59

Day 4: OS 2010 - Course MT1
gnuplot
• You can use gnuplot as a calculator.
gnuplot> set xrange [-2*pi:2*pi]
gnuplot> a=0.5
gnuplot> print a
0.5
gnuplot> plot a*sin(x)
gnuplot> f(x)=a*sin(x)*cos(x)
• You can also define your
own function.
60

Day 4: OS 2010 - Course MT1
Alternative Styles
• The alternative to lines is points, steps or impulses.
gnuplot> plot “output.dat” using 1:2
with lines
61

Day 4: OS 2010 - Course MT1
Multicolumn Data
1 2 3 4
0.10 9.0484E-01 9.0484E-01 9.0484E-01
0.20 8.1873E-01 8.1871E-01 8.1875E-01
0.30 7.4082E-01 7.4074E-01 7.4091E-01
0.40 6.7032E-01 6.7010E-01 6.7059E-01
0.50 6.0653E-01 6.0606E-01 6.0714E-01
....
4.60 1.0052E-02 -7.0237E-02 5.7632E-01
4.70 9.0953E-03 -7.2510E-02 6.0325E-01
4.80 8.2297E-03 -7.4627E-02 6.3077E-01
4.90 7.4466E-03 -7.6597E-02 6.5886E-01
5.00 6.7379E-03 -7.8431E-02 6.8750E-01
62
gnuplot> set xlabel "x"
gnuplot> set ylabel "y=exp(-x)"
gnuplot> set title "Pade approximation"
gnuplot> plot "output.dat" using 1:2 title
"Analytical" with lines, \
>"output.dat" using 1:3 title "L=1, M=2"
with lines,\
>"output.dat" using 1:4 title "L=2, M=1"
with lines
Day 4: OS 2010 - Course MT1
gnuplot
• Graduations starts with 0, and the interval is 0.5.
– change graduations, use “set {x|y}tics” .
• Controlled by 3 optional numbers after “set tics” command.
– One number: increment.
– Two numbers: initial value and increment.
– Three: initial value, increment and final value.
• Draw small tics inside the interval with the set m{x|y}tics n where n is
the number of divisions.
63
Day 4: OS 2010 - Course MT1
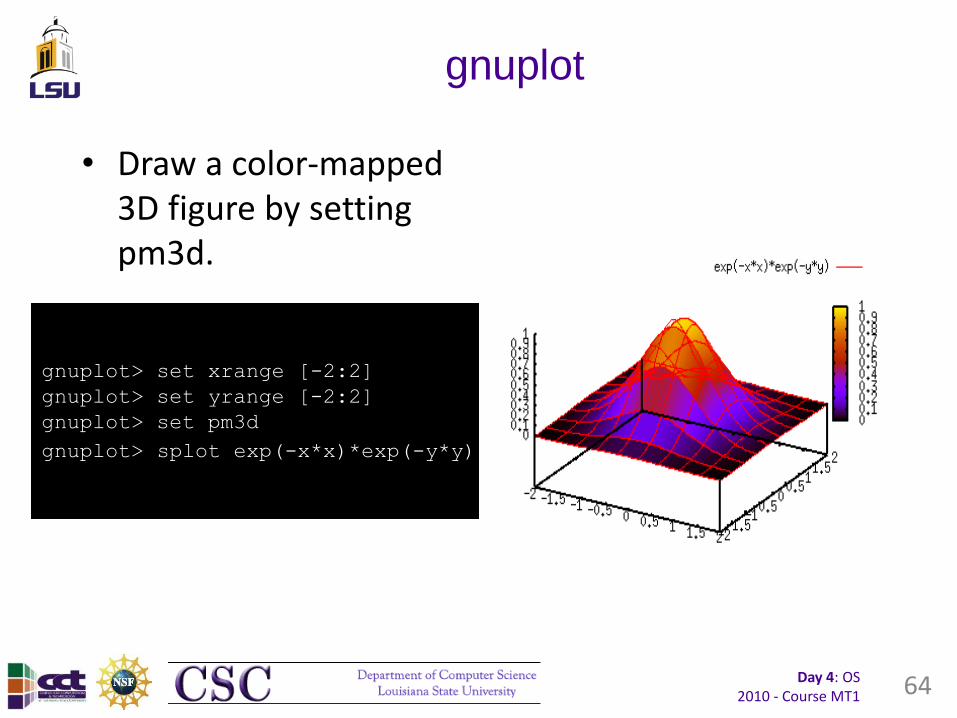
gnuplot
• Draw a color-mapped 3D figure by setting pm3d.
gnuplot> set xrange [-2:2]
gnuplot> set yrange [-2:2]
gnuplot> set pm3d
gnuplot> splot exp(-x*x)*exp(-y*y)
64
Day 4: OS 2010 - Course MT1
gnuplot
• References:
• http://t16web.lanl.gov/Kawano/gnuplot/index-e.html
• http://www.gnuplot.info/
• http://www.duke.edu/~hpgavin/gnuplot.html
• http://sparky.rice.edu/~hartigan/gnuplot.html
• http://www.chemie.fu-berlin.de/chemnet/use/suppl/gpcard.html
• http://gnuplot.flexkb.net/wc.dll?gnu~HomeTopic
65

Day 4: OS 2010 - Course MT1
OpenGL
• Hides the complexities of interfacing with different hardware graphics platforms from the user.
• Accepts primitives such as points, lines and polygons, and converts them into pixels via a graphics pipeline called OpenGL state machine.
• Issues primitives to the graphics pipeline, configures how the pipeline processes these primitives.
66
Day 4: OS 2010 - Course MT1
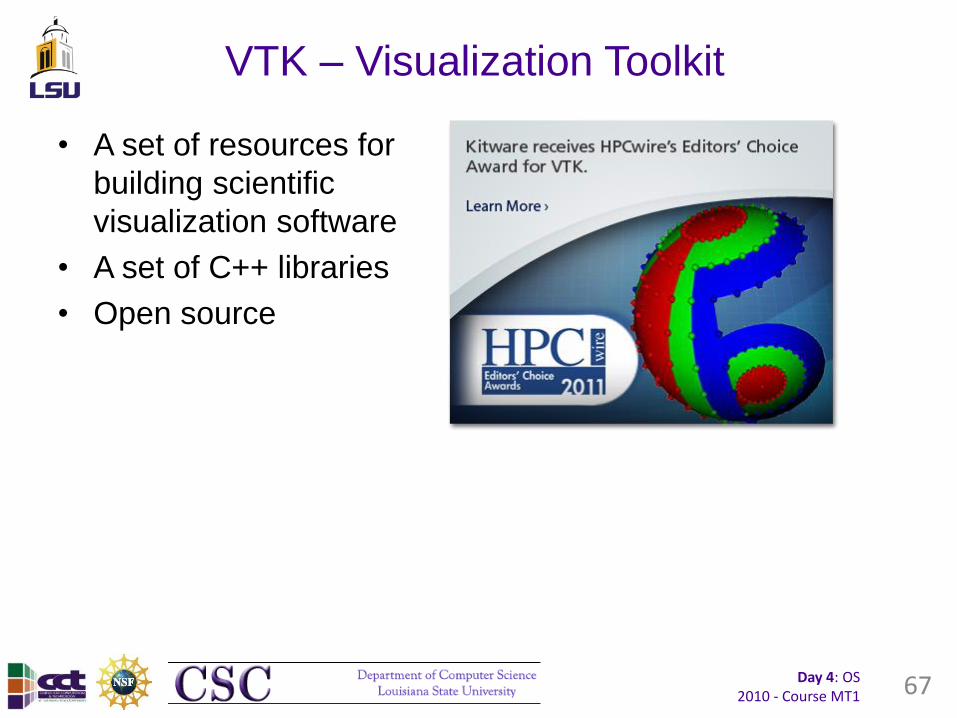
VTK – Visualization Toolkit
• A set of resources for
building scientific
visualization software
• A set of C++ libraries
• Open source
67

Day 4: OS 2010 - Course MT1
ParaView
• Visualization tool
for interactive data
exploration
• Built on VTK
• Open source
68

Day 4: OS 2010 - Course MT1
VisIt Visualization Tool
• Interactive
visualization and
graphical analysis tool
• More sophisticated /
advanced than
ParaView
• Uses VTK
• Open source
69

Day 4: OS 2010 - Course MT1
OpenDX • A programming
environment for data visualization and analysis
• Interactive visualization using a point and click interface.
• Visual and scripting language programming
70

Day 4: OS 2010 - Course MT1
VISH – The Visualization Shell
• Built on VTK
• Interactive
tool
• Highly
scriptable
• Open source
• A product of
LSU
• Written by
Werner
Benger
71