
Basics of Spectrum Analysis/Measurements and the · PDF fileTitle:...
50
Dr. Peter Avitabile University of Massachusetts Lowell Spectrum Analysis 082702 - 1 Copyright © 2001 Mechanical Engineering - 22.403 ME Lab II ME 22.403 Mechanical Lab II Basics of Spectrum Analysis/Measurements and the FFT Analyzer
Transcript of Basics of Spectrum Analysis/Measurements and the · PDF fileTitle:...
Dr. Peter Avitabile University of Massachusetts Lowell Spectrum Analysis 082702 - 1 Copyright © 2001
Mechanical Engineering - 22.403 ME Lab II
ME 22.403
Mechanical Lab II
Basics ofSpectrum Analysis/Measurements
andthe FFT Analyzer
Dr. Peter Avitabile University of Massachusetts Lowell Spectrum Analysis 082702 - 2 Copyright © 2001
Mechanical Engineering - 22.403 ME Lab II
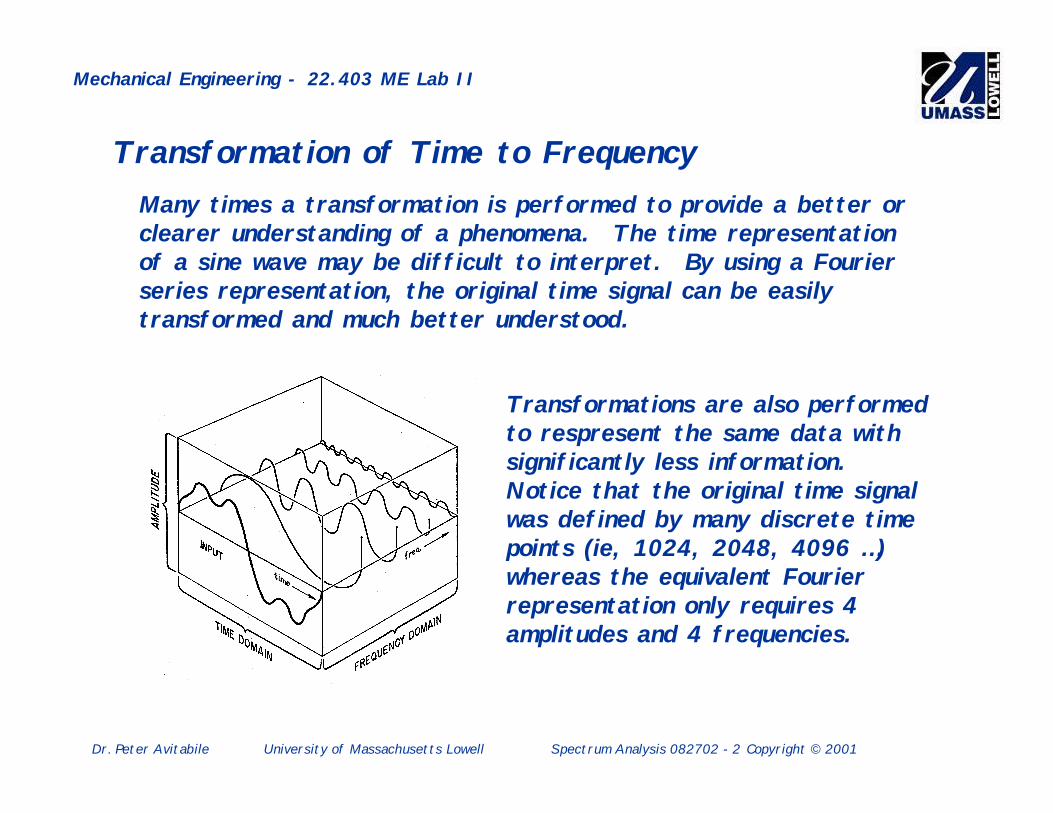
Many times a transformation is performed to provide a better orclearer understanding of a phenomena. The time representationof a sine wave may be difficult to interpret. By using a Fourierseries representation, the original time signal can be easilytransformed and much better understood.
Transformations are also performedto respresent the same data withsignificantly less information.Notice that the original time signalwas defined by many discrete timepoints (ie, 1024, 2048, 4096 …)whereas the equivalent Fourierrepresentation only requires 4amplitudes and 4 frequencies.
Transformation of Time to Frequency

Dr. Peter Avitabile University of Massachusetts Lowell Spectrum Analysis 082702 - 3 Copyright © 2001
Mechanical Engineering - 22.403 ME Lab II
The FFT Analyzer can be broken downinto several pieces which involve thedigitization, filtering, transformationand processing of a signal.
Several items are important here: Digitization and Sampling Quantization of Signal Aliasing Effects Leakage Distortion Windows Weighting Functions The Fourier Transform Measurement Formulation
DISPLAY ADC
ANALOG SIGNAL
ANALOG FILTER
DIGITAL FILTER
DISCRETE DATA
FFT
The Anatomy of the FFT Analyzer
Dr. Peter Avitabile University of Massachusetts Lowell Spectrum Analysis 082702 - 4 Copyright © 2001
Mechanical Engineering - 22.403 ME Lab II
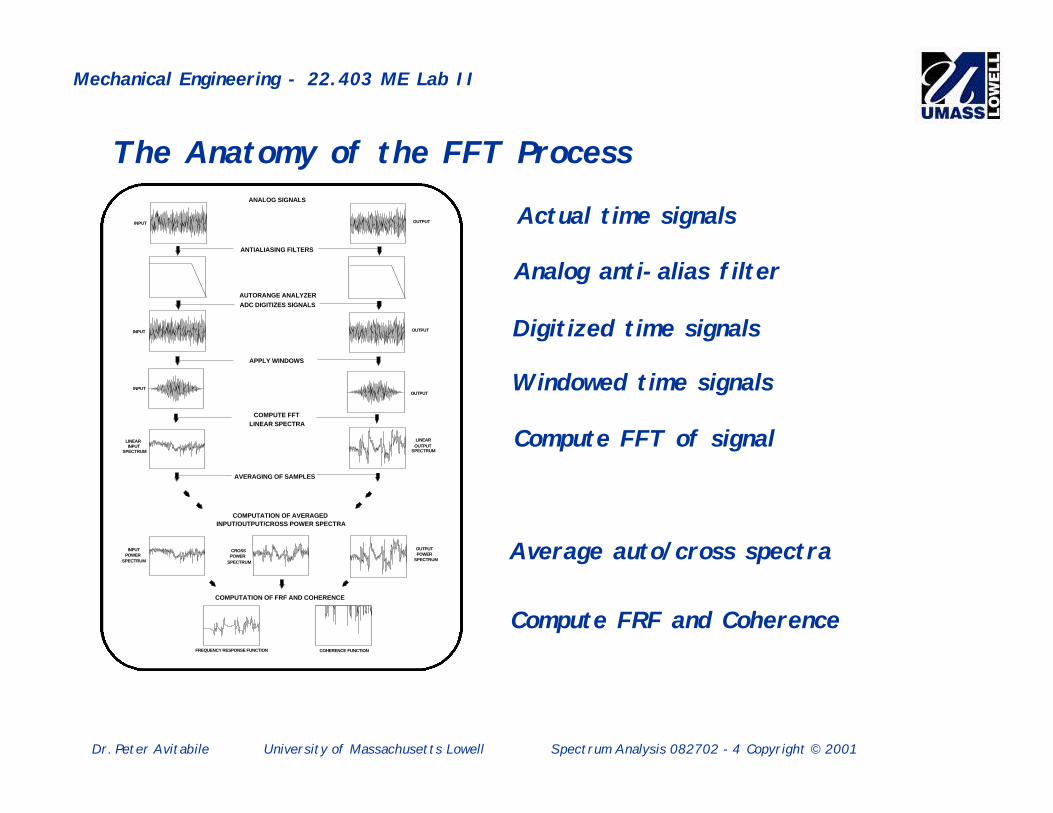
Actual time signals
INPUT OUTPUT
OUTPUT INPUT
FREQUENCY RESPONSE FUNCTION COHERENCE FUNCTION
ANTIALIASING FILTERS
ADC DIGITIZES SIGNALS
INPUT OUTPUT
ANALOG SIGNALS
APPLY WINDOWS
COMPUTE FFT LINEAR SPECTRA
AUTORANGE ANALYZER
AVERAGING OF SAMPLES
INPUT/OUTPUT/CROSS POWER SPECTRA COMPUTATION OF AVERAGED
INPUT SPECTRUM
LINEAR OUTPUT
SPECTRUM
LINEAR
INPUT
SPECTRUM POWER
OUTPUT
SPECTRUM POWER CROSS
SPECTRUM POWER
COMPUTATION OF FRF AND COHERENCE
Analog anti-alias filter
Digitized time signals
Windowed time signals
Compute FFT of signal
Average auto/cross spectra
Compute FRF and Coherence
The Anatomy of the FFT Process
Dr. Peter Avitabile University of Massachusetts Lowell Spectrum Analysis 082702 - 5 Copyright © 2001
Mechanical Engineering - 22.403 ME Lab II
ALIASED SIGNAL
ACTUAL SIGNAL
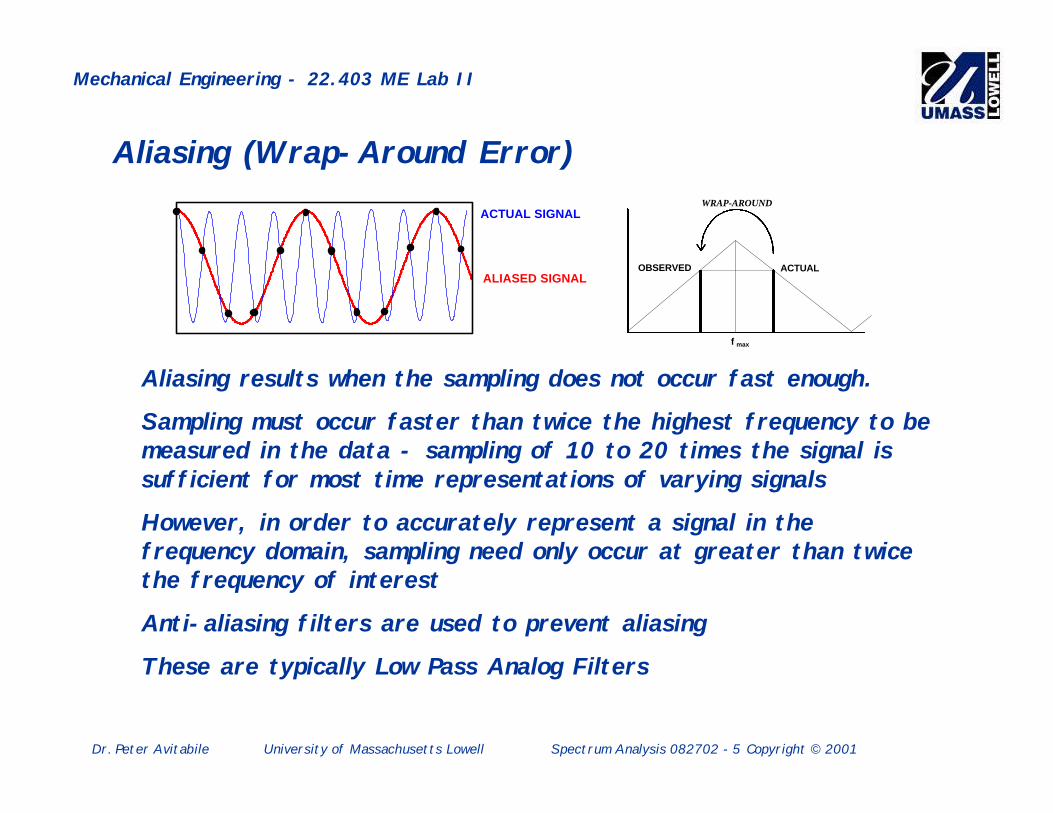
Aliasing results when the sampling does not occur fast enough.
Sampling must occur faster than twice the highest frequency to bemeasured in the data - sampling of 10 to 20 times the signal issufficient for most time representations of varying signals
However, in order to accurately represent a signal in thefrequency domain, sampling need only occur at greater than twicethe frequency of interest
Anti-aliasing filters are used to prevent aliasing
These are typically Low Pass Analog Filters
Aliasing (Wrap-Around Error)
OBSERVED ACTUAL
f max
WRAP-AROUND
Dr. Peter Avitabile University of Massachusetts Lowell Spectrum Analysis 082702 - 6 Copyright © 2001
Mechanical Engineering - 22.403 ME Lab II
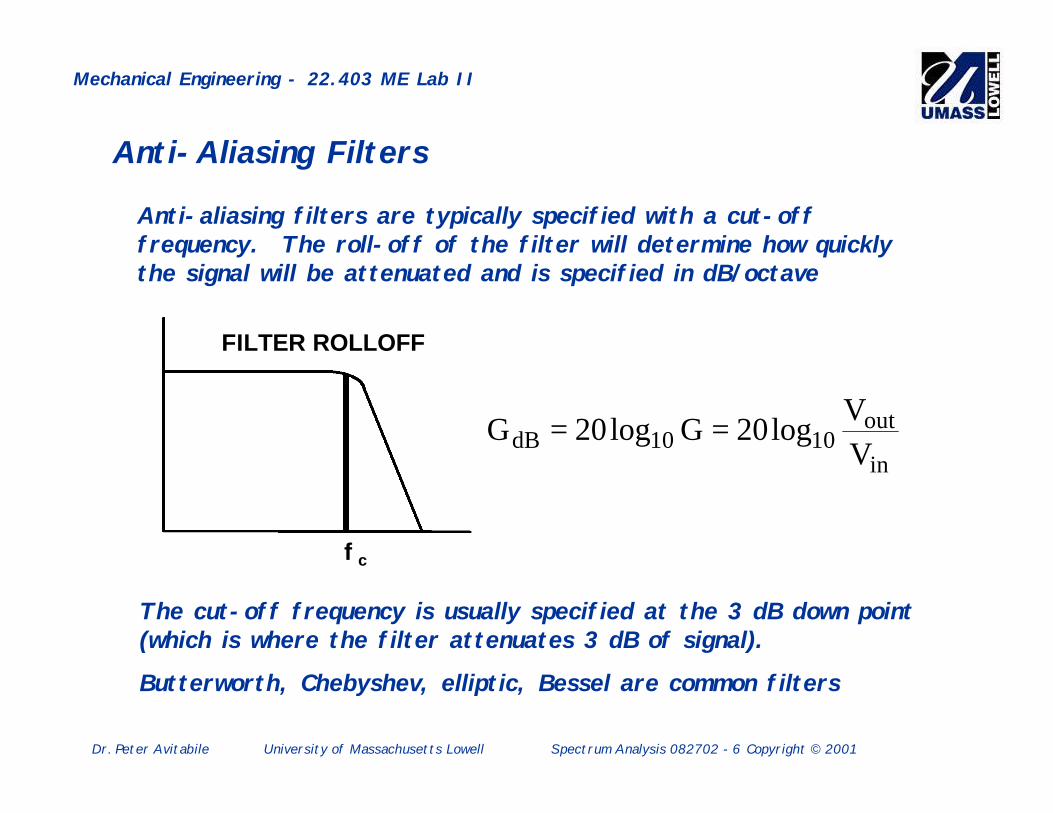
Anti-aliasing filters are typically specified with a cut-offfrequency. The roll-off of the filter will determine how quicklythe signal will be attenuated and is specified in dB/octave
FILTER ROLLOFF
f c
in
out1010dB V
Vlog20Glog20G ==
The cut-off frequency is usually specified at the 3 dB down point(which is where the filter attenuates 3 dB of signal).
Butterworth, Chebyshev, elliptic, Bessel are common filters
Anti-Aliasing Filters

Dr. Peter Avitabile University of Massachusetts Lowell Spectrum Analysis 082702 - 7 Copyright © 2001
Mechanical Engineering - 22.403 ME Lab II
Sampling rate of the ADC is specified as a maximum that ispossible. Basically, the digitizer is taking a series of “snapshots”at a very fast rate as time progresses
Analog Signal DigitalRepresentation
ADC
Digitization of a Signal

Dr. Peter Avitabile University of Massachusetts Lowell Spectrum Analysis 082702 - 8 Copyright © 2001
Mechanical Engineering - 22.403 ME Lab II
Each sample is spaced delta t seconds apart. Sufficient samplingis needed in order to assure that the entire event is captured.The maximum observable frequency is inversely proportional to thedelta time step used
Digital Sample
fmax = 1 / 2 ∆t
Rayleigh Criteria
∆t spacing
Sampling
Dr. Peter Avitabile University of Massachusetts Lowell Spectrum Analysis 082702 - 9 Copyright © 2001
Mechanical Engineering - 22.403 ME Lab II
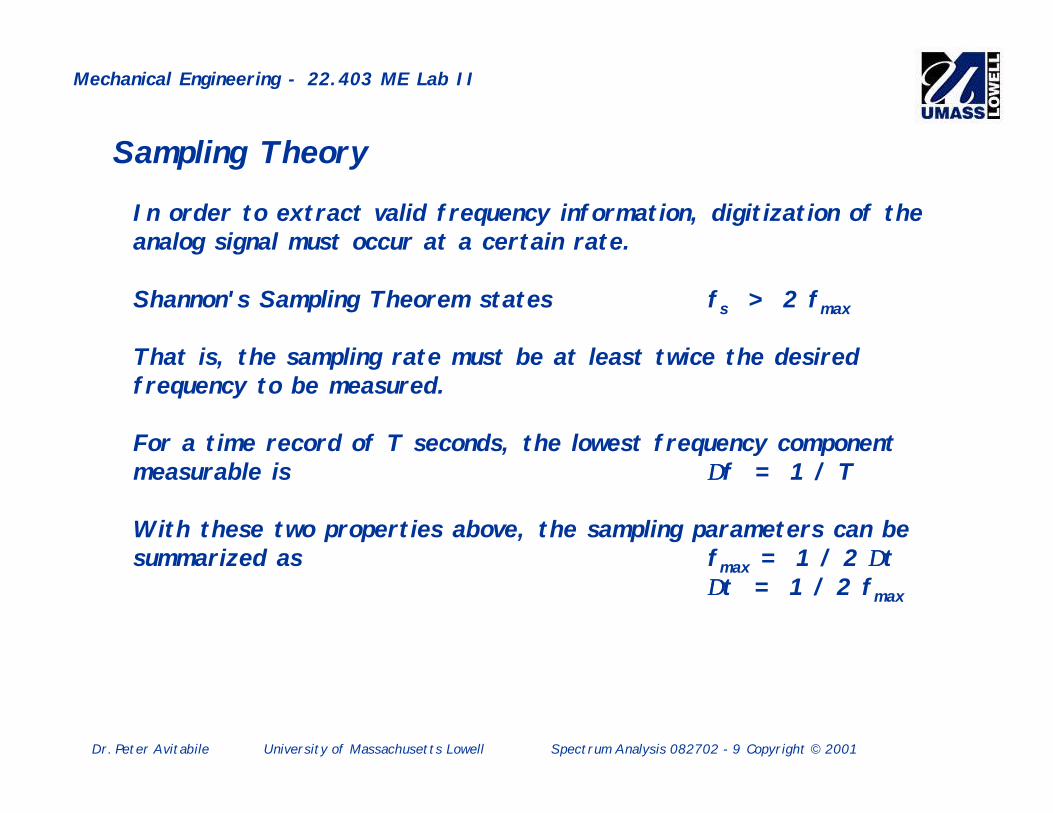
In order to extract valid frequency information, digitization of theanalog signal must occur at a certain rate.
Shannon's Sampling Theorem states fs > 2 fmax
That is, the sampling rate must be at least twice the desiredfrequency to be measured.
For a time record of T seconds, the lowest frequency componentmeasurable is ∆∆f = 1 / T
With these two properties above, the sampling parameters can besummarized as fmax = 1 / 2 ∆∆t
∆∆t = 1 / 2 fmax
Sampling Theory

Dr. Peter Avitabile University of Massachusetts Lowell Spectrum Analysis 082702 - 10 Copyright © 2001
Mechanical Engineering - 22.403 ME Lab II
Sampling Parameters
T=N t ∆∆
Due to the Rayleigh Criteria and Shannon’s Sampling Theorum, thefollowing sampling parameters must be observed.

Dr. Peter Avitabile University of Massachusetts Lowell Spectrum Analysis 082702 - 11 Copyright © 2001
Mechanical Engineering - 22.403 ME Lab II
PICK THEN AND
∆∆t fmax = 1 / (2 ∆∆t) T = N ∆∆t
fmax ∆∆t = 1 / (2 fmax ) ∆∆f = 1/(N ∆∆t)
∆∆f T = 1 / ∆∆f ∆∆t = T / N
T ∆∆f =1 / T fmax = N ∆∆f / 2
Due to the Rayleigh Criteria and Shannon’s Sampling Theorum, thefollowing sampling parameters must be observed.
Sampling Parameters
If we choose ∆f = 5 Hz and N = 1024Then T = 1 / ∆f = 1 / 5 Hz = 0.2 sec
fs = N ∆f = (1024) (5 Hz) = 5120 Hzfmax = fs = (5120 Hz) / 2 = 2560 Hz
Dr. Peter Avitabile University of Massachusetts Lowell Spectrum Analysis 082702 - 12 Copyright © 2001
Mechanical Engineering - 22.403 ME Lab II
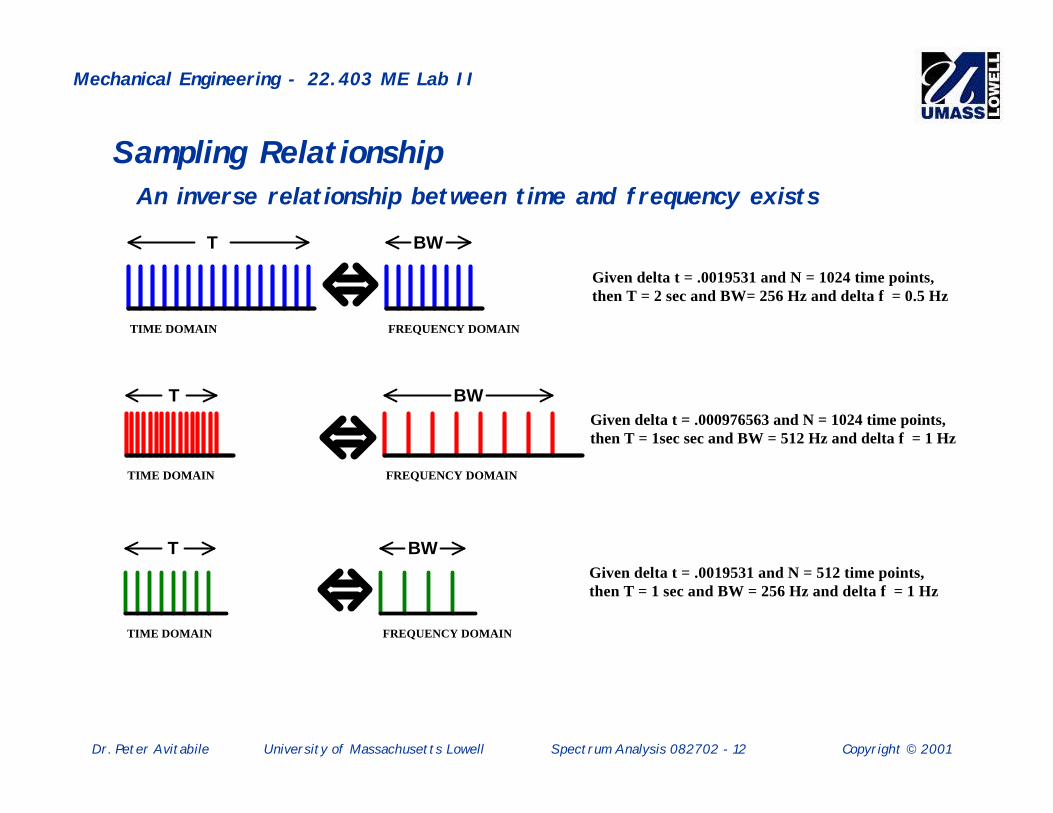
An inverse relationship between time and frequency exists
TIME DOMAIN FREQUENCY DOMAIN
T BW
Given delta t = .0019531 and N = 1024 time points,then T = 2 sec and BW= 256 Hz and delta f = 0.5 Hz
TIME DOMAIN FREQUENCY DOMAIN
BWTGiven delta t = .000976563 and N = 1024 time points,then T = 1sec sec and BW = 512 Hz and delta f = 1 Hz
TIME DOMAIN FREQUENCY DOMAIN
BWTGiven delta t = .0019531 and N = 512 time points,then T = 1 sec and BW = 256 Hz and delta f = 1 Hz
Sampling Relationship

Dr. Peter Avitabile University of Massachusetts Lowell Spectrum Analysis 082702 - 13 Copyright © 2001
Mechanical Engineering - 22.403 ME Lab II
Sampling refers to the rate at which the signal is collected.Quantization refers to the amplitude description of the signal.
A 4 bit ADC has 24 or 16 possible values
A 6 bit ADC has 26 or 64 possible values
A 12 bit ADC has 212 or 4096 possible values
ADC BIT STEPS
Quantization Error

Dr. Peter Avitabile University of Massachusetts Lowell Spectrum Analysis 082702 - 14 Copyright © 2001
Mechanical Engineering - 22.403 ME Lab II
Quantization errors refer to the accuracy of the amplitudemeasured. The 6 bit ADC represents the signal shown muchbetter than a 4 bit ADC
A D C
M A X
R A
N G E
A D C
M A X
R A
N G E
Quantization Error

Dr. Peter Avitabile University of Massachusetts Lowell Spectrum Analysis 082702 - 15 Copyright © 2001
Mechanical Engineering - 22.403 ME Lab II
Underloading of the ADC causes amplitude errors in the signal
All of the availabledynamic range of theanalog to digitalconverter is not usedeffectively
0.5 volt signal
This causes amplitudeand phase distortionof the measuredsignal in both the timeand frequency domains
10 voltrangeon
ADC
Quantization Error
Dr. Peter Avitabile University of Massachusetts Lowell Spectrum Analysis 082702 - 16 Copyright © 2001
Mechanical Engineering - 22.403 ME Lab II
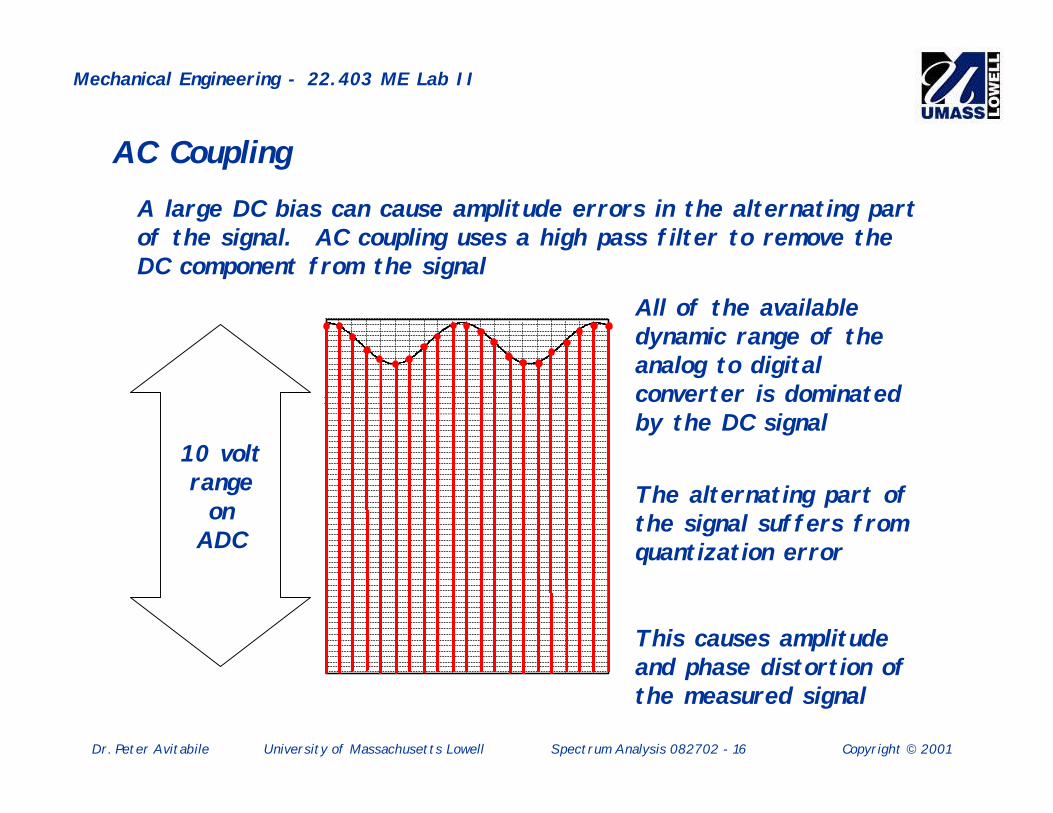
A large DC bias can cause amplitude errors in the alternating partof the signal. AC coupling uses a high pass filter to remove theDC component from the signal
All of the availabledynamic range of theanalog to digitalconverter is dominatedby the DC signal
The alternating part ofthe signal suffers fromquantization error
This causes amplitudeand phase distortion ofthe measured signal
10 voltrangeon
ADC
AC Coupling
Dr. Peter Avitabile University of Massachusetts Lowell Spectrum Analysis 082702 - 17 Copyright © 2001
Mechanical Engineering - 22.403 ME Lab II
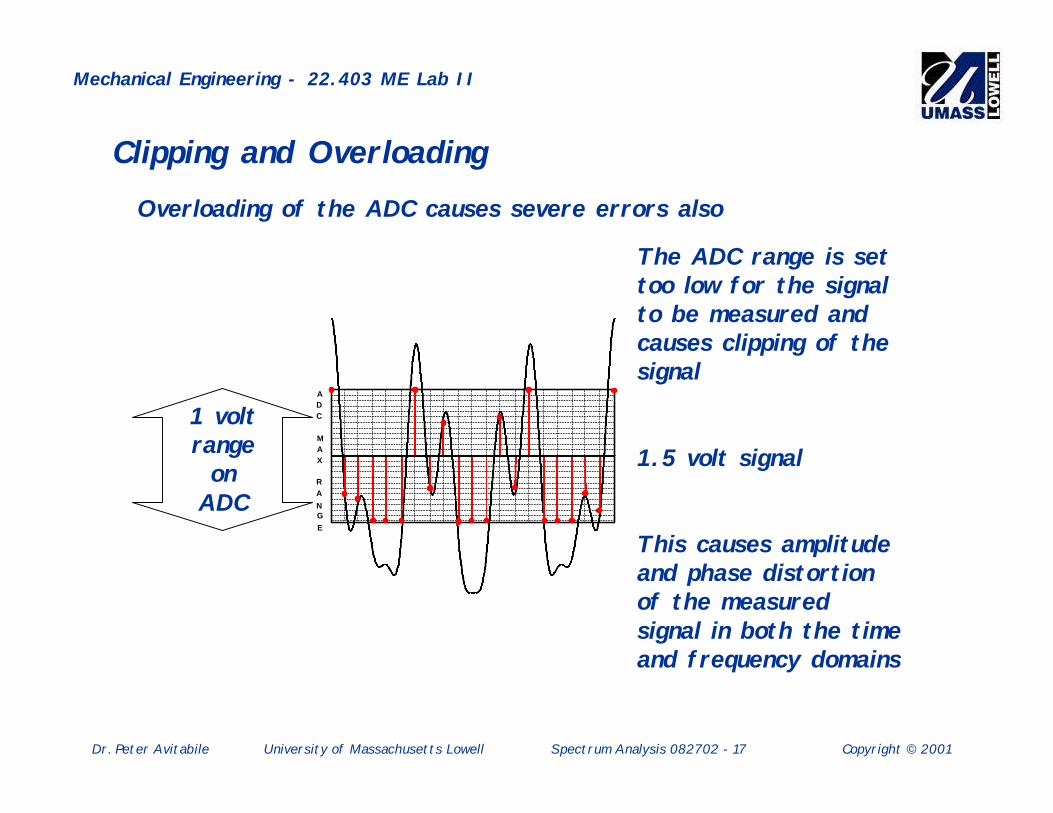
Overloading of the ADC causes severe errors also
The ADC range is settoo low for the signalto be measured andcauses clipping of thesignal
1.5 volt signal
This causes amplitudeand phase distortionof the measuredsignal in both the timeand frequency domains
1 voltrangeon
ADC
A D C
M A X
R A
N G
E
Clipping and Overloading

Dr. Peter Avitabile University of Massachusetts Lowell Spectrum Analysis 082702 - 18 Copyright © 2001
Mechanical Engineering - 22.403 ME Lab II
The Fourier Transform
∫∞+
∞−
π−= dte)t(x)f(S ft2jx
∫∞+
∞−
π= dfe)f(S)t(x ft2jx
and Inverse Fourier Transform
Forward Fourier Transform
Dr. Peter Avitabile University of Massachusetts Lowell Spectrum Analysis 082702 - 19 Copyright © 2001
Mechanical Engineering - 22.403 ME Lab II
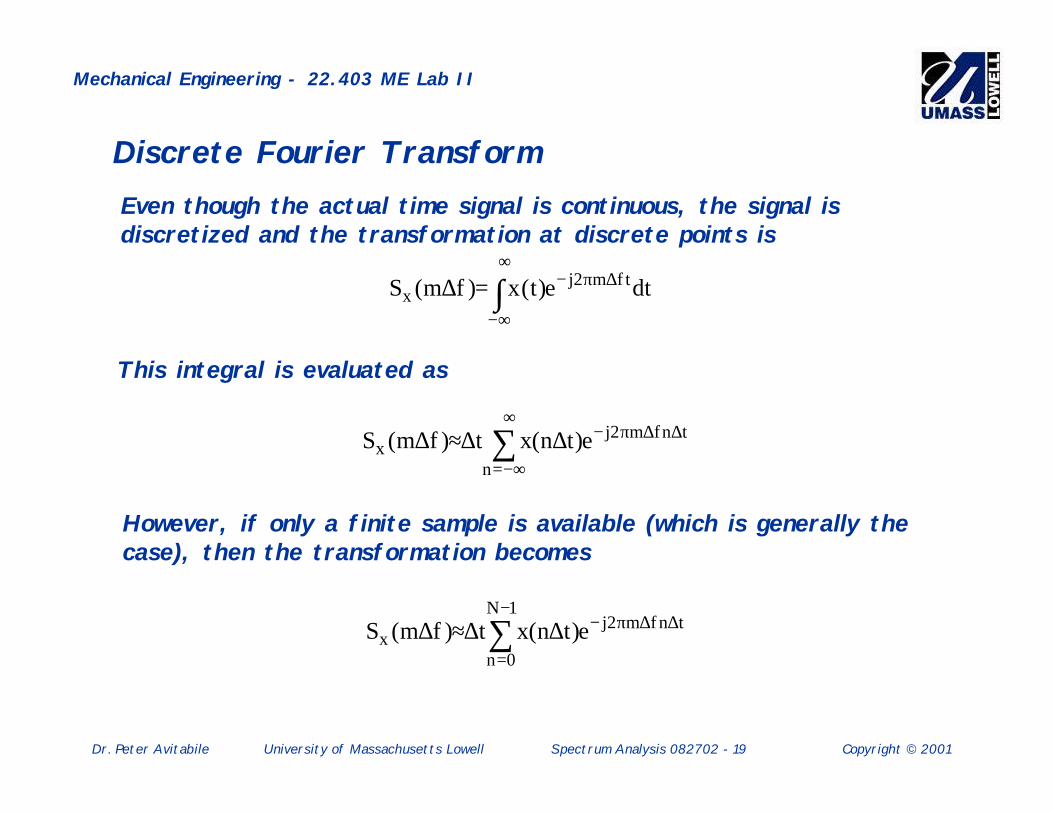
Discrete Fourier TransformEven though the actual time signal is continuous, the signal isdiscretized and the transformation at discrete points is
∫∞+
∞−
∆π−=∆ dte)t(x)fm(S tfm2jx
This integral is evaluated as
However, if only a finite sample is available (which is generally thecase), then the transformation becomes
∑∞+
−∞=
∆∆π−∆∆≈∆n
tnfm2jx e)tn(xt)fm(S
∑−
=
∆∆π−∆∆≈∆1N
0n
tnfm2jx e)tn(xt)fm(S
Dr. Peter Avitabile University of Massachusetts Lowell Spectrum Analysis 082702 - 20 Copyright © 2001
Mechanical Engineering - 22.403 ME Lab II
T
ACTUAL
DATA
CAPTURED
DATA
RECONTRUCTED
DATA
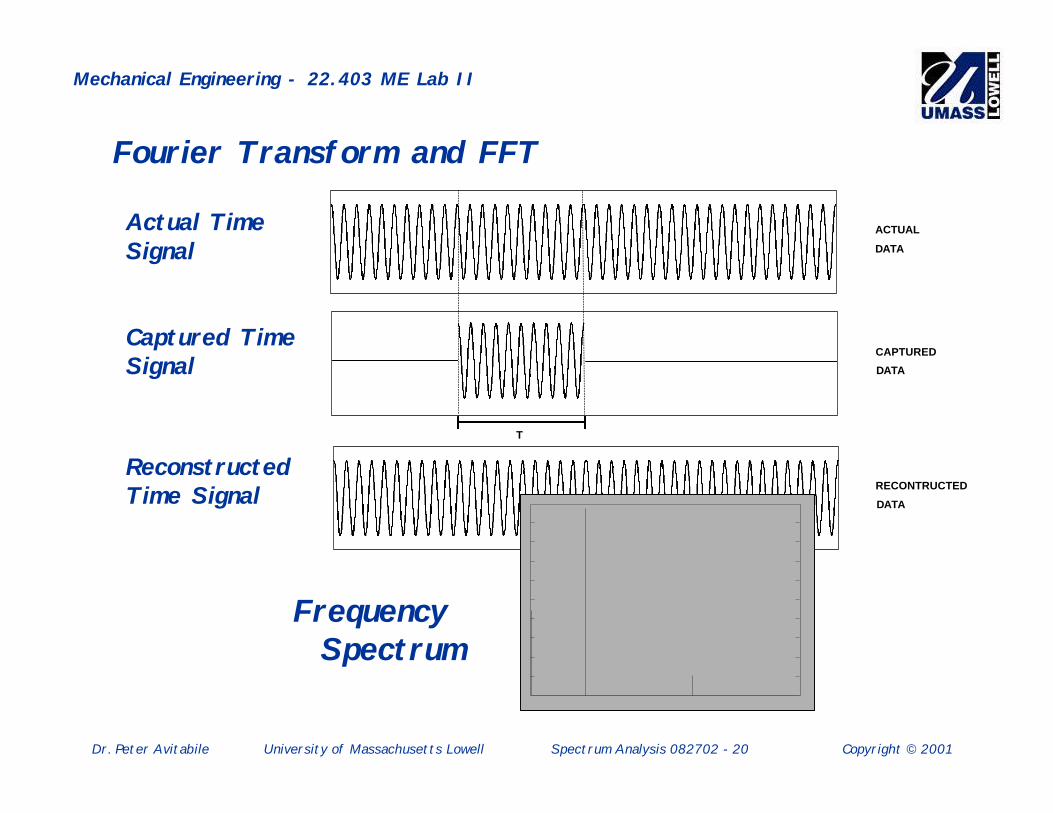
Fourier Transform and FFT
Actual TimeSignal
Captured TimeSignal
ReconstructedTime Signal
Frequency Spectrum

Dr. Peter Avitabile University of Massachusetts Lowell Spectrum Analysis 082702 - 21 Copyright © 2001
Mechanical Engineering - 22.403 ME Lab II
T
ACTUAL
DATA
CAPTURED
DATA
RECONTRUCTED
DATA
Fourier Transform and FFT
Actual TimeSignal
Captured TimeSignal
ReconstructedTime Signal
Frequency Spectrum
Dr. Peter Avitabile University of Massachusetts Lowell Spectrum Analysis 082702 - 22 Copyright © 2001
Mechanical Engineering - 22.403 ME Lab II
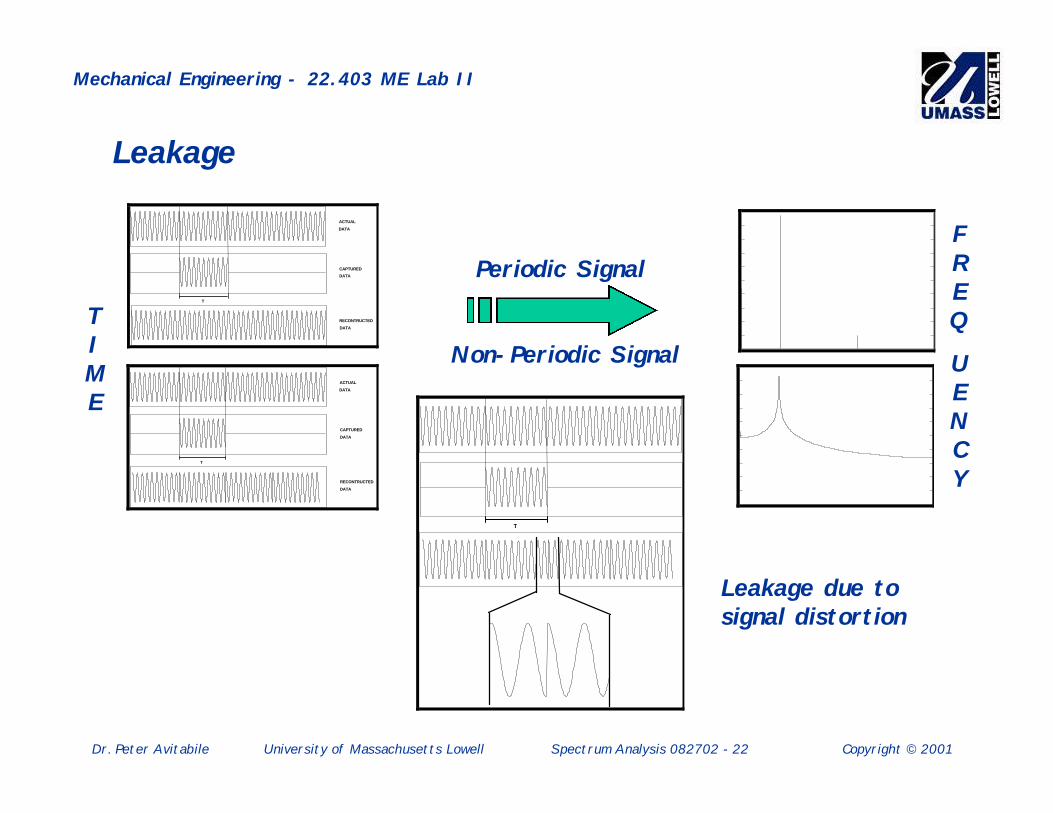
Leakage
T
ACTUAL
DATA
CAPTURED
DATA
RECONTRUCTED
DATA
T
ACTUAL
DATA
CAPTURED
DATA
RECONTRUCTED
DATA
T
TIME
FREQ
UENCY
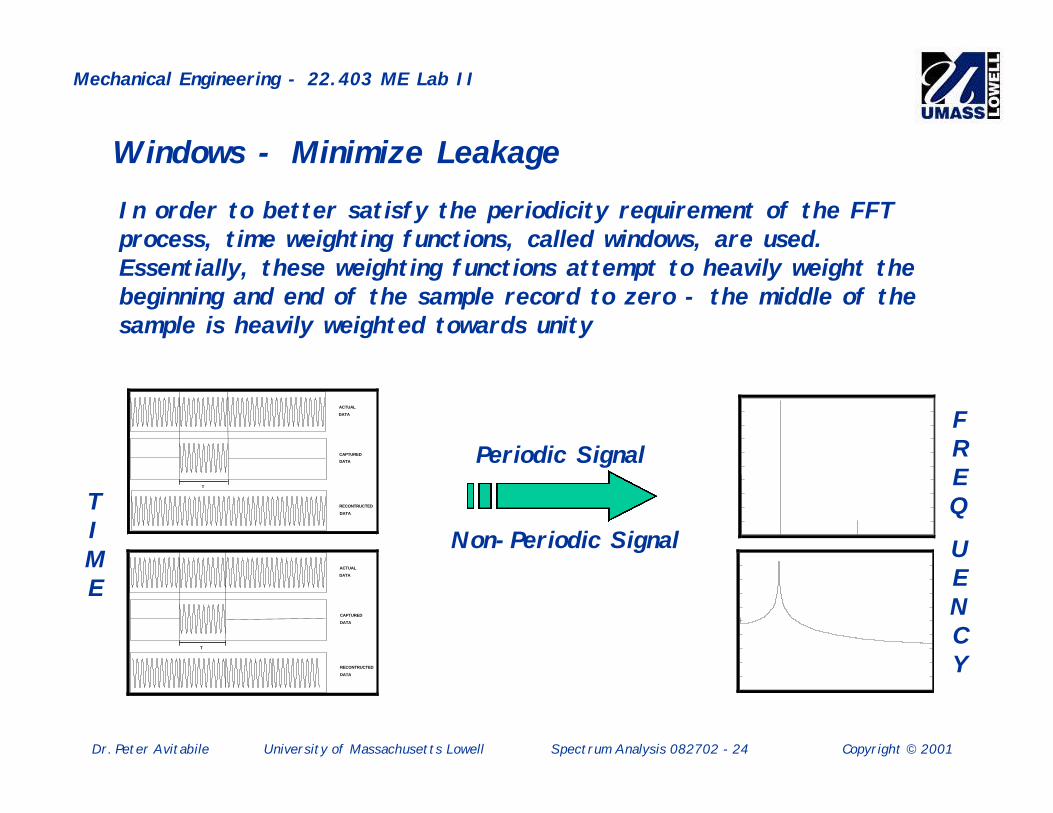
Periodic Signal
Non-Periodic Signal
Leakage due tosignal distortion

Dr. Peter Avitabile University of Massachusetts Lowell Spectrum Analysis 082702 - 23 Copyright © 2001
Mechanical Engineering - 22.403 ME Lab II
Leakage
When the measured signal is not periodic in the sample interval,incorrect estimates of the amplitude and frequency occur. Thiserror is referred to as leakage.
Basically, the actual energy distribution is smeared across thefrequency spectrum and energy leaks from a particular ∆∆f intoadjacent ∆∆f s.
Leakage is probably the most common and most serious digitalsignal processing error. Unlike aliasing, the effects of leakagecan not be eliminated.
Dr. Peter Avitabile University of Massachusetts Lowell Spectrum Analysis 082702 - 24 Copyright © 2001
Mechanical Engineering - 22.403 ME Lab II
Windows - Minimize LeakageIn order to better satisfy the periodicity requirement of the FFTprocess, time weighting functions, called windows, are used.Essentially, these weighting functions attempt to heavily weight thebeginning and end of the sample record to zero - the middle of thesample is heavily weighted towards unity
T
ACTUAL
DATA
CAPTURED
DATA
RECONTRUCTED
DATA
T
ACTUAL
DATA
CAPTURED
DATA
RECONTRUCTED
DATA
TIME
FREQ
UENCY
Periodic Signal
Non-Periodic Signal
Dr. Peter Avitabile University of Massachusetts Lowell Spectrum Analysis 082702 - 25 Copyright © 2001
Mechanical Engineering - 22.403 ME Lab II
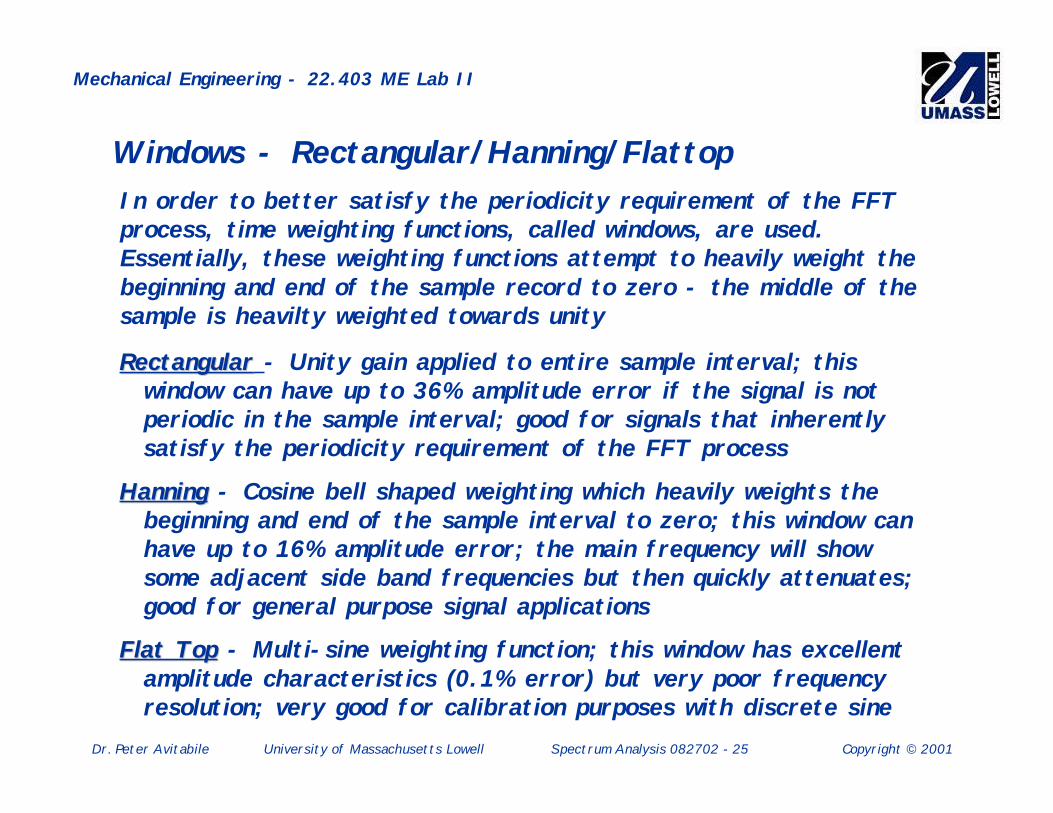
Windows - Rectangular/Hanning/FlattopIn order to better satisfy the periodicity requirement of the FFTprocess, time weighting functions, called windows, are used.Essentially, these weighting functions attempt to heavily weight thebeginning and end of the sample record to zero - the middle of thesample is heavilty weighted towards unity
RectangularRectangular - Unity gain applied to entire sample interval; thiswindow can have up to 36% amplitude error if the signal is notperiodic in the sample interval; good for signals that inherentlysatisfy the periodicity requirement of the FFT process
HanningHanning - Cosine bell shaped weighting which heavily weights thebeginning and end of the sample interval to zero; this window canhave up to 16% amplitude error; the main frequency will showsome adjacent side band frequencies but then quickly attenuates;good for general purpose signal applications
Flat TopFlat Top - Multi-sine weighting function; this window has excellentamplitude characteristics (0.1% error) but very poor frequencyresolution; very good for calibration purposes with discrete sine
Dr. Peter Avitabile University of Massachusetts Lowell Spectrum Analysis 082702 - 26 Copyright © 2001
Mechanical Engineering - 22.403 ME Lab II
Windows - Rectangular/Hanning/Flattop
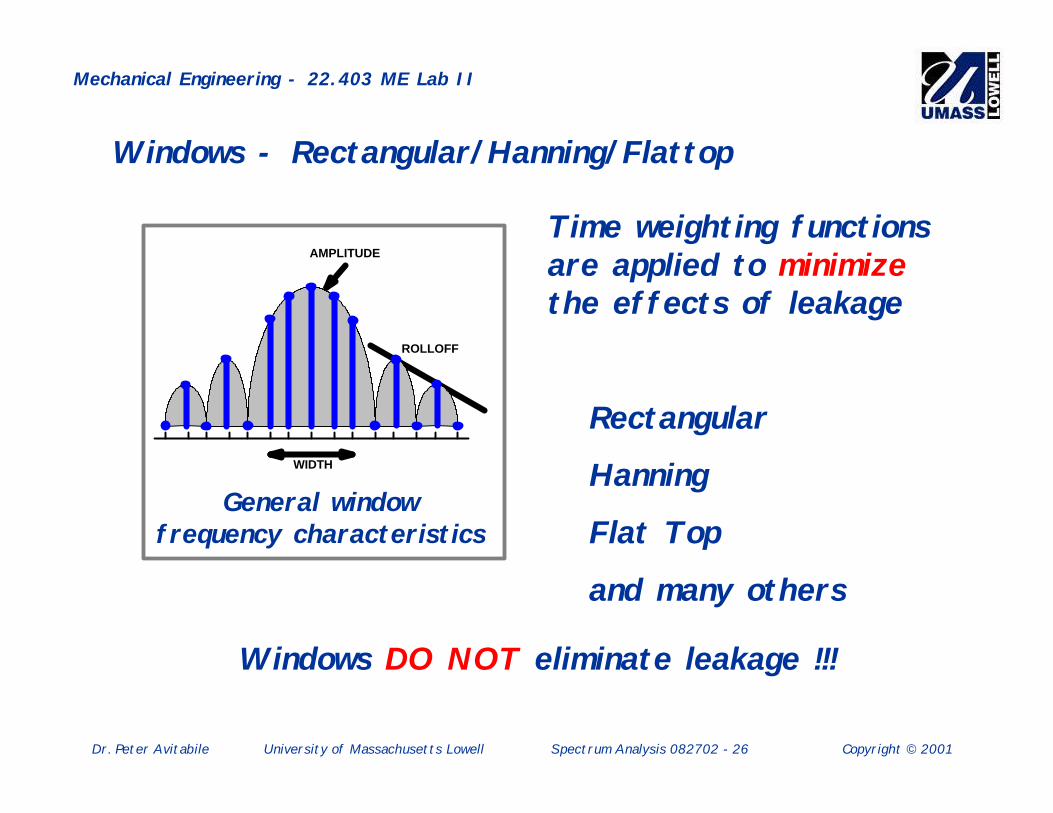
Time weighting functionsare applied to minimizethe effects of leakage
Rectangular
Hanning
Flat Top
and many others
Windows DO NOT eliminate leakage !!!
AMPLITUDE
ROLLOFF
WIDTH
General windowfrequency characteristics

Dr. Peter Avitabile University of Massachusetts Lowell Spectrum Analysis 082702 - 27 Copyright © 2001
Mechanical Engineering - 22.403 ME Lab II
Windows - Rectangular
-16 15.9375-10 0 10-14 -12 -8 -6 -4 -2 2 4 6 8 12 14-100
0
-70
- 90
- 80
-60
-50
-40
-30
-20
-10
dB
Amplitude
-3 -2 -1 0 1 2-2.5 -1.5 -0.5 0.5 1.5 2.5
The rectangular window function is shown below. The main lobe is narrow, but the side lobes are very largeand roll off quite slowly. The main lobe is quite rounded and can introduce large measurement errors. Therectangular window can have amplitude errors as large as 36%.

Dr. Peter Avitabile University of Massachusetts Lowell Spectrum Analysis 082702 - 28 Copyright © 2001
Mechanical Engineering - 22.403 ME Lab II
Amplitude
-3 -2 -1 0 1 2-2.5 -1.5 -0.5 0.5 1.5 2.5-16 15.9375-10 0 10-14 -12 -8 -6 -4 -2 2 4 6 8 12 14-100
0
-70
- 90
- 80
-60
-50
-40
-30
-20
-10
dB
The hanning window function is shown below. The first few side lobes are rather large, but a 60 dB/octaveroll-off rate is helpful. This window is most useful for searching operations where good frequencyresolution is needed, but amplitude accuracy is not important; the hanning window will have amplitude errorsof as much as 16%.
Windows - Hanning

Dr. Peter Avitabile University of Massachusetts Lowell Spectrum Analysis 082702 - 29 Copyright © 2001
Mechanical Engineering - 22.403 ME Lab II
Amplitude
-3 -2 -1 0 1 2-2.5 -1.5 -0.5 0.5 1.5 2.5-16 15.9375-10 0 10-14 -12 -8 -6 -4 -2 2 4 6 8 12 14-100
0
-70
- 90
- 80
-60
-50
-40
-30
-20
-10
dB
The flat top window function is shown below. The main lobe is very flat and spreads over several frequencybins. While this window suffers from frequency resolution, the amplitude can be measured very accuratelyto 0.1%.
Windows - Flat Top

Dr. Peter Avitabile University of Massachusetts Lowell Spectrum Analysis 082702 - 30 Copyright © 2001
Mechanical Engineering - 22.403 ME Lab II
Windows
-16 15.9375-10 0 10-14 -12 -8 -6 -4 -2 2 4 6 8 12 14-100
0
-70
- 90
- 80
-60
-50
-40
-30
-20
-10
dB
-16 15.9375-10 0 10-14 -12 -8 -6 -4 -2 2 4 6 8 12 14-100
0
-70
- 90
- 80
-60
-50
-40
-30
-20
-10
dB
-16 15.9375-10 0 10-14 -12 -8 -6 -4 -2 2 4 6 8 12 14-100
0
-70
- 90
- 80
-60
-50
-40
-30
-20
-10
dB
Rectangular Hanning Flat Top
Dr. Peter Avitabile University of Massachusetts Lowell Spectrum Analysis 082702 - 31 Copyright © 2001
Mechanical Engineering - 22.403 ME Lab II
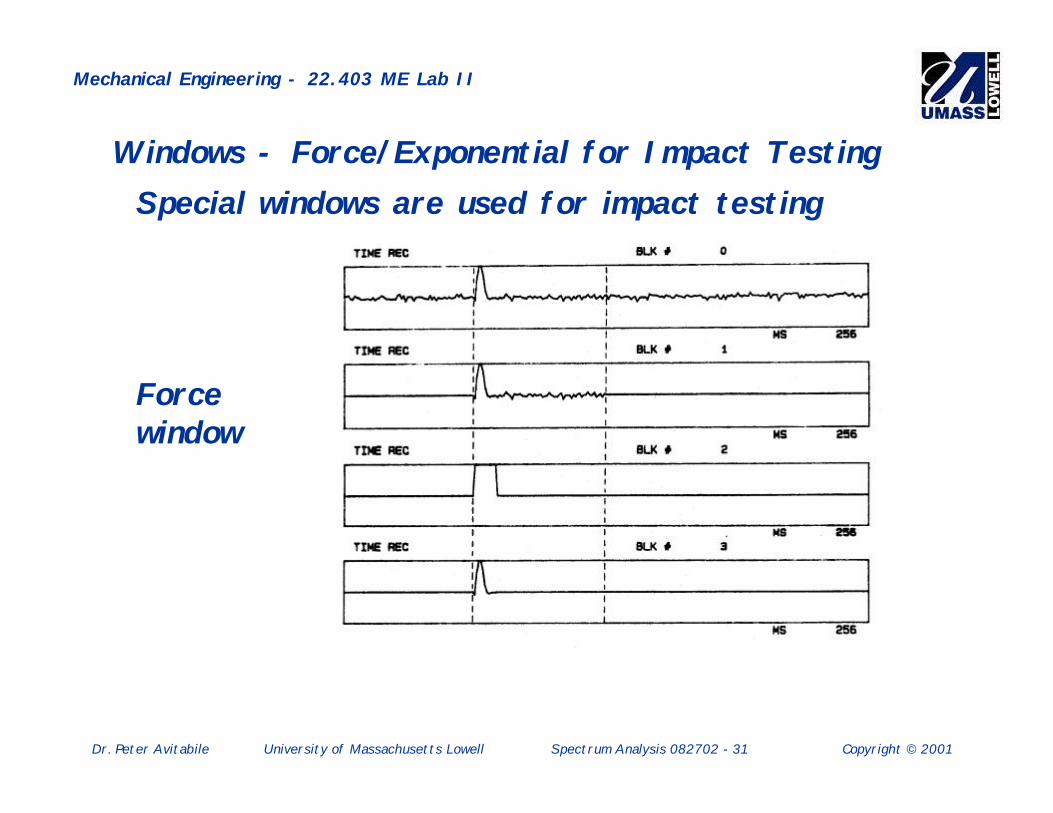
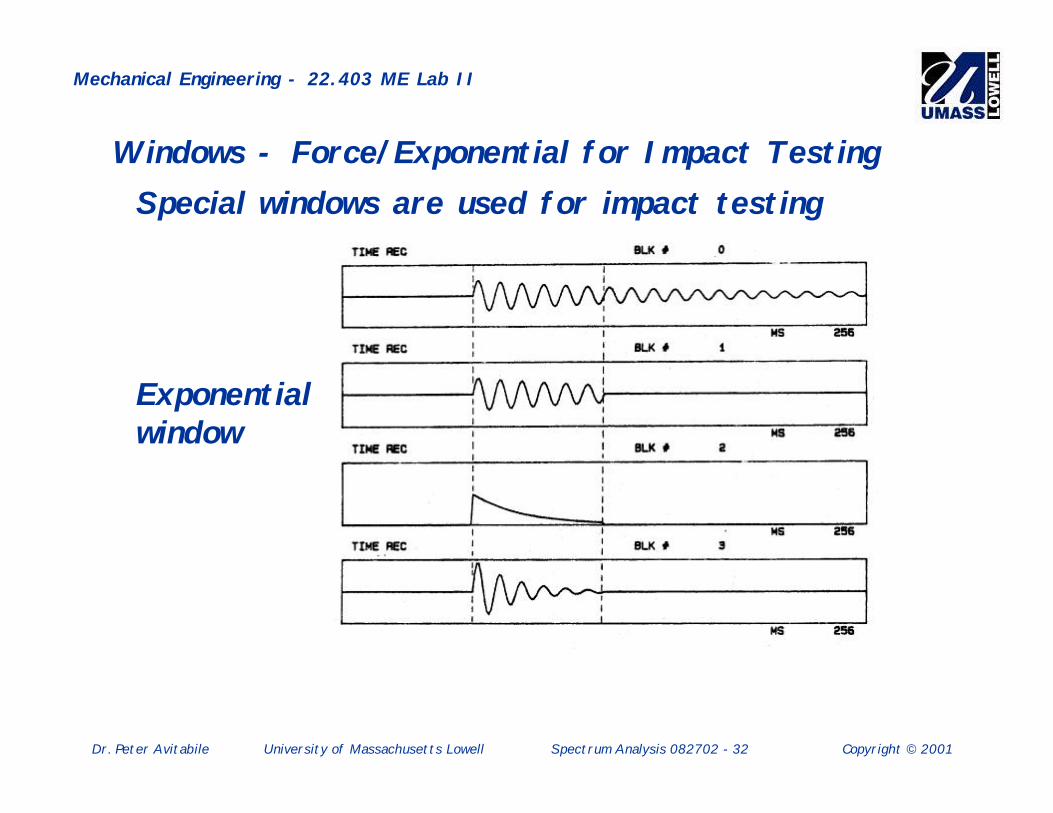
Windows - Force/Exponential for Impact TestingSpecial windows are used for impact testing
Forcewindow
Dr. Peter Avitabile University of Massachusetts Lowell Spectrum Analysis 082702 - 32 Copyright © 2001
Mechanical Engineering - 22.403 ME Lab II
Windows - Force/Exponential for Impact TestingSpecial windows are used for impact testing
Exponentialwindow
Dr. Peter Avitabile University of Massachusetts Lowell Spectrum Analysis 082702 - 33 Copyright © 2001
Mechanical Engineering - 22.403 ME Lab II
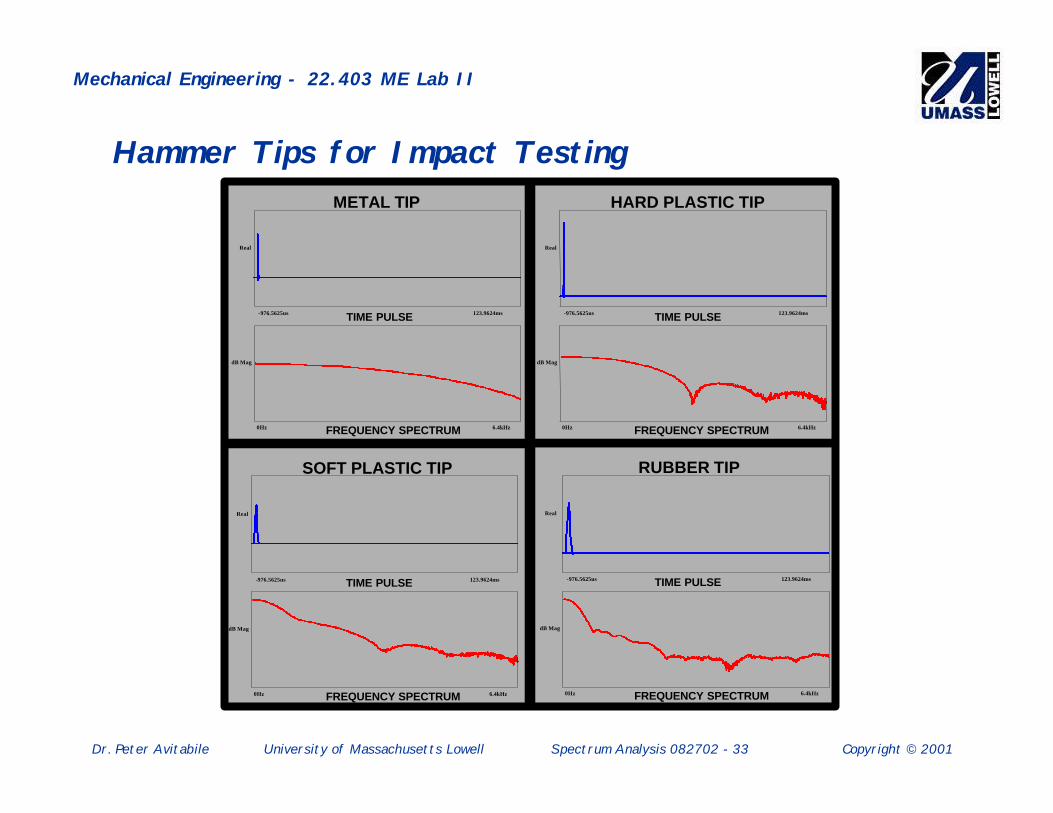
Hammer Tips for Impact Testing
Real
-976.5625us 123.9624ms
dB Mag
0Hz 6.4kHz
METAL TIP
TIME PULSE
FREQUENCY SPECTRUM
TIME PULSE
FREQUENCY SPECTRUM
Real
-976.5625us 123.9624ms
dB Mag
0Hz 6.4kHz
HARD PLASTIC TIP
TIME PULSE
FREQUENCY SPECTRUM
Real
-976.5625us 123.9624ms
dB Mag
0Hz 6.4kHz
SOFT PLASTIC TIP
TIME PULSE
FREQUENCY SPECTRUM
Real
-976.5625us 123.9624ms
dB Mag
0Hz 6.4kHz
RUBBER TIP

Dr. Peter Avitabile University of Massachusetts Lowell Spectrum Analysis 082702 - 34 Copyright © 2001
Mechanical Engineering - 22.403 ME Lab II
Pretrigger Delay and Double Impacts
NO PRETRIGGER USED
PRETRIGGER SPECIFIED
t = 0
t = 0
DOUBLE IMPACT
TIME PULSE
FREQUENCY SPECTRUM
Real
-976.5625us 998.53516ms
dB Mag
0Hz 800Hz
DOUBLE IMPACT
TIME PULSE
FREQUENCY SPECTRUM
Real
-976.5625us 998.53516ms
dB Mag
0Hz 800Hz
Pretrigger delay used toreduce the amount offrequency spectrum distortion
Double impacts should be avoided due tothe distortion of the frequency spectrumand force dropout that can occur
Dr. Peter Avitabile University of Massachusetts Lowell Spectrum Analysis 082702 - 35 Copyright © 2001
Mechanical Engineering - 22.403 ME Lab II
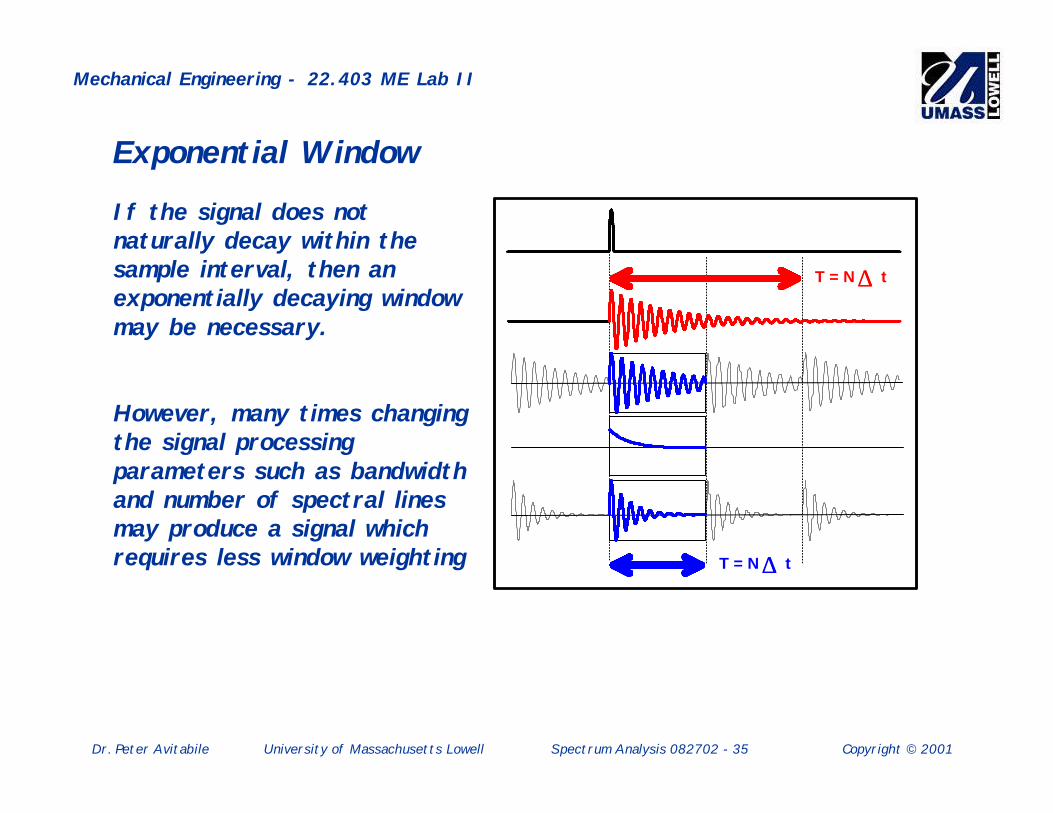
Exponential Window
If the signal does notnaturally decay within thesample interval, then anexponentially decaying windowmay be necessary.
However, many times changingthe signal processingparameters such as bandwidthand number of spectral linesmay produce a signal whichrequires less window weighting T = N t ∆∆
T = N t ∆∆
Dr. Peter Avitabile University of Massachusetts Lowell Spectrum Analysis 082702 - 36 Copyright © 2001
Mechanical Engineering - 22.403 ME Lab II
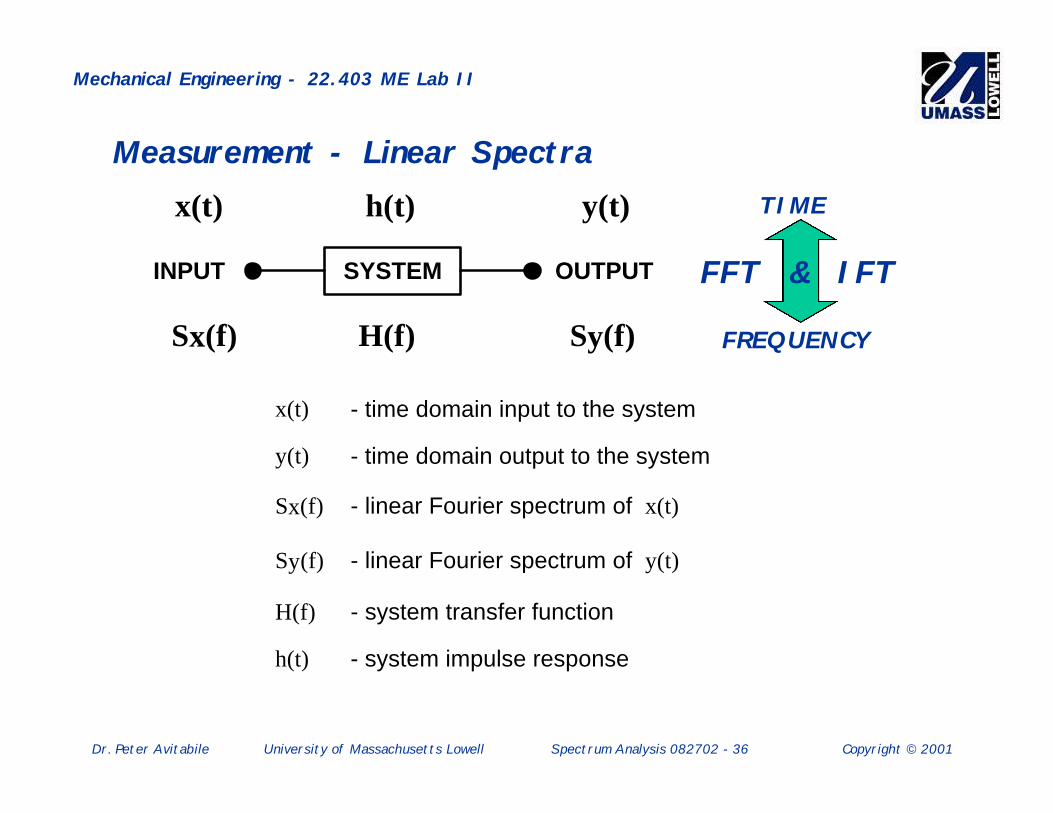
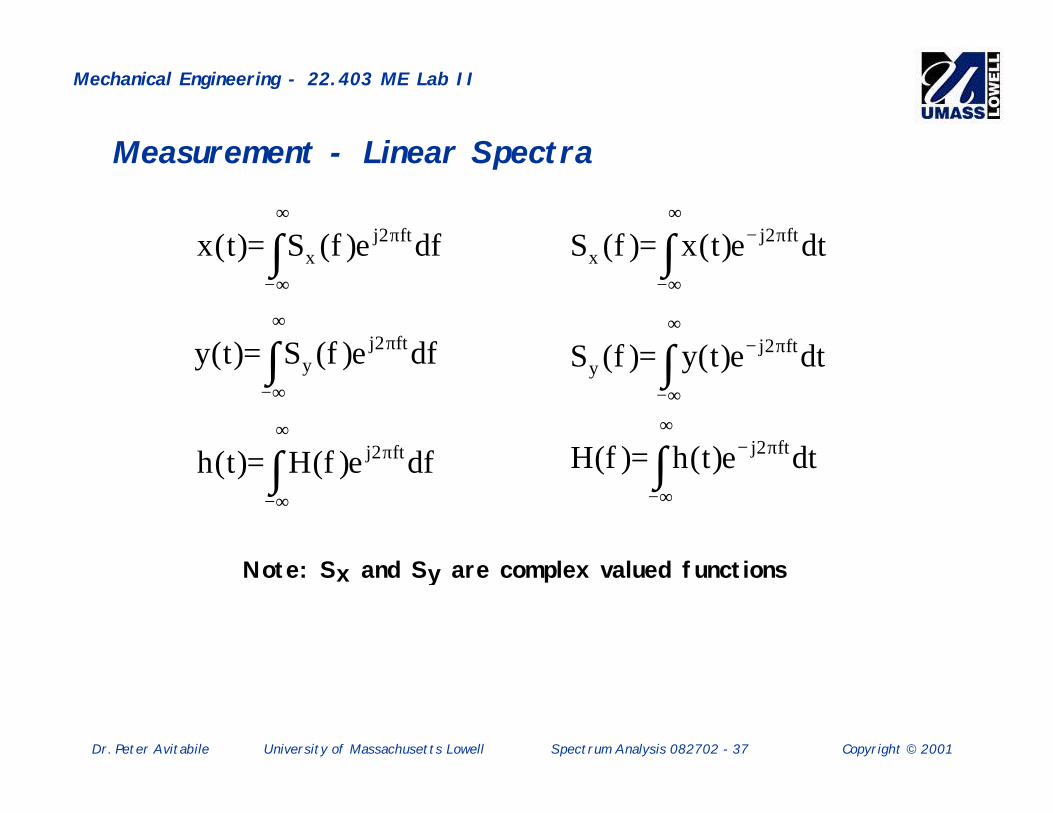
Measurement - Linear Spectra
SYSTEMINPUT OUTPUT
x(t) h(t) y(t)
Sx(f) H(f) Sy(f)
x(t) - time domain input to the system
y(t) - time domain output to the system
Sx(f) - linear Fourier spectrum of x(t)
Sy(f) - linear Fourier spectrum of y(t)
H(f) - system transfer function
h(t) - system impulse response
TIME
FREQUENCY
FFT & IFT
Dr. Peter Avitabile University of Massachusetts Lowell Spectrum Analysis 082702 - 37 Copyright © 2001
Mechanical Engineering - 22.403 ME Lab II
Measurement - Linear Spectra
∫∞+
∞−
π= dfe)f(S)t(x ft2jx
∫∞+
∞−
π= dfe)f(S)t(y ft2jy
∫∞+
∞−
π= dfe)f(H)t(h ft2j
∫∞+
∞−
π−= dte)t(x)f(S ft2jx
∫∞+
∞−
π−= dte)t(y)f(S ft2jy
∫∞+
∞−
π−= dte)t(h)f(H ft2j
Note: Sx and Sy are complex valued functions

Dr. Peter Avitabile University of Massachusetts Lowell Spectrum Analysis 082702 - 38 Copyright © 2001
Mechanical Engineering - 22.403 ME Lab II
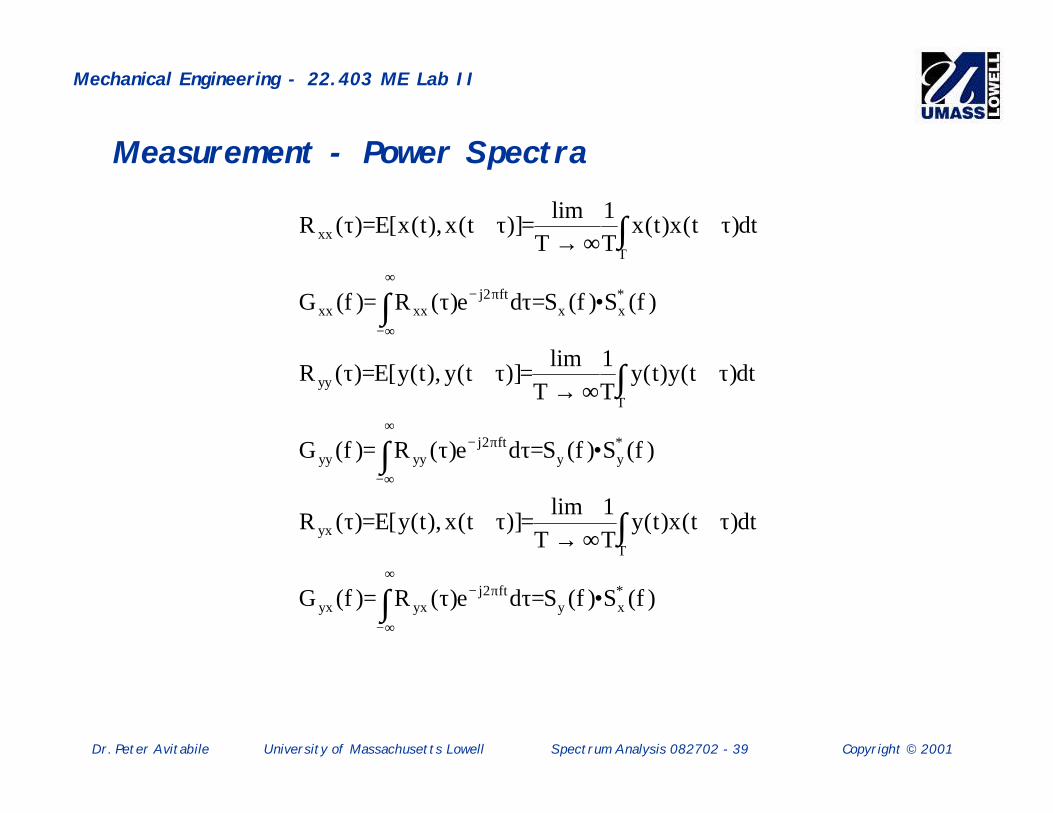
Measurement - Power Spectra
SYSTEMINPUT OUTPUT
TIME
FREQUENCY
FFT & IFT
Rxx(t) Ryx(t) Ryy(t)
Gxx(f) Gxy(f) Gyy(f)
Rxx(t) - autocorrelation of the input signal x(t)
Ryy(t) - autocorrelation of the output signal y(t)
Ryx(t) - cross correlation of y(t) and x(t)
Gxx(f) - autopower spectrum of x(t) G f S f S fxx x x( ) ( ) ( )*= •
Gyy(f) - autopower spectrum of y(t) G f S f S fyy y y( ) ( ) ( )*= •
Gyx(f) - cross power spectrum of y(t) and x(t) G f S f S fyx y x( ) ( ) ( )*= •
Dr. Peter Avitabile University of Massachusetts Lowell Spectrum Analysis 082702 - 39 Copyright © 2001
Mechanical Engineering - 22.403 ME Lab II
Measurement - Power Spectra
)f(S)f(Sde)(R)f(G
dt)t(x)t(yT1
Tlim
)]t(x),t(y[E)(R
)f(S)f(Sde)(R)f(G
dt)t(y)t(yT1
Tlim
)]t(y),t(y[E)(R
)f(S)f(Sde)(R)f(G
dt)t(x)t(xT1
Tlim
)]t(x),t(x[E)(R
*xy
ft2jyxyx
T
yx
*yy
ft2jyyyy
T
yy
*xx
ft2jxxxx
T
xx
•=ττ=
τ+∞→
=τ+=τ
•=ττ=
τ+∞→
=τ+=τ
•=ττ=
τ+∞→
=τ+=τ
∫
∫
∫
∫
∫
∫
∞+
∞−
π−
∞+
∞−
π−
∞+
∞−
π−

Dr. Peter Avitabile University of Massachusetts Lowell Spectrum Analysis 082702 - 40 Copyright © 2001
Mechanical Engineering - 22.403 ME Lab II
xy SHS =H1 formulation
- susceptible to noise on the input- underestimates the actual H of the system
*xx
*xy SSHSS •=•
xx
yx*xx
*xy
G
G
SS
SSH =
••
=
2
1
xyyy
xxyx*yy
*xx
*yx
*xy2
xy HH
G/G
G/G
)SS)(SS(
)SS)(SS(==
••••
=γ
COHERENCE
Otherformulationsfor H exist
The Frequency Response Function and Coherence

Dr. Peter Avitabile University of Massachusetts Lowell Spectrum Analysis 082702 - 41 Copyright © 2001
Mechanical Engineering - 22.403 ME Lab II
12 Dr. Peter AvitabileModal Analysis & Controls LaboratoryMeasurement Definitions
Measurements - Auto Power Spectrum
INPUT FORCE
AVERAGED INPUT
POWER SPECTRUM
x(t)
G (f)xx
OUTPUT RESPONSE
AVERAGED OUTPUT
POWER SPECTRUM
y(t)
G (f)yy
13 Dr. Peter AvitabileModal Analysis & Controls LaboratoryMeasurement Definitions
Measurements - Cross Power Spectrum
AVERAGED INPUT
POWER SPECTRUM
AVERAGED CROSS
POWER SPECTRUM
AVERAGED OUTPUT
POWER SPECTRUM
G (f)xxG (f)yy
G (f)yx
14 Dr. Peter AvitabileModal Analysis & Controls LaboratoryMeasurement Definitions
Measurements - Frequency Response Function
AVERAGED INPUT
POWER SPECTRUM
AVERAGED CROSS
POWER SPECTRUM
AVERAGED OUTPUT
POWER SPECTRUM
FREQUENCY RESPONSE FUNCTION
G (f)xxG (f)yyG (f)yx
H(f)
15 Dr. Peter AvitabileModal Analysis & Controls LaboratoryMeasurement Definitions
Measurements - FRF & Coherence
Freq Resp
40
-60
dB Mag
0Hz 200HzAVG: 5
Coherence
1
0
Real
0Hz 200HzAVG: 5
FREQUENCY RESPONSE FUNCTION
COHERENCE
Typical Measurements

Dr. Peter Avitabile University of Massachusetts Lowell Spectrum Analysis 082702 - 42 Copyright © 2001
Mechanical Engineering - 22.403 ME Lab II
Hammers and Tips
40
-60
dB Mag
0Hz 800Hz
COHERENCE
INPUT POWER SPECTRUM
FRF
40
-60
dB Mag
0Hz 200Hz
COHERENCE
INPUT POWER SPECTRUM
FRF

Dr. Peter Avitabile University of Massachusetts Lowell Spectrum Analysis 082702 - 43 Copyright © 2001
Mechanical Engineering - 22.403 ME Lab II
Leakage and Windows for Impact Testing
ACTUAL TIME SIGNAL
SAMPLED SIGNAL
WINDOW WEIGHTING
WINDOWED TIME SIGNAL
Dr. Peter Avitabile University of Massachusetts Lowell Spectrum Analysis 082702 - 44 Copyright © 2001
Mechanical Engineering - 22.403 ME Lab II
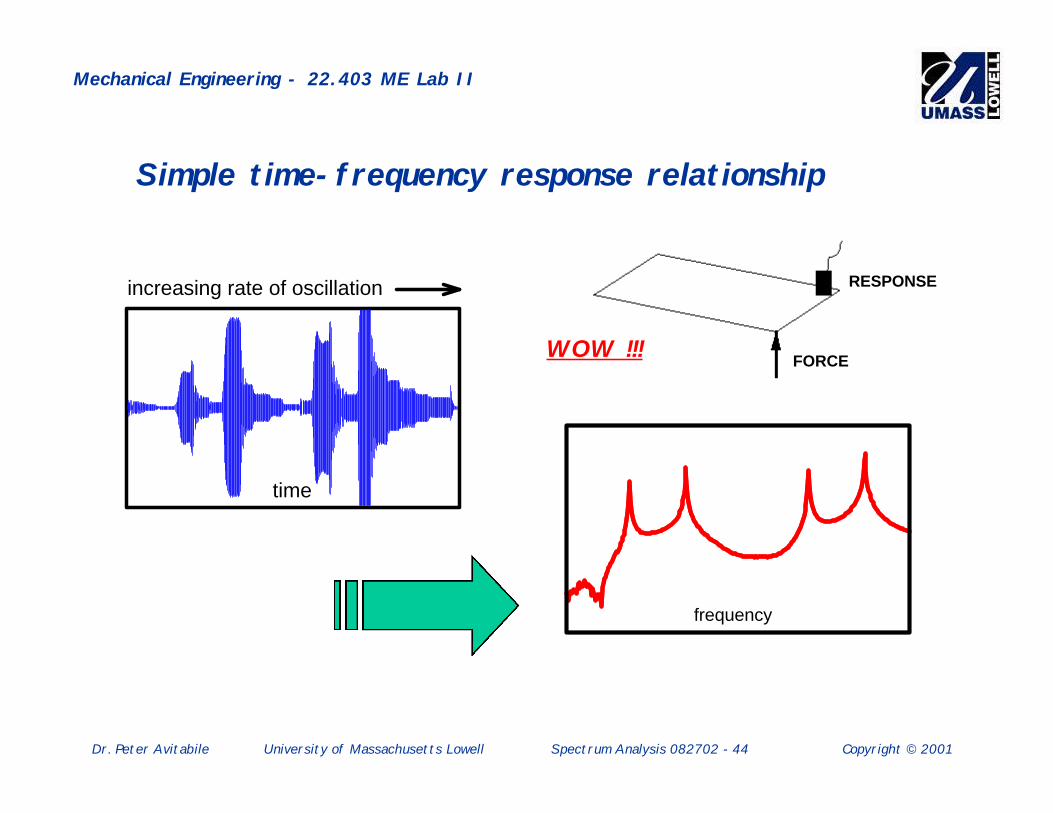
Simple time-frequency response relationship
FORCE
RESPONSE
time
increasing rate of oscillation
frequency
WOW !!!
Dr. Peter Avitabile University of Massachusetts Lowell Spectrum Analysis 082702 - 45 Copyright © 2001
Mechanical Engineering - 22.403 ME Lab II
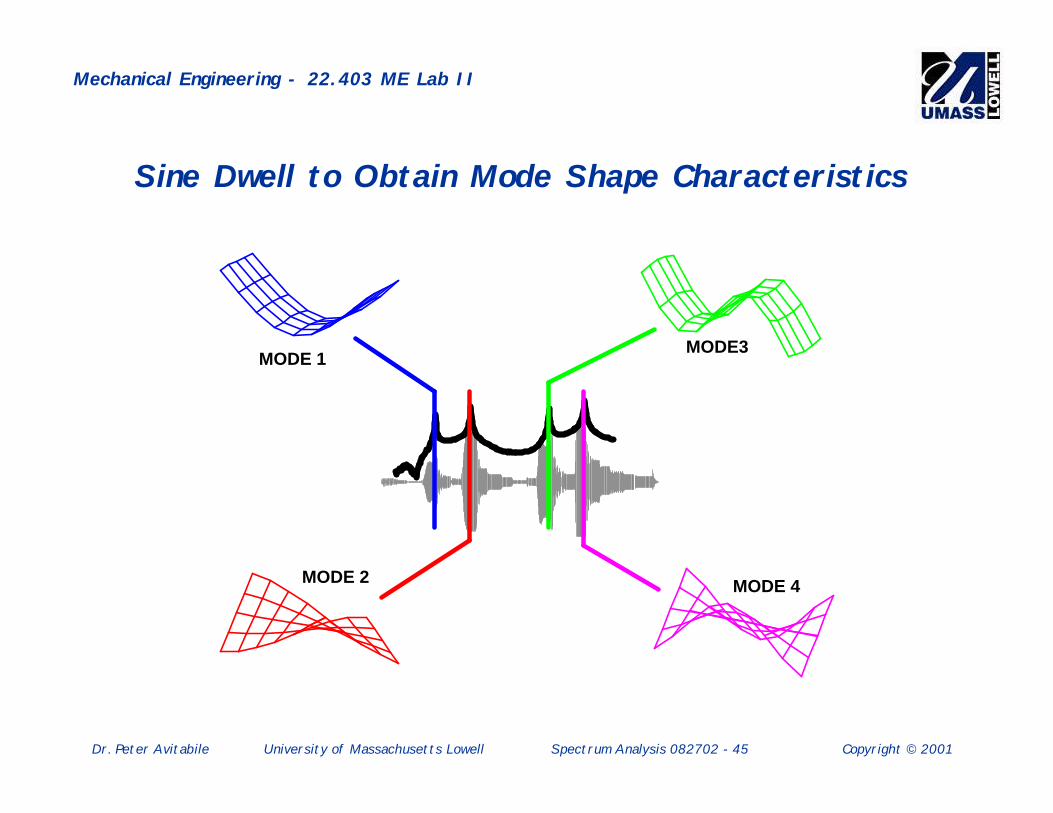
Sine Dwell to Obtain Mode Shape Characteristics
MODE 1
MODE 2
MODE3
MODE 4
Dr. Peter Avitabile University of Massachusetts Lowell Spectrum Analysis 082702 - 46 Copyright © 2001
Mechanical Engineering - 22.403 ME Lab II
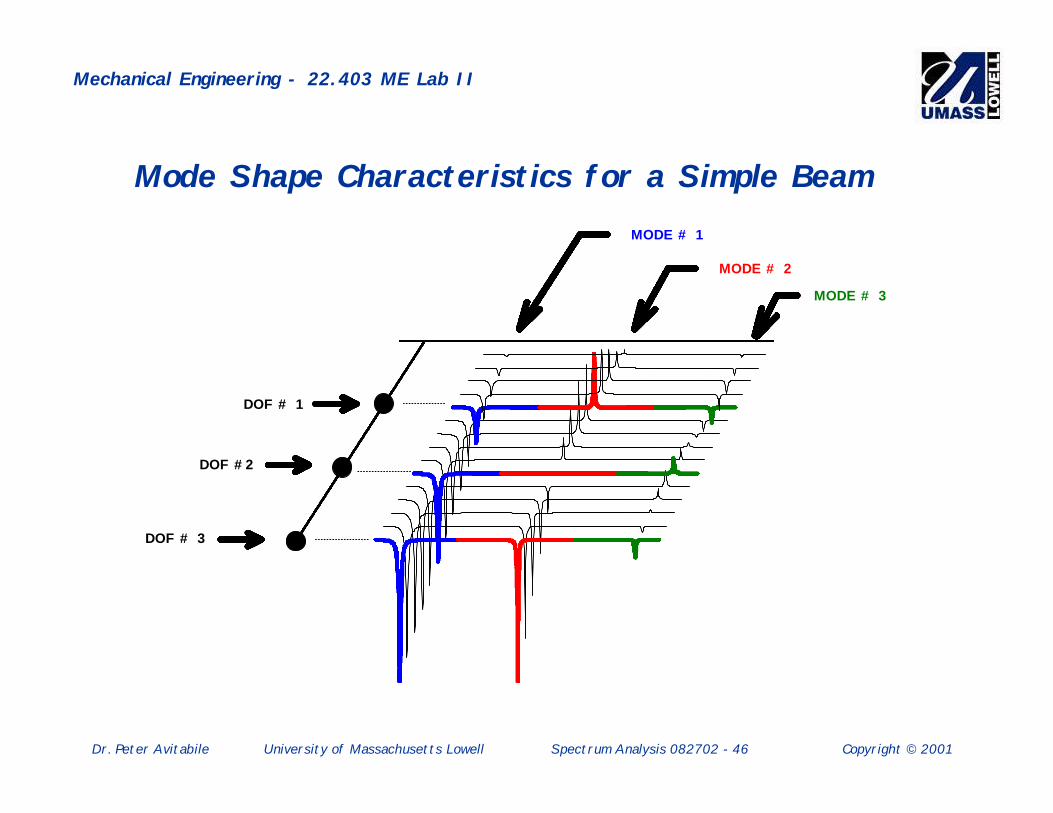
DOF # 1
DOF #2
DOF # 3
MODE # 1
MODE # 2
MODE # 3
Mode Shape Characteristics for a Simple Beam

Dr. Peter Avitabile University of Massachusetts Lowell Spectrum Analysis 082702 - 47 Copyright © 2001
Mechanical Engineering - 22.403 ME Lab II
1
2
3
4
5
6
MODE 1
1
2
3
4
5
6
MODE 2
Mode Shape Characteristics for a Simple Plate

Dr. Peter Avitabile University of Massachusetts Lowell Spectrum Analysis 082702 - 48 Copyright © 2001
Mechanical Engineering - 22.403 ME Lab II
Why and How Do Structures Vibrate?
INPUT TIME FORCE
INPUT SPECTRUM
OUTPUT TIME RESPONSE
OUTPUT SPECTRUM
f(t)
FFT
y(t)
IFT
f(j )ωω y(j )ωωh(j )ωω
FREQUENCY RESPONSE FUNCTION
Motor or diskunbalance
can cause unwantedvibrations or worse
OOOPS !!!
OUCH !!!
Dr. Peter Avitabile University of Massachusetts Lowell Spectrum Analysis 082702 - 49 Copyright © 2001
Mechanical Engineering - 22.403 ME Lab II
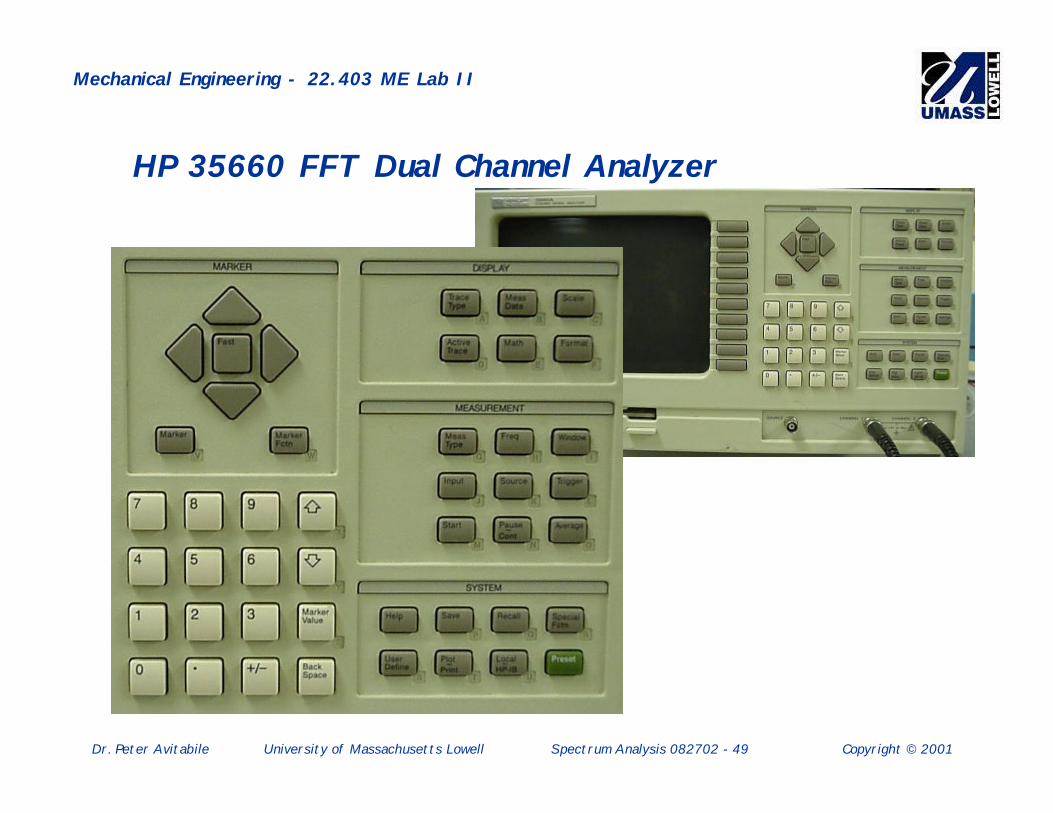
HP 35660 FFT Dual Channel Analyzer

Dr. Peter Avitabile University of Massachusetts Lowell Spectrum Analysis 082702 - 50 Copyright © 2001
Mechanical Engineering - 22.403 ME Lab II
HP 35660 FFT Dual Channel Analyzer


![(UNTITLED) [ ] · PDF fileTitle (UNTITLED) Subject (UNTITLED) Keywords](https://static.fdocuments.in/doc/165x107/5a7ca10e7f8b9ae9398d019f/untitled-untitled-subject-untitled-keywords.jpg)
