Basics of Remote Sensing
38
-
Upload
akash-tikhe -
Category
Environment
-
view
122 -
download
1
Transcript of Basics of Remote Sensing

Natural Remote Sensing
Sensing / Perceiving
Analysis
Information / Knowledge
Boy or Man ?
Name the remote sensing organs in our body?
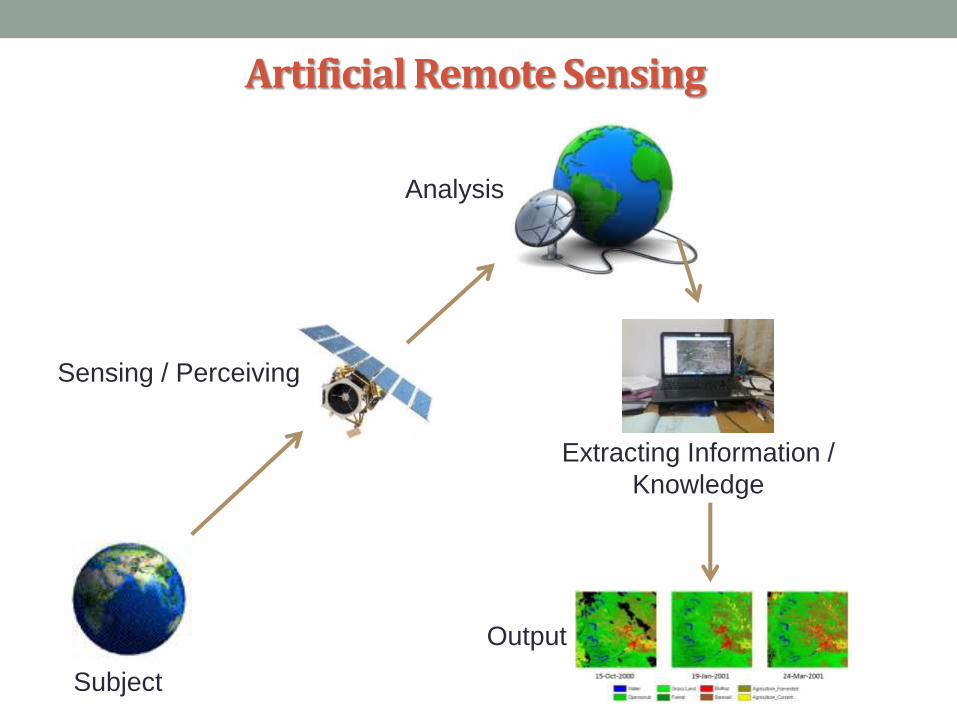
Artificial Remote Sensing
Sensing / Perceiving
Analysis
Extracting Information /
Knowledge
Output
Subject
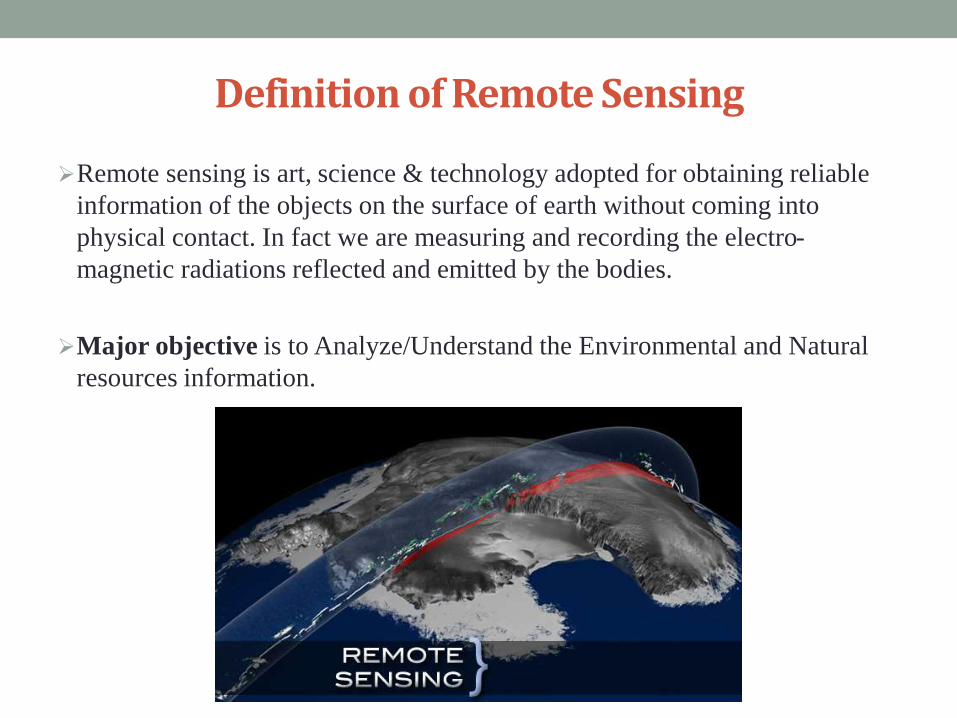
Definition of Remote Sensing
Remote sensing is art, science & technology adopted for obtaining reliable
information of the objects on the surface of earth without coming into
physical contact. In fact we are measuring and recording the electro-
magnetic radiations reflected and emitted by the bodies.
Major objective is to Analyze/Understand the Environmental and Natural
resources information.
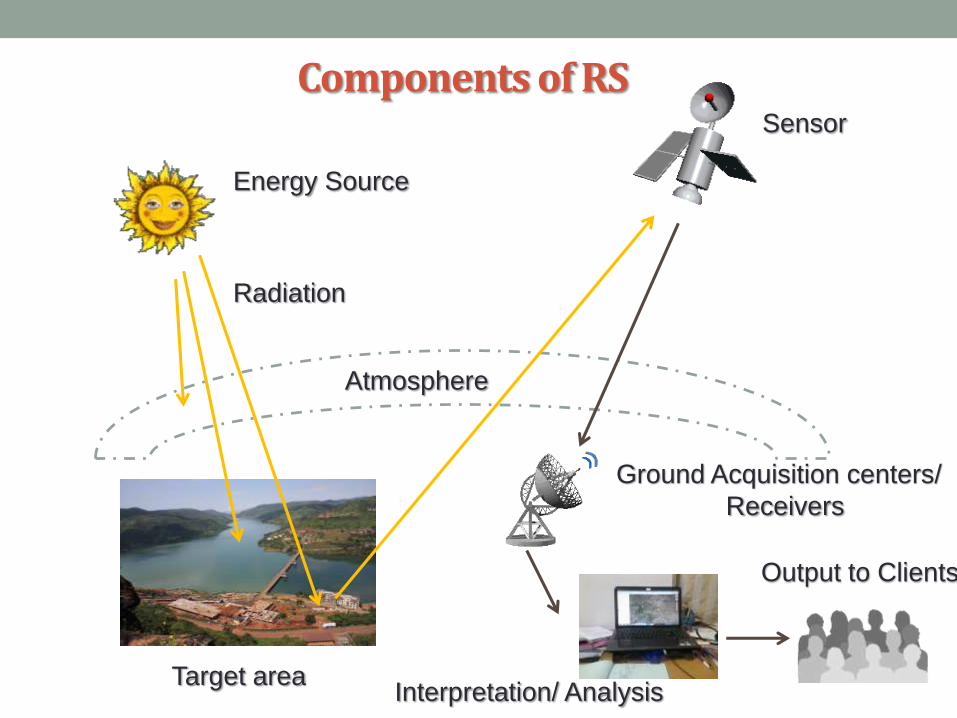
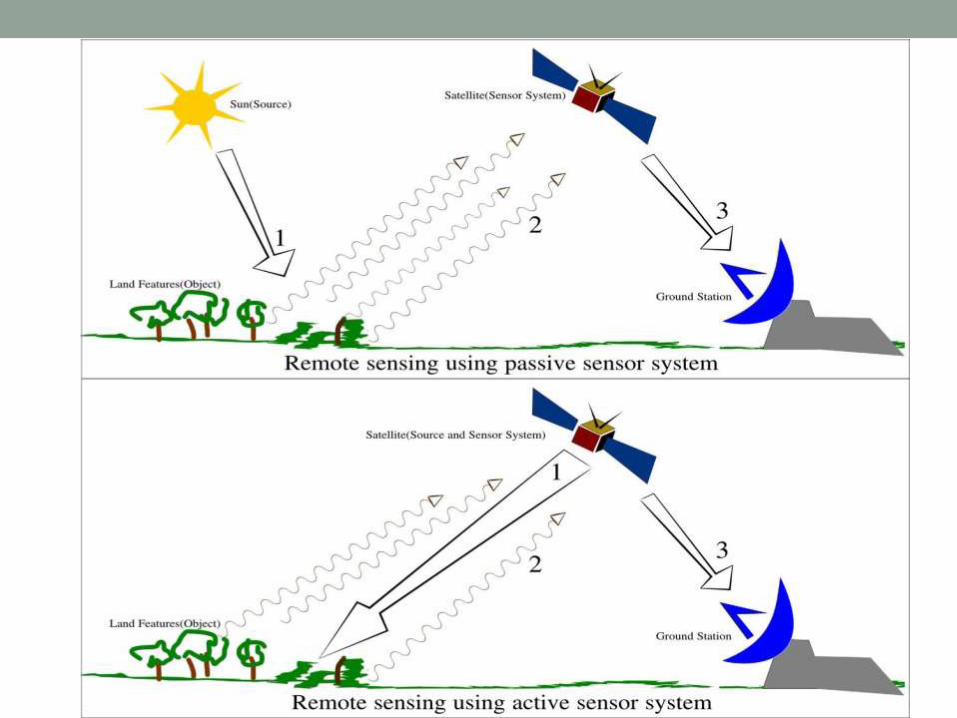
Components of RS
Energy Source
Radiation
Atmosphere
Target area
Sensor
Ground Acquisition centers/
Receivers
Interpretation/ Analysis
Output to Clients
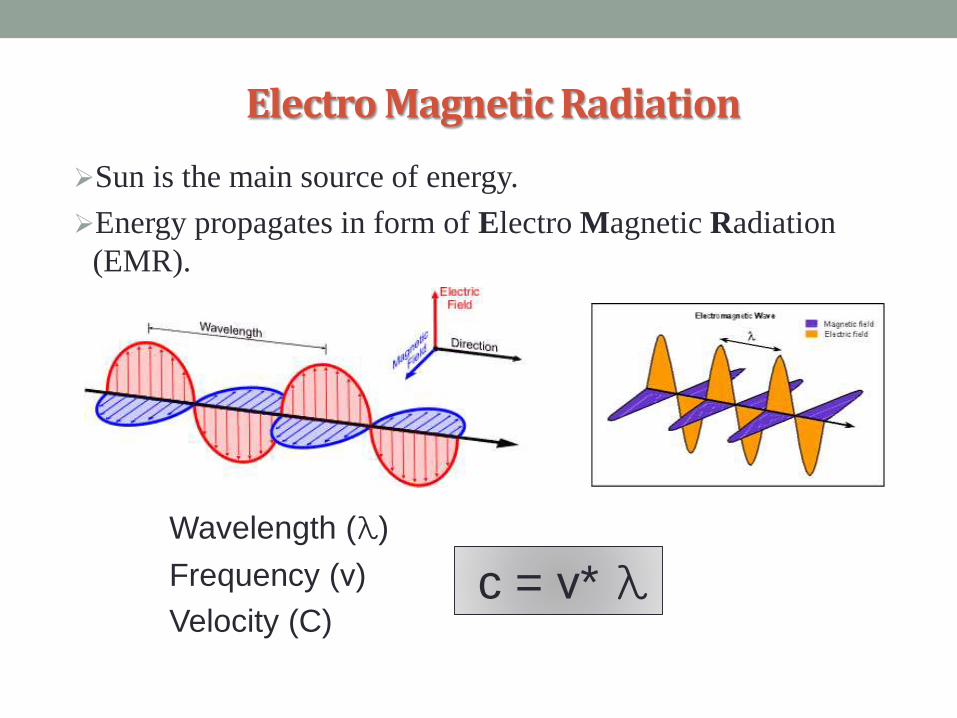
Electro Magnetic Radiation
Sun is the main source of energy.
Energy propagates in form of Electro Magnetic Radiation
(EMR).
Wavelength (λ)
Frequency (ν)
Velocity (C)c = ν* λ
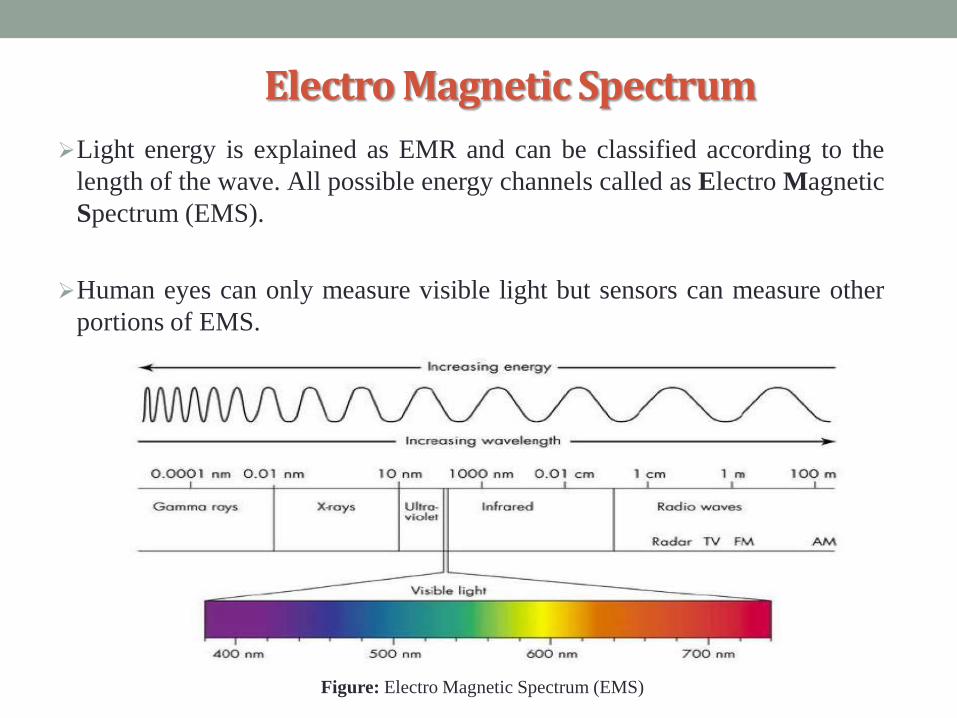
Electro Magnetic Spectrum
Light energy is explained as EMR and can be classified according to the
length of the wave. All possible energy channels called as Electro Magnetic
Spectrum (EMS).
Human eyes can only measure visible light but sensors can measure other
portions of EMS.
Figure: Electro Magnetic Spectrum (EMS)

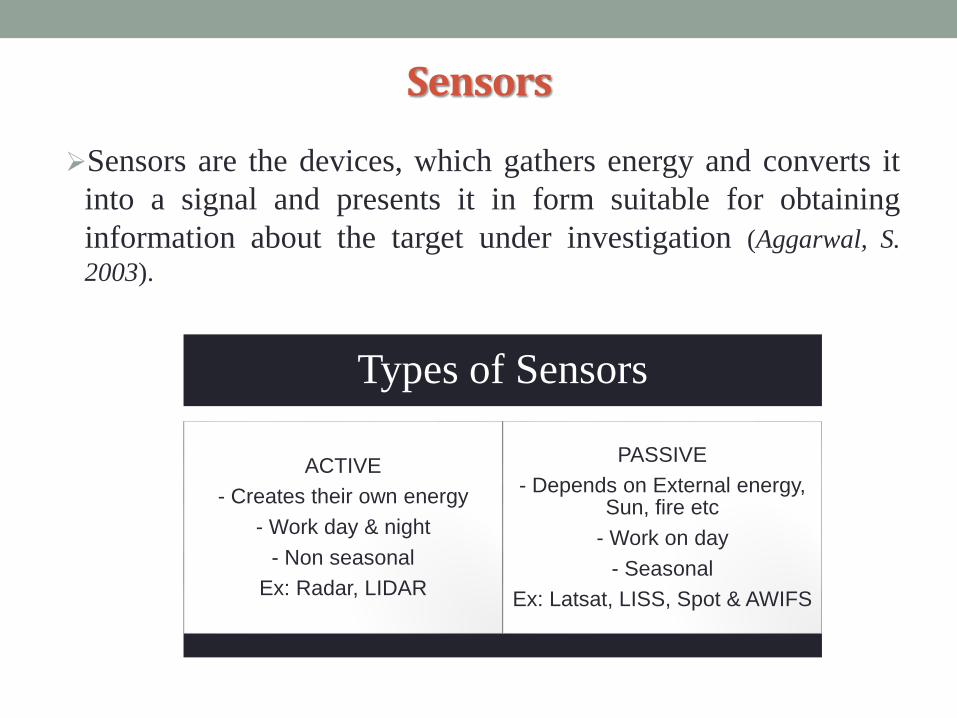
Sensors
Sensors are the devices, which gathers energy and converts it
into a signal and presents it in form suitable for obtaining
information about the target under investigation (Aggarwal, S.
2003).
Types of Sensors
ACTIVE
- Creates their own energy
- Work day & night
- Non seasonal
Ex: Radar, LIDAR
PASSIVE
- Depends on External energy, Sun, fire etc
- Work on day
- Seasonal
Ex: Latsat, LISS, Spot & AWIFS
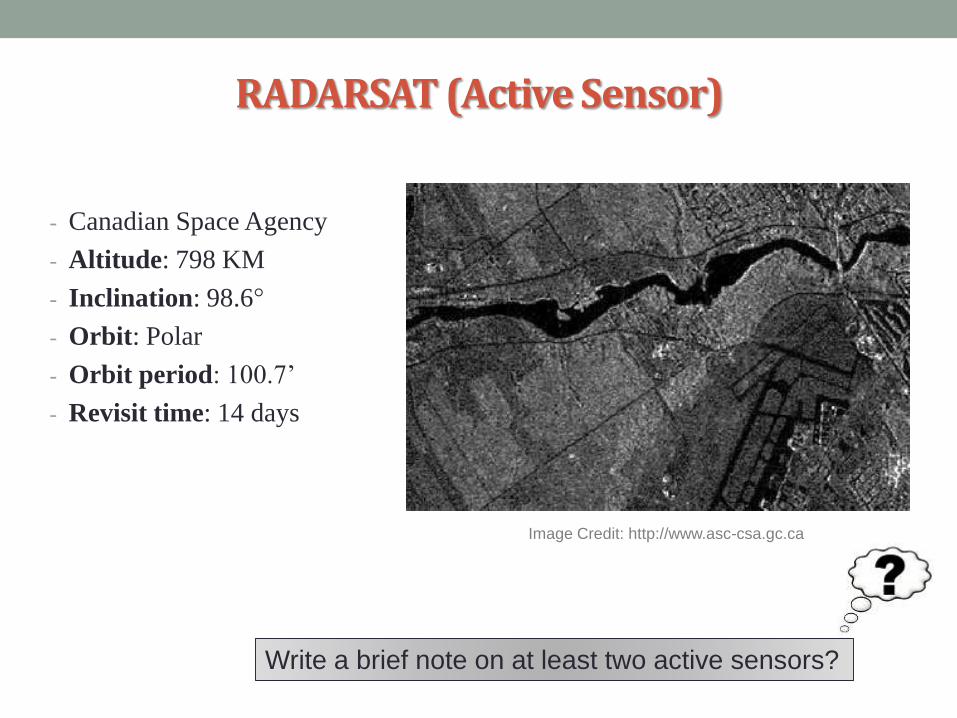
RADARSAT (Active Sensor)
- Canadian Space Agency
- Altitude: 798 KM
- Inclination: 98.6°
- Orbit: Polar
- Orbit period: 100.7’
- Revisit time: 14 days
Write a brief note on at least two active sensors?
Image Credit: http://www.asc-csa.gc.ca
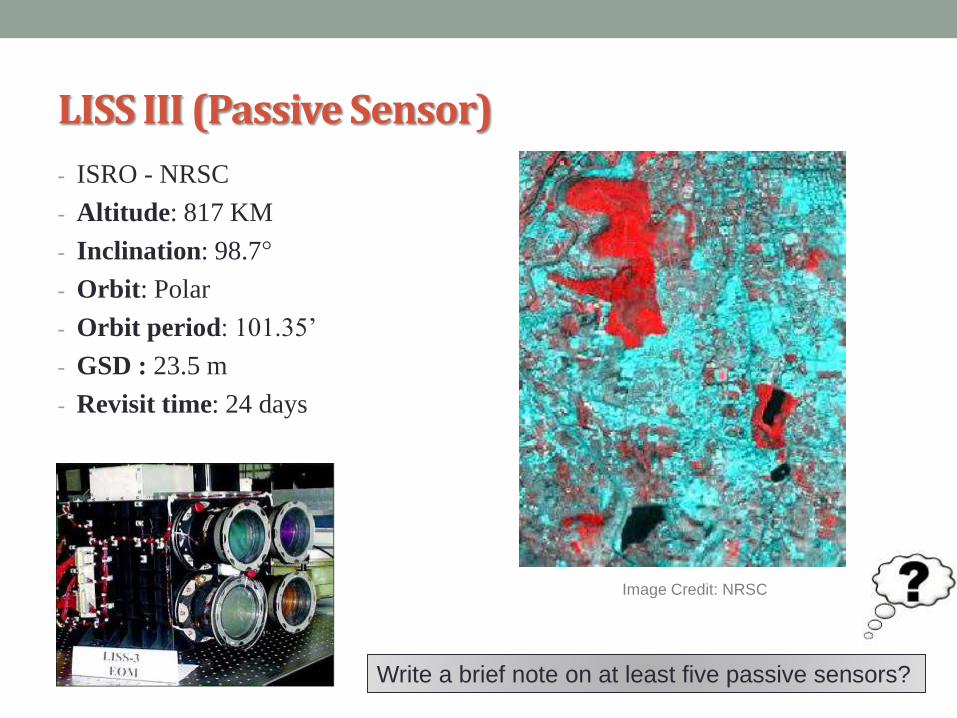
LISS III (Passive Sensor)
- ISRO - NRSC
- Altitude: 817 KM
- Inclination: 98.7°
- Orbit: Polar
- Orbit period: 101.35’
- GSD : 23.5 m
- Revisit time: 24 days
Write a brief note on at least five passive sensors?
Image Credit: NRSC
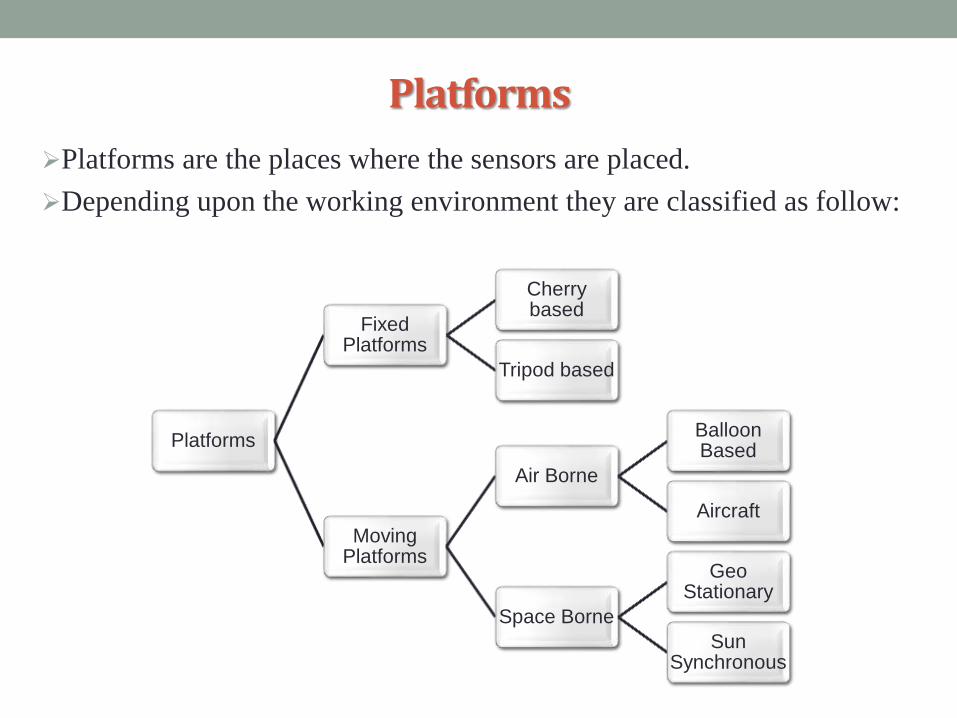
Platforms
Platforms are the places where the sensors are placed.
Depending upon the working environment they are classified as follow:
Platforms
Fixed Platforms
Cherry based
Tripod based
Moving Platforms
Air Borne
Balloon Based
Aircraft
Space Borne
Geo Stationary
Sun Synchronous
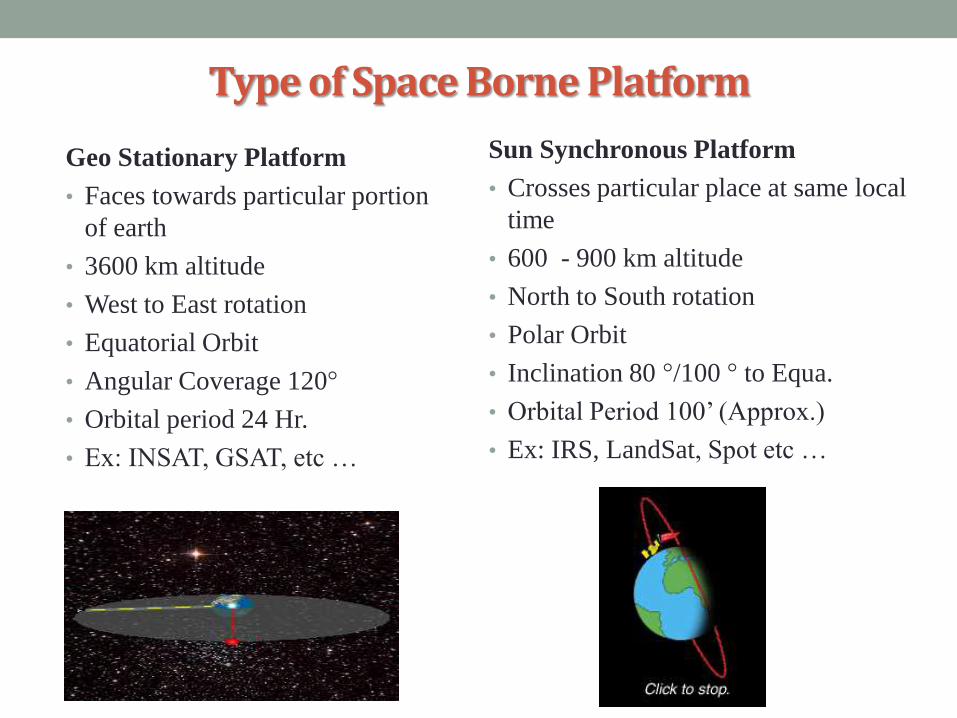
Type of Space Borne Platform
Geo Stationary Platform
• Faces towards particular portion
of earth
• 3600 km altitude
• West to East rotation
• Equatorial Orbit
• Angular Coverage 120°
• Orbital period 24 Hr.
• Ex: INSAT, GSAT, etc …
Sun Synchronous Platform
• Crosses particular place at same local
time
• 600 - 900 km altitude
• North to South rotation
• Polar Orbit
• Inclination 80 °/100 ° to Equa.
• Orbital Period 100’ (Approx.)
• Ex: IRS, LandSat, Spot etc …

Types of Remote Sensing
Type of RS
Depending upon
energy source
(EMR)
Depending upon
Sensor
Depending upon
Platform
Optical MicrowaveIR or ThermalX-Ray
Active Passive
Ground
BaseAir Borne
Optical Remote Sensing
• In Optical Remote Sensing, optical sensors detect solar radiation reflected or scattered from the earth, forming images resembling photographs taken by a camera high up in space.
• The wavelength region usually extends from (300 nm to 3000 nm) the visible and near infrared (commonly abbreviated as VNIR) to the short-wave infrared (SWIR).
• Different materials such as water, soil, vegetation, buildings and roads reflect visible and infrared light in different ways. They have different colours and brightness when seen under the sun.
• The interpretation of optical images require the knowledge of the spectral reflectance signatures of the various materials (natural or man-made) covering the surface of the earth.
Thermal Infrared Remote Sensing
• There are also infrared sensors measuring the thermal infrared radiation
emitted from the earth, from which the land or sea surface temperature can
be derived.
• The middle-wave infrared (MWIR) and long-wave infrared (LWIR) are
within the thermal infrared region.
• The wavelength range of 3000 nm to 5000 nm and 8000 nm to 14000 nm.
These radiations are emitted from warm objects such as the Earth's surface.
• Thermal Infra RS used for measurements of the earth's land and sea surface
temperature and forest fire.
Microwave Remote Sensing
These satellites carry their own "flashlight" emitting microwaves to
illuminate their targets and Analyzes the information collected by the sensor.
The active sensors emit pulses of microwave radiation to illuminate the
areas to be imaged. A microwave remote sensor records the backscattered
microwaves from earth or sea surface.
The Microwave wavelength range of 1 mm to 1 m of electromagnetic
spectrum. So, have an additional advantage as they can penetrate clouds.
Most of the microwave sensors are active sensors, having there own sources
of energy. Thus, images can thus be acquired day and night.

Characteristics of Sensors
Atmospheric Windows
Spectral Resolution
Spatial Resolution
Radiometric Resolution
Temporal Resolution

Atmospheric Windows
The spectral Bands for which the atmosphere is transparent are called
as the Atmospheric windows.
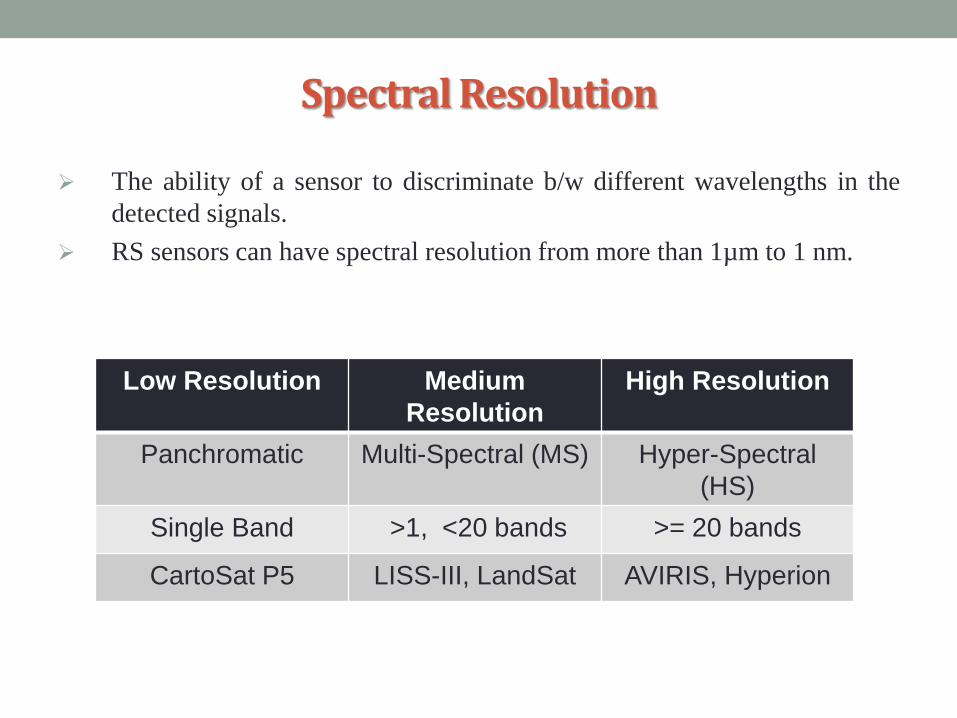
Spectral Resolution
The ability of a sensor to discriminate b/w different wavelengths in the
detected signals.
RS sensors can have spectral resolution from more than 1µm to 1 nm.
Low Resolution Medium
Resolution
High Resolution
Panchromatic Multi-Spectral (MS) Hyper-Spectral
(HS)
Single Band >1, <20 bands >= 20 bands
CartoSat P5 LISS-III, LandSat AVIRIS, Hyperion
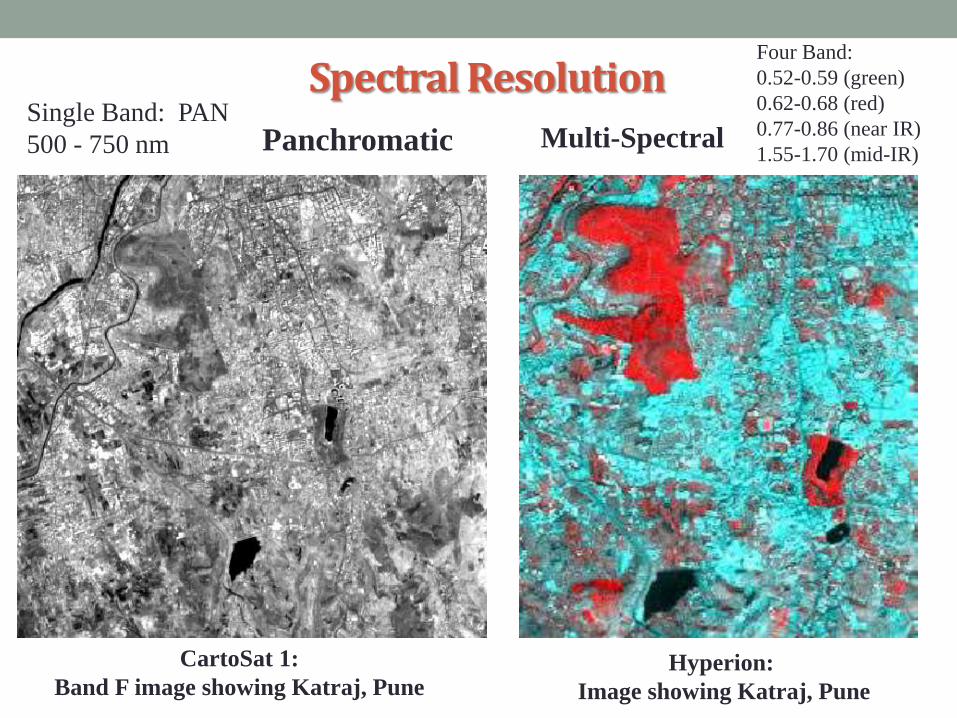
Spectral ResolutionSingle Band: PAN
500 - 750 nm
CartoSat 1:
Band F image showing Katraj, Pune
Panchromatic Multi-Spectral
Hyperion:
Image showing Katraj, Pune
Four Band:
0.52-0.59 (green)
0.62-0.68 (red)
0.77-0.86 (near IR)
1.55-1.70 (mid-IR)

Spatial Resolution
A measure of the smallest distance between two objects that can be
distinguished by a sensor.
Source: Rees, 1999
Orbview : BVU (1 metre ) LISS III: BVU (23.5 metre )
Image Credit: USGSImage Credit: NRSC

0.6 m Spatial Resolution Hyper spectral Space Image
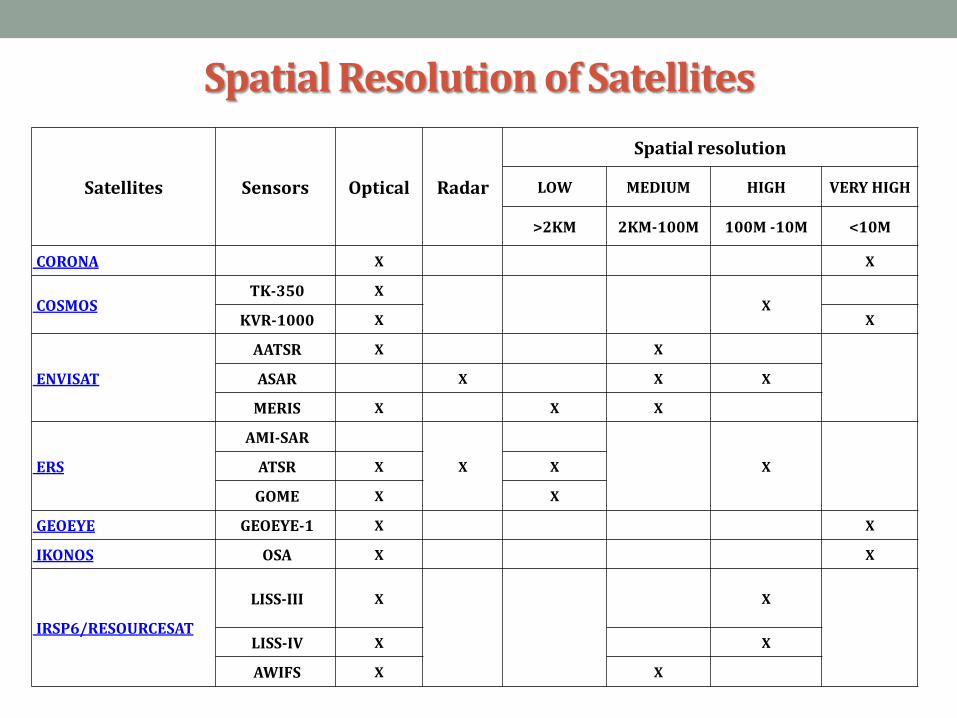
Spatial Resolution of Satellites
Satellites Sensors Optical Radar
Spatial resolution
LOW MEDIUM HIGH VERY HIGH
>2KM 2KM-100M 100M -10M <10M
CORONA X X
COSMOSTK-350 X
XKVR-1000 X X
ENVISAT
AATSR X X
ASAR X X X
MERIS X X X
ERS
AMI-SAR
X XATSR X X
GOME X X
GEOEYE GEOEYE-1 X X
IKONOS OSA X X
IRSP6/RESOURCESAT
LISS-III X X
LISS-IV X X
AWIFS X X
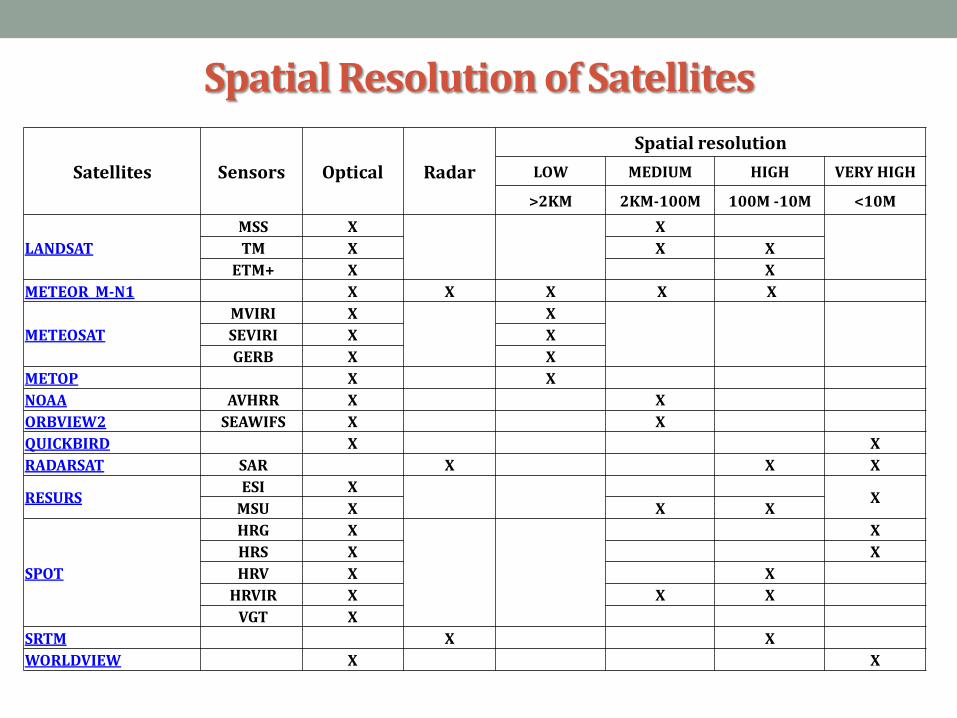
Spatial Resolution of Satellites
Satellites Sensors Optical Radar
Spatial resolution
LOW MEDIUM HIGH VERY HIGH
>2KM 2KM-100M 100M -10M <10M
LANDSAT
MSS X X
TM X X X
ETM+ X X
METEOR M-N1 X X X X X
METEOSAT
MVIRI X X
SEVIRI X X
GERB X X
METOP X X
NOAA AVHRR X X
ORBVIEW2 SEAWIFS X X
QUICKBIRD X X
RADARSAT SAR X X X
RESURSESI X
XMSU X X X
SPOT
HRG X X
HRS X X
HRV X X
HRVIR X X X
VGT X
SRTM X X
WORLDVIEW X X
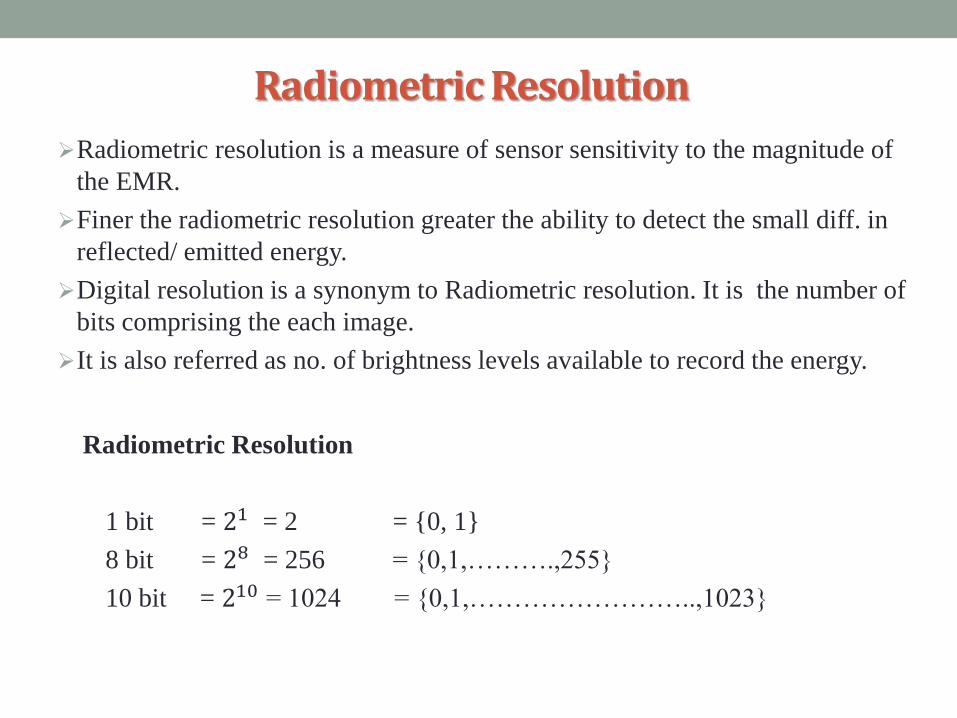
Radiometric Resolution
Radiometric resolution is a measure of sensor sensitivity to the magnitude of
the EMR.
Finer the radiometric resolution greater the ability to detect the small diff. in
reflected/ emitted energy.
Digital resolution is a synonym to Radiometric resolution. It is the number of
bits comprising the each image.
It is also referred as no. of brightness levels available to record the energy.
Radiometric Resolution
1 bit = 21 = 2 = {0, 1}
8 bit = 28 = 256 = {0,1,……….,255}
10 bit = 210 = 1024 = {0,1,……………………..,1023}
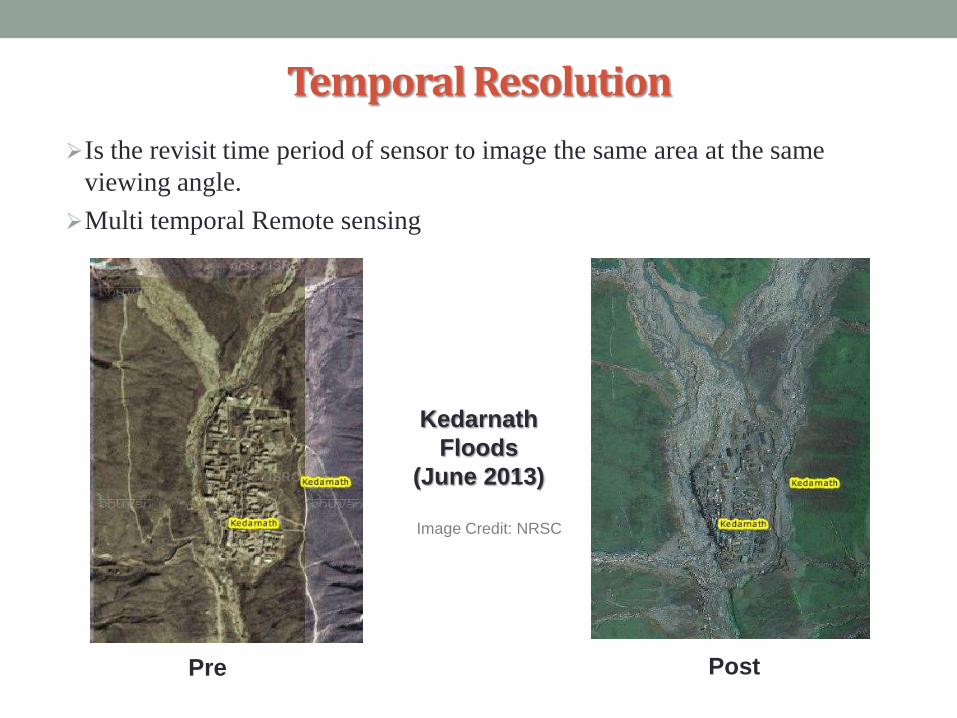
Temporal Resolution
Is the revisit time period of sensor to image the same area at the same
viewing angle.
Multi temporal Remote sensing
Kedarnath
Floods
(June 2013)
Pre Post
Image Credit: NRSC
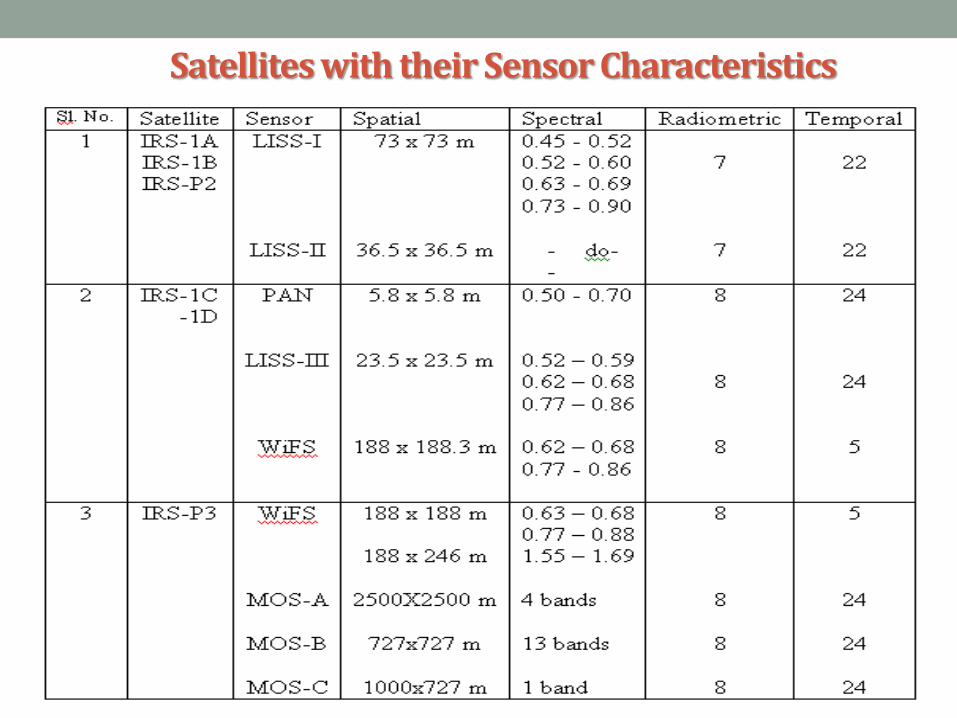
Satellites with their Sensor Characteristics
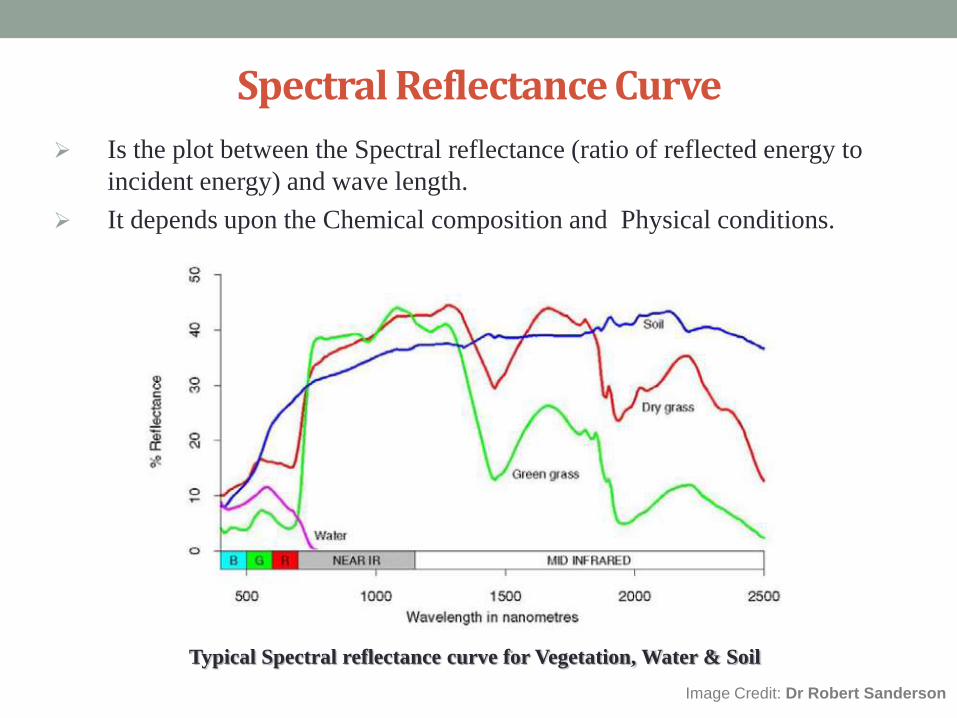
Spectral Reflectance Curve
Is the plot between the Spectral reflectance (ratio of reflected energy to
incident energy) and wave length.
It depends upon the Chemical composition and Physical conditions.
Image Credit: Dr Robert Sanderson
Typical Spectral reflectance curve for Vegetation, Water & Soil

How the Object is Identified by Sensor?
The Basic principle of Remote Sensing is that each object reflect and emit
energy of particular part of EMR in a unique way. Therefore, the signatures
received from different objects is always different. This is called its Spectral
signature. This is the key for interpretation in RS.
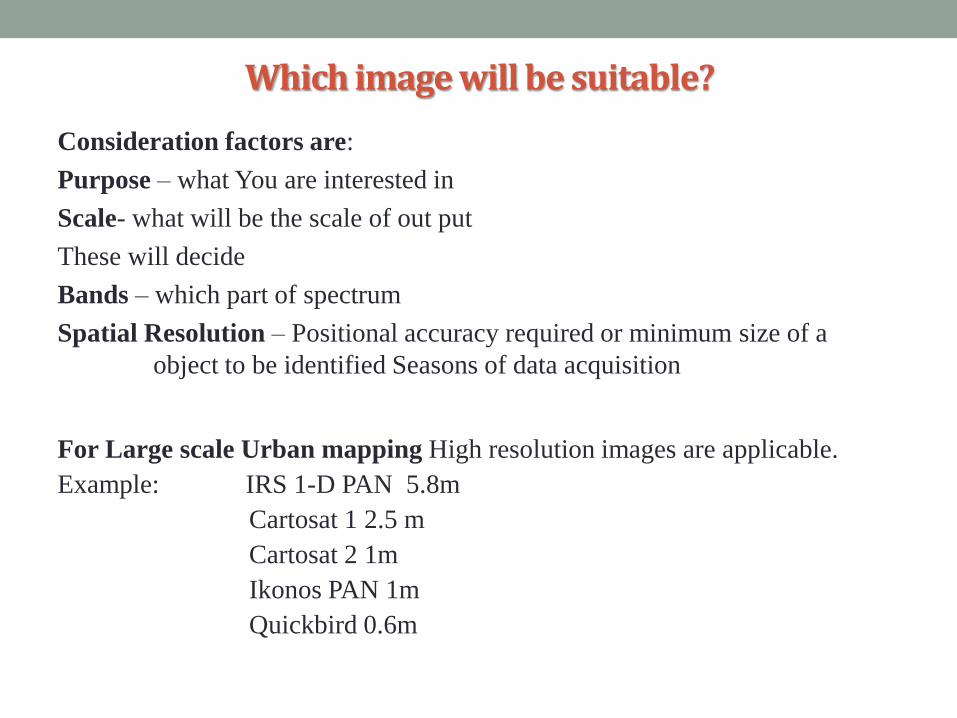
Which image will be suitable?
Consideration factors are:
Purpose – what You are interested in
Scale- what will be the scale of out put
These will decide
Bands – which part of spectrum
Spatial Resolution – Positional accuracy required or minimum size of a
object to be identified Seasons of data acquisition
For Large scale Urban mapping High resolution images are applicable.
Example: IRS 1-D PAN 5.8m
Cartosat 1 2.5 m
Cartosat 2 1m
Ikonos PAN 1m
Quickbird 0.6m
For Display:
For single band panchromatic:
0 is black and 255 is white and in between gray
For RGB:
Three value from three band assigned as R,G & B will produce combination of color
For example: Red=255, Green=255 & Blue=0, will be Yellow
How to display in your Computer?
Image is supplied in a specific format.
Image need to be converted to the S/W specific format.
Most of the S/W provide the interface to import such images.
Once imported it can be displayed and further processing can be carried out.
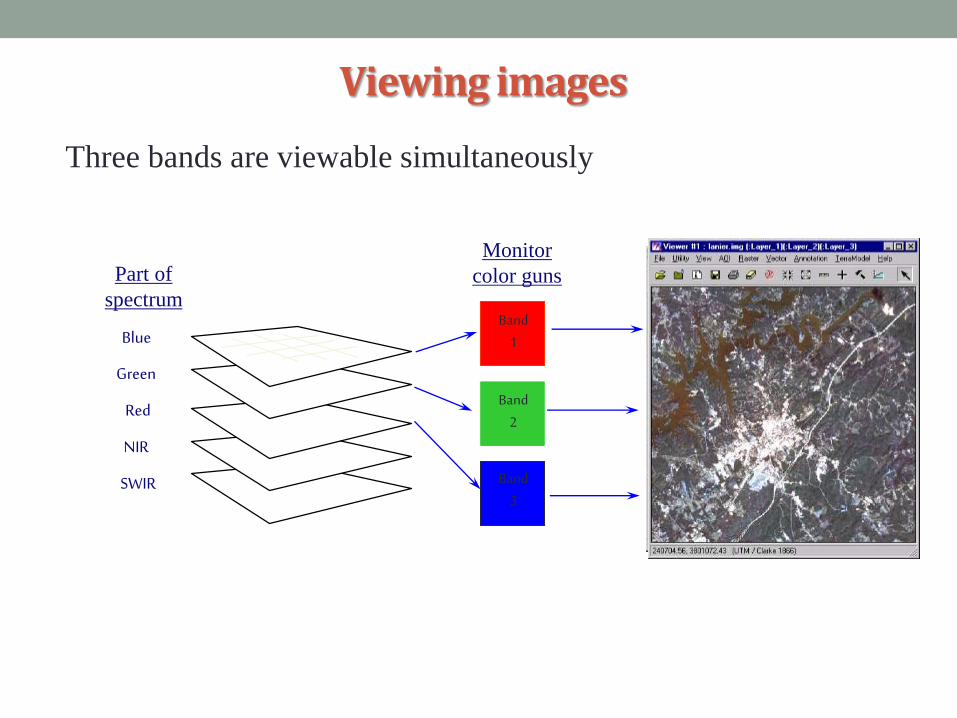
Blue
Green
Red
NIR
SWIR
Part of
spectrum
Monitor
color guns
Viewing images
Three bands are viewable simultaneously
Band4
Band3
Band2
Band4
Band5
Band3
Band1
Band2
Band3

Applications of
RS
Forestry
Geology
Agriculture
Ocean & coastal
monitoring
Hydrology
Pollution monitoring
Land use pattern
Urban planning
Biodiversity conservation
Surveying and mapping
National Security
Environmental Science

Application of Remote Sensing
Agricultural
Crop type classification.
Crop condition assessment.
Crop yield estimation.
Crop stress monitoring.
Crop production forecasting
Mapping of soil characteristic.
Soil moisture estimation.
Ocean applications:
Storm forecasting.
Water quality monitoring.
Aquaculture inventory and monitoring.
Navigation routing.
Coastal vegetation mapping.
Oil spill.
ForestryForest cover and density mapping
Deforestation mapping
Forest fire mapping.
Grassland mapping
Shifting cultivation
Wetland mapping and monitoring
Biomass estimation
Species inventory
National SecurityTargeting
Disaster mapping and monitoring
Damage assessment
Weapons monitoring
Homeland security
Navigation
Policy

Hydrology:
Watershed mapping and management
Flood delineation and mapping
Ground water targeting
Assessment of land surface water
Assessment of sub surface water
Snow melt run-off
Multipurpose river valley
Land Use/Land Cover mapping:
Natural resource management
Wildlife protection
Encroachment
Application of Remote Sensing
Urban Planning:
Land parcel mapping
Infrastructure mapping
Land use change detection
Future urban expansion planning
Geology:
Lithological mapping
Mineral exploration
Environmental geology
Sedimentation mapping and monitoring
Geo-hazard mapping
Glacier mapping