Basic Terminology and Concepts Datasheet View … your database Getting Started OPTION 1: Use a...
34
Microsoft Access Basic Terminology and Concepts Datasheet View Creating Tables
-
Upload
nguyennhan -
Category
Documents
-
view
214 -
download
1
Transcript of Basic Terminology and Concepts Datasheet View … your database Getting Started OPTION 1: Use a...

Microsoft Access
Basic Terminology and Concepts
Datasheet View
Creating Tables

What Is a Database?
Database: a collection of related information; elements of a database are called objects
Access Database Objects
– Table: Used to store and manipulate data; a table is the first object
created in a database
– Query: Used to retrieve information
– Form: Used to view one record of data
– Report: Used to present, calculate, summarize, and print table data
– Macro/Module: Used to automate frequently performed
procedures

A Database Example
Information about a company’s products and employers stored in the database. Various objects (tables, forms, reports) are created using the information in the database.

The database windowis the command center; it provides the means to create, view, and edit database objects, such as tables, forms, and reports
Object List
Navigation Pane
Ribbons
Slide 4 of 29
Objects(tables, reports, etc.)

Table Basics and Datasheet View Table: the primary element for collecting related data, organized into rows and
columns ALL databases MUST start with at least one table
Double click to open the table in datasheet view Record: an individual entry in a table (row)
Field: a piece of data in a record (column)
The intersection of a row and column is called a cell + indicates record is
expandable to showrelated table information
Current record is highlighted Default sort order = primary
key
Record (row)
Field (column)

Navigating in a Datasheet
Enter/(Shift)Tab
Page Up/Page Down
Home/End
Arrows
File|AccessOptions|Advanced
Can use in combination with Ctrl

Editing Table Data
To edit data– Click in a cell
– Press F2
To save data– Select another record
– Press Shift|Enter
Use Undo Button or press Esc if you want to reverse the most recent changes (only)
BE CAREFUL: Access “saves as you go,” once you begin to edit another record, the previous record is saved and can’t be undone!

Adding, Deleting and Summarizing Records
Use the shortcut menu by rightclicking at the beginning of row/record or Home Ribbon|Records Group
Records get added at the bottom of the table
Deletion of records CANNOT BE UNDONE!
Get quick aggregates by using Totals button

Designing a Database
Determine your output requirements
Design your database on paper first
Divide information into separate fields
Divide information into separate tables
Identify each record with a unique code
Place important fields at top of structure
Test your database

Getting Started
OPTION 1: Use a TemplateUse a professionally designed database with the help of a Wizard or Template
OPTION 2: “Manual” MethodCreate a blank database and then create your own objects (beginning with a table)
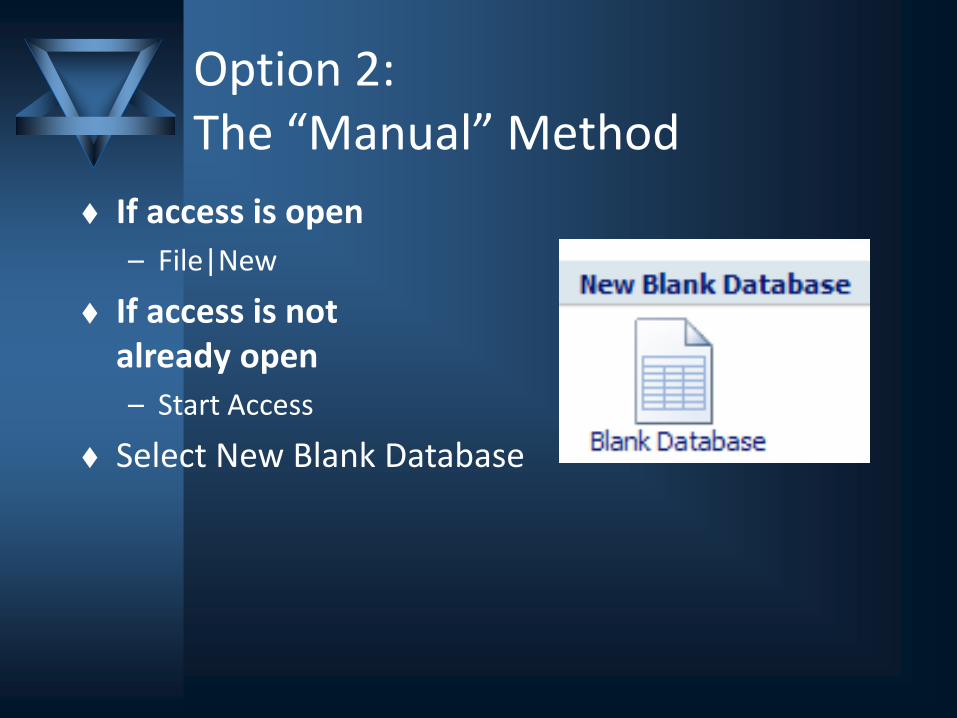
Option 2: The “Manual” Method
If access is open
– File|New
If access is not already open
– Start Access
Select New Blank Database

Creating a Table in Design View
Displays the specifications behind each field
Each row is information about an individual field– Field Name, type and comments (optional)
– Properties (“bells and whistles”, efficiency, accuracy, consistency)
Set primary keys
Switch back to datasheet view to enter records
Field nameand
data types
Field properties

Data Type Description
Text Alphanumeric data, up to 255 characters. Used for entering text and numbers that are not required for calculation, such as zip codes and phone numbers.
MemoAlphanumeric data, up to 65,535 characters. Used to store notes, comments, or lengthy descriptions.
Number Numeric data that are used to perform mathematical calculations.
Date/Time Dates and times.
CurrencyNumeric data with a leading dollar sign. Used to store and calculate monetary values up to four decimal places.
AutoNumberNumeric value that increments automatically. Used for assigning a unique value to a record, which makes it a fantastic primary key field.
Yes/No Logical or Boolean values for toggling (turning on and off) yes/no or true/false results.
OLE ObjectObject Linking and Embedding (OLE) field for storing objects (Excel worksheets and Word documents), graphics, or other binary data up to one gigabyte (GB) in size.
HyperlinkText or numbers stored as a hyperlink address. Used to store Web site addresses, also called URLs, such as http://www.advantageseries.com/.
Lookup WizardA link to another table or to a static list of values for inserting data into the current table. Selecting this option launches the Lookup Wizard.

Property Description
Field Size Define the maximum length of a text or numeric field.
FormatSpecify how text, numbers, dates, and times are displayed and printed.
Decimal PlacesSpecify the number of places to display to the right of the decimal; for numeric and currency fields only.
Input MaskSimplify data entry for fields that have a standard format, such as a phone number.
CaptionDefine a default field label to appear on forms and reports, instead of using the field name.
Default ValueDefine a value or expression that is automatically entered for each new record.
Validation RuleEnter an expression that defines the rules for entering data into the specified field.
Validation TextSpecify the text to display if you enter invalid data, according to the set rule, into a field.
RequiredSpecify whether a value is required in a field. Access displays an error message if you attempt to skip entering data into the field.
IndexedSpecify whether the table should be indexed on this field in order to speed searches.

Primary Keys and a little on relationships
In design view– Right Click field row
– Primary Key button
Determines the default sort order in which data is displayed in datasheet view
Unique identifier
Aids in creating relationships
Field cannot be empty (null) or a duplicate

Slide 16 of 26
Sorting Records
Default sort order = primary key Sort to better organize and present data Select a field and use the sort ascending or
descending buttons in the Home Ribbon (entire table does not need to be selected)
Multiple sorts: place columns in order from left to right and select both prior to sorting
New records (which are added to the bottom of the table) will re-sort into correct order when table is closed and saved
Save table design to save sort order

Slide 17 of 26
What is a Filter?
Finds and displays records in a table which meet a simple set of criterion
Records not meeting criterion are hidden
Used to quickly, temporarily find a set of information– Usually not saved; all records are shown once table is closed and
reopened or filter is removed
– Can be saved as a query using advanced methods
More than one filter can be applied to a table– “And” statement with right clicks
– Advanced methods allow for “or” statements

Filtering Methods
Home Ribbon|Sort & Filter Group
Right click in a field
– Depending on field type, different shortcut menus are displayed
– Use Advanced button if operator is not listed in shortcut menu
Remove filter(s) with Toggle Filter button

Slide 19 of 26
What is a Query?
A query is a question you ask of your database– How many customers live in Chicago?
– What is the average age of our employees?
There are two types of queries– Select queries retrieve table information
– Action queries modify table information
Results are displayed in a dynaset: a collection of fields from one or more tables
Queries can be used for forms and reports
Since data is retrieved from tables, if table data changes, the query is automatically updated and vice versa

Slide 20 of 26
Queries Versus Filters
Queries provide additional functionality
– Data can be displayed from multiple tables
– Field display can be controlled
– Calculations can be created and performed on field values
While filters are temporary, queries are saved as an object in the database
Create Ribbon|Other Group|Query Design

Using the Query Design Window
Displays table(s)on which you’vechosen to base
your query
Displays the grid that you use to specify your criteria and sorting options
Split can be moved
Select the tables and/or queries to be used (ctrl and shift keys work
for multiple selection)
Use the Show Table button to show listing again
The process:
1. Select the table(s)
2. Move fields down to the grid
3. Enter the criterion
4. Run the query
Slide 21 of 26

Query Grid Area
Creates a “query by example” area
Field: used to add a field to the grid
Table: used to indicate the field’s table
Sort: used to sort the resulting table
Show: used to hide or show the field in the resulting dynaset
Criteria: used to set the query criteria, multiple criteria placed on the criteria row means “and”
Or: used to specify additional “or” criterion
After creating query parameters, switch to datasheet view or click the Run button to see dynaset
Slide 22 of 26

Specifying a Search Criteria
Enter an example of values to be found in the Criteria row (and use OR row if necessary)
Criterion statements can used to limit records between a range of values or dates
– Wildcards: *, # and ?
– Comparison: = >, <, < >, >=, <=
– Logical: and, or, not
– Arithmetic: +, -, /, *
– Like (contains)
– Between X and Y (X and Y can be numbers or dates)
– In (replaces multiple OR statements)
– Is [not] null (empty)
Single or complex criterion can be used
Conditional logic is the method by which criteria statements are joined and executed in a query statement (using multiple tables and fields with “and” ”or” conditions)
General rule: AND reads across, OR reads down

Slide 24 of 26
Querying Multiple Tables and Creating Relationships
Tables can be related
for the purpose of sharing information
and reducing data redundancy and entry
Two tablesjoined
by a common field

The Purpose of Relationships
The goal should be to never have to enter data redundantly
Create relationships by joining fields from each table that contain the same type of data
Use of the primary key becomes evident– When tables are joined, Access must know exactly what record in
one table is being matched to a record in the related table (there cannot be more than one choice)
– A unique identifier (primary key, which prohibits duplicates) is the only way Access can be sure to match records correctly

Starting a Report
Options for creating a report from the Create Ribbon– Report wizard
– Report Button (AutoReport)
– Label wizard
– Report Design
Create the report using a wizard or AutoReport(not in design view)
Customize the report in design or layout view

Using the Report Wizard
1. Select table(s) or query(ies)– Tables show all records and
fields in the table– Queries show only records
and fields used in the query– If a relationship has been
created, more than one table or query can be used in the report
2. Select fields3. Grouping: rather than
displaying the same field in every record, it displays once with details following
4. Sort5. Choose layout6. Choose design7. Name and save

Report Button
Select a table or query, and click report button
Report uses all fields in the table or query
Layout is tabular
Completed report appears in Layout View
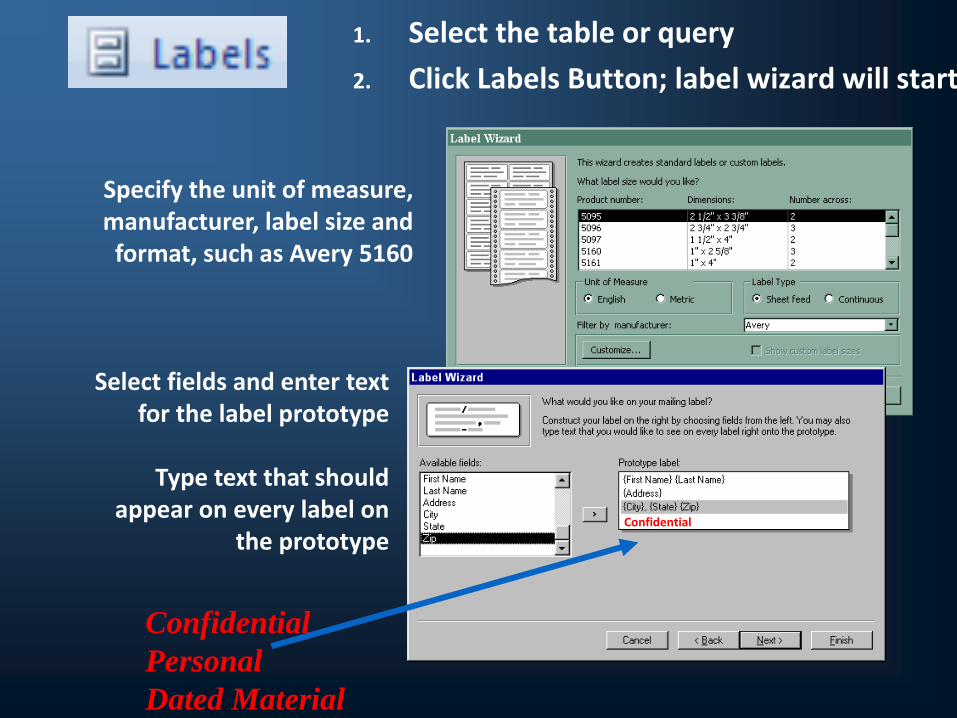
Specify the unit of measure, manufacturer, label size and
format, such as Avery 5160
Confidential
1. Select the table or query
2. Click Labels Button; label wizard will start
Confidential
Personal
Dated Material
Select fields and enter text for the label prototype
Type text that should appear on every label on
the prototype

Reports: Print Preview Use the Print Preview Ribbon to modify page layout and display multiple pages
Navigate through pages using page navigation arrow in lower right corner
Page Navigation

Reports: Layout View
Provides a preview of report using sample data– Not an exact preview
– Use Print Preview to see exact preview
Can modify most aspects of report design using Format and Arrange Ribbons– Font, alignment, borders,
colors
– Sorting
– Adding/removing fields
– Control size

Reports: Design View
Report Header
Page Header
Detail (Body)
Page Footer
Report Footer
Unbound Control
Bound ControlCalculated Control
Reports consist of different sections and controls
All sections and controls can be moved and resized in design view

Report Controls
A bound control is one whose source of data is a field in a table or query
An unbound control does not have a source of data, examples are a title/label or image
A calculated control is used to create expressions for calculations
Use Right Click|Properties|Data tab to see a control’s status
– A bound control will list the field that it is bound to
– An unbound control will display nothing in the Data tab
– A calculated field will show the expression
Add text with label button (Aa),calculation with text box (ab|) button and customize image placement, all in Design Ribbon

Report Views Summary: From the Home Ribbon
Report View– Allows copying of data
– Filters can be applied (temporarily)
Print Preview– Displays data as it will be printed
– Changes can only be applied to page layout
Layout View– Almost all formatting and design changes can be applied in this
view
Design View– Provides access to ALL formatting and design changes that are
available