
![Welcome [tc18.tableau.com]...Sp. Atk 45 Lead initiatives with data insights Sp. Def 46 Rapid emergency analysis for leadership Equipment Tableau Desktop High powered analytics tools](https://static.fdocuments.in/doc/165x107/5ec9e058c12a362c9a0f912c/welcome-tc18-sp-atk-45-lead-initiatives-with-data-insights-sp-def-46-rapid.jpg)
Basic Stats with Tableau - tc18.tableau.com · Basic Stats with Tableau Tyler Martin Senior...
29
Transcript of Basic Stats with Tableau - tc18.tableau.com · Basic Stats with Tableau Tyler Martin Senior...

Basic Stats with Tableau
Tyler Martin
Senior Software Engineer
Tableau Software
# T C 1 8

Agenda
• Confidence intervals
• Hypothesis testing
• Trend lines
• Forecasting
• Q&A
Confidence Intervals


Confidence Interval: Definition
DefinitionFor 95% of samples, the confidence interval will contain the population average
For a particular sampleThere is an 95% chance that the confidence interval contains the population average

Confidence Intervals Answer Questions Like…
What does my sample of mile-run times tell me about the average 2nd grader in Seattle?
Is the average 2nd grader in Seattle likely to run a faster mile than me?

Hypothesis Testing


Hypothesis Testing: Test Statistic
A value calculated from your data
This value always follows the same distribution, regardless of the distribution of your data*
Hypothesis Testing: Procedure
1. State the hypothesis and the null hypothesis
2. Choose an appropriate test statisticThis usually follows a well-known distribution
3. Choose a threshold probabilityUsually small, we will use 0.005 (0.5%)

Hypothesis Testing: Procedure (continued)
4. Calculate the p-valueThe probability under the null hypothesis of sampling a test statisticat least as extreme as what we observed.
5. Accept or reject the hypothesisAccept: p < 0.005
Reject: p > 0.005
Student’s t-test
Test statistic follows Student’s t-distribution
We will use a two-sample location test
Tests the null hypothesis that the means of two populations are equal

Hypothesis Testing Can Answer Questions Like…
Are CrossFit Games athletes stronger on average in 2018 than they were in 2007? (t-test)
Are observations of two groups independent of one another? (Chi-squared test)
Is my sample drawn from a normally distributed population? (Shapiro-Wilk test)
Trend Lines


Trend Lines: Null Hypothesis
What if there is no relationship?

Trend Lines: Residuals
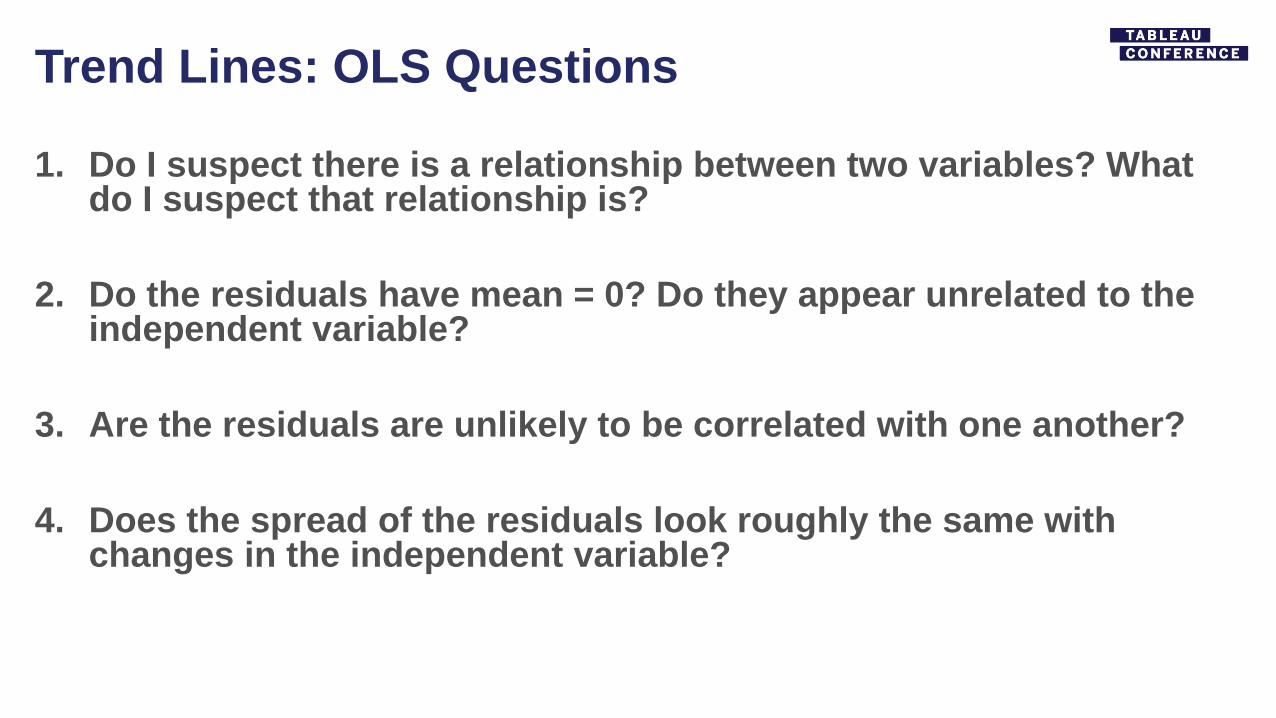
Trend Lines: OLS Questions
1. Do I suspect there is a relationship between two variables? What do I suspect that relationship is?
2. Do the residuals have mean = 0? Do they appear unrelated to the independent variable?
3. Are the residuals are unlikely to be correlated with one another?
4. Does the spread of the residuals look roughly the same with changes in the independent variable?

Trend Lines Answer Questions Like…
What is the relationship between profit and CEO compensation?
When wind speed changes, how does windmill power output change?
Does compensation change in a meaningful way when age changes?

Forecasting

Forecasting: Model Quality
We will consider only Mean Absolute Scaled Error (MASE)
MASE compares the error of your model with the error of the naïve forecast
MASE is typically between 0 (good) and 1 (bad)

Forecasting: Naïve Forecast
Forecast values copied from the last observed value.
For seasonal forecasts, values are copied from the last observed season.

Forecasting: Unexpected and Poor Forecast
1. Does it look like there is a structural break in my data?
2. Is there a lot of short-scale variation at the current date level?

Forecasts Answer Questions Like…
How many visitors to my page can I expect in the future, given data on past visits?
Based on past data, what will my inventory be in the future?
How is the value of my collection likely to change in the future?
Questions

Please complete the
session survey from the
Session Details screen
in your TC18 app
![Calc Me Maybe - tc18.tableau.com · • Parameters [Parameters].Parameter] in [PURPLE] and are [CaSe SeNsAtIvE] ... • Simple Tableau Calculations do not need Compute Using • Run](https://static.fdocuments.in/doc/165x107/5e71204f48b6a90acd1b8323/calc-me-maybe-tc18-a-parameters-parametersparameter-in-purple-and-are.jpg)
![Welcome [tc18.tableau.com]...I Got 99 Problems and Governance Ain’tOne Non-Technical Users Getting Wins with Data Word Spread Quickly FOMO and Creating Demand for Tableau Making](https://static.fdocuments.in/doc/165x107/5f0949327e708231d42618f3/welcome-tc18-i-got-99-problems-and-governance-ainatone-non-technical-users.jpg)
![Welcome [tc18.tableau.com] · Embedding Tableau for self-service data science Blair Hutchinson Senior Product Consultant Tableau #TC18 Santiago Sanchez Solutions Consultant Tableau.](https://static.fdocuments.in/doc/165x107/5f0776407e708231d41d19c5/welcome-tc18-embedding-tableau-for-self-service-data-science-blair-hutchinson.jpg)
![Welcome [tc18.tableau.com] · Data Security DATABASE USER & SERVICE ACCOUNT | CONTENT PERMISSIONS | TDE BINARY Network Security CLIENT-SERVER SSL | DATABASE DRIVERS | STRINGENT TRUST](https://static.fdocuments.in/doc/165x107/5f4309ee9af6a64eeb33202d/welcome-tc18-data-security-database-user-service-account-content-permissions.jpg)
![Welcome [tc18.tableau.com] · 2020-01-06 · Tableau / Customer Consulting. My Office Photo Used with permission. Agenda 1) Tableau Platform 2) Data Connectivity API’s • Web Data](https://static.fdocuments.in/doc/165x107/5ec557a013b08355f20a9f7a/welcome-tc18-2020-01-06-tableau-customer-consulting-my-office-photo-used.jpg)
![Welcome [tc18.tableau.com] · Tableau Server / Online • Web-based access to interactive dashboards • Collaboration features (limited) • Download dashboards as images/PDF •](https://static.fdocuments.in/doc/165x107/5ec552f600acf0544c22bcae/welcome-tc18-tableau-server-online-a-web-based-access-to-interactive-dashboards.jpg)
![Welcome [tc18.tableau.com] · 2020-01-06 · JavaScript PostScript Computer regex HTML Tableau calcs Domain Specific. Why a language? ... visual spec layout columns rows pages view](https://static.fdocuments.in/doc/165x107/5ed15b7aea109a30bc7f8420/welcome-tc18-2020-01-06-javascript-postscript-computer-regex-html-tableau.jpg)
![Welcome [tc18.tableau.com]...• Involve your web team early on • Don’t leave mobile design as an afterthought Tableau tips • Style your Story Points to fit design • Automatic/range](https://static.fdocuments.in/doc/165x107/5f13a5c6c2c6d2356f1cd782/welcome-tc18-a-involve-your-web-team-early-on-a-donat-leave-mobile.jpg)
![Welcome [tc18.tableau.com] · Operationalizing and Scaling Tableau Prep. American Culture. What is Culture The social behavior and norms found in human societies It tells us how we](https://static.fdocuments.in/doc/165x107/602d415ff30df8531f3476b5/welcome-tc18-operationalizing-and-scaling-tableau-prep-american-culture-what.jpg)

![Welcome [tc18.tableau.com] · “My goal is to increase the adoption of Tableau in my organisation” – ... Questions? EXTENSIONS RELATED SESSIONS Extending Tableau Front and Back](https://static.fdocuments.in/doc/165x107/5f97a75e0b05282f19100eb1/welcome-tc18-aoemy-goal-is-to-increase-the-adoption-of-tableau-in-my-organisationa.jpg)
![Welcome [tc18.tableau.com]...Strategic Customer Success Manager Tableau. ... other group chat platform •Monthly newsletters with tips and tricks, events, resources, and sharing of](https://static.fdocuments.in/doc/165x107/5f519c660eb6cb08b030e5dc/welcome-tc18-strategic-customer-success-manager-tableau-other-group.jpg)


![Welcome [tc18.tableau.com] · Tableau Platform Integrations Enabling Integrations for Developers. Developer Deep Dive: Dashboard Extensions #TC18 John Dance Principal Software Engineer](https://static.fdocuments.in/doc/165x107/5fa199c2ac34143b452ee027/welcome-tc18-tableau-platform-integrations-enabling-integrations-for-developers.jpg)
![Welcome [tc18.tableau.com] · Implementing Tableau Server security RELATED SESSIONS Oct 23 | 10:45am –11:45am | MCCNO - L3 - 338 Introducing Tableau Services Manager Oct 23 | 2:15pm](https://static.fdocuments.in/doc/165x107/5f69a1aa6750cf049438789a/welcome-tc18-implementing-tableau-server-security-related-sessions-oct-23-.jpg)
![Welcome [tc18.tableau.com] · Automation Extensions Embedded Analytics Data Connectivity Data Science Tableau Platform ... Time to market Self-service ... Trusted Authentication Deep-Dive](https://static.fdocuments.in/doc/165x107/5f34bb0d19b5e203ac4e875d/welcome-tc18-automation-extensions-embedded-analytics-data-connectivity-data.jpg)
![Welcome [tc18.tableau.com] › sites › default › files › session › assets › 18B… · How Tableau Services can take your Tableau Implementation to Next Level #TC18 Rithesh](https://static.fdocuments.in/doc/165x107/5f0432db7e708231d40cccec/welcome-tc18-a-sites-a-default-a-files-a-session-a-assets-a-18b.jpg)
![Welcome [tc18.tableau.com] · + mapbox 0 00 ableau 'conference" ableau 'conference" ableau 'conference" tableau conference . o poli tableau conference . ableau 'conference" tableau](https://static.fdocuments.in/doc/165x107/603c384c36ee9629d81b13a8/welcome-tc18-mapbox-0-00-ableau-conference-ableau-conference.jpg)