Basic Polymer identification and DSC and TGA analysis
18
Name :- Vatsal K. Kapadia Branch :- Plastic Engineering Roll No. :- 1150011 Internship at :- Larsen & Toubro Department :- Polymer Testing ( SDDC )
-
Upload
vatsal-kapadia -
Category
Engineering
-
view
39 -
download
5
Transcript of Basic Polymer identification and DSC and TGA analysis

Name :- Vatsal K. KapadiaBranch :- Plastic EngineeringRoll No. :- 1150011Internship at :- Larsen & Toubro Department :- Polymer Testing ( SDDC )

What is the material of this component ?
What is the material used by the competition ?
Is the vendor using the appropriate material ?
Which material can replace the current material for the betterment of the product ?
What is the composition in the material ? Is this a new material ?

Plastic Identification In General
Plastic Material
Press a hot rod (500 F) against the sample
Thermoplastics
Thermosets
(If softens)
Drop a small sample in water
Burn a small corner of the sample
Floats Sinks
Self
-
Extin
guish
ing
Continues to
burn
Materials:-1. Melamine Formaldehyde2. PhenolFormaldehyde3. UreaFormaldehyde
Materials:-1. Polyester2. Silicon3. Epoxy
Materials:- Polyethylene and Polypropylene
All other materials
Burn a small corner of the sample
No Flames Continues to Burn
Self Extinguishing
Materials :- PTFE, PVF, CTFE, FEP
Materials:- Drips- Acetal, ABS, Acrylics, Cellulose Acetate, PS etc. No Dripping:- Cellulose Nitrate, Polyurethane
Materials:- Drips-Nylon, Polysulfone, Polycarbonate No Dripping- PPS ,PVC

Elastomers
Drop a small sample in water
Materials:- TPV, TPO
Float
s
Sinks
Burn a small corner of the sample
Self
- Ext
ingu
ishi
ngMaterial:- Silicon
Materials:-Urethane,Polyester etc

Density of the Polymer(The Archimedean Principle)
Density of a substance is mass per unit volume. The symbol ρ (rho) is used to determine density
Unit:- g/cc

Significance of Density• The specific gravity or density of a solid is a property
that can be measured conveniently to identify a material
• To allow physical change in a sample• To indicate degree of uniformity among different
sampling units• Change in density of a single specimen may be due to
hangs in Crystallinity, loss of plasticizer absorption of solvent, or to other causes addition of Glass Fibers and Flame Retardents.
• Portions of a sample may differ in density because of difference in Crystallinity, thermal history, porosity, and composition (types or proportions of resin, plasticizer, pigment or filler).
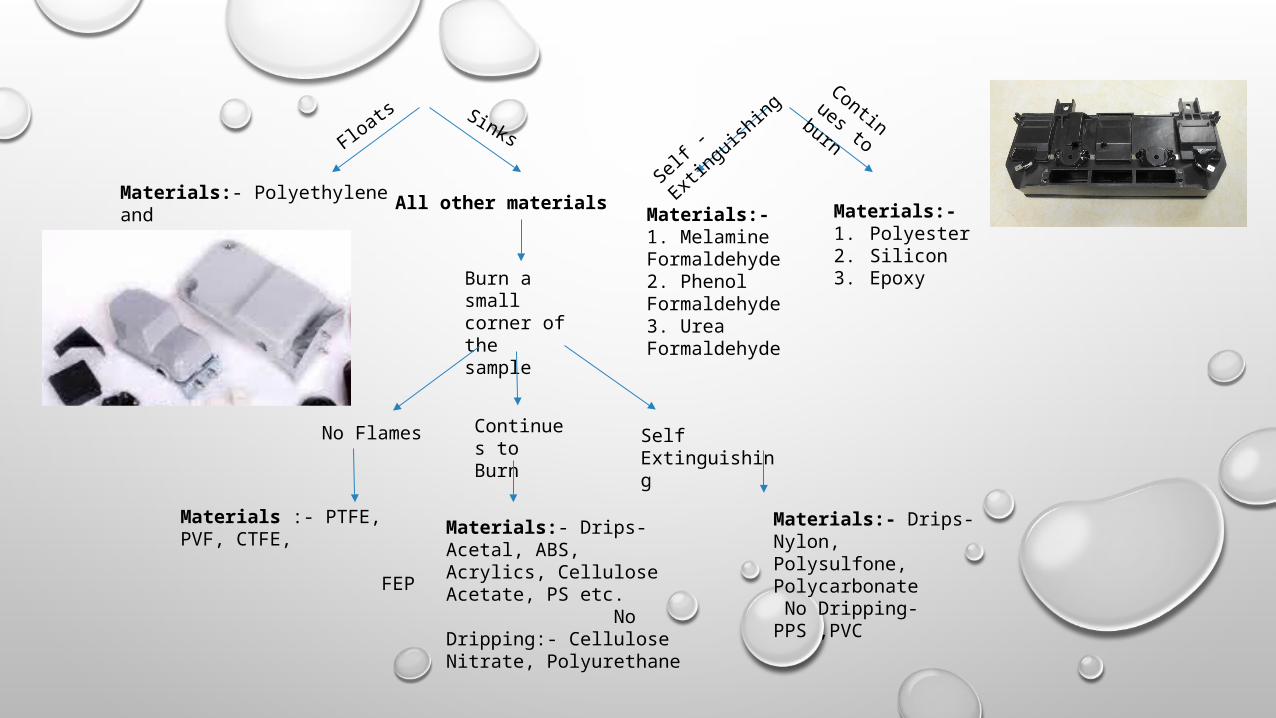
MATERIAL DENSITY (g/cm3)ABS 1.06
ACETAL 1.43PMMA 1.19
NYLON 6 30% GF 1.35NYLON UNFILLED 1.12POLYCARBONATE 1.2
POLYSTYRENE 1.07PVC (Flexible) 1.25
PTFE 2.0HDPE 0.96LDPE 0.94
PP 0.92SMC 25% GF 1.753DMC 15% GF 1.814
Density of some Useful Polymers
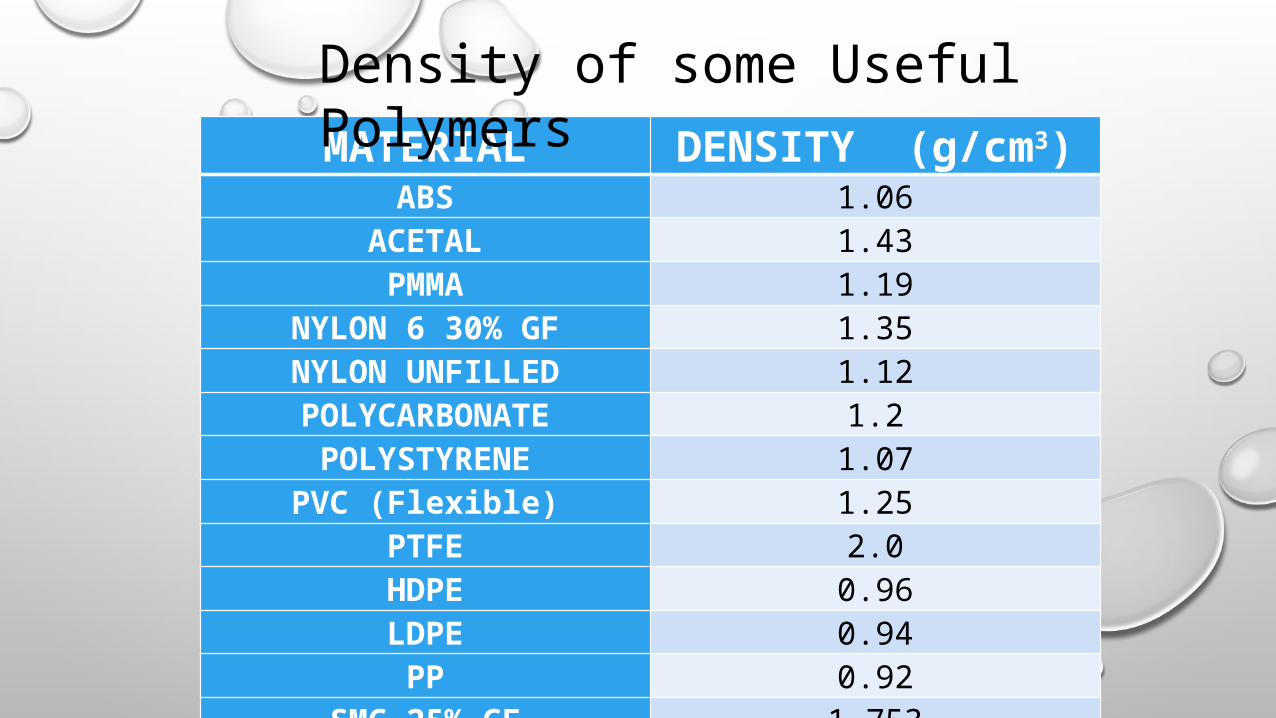
Thermal Analysis
Thermal analysis is a branch of materials science where the properties of materials are studied as they change with temperature. Several methods are commonly used – these are distinguished from one another by the property which is measured

Thermal Analysis Techniques

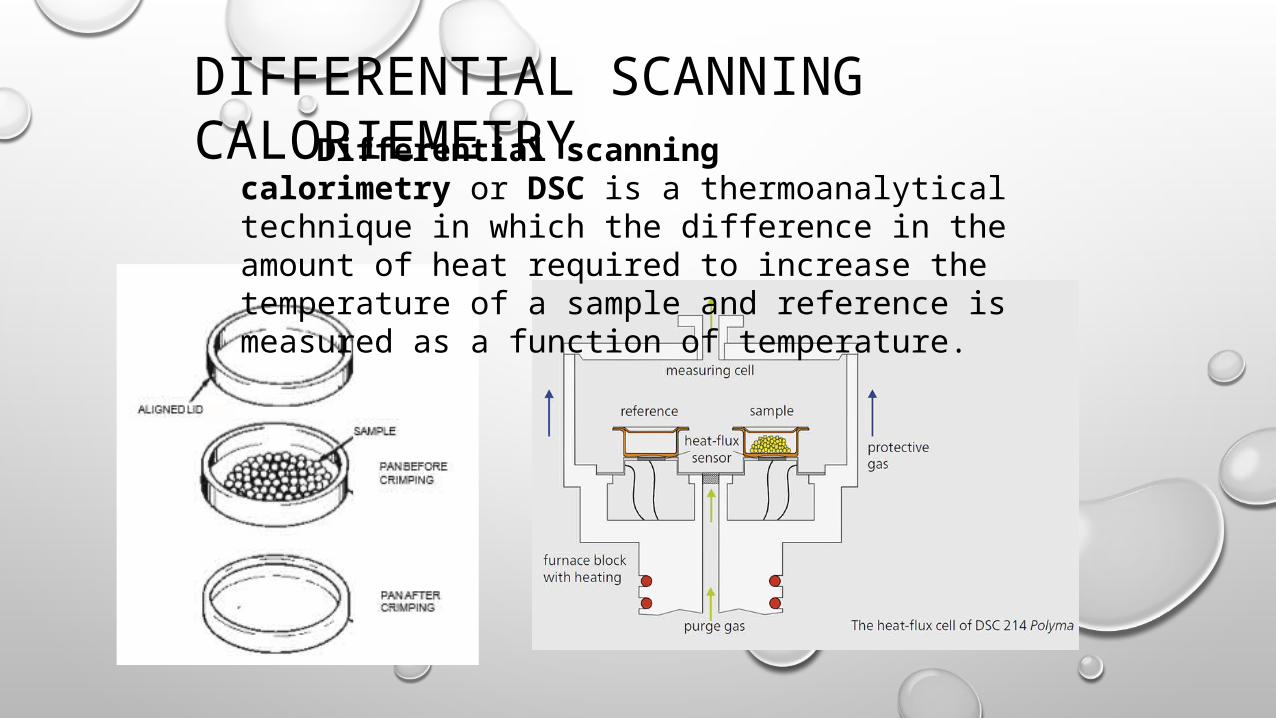
DIFFERENTIAL SCANNING CALORIEMETRY
Differential scanning calorimetry or DSC is a thermoanalytical technique in which the difference in the amount of heat required to increase the temperature of a sample and reference is measured as a function of temperature.
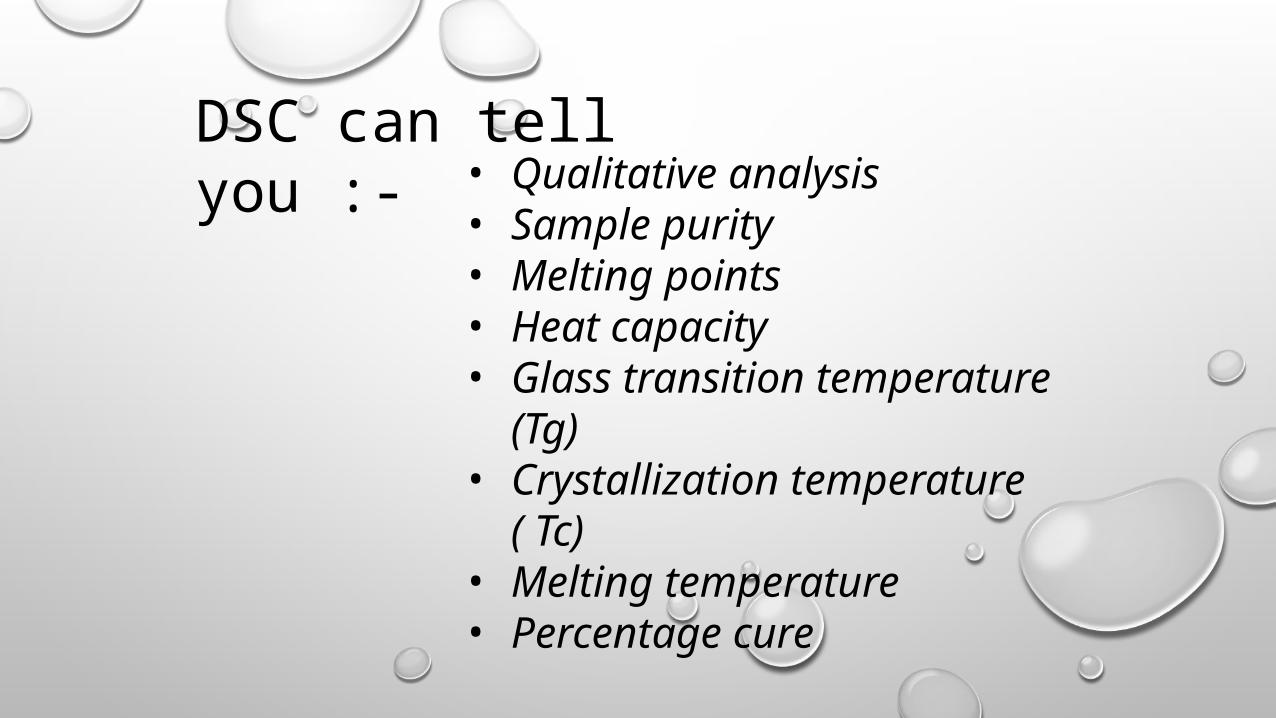
DSC can tell you :-• Qualitative analysis• Sample purity• Melting points• Heat capacity• Glass transition
temperature (Tg)• Crystallization
temperature ( Tc)• Melting temperature• Percentage cure
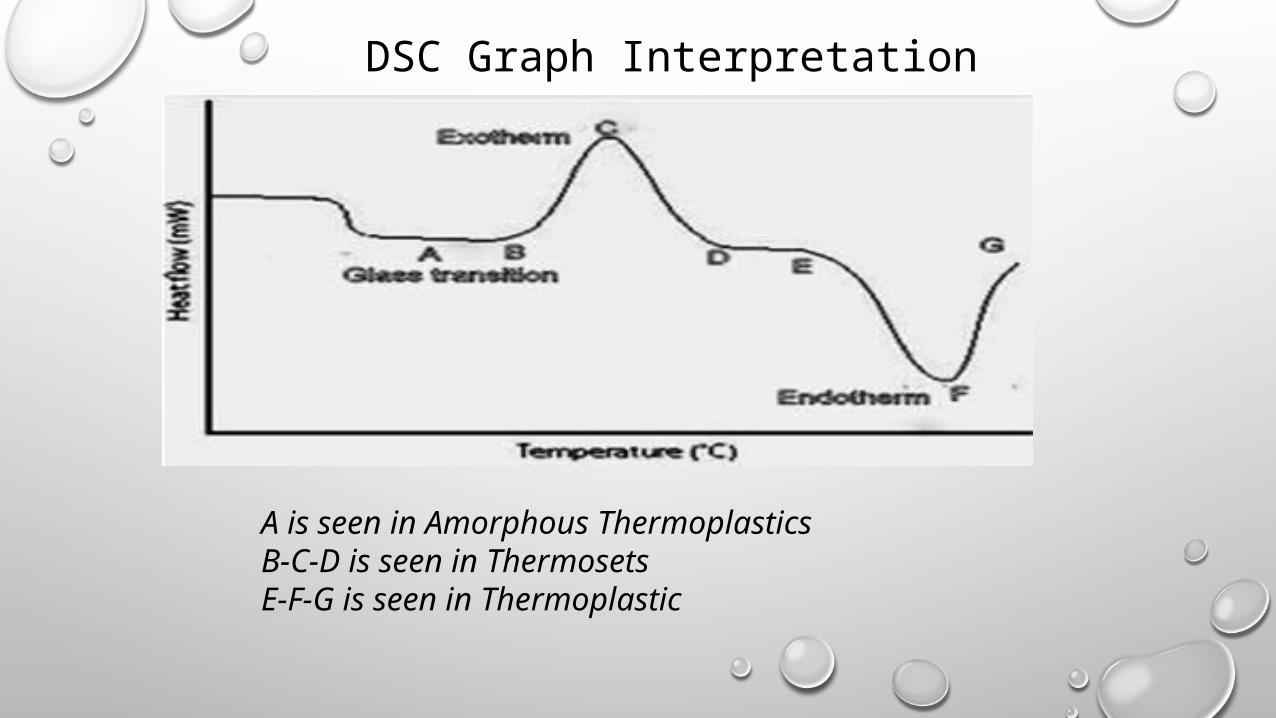
DSC Graph Interpretation
A is seen in Amorphous ThermoplasticsB-C-D is seen in ThermosetsE-F-G is seen in Thermoplastic

Materials Onset Temp. Melting point End point Meltng Energy
Unfilled Nylon 66 non FR
242 ˚C 266˚C 287˚C 80.09 J/g
30% GF FR nylon 6
189˚C 225˚C 249˚C 56J/g
30% GF FR nylon 66
227˚C 260˚C 277˚C 39.15J/g
30% GF FR PBT 208˚C 224˚C 252˚C 33.95J/g
DSC results of some materials:-

THERMOGRAVIMETRIC ANALYSIS
Thermogravimetric Analysis (TGA) measures the amount and rate of change in the weight of a material as a function of temperature or time in a controlled atmosphere.

TGA will tell you:-
• Physical changes in materials.
• Compositional analysis of multi-component materials or blends
• Filler content of materials
• Glass % in the material• Moisture and volatiles
content

DSC Graph Interpretation
Plateau: It is the segment AB of the curve where the weight of the sample remains unchanged. Initial Temperature: It is the temperature (at point B) at which change in a sample weight reaches a magnitude detectable by the thermobalance. Final Temperature: It is the temperature (at point C) at which the change in sample weight reaches its maximum. Reaction Interval: It is the temperature difference between the beginning and the end weight of the sample i.e. section of the curve between points B and C.


![Supporting Information ]furan-4,9-diones and their ... Differential scanning calorimetry (DSC) and thermal gravimetric analysis (TGA) of Sorbitol:MetHCl (4:1) ... (solid) spectra for](https://static.fdocuments.in/doc/165x107/5b40a55e7f8b9aff118d7e96/supporting-information-furan-49-diones-and-their-differential-scanning-calorimetry.jpg)